DV: Liking Cartoon Comedy
|
|
|
- Derek Henry
- 6 years ago
- Views:
Transcription
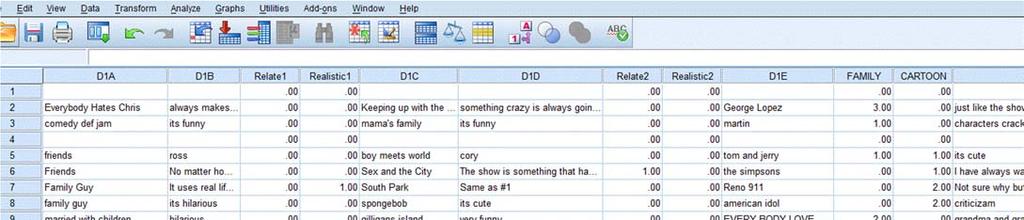
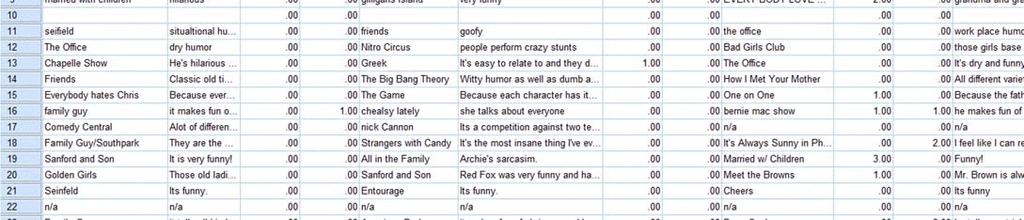
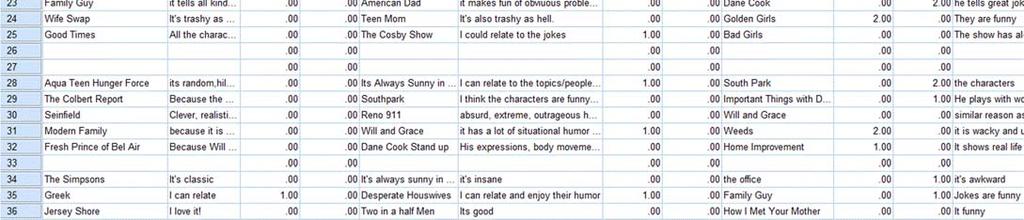
1 1 Stepwise Multiple Regression Model Rikki Price Com 631/731 March 24, 2016 I. MODEL Block 1 Block 2 DV: Liking Cartoon Comedy 2 Block Stepwise Block 1 = Demographics: Item: Age (G2) Item: Political Philosophy (G4) Dummied item: Nonwhite Dummied item: Female Block 2 = Senses of Humor Scale: Disparagement (a sum of C7, C21, C30, C46) Scale: Dark Humor (a sum of C12, C41, C50, C53) Scale: Incongruity (a sum of C10, C32, C38, C47) Scale: Social Currency (a sum of C64, C65, C66, C67) DV: CARTOON (Liking of Cartoons) Will perform a second regression with the DV: NO CARTOON (cartoons are not funny) The Humor and Public Opinion Survey asked a series of open ended questions. We will be looking at D1 which asks What are you favorite TV comedy programs of all time and why as well as D2 which asks are there any TV comedy shows that you have simply found NOT funny, for every cartoon listed for D1 and D2, 0, 1, 2, or 3 were input to refer to how many were listed as their top three listed as favorite or not funny.
2 2
 Method : select Stepwise")
3 3 Running the Stepwise Regression Analyze Regression Linear Add your DV where it says Dependent: Independents: Enter Block 1 info here (demographics) Method : select Stepwise Hit Next
 Method : select")


4 4 Independents: Enter Block 2 info here (senses of humor) Method : select Stepwise Click the Statistics button on the bottom. Make sure that Estimate, Model fit, R squared change, Descriptives, and Collinearity diagnostics are checked.
 Add")


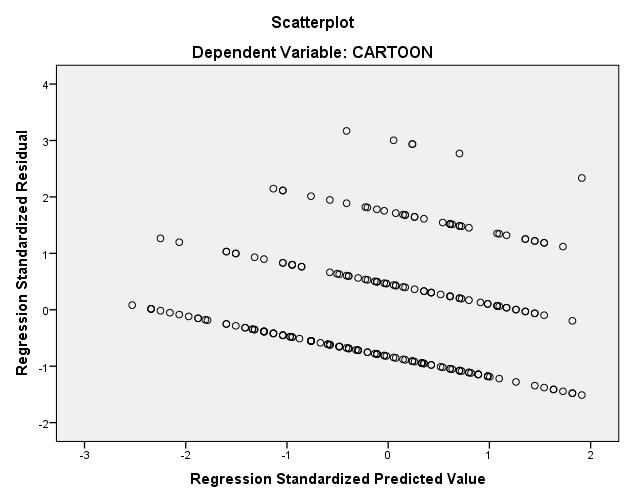
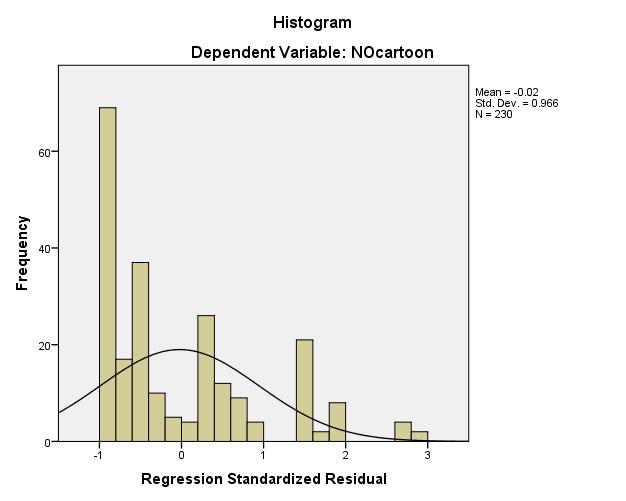
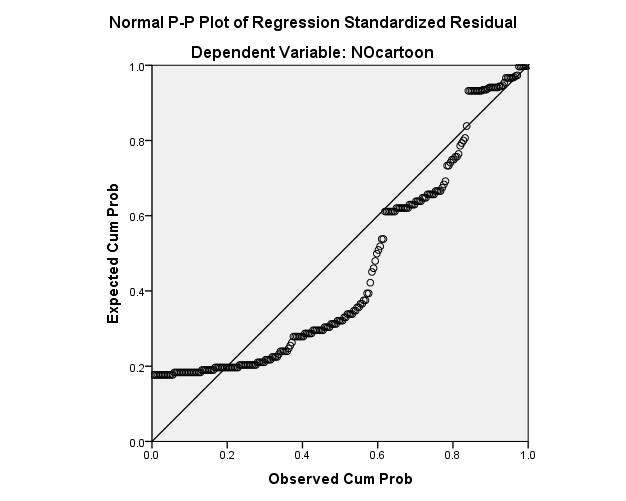
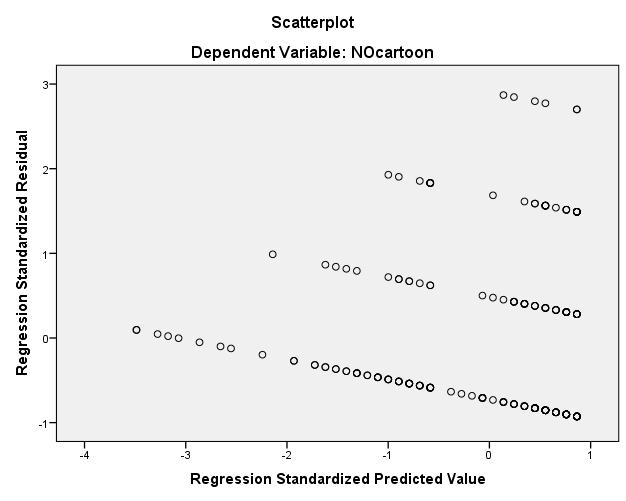
5 5 Select Plots (next to statistics) Add *ZRESID as the Y, and *ZPRED as the X Check the Histogram box under Standardized Residual Plots Select Continue Then hit Paste


6 6 Highlight the text in your syntax and then hit Run (green triangle) SPSS Output: Descriptive Statistics Mean Std. Deviation N CARTOON G2. What is your age? G4. Which of the following categories best describes your political philosophy? Nonwhite Female COMPUTE Disparagement= C7 + C21 + C30 + C COMPUTE DarkHumor=C12 + C C50 + C53 COMPUTE Incongruity=C10 + C32 + C38 + C COMPUTE SocialCurrency=C64 + C65 + C66 + C Please note that the total sample size here is 188 out of 288 people total. This could be due to the fact that we are missing 80 people s answers for political philosophy (item G4).
7 7
8 8 Variables Entered/Removed a Variables Variables Model Entered Removed Method 1 2 Female. COMPUTE Disparagement. = C7 + C21 + C30 + C46 Stepwise (Criteria: Probability-of-Fto-enter <=.050, Probability-of-Fto-remove >=.100). Stepwise (Criteria: Probability-of-Fto-enter <=.050, Probability-of-Fto-remove >=.100). a. Dependent Variable: CARTOON ANOVA a
9 9 Model Sum of Squares df Mean Square F Sig. 1 Regression b Residual Total Regression c Significant models noted here! Residual Total a. Dependent Variable: CARTOON b. Predictors: (Constant), Female c. Predictors: (Constant), Female, COMPUTE Disparagement= C7 + C21 + C30 + C46
10 10 Collinearity Diagnostics a Variance Proportions COMPUTE Disparagement = C7 + C21 + Model Dimension Eigenvalue Condition Index (Constant) Female C30 + C a. Dependent Variable: CARTOON

11 11 Residuals Statistics a Minimum Maximum Mean Std. Deviation N Predicted Value Residual Std. Predicted Value Std. Residual a. Dependent Variable: CARTOON
12 12
13 13


14 Second Regression Analysis: Just change Dependent Variable to: NoCartoon 14
 or OK to run.")
15 Run Same Stats and Plots as before, then click Paste (to save syntax) or OK to run. 15
16 16 Descriptive Statistics Mean Std. Deviation N NOcartoon G2. What is your age? G4. Which of the following categories best describes your political philosophy? Nonwhite Female COMPUTE Disparagement= C7 + C21 + C30 + C COMPUTE DarkHumor=C12 + C C50 + C53 COMPUTE Incongruity=C10 + C32 + C38 + C COMPUTE SocialCurrency=C64 + C65 + C66 + C Note that we lost one more participant in this model.
17 17
18 18 Variables Entered/Removed a Variables Variables Model Entered Removed Method 1 2 Nonwhite. G2. What is. your age? Stepwise (Criteria: Probability-of-Fto-enter <=.050, Probability-of-Fto-remove >=.100). Stepwise (Criteria: Probability-of-Fto-enter <=.050, Probability-of-Fto-remove >=.100). a. Dependent Variable: NOcartoon
19 19 ANOVA a Model Sum of Squares df Mean Square F Sig. 1 Regression b Residual Total Regression c Residual Total a. Dependent Variable: NOcartoon b. Predictors: (Constant), Nonwhite c. Predictors: (Constant), Nonwhite, G2. What is your age?
20 Collinearity Diagnostics a 20
21 21 Variance Proportions G2. What is Model Dimension Eigenvalue Condition Index (Constant) Nonwhite your age? a. Dependent Variable: NOcartoon Residuals Statistics a Minimum Maximum Mean Std. Deviation N Predicted Value Residual Std. Predicted Value Std. Residual a. Dependent Variable: NOcartoon
22 22
23 23
24 24
25 25 Table 1 Summary of Stepwise Regression Model Predicting Liking of Cartoons Step # Predictor Variable r Final Beta R 2 Change 1 Female.204**.139 a.041** 2 Disparagement.312***.279***.074*** Total Equation: R 2 =.115 Adjusted R 2 =.106 F (2, 185) = , p <.001 Note: p <.10 a, p <.05*, p <.01**, p <.001*** Table 2 Summary of Stepwise Regression Model Predicting Cartoons are Not Funny Step # Predictor Variable r Final Beta R 2 Change 1 Nonwhite.179**.149*.032* 2 Age.178**.148*.021* Total Equation: R 2 =.053, Adjusted R 2 =.043 F (2, 184) = 5.139, p <.01 Note: p <.10 a, p <.05*, p <.01**, p <.001***
26 Research Question One asked what proportion of the variance in liking of cartoons was accounted for by a regression model including demographics such as age, sex, race, and political philosophy as well as Neuendorf s senses of humor scales as predictors. The linear combination of female and disparagement accounted for approximately 11% of the variance in participants liking of cartoons, R 2 =.115, adjusted R 2 =.106, F (2, 185) = 12.05, p <.001. Both female and disparagement humor explained a statistically significant amount of unique variance in liking of cartoons, R 2 =.04, F (1, 186) = 8.05, p <.01 for female, and R 2 =.07, F (1,185) = 15.44, p <.001 for disparagement (when controlling for female), respectively. Female explained 4% of the variance in cartoon liking, and disparagement humor explained 7% of the variance in cartoon liking beyond that accounted for by female. Holding disparagement constant, for every one standard unit increase in female, the predicted cartoon liking score decreased by.14 standard units, = -.14, p <.05. Holding female constant, for every one standard unit increase in disparagement humor, the predicted cartoon liking score increased by.28 standard units, =.279, p <.001. Interpreting these results, I have found that participants in this survey who listed liking cartoons as one of their favorite TV comedies can be predicted by being male and by liking disparagement humor. Research Question Two asked what proportion of the variance in not finding cartoons as funny was accounted for by a regression model including demographics such as age, sex, race, and political philosophy as well as Neuendorf s senses of humor scales as predictors. The linear combination of nonwhite and age accounted for approximately 4% of the variance in participants not finding cartoons funny, R 2 =.05, adjusted R 2 =.04, F (2, 184) = 5.14, p <.01. Both nonwhite and age explained a statistically significant amount of unique variance in finding cartoons not funny, R 2 =.03, F (1, 185) = 6.10, p <.05 for nonwhite, and R 2 =.02, F (1,184) = 4.08, p <.05, for age when controlling for nonwhite. Nonwhite explained 3% of the variance in not finding cartoons funny, and age explained 2% of the variance in not finding cartoons funny beyond that accounted for by nonwhite. Holding age constant, for every one standard unit increase in nonwhite, the predicted not finding cartoons funny score decreased by.15 standard units, = -.149, p <.05. Holding nonwhite constant, for every one standard unit increase in age, the predicted not finding cartoons funny score decreased by.15 standard units, = -.148, p <.05. Interpreting these results, finding cartoons as not funny can be predicted by being white and younger in age. 26
TWO-FACTOR ANOVA Kim Neuendorf 4/9/18 COM 631/731 I. MODEL
 1 TWO-FACTOR ANOVA Kim Neuendorf 4/9/18 COM 631/731 I. MODEL Using the Humor and Public Opinion Data, a two-factor ANOVA was run, using the full factorial model: MAIN EFFECT: Political Philosophy (3 groups)
Discriminant Analysis. DFs
 Discriminant Analysis Chichang Xiong Kelly Kinahan COM 631 March 27, 2013 I. Model Using the Humor and Public Opinion Data Set (Neuendorf & Skalski, 2010) IVs: C44 reverse coded C17 C22 C23 C27 reverse
1. Model. Discriminant Analysis COM 631. Spring Devin Kelly. Dataset: Film and TV Usage National Survey 2015 (Jeffres & Neuendorf) Q23a. Q23b.
 Q23a. Q23b.") 1 Discriminant Analysis COM 631 Spring 2016 Devin Kelly 1. Model Dataset: Film and TV Usage National Survey 2015 (Jeffres & Neuendorf) Q23a. Q23b. Q23c. DF1 Q23d. Q23e. Q23f. Q23g. Q23h. DF2 DF3 CultClass
1 Discriminant Analysis COM 631 Spring 2016 Devin Kelly 1. Model Dataset: Film and TV Usage National Survey 2015 (Jeffres & Neuendorf) Q23a. Q23b. Q23c. DF1 Q23d. Q23e. Q23f. Q23g. Q23h. DF2 DF3 CultClass
MANOVA COM 631/731 Spring 2017 M. DANIELS. From Jeffres & Neuendorf (2015) Film and TV Usage National Survey
 Film and TV Usage National Survey") 1 MANOVA COM 631/731 Spring 2017 M. DANIELS I. MODEL From Jeffres & Neuendorf (2015) Film and TV Usage National Survey INDEPENDENT VARIABLES DEPENDENT VARIABLES X1: GENDER Q23a. I often watch a favorite
1 MANOVA COM 631/731 Spring 2017 M. DANIELS I. MODEL From Jeffres & Neuendorf (2015) Film and TV Usage National Survey INDEPENDENT VARIABLES DEPENDENT VARIABLES X1: GENDER Q23a. I often watch a favorite
I. Model. Q29a. I love the options at my fingertips today, watching videos on my phone, texting, and streaming films. Main Effect X1: Gender
 1 Hopewell, Sonoyta & Walker, Krista COM 631/731 Multivariate Statistical Methods Dr. Kim Neuendorf Film & TV National Survey dataset (2014) by Jeffres & Neuendorf MANOVA Class Presentation I. Model INDEPENDENT
More About Regression
 Regression Line for the Sample Chapter 14 More About Regression is spoken as y-hat, and it is also referred to either as predicted y or estimated y. b 0 is the intercept of the straight line. The intercept
Bootstrap Methods in Regression Questions Have you had a chance to try any of this? Any of the review questions?
 ICPSR Blalock Lectures, 2003 Bootstrap Resampling Robert Stine Lecture 3 Bootstrap Methods in Regression Questions Have you had a chance to try any of this? Any of the review questions? Getting class notes
SECTION I. THE MODEL. Discriminant Analysis Presentation~ REVISION Marcy Saxton and Jenn Stoneking DF1 DF2 DF3
 Discriminant Analysis Presentation~ REVISION Marcy Saxton and Jenn Stoneking COM 631/731--Multivariate Statistical Methods Instructor: Prof. Kim Neuendorf (k.neuendorf@csuohio.edu) Cleveland State University,
MANOVA/MANCOVA Paul and Kaila
 I. Model MANOVA/MANCOVA Paul and Kaila From the Music and Film Experiment (Neuendorf et al.) Covariates (ONLY IN MANCOVA) X1 Music Condition Y1 E20 Contempt Y2 E21 Anticipation X2 Instrument Interaction
Chapter 27. Inferences for Regression. Remembering Regression. An Example: Body Fat and Waist Size. Remembering Regression (cont.)
") Chapter 27 Inferences for Regression Copyright 2007 Pearson Education, Inc. Publishing as Pearson Addison-Wesley Slide 27-1 Copyright 2007 Pearson Education, Inc. Publishing as Pearson Addison-Wesley An
Chapter 27 Inferences for Regression Copyright 2007 Pearson Education, Inc. Publishing as Pearson Addison-Wesley Slide 27-1 Copyright 2007 Pearson Education, Inc. Publishing as Pearson Addison-Wesley An
K3. Why did the certain ethnic mother put her baby in a crib with 20-foot high legs? So she could hear it if it fell out of bed.
 Factor Analysis 1 COM 531, Spring 2009 K. Neuendorf MODEL: From Group Humor Data Set-- Responses to jokes: K1 K2 F1. F2. F3. F4. F5 K29 F6 K30 K31 For all items K1-K31, 0=not funny at all, 10=extremely
Relationships Between Quantitative Variables
 Chapter 5 Relationships Between Quantitative Variables Three Tools we will use Scatterplot, a two-dimensional graph of data values Correlation, a statistic that measures the strength and direction of a
K3. Why did the certain ethnic mother put her baby in a crib with 20-foot high legs? So she could hear it if it fell out of bed.
 Factor Analysis 1 COM 531, Spring 2008 K. Neuendorf MODEL: From Group Humor Data Set-- Responses to jokes: K1 K2 F1. F2. F3. F4. F5 K29 F6 K30 K31 For all items K1-K31, 0=not funny at all, 10=extremely
Algebra I Module 2 Lessons 1 19
 Eureka Math 2015 2016 Algebra I Module 2 Lessons 1 19 Eureka Math, Published by the non-profit Great Minds. Copyright 2015 Great Minds. No part of this work may be reproduced, distributed, modified, sold,
Relationships. Between Quantitative Variables. Chapter 5. Copyright 2006 Brooks/Cole, a division of Thomson Learning, Inc.
 Relationships Chapter 5 Between Quantitative Variables Copyright 2006 Brooks/Cole, a division of Thomson Learning, Inc. Three Tools we will use Scatterplot, a two-dimensional graph of data values Correlation,
Sociology 7704: Regression Models for Categorical Data Instructor: Natasha Sarkisian
 OLS Regression Assumptions Sociology 7704: Regression Models for Categorical Data Instructor: Natasha Sarkisian A1. All independent variables are quantitative or dichotomous, and the dependent variable
Frequencies. Chapter 2. Descriptive statistics and charts
 An analyst usually does not concentrate on each individual data values but would like to have a whole picture of how the variables distributed. In this chapter, we will introduce some tools to tabulate
For these items, -1=opposed to my values, 0= neutral and 7=of supreme importance.
 1 Factor Analysis Jeff Spicer F1 F2 F3 F4 F9 F12 F17 F23 F24 F25 F26 F27 F29 F30 F35 F37 F42 F50 Factor 1 Factor 2 Factor 3 Factor 4 For these items, -1=opposed to my values, 0= neutral and 7=of supreme
Resampling Statistics. Conventional Statistics. Resampling Statistics
 Resampling Statistics Introduction to Resampling Probability Modeling Resample add-in Bootstrapping values, vectors, matrices R boot package Conclusions Conventional Statistics Assumptions of conventional
Problem Points Score USE YOUR TIME WISELY USE CLOSEST DF AVAILABLE IN TABLE SHOW YOUR WORK TO RECEIVE PARTIAL CREDIT
 Stat 514 EXAM I Stat 514 Name (6 pts) Problem Points Score 1 32 2 30 3 32 USE YOUR TIME WISELY USE CLOSEST DF AVAILABLE IN TABLE SHOW YOUR WORK TO RECEIVE PARTIAL CREDIT WRITE LEGIBLY. ANYTHING UNREADABLE
K ABC Mplus CFA Model. Syntax file (kabc-mplus.inp) Data file (kabc-mplus.dat)
 Data file (kabc-mplus.dat)") K ABC Mplus CFA Model Syntax file (kabc-mplus.inp) title: principles and practice of sem (4th ed.), rex kline two-factor model of the kabc-i, figure 9.7, table 13.1 data: file is "kabc-mplus.dat"; type
K ABC Mplus CFA Model Syntax file (kabc-mplus.inp) title: principles and practice of sem (4th ed.), rex kline two-factor model of the kabc-i, figure 9.7, table 13.1 data: file is "kabc-mplus.dat"; type
Moving on from MSTAT. March The University of Reading Statistical Services Centre Biometrics Advisory and Support Service to DFID
 Moving on from MSTAT March 2000 The University of Reading Statistical Services Centre Biometrics Advisory and Support Service to DFID Contents 1. Introduction 3 2. Moving from MSTAT to Genstat 4 2.1 Analysis
STAT 250: Introduction to Biostatistics LAB 6
 STAT 250: Introduction to Biostatistics LAB 6 Dr. Kari Lock Morgan Sampling Distributions In this lab, we ll explore sampling distributions using StatKey: www.lock5stat.com/statkey. We ll be using StatKey,
STAT 113: Statistics and Society Ellen Gundlach, Purdue University. (Chapters refer to Moore and Notz, Statistics: Concepts and Controversies, 8e)
") STAT 113: Statistics and Society Ellen Gundlach, Purdue University (Chapters refer to Moore and Notz, Statistics: Concepts and Controversies, 8e) Learning Objectives for Exam 1: Unit 1, Part 1: Population
STAT 113: Statistics and Society Ellen Gundlach, Purdue University (Chapters refer to Moore and Notz, Statistics: Concepts and Controversies, 8e) Learning Objectives for Exam 1: Unit 1, Part 1: Population
GLM Example: One-Way Analysis of Covariance
 Understanding Design and Analysis of Research Experiments An animal scientist is interested in determining the effects of four different feed plans on hogs. Twenty four hogs of a breed were chosen and
Abstract. Keywords Movie theaters, home viewing technology, audiences, uses and gratifications, planned behavior, theatrical distribution
 Alec Tefertiller alect@ksu.edu Assistant professor. Kansas State University in Manhattan, Kansas, USA. Submitted January 23, 2017 Approved May 22, 2017 Abstract 2017 Communication & Society ISSN 0214-0039
Analysis of Film Revenues: Saturated and Limited Films Megan Gold
 Analysis of Film Revenues: Saturated and Limited Films Megan Gold University of Nevada, Las Vegas. Department of. DOI: http://dx.doi.org/10.15629/6.7.8.7.5_3-1_s-2017-3 Abstract: This paper analyzes film
Sociology 704: Topics in Multivariate Statistics Instructor: Natasha Sarkisian
 Sociology 704: Topics in Multivariate Statistics Instructor: Natasha Sarkisian OLS Regression in Stata To run an OLS regression:. reg agekdbrn educ born sex mapres80 Source SS df MS Number of obs = 1091
Visible Vibrations (originally Chladni Patterns) - Adding Memory Buttons. Joshua Gutwill. August 2002
 - Adding Memory Buttons. Joshua Gutwill. August 2002") (originally Chladni Patterns) - Adding Memory Buttons Joshua Gutwill August 2002 Keywords: 1 (originally Chladni Patterns) Adding Memory Buttons
(originally Chladni Patterns) - Adding Memory Buttons Joshua Gutwill August 2002 Keywords: 1 (originally Chladni Patterns) Adding Memory Buttons
Best Pat-Tricks on Model Diagnostics What are they? Why use them? What good do they do?
 Best Pat-Tricks on Model Diagnostics What are they? Why use them? What good do they do? Before we get started feel free to download the presentation and file(s) being used for today s webinar. http://www.statease.com/webinar.html
Modeling television viewership
 Modeling television viewership The Nielsen ratings are the best known measures of viewership of television shows. These ratings form the basis for the setting of advertising rates, and are thus crucial
Subject-specific observed profiles of change from baseline vs week trt=10000u
 Mean of age 1 The MEANS Procedure Analysis Variable : age N Mean Std Dev Minimum Maximum ƒƒƒƒƒƒƒƒƒƒƒƒƒƒƒƒƒƒƒƒƒƒƒƒƒƒƒƒƒƒƒƒƒƒƒƒƒƒƒƒƒƒƒƒƒƒƒƒƒƒƒƒƒƒƒƒƒƒƒƒƒƒƒƒƒƒƒ 109 55.5321101 12.1255537 26.0000000 83.0000000
Effect of sense of Humour on Positive Capacities: An Empirical Inquiry into Psychological Aspects
 Global Journal of Finance and Management. ISSN 0975-6477 Volume 6, Number 4 (2014), pp. 385-390 Research India Publications http://www.ripublication.com Effect of sense of Humour on Positive Capacities:
Identifying the Importance of Types of Music Information among Music Students
 Identifying the Importance of Types of Music Information among Music Students Norliya Ahmad Kassim Faculty of Information Management, Universiti Teknologi MARA (UiTM), Selangor, MALAYSIA Email: norliya@salam.uitm.edu.my
TI-Inspire manual 1. Real old version. This version works well but is not as convenient entering letter
 TI-Inspire manual 1 Newest version Older version Real old version This version works well but is not as convenient entering letter Instructions TI-Inspire manual 1 General Introduction Ti-Inspire for statistics
To Link this Article: Vol. 7, No.1, January 2018, Pg. 1-11
 Identifying the Importance of Types of Music Information among Music Students Norliya Ahmad Kassim, Kasmarini Baharuddin, Nurul Hidayah Ishak, Nor Zaina Zaharah Mohamad Ariff, Siti Zahrah Buyong To Link
MID-TERM EXAMINATION IN DATA MODELS AND DECISION MAKING 22:960:575
 MID-TERM EXAMINATION IN DATA MODELS AND DECISION MAKING 22:960:575 Instructions: Fall 2017 1. Complete and submit by email to TA and cc me, your answers by 11:00 PM today. 2. Provide a single Excel workbook
Linear mixed models and when implied assumptions not appropriate
 Mixed Models Lecture Notes By Dr. Hanford page 94 Generalized Linear Mixed Models (GLMM) GLMMs are based on GLM, extended to include random effects, random coefficients and covariance patterns. GLMMs are
WEB APPENDIX. Managing Innovation Sequences Over Iterated Offerings: Developing and Testing a Relative Innovation, Comfort, and Stimulation
 WEB APPENDIX Managing Innovation Sequences Over Iterated Offerings: Developing and Testing a Relative Innovation, Comfort, and Stimulation Framework of Consumer Responses Timothy B. Heath Subimal Chatterjee
Open Access Determinants and the Effect on Article Performance
 International Journal of Business and Economics Research 2017; 6(6): 145-152 http://www.sciencepublishinggroup.com/j/ijber doi: 10.11648/j.ijber.20170606.11 ISSN: 2328-7543 (Print); ISSN: 2328-756X (Online)
A Citation Analysis of Articles Published in the Top-Ranking Tourism Journals ( )
") University of Massachusetts Amherst ScholarWorks@UMass Amherst Tourism Travel and Research Association: Advancing Tourism Research Globally 2012 ttra International Conference A Citation Analysis of Articles
University of Massachusetts Amherst ScholarWorks@UMass Amherst Tourism Travel and Research Association: Advancing Tourism Research Globally 2012 ttra International Conference A Citation Analysis of Articles
Predicting the Importance of Current Papers
 Predicting the Importance of Current Papers Kevin W. Boyack * and Richard Klavans ** kboyack@sandia.gov * Sandia National Laboratories, P.O. Box 5800, MS-0310, Albuquerque, NM 87185, USA rklavans@mapofscience.com
UNIVERSITY OF MASSACHUSETTS Department of Biostatistics and Epidemiology BioEpi 540W - Introduction to Biostatistics Fall 2002
 1 UNIVERSITY OF MASSACHUSETTS Department of Biostatistics and Epidemiology BioEpi 540W - Introduction to Biostatistics Fall 2002 Exercises Unit 2 Descriptive Statistics Tables and Graphs Due: Monday September
abc Mark Scheme Statistics 3311 General Certificate of Secondary Education Higher Tier 2007 examination - June series
 abc General Certificate of Secondary Education Statistics 3311 Higher Tier Mark Scheme 2007 examination - June series Mark schemes are prepared by the Principal Examiner and considered, together with the
COMP Test on Psychology 320 Check on Mastery of Prerequisites
 COMP Test on Psychology 320 Check on Mastery of Prerequisites This test is designed to provide you and your instructor with information on your mastery of the basic content of Psychology 320. The results
in the Howard County Public School System and Rocketship Education
 Technical Appendix May 2016 DREAMBOX LEARNING ACHIEVEMENT GROWTH in the Howard County Public School System and Rocketship Education Abstract In this technical appendix, we present analyses of the relationship
Klee or Kid? The subjective experience of drawings from children and Paul Klee Pronk, T.
 UvA-DARE (Digital Academic Repository) Klee or Kid? The subjective experience of drawings from children and Paul Klee Pronk, T. Link to publication Citation for published version (APA): Pronk, T. (Author).
(Week 13) A05. Data Analysis Methods for CRM. Electronic Commerce Marketing
 A05. Data Analysis Methods for CRM. Electronic Commerce Marketing") (Week 13) A05. Data Analysis Methods for CRM Electronic Commerce Marketing Course Code: 166186-01 Course Name: Electronic Commerce Marketing Period: Autumn 2015 Lecturer: Prof. Dr. Sync Sangwon Lee Department:
(Week 13) A05. Data Analysis Methods for CRM Electronic Commerce Marketing Course Code: 166186-01 Course Name: Electronic Commerce Marketing Period: Autumn 2015 Lecturer: Prof. Dr. Sync Sangwon Lee Department:
Libraries as Repositories of Popular Culture: Is Popular Culture Still Forgotten?
 Wayne State University School of Library and Information Science Faculty Research Publications School of Library and Information Science 1-1-2007 Libraries as Repositories of Popular Culture: Is Popular
N12/5/MATSD/SP2/ENG/TZ0/XX. mathematical STUDIES. Wednesday 7 November 2012 (morning) 1 hour 30 minutes. instructions to candidates
 1 hour 30 minutes. instructions to candidates") 88127402 mathematical STUDIES STANDARD level Paper 2 Wednesday 7 November 2012 (morning) 1 hour 30 minutes instructions to candidates Do not open this examination paper until instructed to do so. A graphic
88127402 mathematical STUDIES STANDARD level Paper 2 Wednesday 7 November 2012 (morning) 1 hour 30 minutes instructions to candidates Do not open this examination paper until instructed to do so. A graphic
A comparison of inexpensive statistical packages for Apple II microcomputers
 Behavior Research Methods, Instruments, & Computers 187, 1 (2), -103 A comparison of inexpensive statistical packages for Apple II microcomputers DARRELL L. BUTLER and STEVE K. JONES Ball State University,
Modeling memory for melodies
 Modeling memory for melodies Daniel Müllensiefen 1 and Christian Hennig 2 1 Musikwissenschaftliches Institut, Universität Hamburg, 20354 Hamburg, Germany 2 Department of Statistical Science, University
hprints , version 1-1 Oct 2008
 Author manuscript, published in "Scientometrics 74, 3 (2008) 439-451" 1 On the ratio of citable versus non-citable items in economics journals Tove Faber Frandsen 1 tff@db.dk Royal School of Library and
CONCLUSION The annual increase for optical scanner cost may be due partly to inflation and partly to special demands by the State.
 Report on a Survey of Changes in Total Annual Expenditures for Florida Counties Before and After Purchase of Touch Screens and A Comparison of Total Annual Expenditures for Touch Screens and Optical Scanners.
THE RELATIONSHIP OF BURR HEIGHT AND BLANKING FORCE WITH CLEARANCE IN THE BLANKING PROCESS OF AA5754 ALUMINIUM ALLOY
 Onur Çavuşoğlu Hakan Gürün DOI: 10.21278/TOF.41105 ISSN 1333-1124 eissn 1849-1391 THE RELATIONSHIP OF BURR HEIGHT AND BLANKING FORCE WITH CLEARANCE IN THE BLANKING PROCESS OF AA5754 ALUMINIUM ALLOY Summary
Answers. Chapter 9 A Puzzle Time MUSSELS. 9.1 Practice A. Technology Connection. 9.1 Start Thinking! 9.1 Warm Up. 9.1 Start Thinking!
 . Puzzle Time MUSSELS Technolog Connection.. 7.... in. Chapter 9 9. Start Thinking! For use before Activit 9. Number of shoes x Person 9. Warm Up For use before Activit 9.. 9. Start Thinking! For use before
Perceptions and predictions of expertise in advanced musical learners
 Perceptions and predictions of expertise in advanced musical learners 1 Introduction The nature of expertise The concept of expertise in popular thought has been related to notions of talent, skill, specialisation,
Latin Square Design. Design of Experiments - Montgomery Section 4-2
 Latin Square Design Design of Experiments - Montgomery Section 4-2 Latin Square Design Can be used when goal is to block on two nuisance factors Constructed so blocking factors orthogonal to treatment
Tutorial 0: Uncertainty in Power and Sample Size Estimation. Acknowledgements:
 Tutorial 0: Uncertainty in Power and Sample Size Estimation Anna E. Barón, Keith E. Muller, Sarah M. Kreidler, and Deborah H. Glueck Acknowledgements: The project was supported in large part by the National
Use black ink or black ball-point pen. Pencil should only be used for drawing. *
 General Certificate of Education June 2009 Advanced Subsidiary Examination MATHEMATICS Unit Statistics 1B MS/SS1B STATISTICS Unit Statistics 1B Wednesday 20 May 2009 1.30 pm to 3.00 pm For this paper you
Detecting Medicaid Data Anomalies Using Data Mining Techniques Shenjun Zhu, Qiling Shi, Aran Canes, AdvanceMed Corporation, Nashville, TN
 Paper SDA-04 Detecting Medicaid Data Anomalies Using Data Mining Techniques Shenjun Zhu, Qiling Shi, Aran Canes, AdvanceMed Corporation, Nashville, TN ABSTRACT The purpose of this study is to use statistical
Psychological wellbeing in professional orchestral musicians in Australia
 International Symposium on Performance Science ISBN 978-2-9601378-0-4 The Author 2013, Published by the AEC All rights reserved Psychological wellbeing in professional orchestral musicians in Australia
Chapter 5. Describing Distributions Numerically. Finding the Center: The Median. Spread: Home on the Range. Finding the Center: The Median (cont.
 Chapter 5 Describing Distributions Numerically Copyright 2007 Pearson Education, Inc. Publishing as Pearson Addison-Wesley Copyright 2007 Pearson Education, Inc. Publishing as Pearson Addison-Wesley Slide
SEVENTH GRADE. Revised June Billings Public Schools Correlation and Pacing Guide Math - McDougal Littell Middle School Math 2004
 SEVENTH GRADE June 2010 Billings Public Schools Correlation and Guide Math - McDougal Littell Middle School Math 2004 (Chapter Order: 1, 6, 2, 4, 5, 13, 3, 7, 8, 9, 10, 11, 12 Chapter 1 Number Sense, Patterns,
Statistical Consulting Topics. RCBD with a covariate
 Statistical Consulting Topics RCBD with a covariate Goal: to determine the optimal level of feed additive to maximize the average daily gain of steers. VARIABLES Y = Average Daily Gain of steers for 160
Replicated Latin Square and Crossover Designs
 Replicated Latin Square and Crossover Designs Replicated Latin Square Latin Square Design small df E, low power If 3 treatments 2 df error If 4 treatments 6 df error Can use replication to increase df
Aalborg Universitet. The influence of Body Morphology on Preferred Dance Tempos. Dahl, Sofia; Huron, David
 Aalborg Universitet The influence of Body Morphology on Preferred Dance Tempos. Dahl, Sofia; Huron, David Published in: international Computer Music Conference -ICMC07 Publication date: 2007 Document
E X P E R I M E N T 1
 E X P E R I M E N T 1 Getting to Know Data Studio Produced by the Physics Staff at Collin College Copyright Collin College Physics Department. All Rights Reserved. University Physics, Exp 1: Getting to
Technical Appendices to: Is Having More Channels Really Better? A Model of Competition Among Commercial Television Broadcasters
 Technical Appendices to: Is Having More Channels Really Better? A Model of Competition Among Commercial Television Broadcasters 1 Advertising Rates for Syndicated Programs In this appendix we provide results
Chapter 4. Displaying Quantitative Data. Copyright 2007 Pearson Education, Inc. Publishing as Pearson Addison-Wesley
 Chapter 4 Displaying Quantitative Data Copyright 2007 Pearson Education, Inc. Publishing as Pearson Addison-Wesley Dealing With a Lot of Numbers Summarizing the data will help us when we look at large
Modeling Voting Behavior in the Eurovision Song Contest
 MPRA Munich Personal RePEc Archive Modeling Voting Behavior in the Eurovision Song Contest bülent doğru 18. August 0021 Online at http://mpra.ub.uni-muenchen.de/42801/ MPRA Paper No. 42801, posted 30.
DELTA MODULATION AND DPCM CODING OF COLOR SIGNALS
 DELTA MODULATION AND DPCM CODING OF COLOR SIGNALS Item Type text; Proceedings Authors Habibi, A. Publisher International Foundation for Telemetering Journal International Telemetering Conference Proceedings
Release Year Prediction for Songs
 Release Year Prediction for Songs [CSE 258 Assignment 2] Ruyu Tan University of California San Diego PID: A53099216 rut003@ucsd.edu Jiaying Liu University of California San Diego PID: A53107720 jil672@ucsd.edu
ECONOMICS 351* -- INTRODUCTORY ECONOMETRICS. Queen's University Department of Economics. ECONOMICS 351* -- Winter Term 2005 INTRODUCTORY ECONOMETRICS
 Queen's University Department of Economics ECONOMICS 351* -- Winter Term 2005 INTRODUCTORY ECONOMETRICS Winter Term 2005 Instructor: Web Site: Mike Abbott Office: Room A521 Mackintosh-Corry Hall or Room
Unstaged Cancer in the U.S.:
 Unstaged Cancer in the U.S.: A Population Based Look at Demographic, Socioeconomic, and Geographic Variables as Predictors of Staging Kimberly Herget, MStat Biostatistician, Utah Cancer Registry University
Analysis of data from the pilot exercise to develop bibliometric indicators for the REF
 February 2011/03 Issues paper This report is for information This analysis aimed to evaluate what the effect would be of using citation scores in the Research Excellence Framework (REF) for staff with
Does the number of users rating the movie accurately predict the average user rating?
 STAT 503 Assignment 1: Movie Ratings SOLUTION NOTES These are my suggestions on how to analyze this data and organize the results. I ve given more questions below than I can address in my analysis, so
How to Optimize Ad-Detective
 How to Optimize Ad-Detective Ad-Detective technology is based upon black level detection. There are several important criteria to consider: 1. Does the video have black frames to detect? Are there any
Unsymmetrical Aryl(2,4,6-trimethoxyphenyl)iodonium Salts: One-pot Synthesis, Scope, Stability, and Synthetic Applications. Supporting Information
iodonium Salts: One-pot Synthesis, Scope, Stability, and Synthetic Applications. Supporting Information") Unsymmetrical Aryl(2,4,6-trimethoxyphenyl)iodonium Salts: One-pot Synthesis, Scope, Stability, and Synthetic Applications Thomas L. Seidl, Sunil K. Sundalam, Brennen McCullough and David R. Stuart* dstuart@pdx.edu
Unsymmetrical Aryl(2,4,6-trimethoxyphenyl)iodonium Salts: One-pot Synthesis, Scope, Stability, and Synthetic Applications Thomas L. Seidl, Sunil K. Sundalam, Brennen McCullough and David R. Stuart* dstuart@pdx.edu
Impressions of Canadians on social media platforms and their impact on the news
 Impressions of Canadians on social media platforms and their impact on the news Signal Survey Summary submitted by Nanos to SIGNAL Leadership Communication Inc., February 2017 (Submission 2017-984) > Overall,
Blueline, Linefree, Accuracy Ratio, & Moving Absolute Mean Ratio Charts
 INTRODUCTION This instruction manual describes for users of the Excel Standard Celeration Template(s) the features of each page or worksheet in the template, allowing the user to set up and generate charts
The Relationship Between Movie theater Attendance and Streaming Behavior. Survey Findings. December 2018
 The Relationship Between Movie theater Attendance and Streaming Behavior Survey Findings Overview I. About this study II. III. IV. Movie theater attendance and streaming consumption Quadrant Analysis:
Mixed models in R using the lme4 package Part 2: Longitudinal data, modeling interactions
 Mixed models in R using the lme4 package Part 2: Longitudinal data, modeling interactions Douglas Bates 2011-03-16 Contents 1 sleepstudy 1 2 Random slopes 3 3 Conditional means 6 4 Conclusions 9 5 Other
An empirical field study on sing- along behaviour in the North of England
 An empirical field study on sing- along behaviour in the North of England Alisun R. Pawley Department of Music, University of York Daniel Müllensiefen Department of Psychology, Goldsmiths, University of
Preservation Statistics Survey - FY2017. Preservation Statistics Survey - FY2017. General Information. * 1. Institution Name: * 2.
 Preservation Statistics Survey - FY2017 Count what you do and show that preservation counts! Early bird deadline is April 28, 2018 during Preservation week and qualified respondents will be entered into
Supplementary Figures Supplementary Figure 1 Comparison of among-replicate variance in invasion dynamics
 1 Supplementary Figures Supplementary Figure 1 Comparison of among-replicate variance in invasion dynamics Scaled posterior probability densities for among-replicate variances in invasion speed (nine replicates
How to present your paper in correct APA style
 APA STYLE (6 th edition) 1 How to present your paper in correct APA style Julie F. Pallant This document provides a brief overview of how to prepare a journal article or research paper following the guidelines
The Time Series Forecasting System Charles Hallahan, Economic Research Service/USDA, Washington, DC
 INTRODUCTION The Time Series Forecasting System Charles Hallahan, Economic Research Service/USDA, Washington, DC The Time Series Forecasting System (TSFS) is a component of SAS/ETS that provides a menu-based
Don t Judge a Book by its Cover: A Discrete Choice Model of Cultural Experience Good Consumption
 Don t Judge a Book by its Cover: A Discrete Choice Model of Cultural Experience Good Consumption Paul Crosby Department of Economics Macquarie University North American Workshop on Cultural Economics November
The Influence of Visual Metaphor Advertising Types on Recall and Attitude According to Congruity-Incongruity
 Volume 118 No. 19 2018, 2435-2449 ISSN: 1311-8080 (printed version); ISSN: 1314-3395 (on-line version) url: http://www.ijpam.eu ijpam.eu The Influence of Visual Metaphor Advertising Types on Recall and
UNIVERSITY OF CAMBRIDGE INTERNATIONAL EXAMINATIONS General Certificate of Education Ordinary Level
 UNIVERSITY OF CAMBRIDGE INTERNATIONAL EXAMINATIONS General Certificate of Education Ordinary Level *0192736882* STATISTICS 4040/12 Paper 1 October/November 2013 Candidates answer on the question paper.
BBC Trust Review of the BBC s Speech Radio Services
 BBC Trust Review of the BBC s Speech Radio Services Research Report February 2015 March 2015 A report by ICM on behalf of the BBC Trust Creston House, 10 Great Pulteney Street, London W1F 9NB enquiries@icmunlimited.com
Lessons from the Netflix Prize: Going beyond the algorithms
 Lessons from the Netflix Prize: Going beyond the algorithms Yehuda Koren movie #868 Haifa movie #76 movie #666 We Know What You Ought To Be Watching This Summer We re quite curious, really. To the tune
Reproducibility Assessment of Independent Component Analysis of Expression Ratios from DNA microarrays.
 Reproducibility Assessment of Independent Component Analysis of Expression Ratios from DNA microarrays. David Philip Kreil David J. C. MacKay Technical Report Revision 1., compiled 16th October 22 Department
For the SIA. Applications of Propagation Delay & Skew tool. Introduction. Theory of Operation. Propagation Delay & Skew Tool
 For the SIA Applications of Propagation Delay & Skew tool Determine signal propagation delay time Detect skewing between channels on rising or falling edges Create histograms of different edge relationships
Media Questions on the 1996 election study and related content analysis of media coverage of the presidential campaign
 Memo to the National Election Studies Board From: Tami Buhr, Harvard University Ann Crigler, University of Southern California Marion Just, Wellesley College Date: January 23 1996 RE: Media Questions on
MATH& 146 Lesson 11. Section 1.6 Categorical Data
 MATH& 146 Lesson 11 Section 1.6 Categorical Data 1 Frequency The first step to organizing categorical data is to count the number of data values there are in each category of interest. We can organize
Cancer in females. Visual Display of (Public Health) Data - Theory and Practice. Michael C. Samuel, Dr. P.H. Senior Epidemiologist / Data Scientist
 Data - Theory and Practice. Michael C. Samuel, Dr. P.H. Senior Epidemiologist / Data Scientist") Visual Display of (Public Health) Data - Theory and Practice Michael C. Samuel, Dr. P.H. Senior Epidemiologist / Data Scientist Cancer in females 200.00 150.00 100.00 50.00 C&R Lu. Breast 60.00 40.00 20.00
Visual Display of (Public Health) Data - Theory and Practice Michael C. Samuel, Dr. P.H. Senior Epidemiologist / Data Scientist Cancer in females 200.00 150.00 100.00 50.00 C&R Lu. Breast 60.00 40.00 20.00
저작권법에따른이용자의권리는위의내용에의하여영향을받지않습니다.
 저작자표시 - 비영리 - 변경금지 2.0 대한민국 이용자는아래의조건을따르는경우에한하여자유롭게 이저작물을복제, 배포, 전송, 전시, 공연및방송할수있습니다. 다음과같은조건을따라야합니다 : 저작자표시. 귀하는원저작자를표시하여야합니다. 비영리. 귀하는이저작물을영리목적으로이용할수없습니다. 변경금지. 귀하는이저작물을개작, 변형또는가공할수없습니다. 귀하는, 이저작물의재이용이나배포의경우,
Relationship between the Use of Humor Styles and Innovative Behavior of Executives in a Real Estate Company
 Relationship between the Use of Humor Styles and Innovative Behavior of Executives in a Real Estate Company Dr. Chaiyaset Promsri Faculty of Business Administration, Rajamangala University of Technology