FIM INTERNATIONAL SURVEY ON ORCHESTRAS
|
|
|
- Stewart Morris
- 5 years ago
- Views:
Transcription


1 1st FIM INTERNATIONAL ORCHESTRA CONFERENCE Berlin April 7-9, 2008 FIM INTERNATIONAL SURVEY ON ORCHESTRAS Report By Kate McBain watna.communications Musicians of today, orchestras of tomorrow!
2

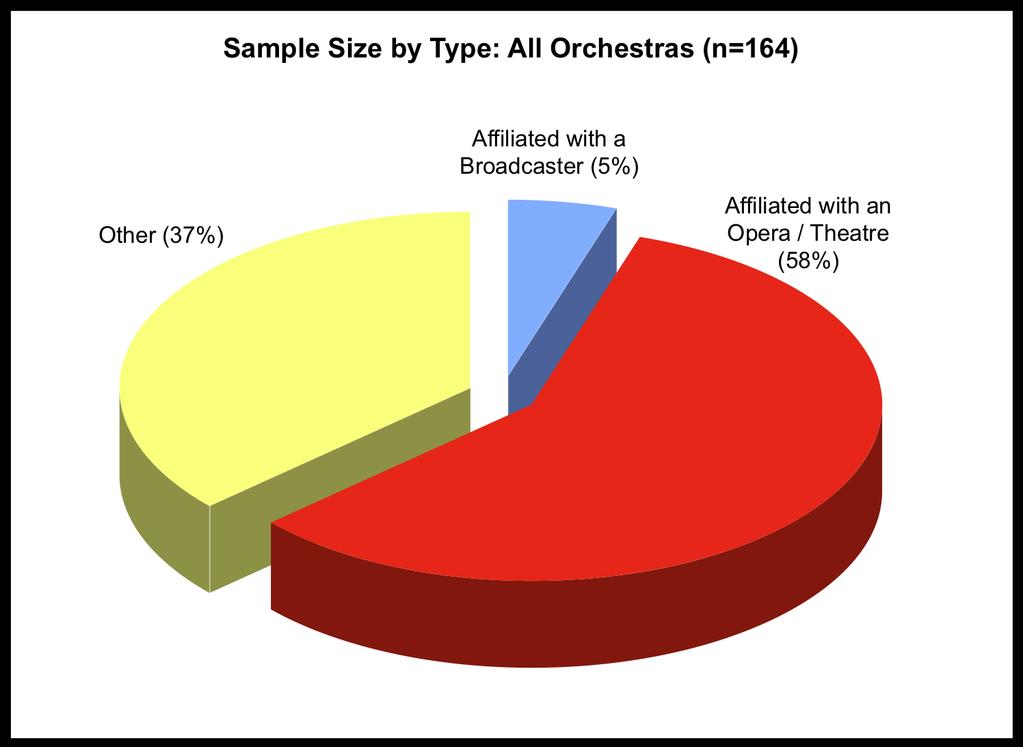
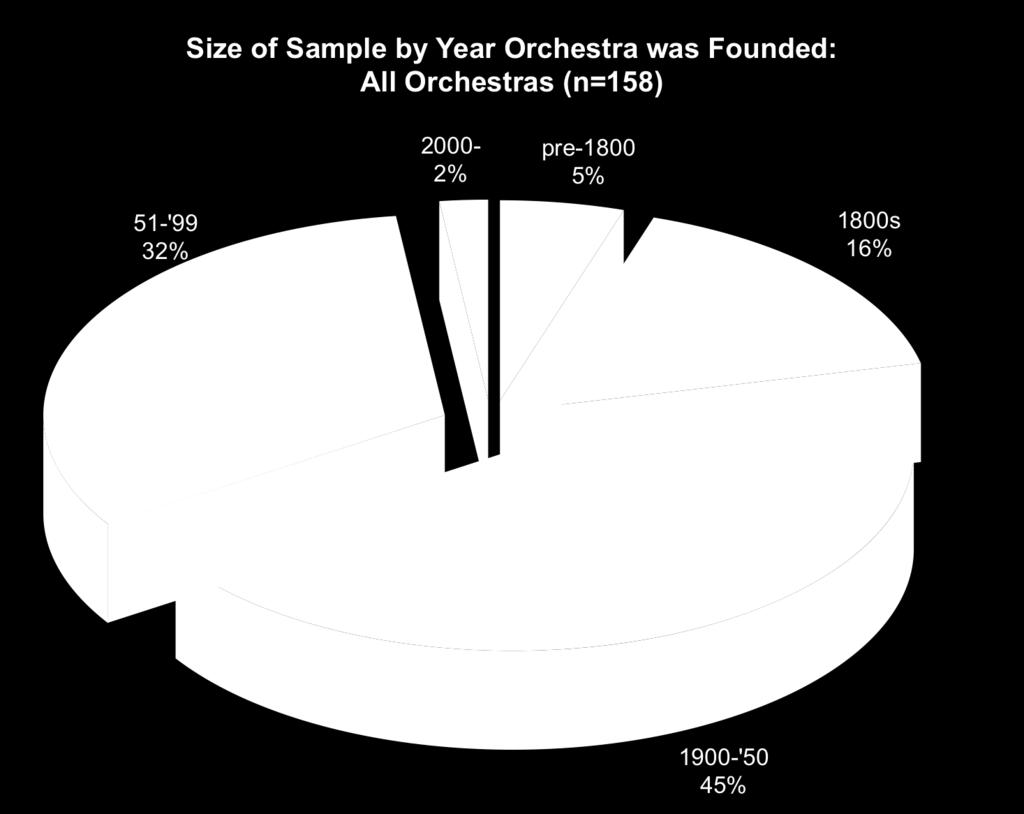
3 A. Orchestras included in the Survey 1. Geographical Spread A total of 164 orchestras were included in this survey, covering 24 countries. The data for 133 of these came from self-report information collected using the questionnaire. 121 are based in Europe: 53 are in Germany; 14 in the UK; 12 in Sweden; 10 in France; 6 in Slovakia; 5 in Switzerland; 4 in both Hungary and Norway; 3 in both Belgium and Denmark; 2 in Finland; 1 from Austria, Italy, Lithuania, Luxembourg and Macedonia. 2 orchestras are based in Israel; 4 in Japan; 1 in India; 2 in Mexico; 1 in both Brazil and Panama; and 1 in New Zealand. 31 orchestras are based in North America (16 from the United States; 15 from Canada). Data for this cohort was drawn from published sources and included in the analyses where possible. 2. Type & Age of Orchestral Institution 8 orchestras are attached to a Broadcast institution; all of which are based in Europe. 96 are affiliated with an Opera/Theatre. 60 others do not state their affiliation to either kind of organisation. Of the total orchestras included in this sample of 158, just over 20% (34) were established prior to 1900; the majority of these are affiliated with an opera/theatre (76%). Only 2% were founded since the turn of the 21 st century. Two-thirds of orchestras included in this survey were founded in the 20 th century: 58% in the first half, and 42% since Almost all of those orchestras attached to a broadcast institution (87.5%) were founded in the first half of the 20 th century. A third of orchestras attached to an opera/theatre have been in existence for over 100 years (29.7%); Five are even older, having all been established in the centuries preceding the 1800s. 3

4 4
![3. Number of Musicians [Full Time Employees] in the Orchestra The Orchestras included range greatly in size; with the smallest counting only 15 musicians as full-time employees; and the largest 174.](/docs-images/90/103699927/images/5-0.jpg "The mode number of musicians employed (FTEs) across the orchestras surveyed here is between 61 and 80.")
5 3. Number of Musicians [Full Time Employees] in the Orchestra The Orchestras included range greatly in size; with the smallest counting only 15 musicians as full-time employees; and the largest 174. The mode number of musicians employed (FTEs) across the orchestras surveyed here is between 61 and 80. Only 4 orchestras out of this sample of 162 claim to employ more than 120 musicians: 19 employ 40 or less. The total number of FTE musicians employed across the orchestras included in this survey (excluding the two for which no information is available regarding their size), is 11,930. In this respect, this survey is has the potential to impact on almost 12,000 professional musicians working around the world. Affiliated with a Broadcaster Average No. FTEs Germany Norway 52.5 UK 71.3 Total 91.6 Affiliated with an Opera/Theatre Average No. FTEs Austria 85 Canada 60 Switzerland 89 Germany 75 Denmark 67.5 Finland 60 France 105 Israel 58 Italy 117 Sweden 67 Slovakia 77 UK 54 US 83 Total 75.8 The average number of musicians employed by a broadcaster-affiliated orchestra is 91.6, although those in Germany tend to employ several more than this figure (116.5), and Norway and the UK many less (52.5 and 71 respectively). For orchestras attached to an Opera/Theatre, the average size of their work-force of musicians is 76, with France and Italy employing the most musicians (105.1 and 117 respectively) and the UK the least (54). 5 Other Average No. FTEs Belgium 90.3 Brazil 72 Switzerland 64.7 Germany 65 Denmark 75 Finland 98 France Hungary Japan 66.5 Lithuania 100 Luxembourg 98 Macedonia 70 Mexico 91 NZ 69 Norway 80.3 Panama 18 Sweden Slovakia 32 UK 64.2 Total 67.8

6 In the case of orchestras that are not affiliated with either a Broadcast Institution or an Opera/Theatre, the average size of orchestra is Orchestral Activities 97% of orchestras surveyed undertake Symphonic activities. 71% of them are engaged in Operas, and 37% are involved with Ballets. None of the orchestras claim only to undertake Operatic activities; and none affiliated with a Broadcaster perform Opera. 53 orchestras count Symphonies, Opera and Ballet among their activities. Symphony & Operatic & Ballet Ballet & Symphony Ballet Ballet & Operatic Symphony Operatic Symphony & Operatic 36% of orchestras are involved in both symphonic concerts and opera. 27% claim only to undertake symphony engagements: the majority of which are not affiliated with either a broadcaster or an opera/theatre; although 88% of Broadcaster-affiliated orchestras tend to do symphonic concerts only. 5. Repertoire Almost all of the orchestras in the sample (98%) count contemporary / new compositions within their repertoire. In total, 69 (55%) orchestras perform pop. 87% include ancient / baroque music in their repertoire. 49% of orchestras count all three among the genres they perform. All orchestras that claim to perform contemporary/ new compositions and music from the ancient/baroque period and pop, also include other music in their repertoire. 6

 and contemporary music (10.7%).")
7 84% of the orchestras that perform ancient/baroque music do so using regular instruments. None use only period instruments. 16% employ both regular and period instruments. As a proportion of the total repertoire of music played, Contemporary music & new compositions, ancient/baroque music and pop each constitute on average less than 15% of an orchestra s repertoire. Pop is performed the least amount, with it making up on average only 7%. The large proportion of this sample s repertoire is made up of music from other genres. Those attached to an Opera/Theatre play the least amount of pop (2.9%) and contemporary music (10.7%). For all other orchestras, these two genres together comprise at least 25% of their overall repertoire. Those attached to a broadcaster have a higher proportion of contemporary music (23%) and pop (12%) in their repertoire than orchestras of any other type; although Ancient/Baroque music constitutes almost as big a proportion of their repertoire (14%) as it does for those affiliated with an Opera/Theatre (16%). 7
8 Ancient/Baroque music is performed by all but 1 of the orchestras that have been in existence for more than 110 years (97%); compared to 84% (76/91) of orchestras established during the 20 th and 21 st centuries. It is less common for Pop to feature within the repertoires of the much older orchestras: only 29% of orchestras born prior to 1800 claim to perform music from this genre. Pop constitutes a bigger proportion of overall repertoire for those established between 1900 and 1950 (9%) than it does orchestras founded either before (3.5%) or after this period (7%), albeit still a small amount. 63% of those established since 1800 include pop in their repertoire. This number begins to decrease as the orchestras become younger. The degree to which Contemporary music and New Compositions is included by orchestras in their repertoire remains steady, irrespective of how old or young an orchestra is. Pop constitutes a much smaller proportion of the overall repertoire for those orchestras based in Germany (0.5%) and France (1.5%) than it does among those based in the UK (11%) and Sweden (14.8%); whereas Ancient / Baroque music is significantly more prominent within the repertoire of German orchestras than for the others. Both Sweden and the UK count Contemporary music and New Compositions as constituting an average of more than 15% of their overall repertoire, whereas the same genre amounts on average to only 7% among French orchestras. B. Income & Expenditure 1. Bodies Involved in Funding the Institution 62% of orchestras are funded in part by the State; an equal proportion are funded by their regional funding body. 75% of them receive funding the City. 62% receive funds from other sources. All of those affiliated with a broadcaster receive funds from some other source; likely the institution to which they are attached. A very large proportion of orchestras affiliated with an Opera/Theatre are funded by their City (87%); far fewer of all other orchestras tend to receive monetary support in this way (58%). 31% of orchestras receive funding from each of the three specified sources (State, Regional and City bodies); although the majority of them (84% of them) augment their funding in some other way as well. 8

9 9 orchestras (0.1%) are funded entirely by money from an other source: 6 of which are affiliated with a broadcaster. 5% of orchestras are funded entirely by the City; with the exception of one based in Japan, all of them are German-based and affiliated with an Opera/Theatre. Only 1 orchestra receives 100% of its funding from their Regional funding body. 4% are funded entirely by the State: this includes all those based in Mexico and Macedonia. 2. Proportionate Funding: Total Orchestras & by Type Among those orchestras receiving money from sources other than the State, the Region and the City, the contribution constitutes on average 36% of their total annual funded income. 4% of orchestras receive 100% of their income from some other source. Among those affiliated with an Opera/Theatre, the funds received from the State and the Region constitute, on average, 35% of their respective total annual income. The amounts received from the City are on average higher, at 43%. For those orchestras without any affiliation to either a broadcast institution or an opera/theatre, they receive a substantial amount of their annual income from the State (56%); and where they are funded by either the Region or the City, these contributions constitute on average less than 35% of their total income. 75% of orchestras based in Central and South America are funded primarily, if not entirely, by the State. Orchestras in the Middle East receive, on average, just over 40% of their income from the State and the City combined: the remainder comes from other sources. Those in Asia receive almost 55% of their overall income from the City and the State, augmented contributions from regional and other sources. It must be remembered that these samples are extremely small and as such cannot be seen as indicative of funding strategy within these countries as a whole. Orchestras in North America receive a substantial proportion of their total income from the State, Region and/or City: in Canada, these contributions amount to more than 98% of their total income, whereas in the United States it is less than 50%. There is great variation in the proportionate contributions from these different bodies across orchestras in Europe. The largest proportion of income for orchestras in France and Germany comes from the City (39% and 51% respectively); whereas in Sweden and the UK, it is from the State (44% and 50% respectively). There is also variation across orchestras based in Germany (for which the sample is significantly large): all those affiliated with a Broadcaster receive 100% of their funded income from some Other source: most likely the 9
10 institution to which they are attached. For those orchestras attached to an opera/theatre, the majority of funding comes from the City (almost 2/3rds of their income), supplemented by funds from the Region, collectively making up more than 90% of their total income. Similarly, the funds received by the remaining orchestras based in Germany from the Region and the City total just under 75%. 3. Endowments 30 orchestras (18% of the total) indicate that they are funded in part through an endowment scheme; although figures regarding the amount of this draw is available in only 18 cases. For the 11 orchestras based in Canada, the average draw on endowments is 2,600, per year. The amount drawn per year varies across them from only 633 to 14.5 million, and as a percentage of the total endowment it ranges from 1% to 30%. Across the remaining 7 orchestras, the draw on the endowment per year constitutes anything from 10 to 100% of their total budget. 4. Annual Expenditure The total expenses budget across the entire sample of orchestras (for which useable data is available) is more than 850 million per year. This averages out to a total annual expenditure for each orchestra of 8.7million. However, it is almost 20% more than this among those orchestras affiliated with an Opera/Theatre, showing an average expenditure per year of 10.5million : for the remaining 36 orchestras, their average expenditure is nearing half that amount. Total & Average Yearly Expenditure across All Orchestras (n=98) by Type Orchestra Type Total Expenses ( ) Average Expenses ( ) Affiliated with a Broadcaster 15,767, ,255, Affiliated with an Opera/Theatre 652,458, ,523, Other 184,771, ,599, Total 852,997, ,704, % Spend on Musicians Salaries The modal average spent on musicians salaries across orchestras amounts to between 41 and 60 percent of their total expenses budget (34% of all orchestras). 20% of orchestras spend between 21-40% of their entire budget on salaries. The same proportion spends between 61 and 80%. In only 16% of cases does it amount to more than 80% of their total budget. Only a tenth of orchestras spend less than 20% of their total budget on wages. On average, 54% of the total expenditure of orchestras included in this survey goes towards musicians salaries. 10
 and all other types (62%).")
11 Musicians salaries constitute on average a smaller proportion of the overall expenditure for orchestras affiliated with an Opera/Theatre (48%) than those attached to a broadcast institution (72% of the budget) and all other types (62%). The percentage spend on salaries varies across these orchestras across a margin of more than 50%, and as such it is very difficult to assess the true average in terms of the amount allocated to musicians wages. 6. Total Yearly Spend on Musicians Salaries Musicians Salaries as % of Each Orchestra s Total Expenditure on average across All Orchestras (n=99) Orchestra Type % Range Affiliated with a Broadcaster 72% % Affiliated with an Opera / Theatre 48% 7-94% Other 62% 12-99% Total 54.4% An estimate of the total cost of musicians salaries in euros can be calculated for 87 orchestras. The total amount spent on musicians salaries is just under 331million per year; constituting 45% of the total yearly budget across all orchestras. Total Cost on Musicians Salaries across All Orchestras (n=87) by Type Type of Orchestra Total Spend ( ) As % of Total Expenditure* Affiliated with a Broadcaster 9,775, % Affiliated with an Opera/Theatre 213,448, % Other 107,775, % Total 330,999, % The difference between this and the preceding average is a result of variation in sample size. Despite this difference, we can nevertheless state with some confidence that orchestras affiliated with an Opera/Theatre tend on average to allocate a smaller proportion of their overall budget (between 37% and 48%) to musicians salaries than orchestras of other types (the average figures for which range from 61% to 72%). It is not clear whether this is due to these orchestras having a greater number and range of outgoings than others, or partly as a result of their paying less. The relationship between the total expenditure of orchestras against the % spend on salaries is one that assumes a negative correlation. I.e. the total expenditure rises as the proportion of that total directed towards 11

12 salaries decreases. This suggests that any increase in expenditure is as a result of requirements other than wages. However, there is no information from these questionnaires as to what these other outgoings may be. 7. Box Office Takings as % of Total Income The mean average generated through the box-office across all orchestras per year constitutes 15.8% of their total budget. Only 4% of the orchestras surveyed included in this sample take more than 50% of their total income through Box-office takings. In most cases (69%), box-office takings comprises no more than 15% of their total income per year. In fact, the modal average across this entire sample indicates that the box office generates only 10% of an orchestra s annual income. BO Takings as % of Total Income Number of Orchestras (as % of Total) 0% 3% 1-5% 21% 6-10% 24% 11-15% 20% 16-20% 9% 21-25% 6% 26-50% 13% More than 50% 4% The box-office takings are lowest for those orchestras affiliated with a broadcast institution (5%). Those attached to an opera/theatre generate an average of 17% per year by this means. 15% of the income for all other orchestras is made by way of public paid performances. The amount each orchestra brings in individually ranges (as a proportion of their total income) from 0% to 90%. 12


13 8. Average Number of Performances per Year The total number of performances undertaken per year by the sample of 100 orchestras for which information was provided is 14,879. Each orchestra performs almost 149 times per year on average, although 25% of the sample perform more than 150 times per year. The modal average when looking across each orchestra is 120. The large majority of orchestras (57%) perform between 76 and 150 times a year. Only 8 claim to perform less than 50 times a year; with the lowest number of performances being
.")
14 Orchestras affiliated with an Opera/Theatre tend to perform almost twice as much through the year as do other orchestras (with an average of times p/year in comparison to 110). Those attached to a broadcast institution tend to perform least often (71.5 times per year). Comparing countries with the largest samples, it appears that orchestras based the UK perform an average of 473 times per year; more than twice the average of those based in Germany (211.6), and three times that of the French orchestras surveyed (124.3). The UK average is perhaps skewed by the 29% of orchestras based there being attached to a broadcaster and hence likely performing more often than others. 9. Box Office Takings through Performance There is only a slight correlation between the number of performances each orchestra claims to undertake each year and the proportion of their income received through box-office takings. However, where the average ticket price for these performances range from 0 to 193, it is difficult to assess exactly how many of these performances are profitable, and actually undertaken with the express purpose of being so. 10. Average Number of Seats Sold per Performance The average number of seats sold across the sample of 93 orchestras included in this question is However, the spread in average attendance across the sample is very broad, ranging from 80 to The total number of tickets sold for seats across all performances throughout the year by the total sample of orchestras for which such information was available is 12,793,605. Attendance for a Typical Performance No. of Orchestras (as % of total) Up to % % % % % % 2000 or more 5.4% 14
, or any Other orchestra (947).")
15 Orchestras affiliated with a Broadcaster tend to sell 1267 seats for a typical performance. This is significantly more than those sold for performances by orchestras affiliated with an Opera/Theatre (1004), or any Other orchestra (947). Further, because the attendance tends to vary less across the sample than it does for those orchestras attached to an Opera/Theatre or any other type of orchestra (ranging from 200 to 1800), it could be stated that this figure of 1267 is actually closer to the actual average audience size for Broadcast-affiliated orchestras performances in all other cases (where the number of seats sold ranges from 80 to 2300). 11. Price of Seats The average price for a seat across the entire sample (of 101 orchestras) is just under 31, although prices vary from 0 to 300. The average cost for a ticket to see a performance for an orchestra attached to an Opera/Theatre is 34.71, whereas the average price for a seat to see a performance by any other orchestra is Where the former has tickets ranging in price from 0 to 300 ; the highest price for a seat to see any other orchestra is 133. The average cost of a seat to see an orchestral performance in Germany and the UK is and respectively. In both cases it costs more to see an orchestra affiliated with an Opera/Theatre than any other kind (30 and 44 respectively). 15
16 Average Cost of Tickets: All Range in Ticket Price ( ) Average Price Orchestras (n=101) by Country Min. Max. for a Seat ( ) Macedonia Slovakia Hungary Lithuania Israel Finland Brazil Denmark NZ Sweden Germany Norway Japan UK Belgium France Mexico Luxembourg Switzerland Italy Austria Total C. Wages & Employment Categories 1. Categories of Employment Considering the orchestras included in this survey range so greatly in size, it is only to be expected that the number and variety of positions they indicate exist within their orchestra would differ. What is perhaps of most interest is the large array of terms employed by different orchestras to refer to the positions their musicians occupy. Because of this, it is extremely difficult to compare composition across orchestras, let alone along other variables. What the questionnaire has provided is a record of how orchestras from across the world organise their musicians, and notably how they refer to the various positions they hold. In many cases, terms that could be assumed to refer to the same category are often employed to describe different positions within the same orchestra. In others, they could refer specifically to levels of pay. Composer Leader Associate Principal Principal Soloist Sub-Principal 1 st Player Arranger Associate Leader Assistant Principal 1 st Solo 2 nd Principal 2 nd Player Concertmaster Sub-Leader Acting Principal 2 nd Solo 2 nd Principal A 3 rd Player Co-Concertmaster Super Principal Group Leader 3 rd Solo 2 nd Principal B Tutti Cioncert-master Principal Section Principal Soloist Co-Principal Soloist Adjoints 1 st Principal Co-Principal Super-Soloist 3 rd Principal In one case [Ref.31], the only category of employment that was detailed as one that orchestral members could hold was that of musician. 2. Wages Informants chose to respond to the question of what wage categories existed for musicians in a variety of ways. A significant number (24%) provide no detail beyond stating that contracts and rates are negotiated on an individual basis or depend on the work required of each player. 18% of cases all of them relating to orchestras based in Germany merely make reference to the collective agreement on which the majority of orchestral wages in the country are based. The pay band to which these informants refer correspond with the number of FTEs they claim to employ. As such it is possible to summarise the spread of pay-bands into which these 29 orchestras fall under the terms of the TVK agreement, in descending order. 6 of them are not affiliated with an opera/theatre. 16

17 2 are classed as pay group A/F2 1 is categorised as pay group A/F1 6 can be assigned to TVK A 13 orchestras fall within pay-band B 3 are assigned to TVK C 4 are assigned to TVK D Several informants merely listed the number of categories of payment without detailing which positions or state / term of employment they cover. Summarising them according to country: For one orchestra in the UK there are 4 levels of payment, ranging from 37,000 to 45,000 per year The four categories listed by another based in For one orchestra in Switzerland, wages are higher than this across the 4 categories of pay they have, ranging from 55,300 to 72,000 per year. In Slovakia, on the basis of two orchestras of different sizes, but both of affiliated with Opera/Theatres, there appear to be 4 to 6 levels of pay. For the smaller orchestra (43 FTEs), the pay bands work on a scale from level a) offering between to per month, to level d) which is set between and per month. For the larger orchestra (75 FTEs), the pay bands work from a) to f), on a scale from to per month. In New Zealand, there are 5 grades of pay for the one orchestra surveyed that is based there (69 FTEs): a) 20, to e) 25, Serveral French orchestras pay their musicians according to a sliding scale referred to only as categories 1, 2A, 2B and 2; though they all differ as to the amount each pays. Data for North America was drawn from published sources, but different in form according to country. For the sample of orchestras based in the US all of which are affiliated with an Opera/Theatre the minimum yearly wage for musicians ranges from 16, to 74, The average across this sample is 48, In general, wages across this sample rise in relation to the size of the orchestra. The average basic yearly wage for a principal across the Canadian orchestras surveyed is 19, The average basic yearly wage for a section player is 17, The spread of wages for each category of employment is 15,904 45,862 and 13,254 65,867 respectively. Again, the wages for both categories tend to rise with the size of the orchestra (as measured by the number of FTEs). 17
 players across all orchestras [n=71, 42 and 70 respectively].")
18 3. Wages per Category Principal, Co-Principal & Tutti: All Orchestras & by Type The number of informants providing figures for certain categories was large enough to produce significantly sized samples in only three cases: permitting insight into the average yearly wage for principals, co-principals and rank-and-file (tutti) players across all orchestras [n=71, 42 and 70 respectively]. This includes the orchestras based in Canada (relating to Principal and Tutti players), but not the United States. The average yearly wage for a Rank-and-file player is just over 26,000. The average salary across this sample for a musician holding a Principal position is roughly 2,000 more than this. If there is any anomaly here, it is that the salary for a co-principal is higher than this, at just over 30,000. When the Canadian Orchestras are removed from these calculations, the average salary for a Principal rises to 30, and drops to 27, for a co-principal. These figures are significantly impacted by the range that exists in salaries for each category and across the entire sample by type of orchestra. Position Principals Coprincipals Tutti Range in Yearly Wage ( ) 1,350 60, ,936 1,973 54,000 Average wage p/year ( ) 28, , , Total Orchestras (n=62) by Type Category of Employment Principal Co-principal Tutti Average Yearly Wage ( ) Average Yearly Wage ( ) Average Yearly Wage ( ) Affiliated with Broadcaster 48, , , Affiliated with an Opera/Theatre 28, , , Other 26, , , Total ,252 28, The wages for musicians of any category in orchestras affiliated with a Broadcaster are significantly higher than the average for the entire sample: between 15 and 20,000. Musicians in orchestras attached to an Opera/Theatre get paid on average 1,500 and 4,500 less than the average across the whole sample; aside from that of Principal. Salaries for musicians working in all Other types of orchestras in all three categories are between 25,500 and 26,500 ; with co-principals at the lower end of the scale. 18
19 4. Wages per Category by Region The average wage for each category of employment varies quite notably from country to country. The countries with the largest samples of orchestras included in this analysis have been highlighted the findings for which we can have broadest confidence in. All Orchestras (n=61) Average Yearly Wage ( ) per Category of Employment by Country Principal Co-Principal Tutti Belgium 30, , , Canada 21, , Switzerland 55, , , Germany 38, , , Denmark 36, Finland 25, , , France 33, , , Hungary 7, Israel 13, , , Japan 11, , , Luxembourg 60, , , Macedonia 2, , Mexico 13, , , Norway 46, , , Sweden 23, , , Slovakia 7, , , UK 36, , , Total 28, , , Relative to the average wages calculated across the entire sample, those offered to musicians based in Canadian orchestras are significantly lower, as they are in Sweden. Conversely, orchestras in the UK, France and Germany are all much higher; in several cases by up to 10,000. The figures for Switzerland, Luxembourg and Norway suggest that orchestral musicians in all three of the positions analysed here get paid much better than musicians employed anywhere else. Musicians based in Asia, the Middle East, Central America and Eastern European countries get paid significantly less than their Western European contemporaries. There is a very slight tendency for the wages to increase for all three categories of employment as the size of the orchestra grows. 19


20 5. Increase in Salary over 20 Years from Recruitment Informants chose to respond to this question in a variety of ways. 6% of them, all relating to orchestras based in Germany refer to the Collective Agreement TVK. There is some indication that the increase in salaries over a 20-year period is between 30% and 60% in these cases. 13% of informants provide a range as their answer, varying in scale from 0.5-2% to %. For the remaining 81% of orchestras included in this sample, the spread in average wage increases over a 20- year period is extremely large, ranging from 0.5% to 180%. It is unclear whether some of the larger figures refer to the total % increase in musicians wages over two decades of service; and that others relating far smaller figures relate to a year-on-year increase over an equal period of 20 years. Across the entire sample, the modal average increase in wages over a period of 20 years since recruitment is less than 5%. In 1.3% of cases, orchestral musicians see no increase in their salaries both of which are based in the UK. In 5%, musicians see their salaries increase by more than 100%. 20
21 The increase in musicians wages over a period of 20 years since recruitment taken as an average across the orchestras included in this sample is 31.6%; although it should be noted that this falls within the extremely broad range of 0.5% to 180%. The increase in wages over a period to 20 years appears to be higher among orchestras affiliated with an opera/theatre (37.2%) than the average across the entire sample and even higher still among those attached to a Broadcast Institution (40.8%). Conversely, musicians working for other types of orchestras experience a salary rise of 6% lower than the overall average of 31.6%. Average Wage increase Country Range Total Orchestras (n=72) by Type Affiliated with a Broadcaster Affiliated with an Opera/Theatre Comparing the countries in which there is a sizeable cohort of orchestras, musicians based in Germany see an increase in wages of 57.5%, followed by Sweden at 36.4%. Orchestras based in the UK and France see a much smaller increase in salaries, at 20.7% and 11.4% respectively. 6. Contracts Average Wage increase over 20 years Range 40.8% 0-148% 37.20% 3-180% Other 25.5% 0-112% Total 31.6% % over 20 years (%) Belgium % Brazil 12.5 Switzerland % Germany % Denmark % France % Hungary % Israel % Japan % Luxembourg 20.0 Macedonia 1.0 Mexico 3.0 Norway % New Zealand 1.5 Panama 50.0 Sweden % Slovakia % UK % Almost all (95%) of the orchestras surveyed employ musicians on a permanent, full-time basis. 64% of the total sample have part-time contracts in place; and 68% employ musicians on a fixed-term basis. This stands for orchestras of all types. Notably, fewer orchestras affiliated with a Broadcast institution employ musicians on a permanent yet part-time basis than any other kind of orchestra (25%). Total Orchestras Type of Contract (n=133) by Type Permanent Full-time Fixed-term Full-time Permanent Part-time Fixed-term Part-time Affiliated with Broadcaster 100% 37.5% 25% 25% Affiliated with an Opera/Theatre 99% 46% 39% 34% Other 89% 38% 38% 15% Total 95% 42% 38% 26% 21

22 In all countries aside from Luxembourg and Panama, orchestras employ musicians on a permanent, fullt-time basis. In most cases, these contracts are in place alongside other types of contract, primarily full-time but fixedterm contracts. For musicians in orchestras based in Belgium, Canada and Macedonia, they are only employed on a permanent, full-time basis. The US only employ musicians on permanent contracts. Total Orchestras (n=133) by Country Type of Contracts in Use Permanent Full-time Fixed-term Full-time Permanent Part-time Fixed-term Part-time Austria 100% 100% 100% Belgium 100% Canada 100% Switzerland 100% 20% 100% 20% Germany 98% 50% 48% 44% Denmark 100% 100% 33% 33% Finland 100% 50% France 88% 56% 22% 11% Hungary 50% 75% 50% 75% Israel 100% 50% India 100% 100% Italy 100% 100% Japan 75% 50% 25% Lithuania 100% 100% 100% 100% Luxembourg 100% 100% Macedonia 100% Mexico 100% 100% 100% 50% Norway 100% 50% 25% 25% Panama 100% Sweden 100% 17% 25% 8% Slovakia 100% 100% 20% UK 100% 9% 45% US 100% 9% 7. Number of Contracts According to the 109 orchestras for which figures were available, contracts are in place in total across the entire sample. 91% of musicians across this sample are employed on a permanent, full-time basis. Very few (less than 5%) are employed part-time, be it permanently or contracted for a fixed period of time. 22


23 Total Orchestras (n=109) Number of Musicians Employed by Type of Contract (proportion of total contracts as %) Permanent Full-time Fixed-term Full-time Permanent Part-time Fixed-term Part-time Total Number of Contracts Proportion as % of Total 91.% 4.3% 2% 2.2% 100% Further, 40% of this sample claim to have 100% of their musicians on permanent, full-time contracts. 56% employ all of their musicians on a full-time basis. 4% employ musicians for a fixed-term only: half of these are for part-time contracts; the other half are fulltime. It is more common for musicians not working in orchestras affiliated with a Broadcaster or an Opera/Theatre to be employed on a fixed-term contract, be it full- or part-time. A higher percentage of musicians working for a broadcaster are on full-time permanent contracts than those in any other orchestra. In all cases though, the large proportion of the work-force are on these types of contracts. In all but 2 of the19 countries for which there is information available regarding the number and types of contracts used by orchestras, more than 80% of musicians are employed on a Permanent and full-time basis. In Japan, only 23

24 53% of musicians are employed on this kind of contract, although the large majority of the remaining 47% are nevertheless employed on a full-time basis. In Hungary, only 25% of musicians are employed on a Permanent basis; although the majority of these are on full-time contracts. It is notable that almost a third of musicians working for orchestras based in Hungary are on contracts that are both part-time and fixed-term. All musicians working for orchestras based in Belgium, Canada, Finland, Denmark, Finland, France, Israel and Macedonia are employed on a full-time basis; in most cases on a permanent basis. Hungary has the highest proportion of musicians working on a part-time basis (35%); followed by Switzerland (12%). In all other cases where orchestras have part-time contracts in place, they account for less than 6% of each country s workforce of musicians (Austria, Germany, Japan, Lithuania, Norway, Sweden, Slovakia, the UK and the US). Total Orchestras (n=109) Number of Musicians on Contracts (as % of Total No. of Contracts) by Country Permanent Full-time Fixed-term Full-time Permanent Part-time Fixed-term Part-time Austria Belgium 100 Canada 100 Switzerland Germany Denmark 95 5 Finland 97 3 France 100 Hungary Israel 84 6 Italy 100 Japan Lithuania Macedonia 100 Norway Sweden Slovakia UK 97 3 US Probation Period From a sample of 119, 4% state that there is no probation period for musicians. The vast majority of the orchestras (67%) have a probation period of between 6 and 12 months. The modal average is, in fact, 12 months exactly. 2% of orchestras have their musicians on probation for up to and even more than 3 years. 24
25 The probation period is slightly longer in orchestras affiliated with an opera/theatre (10.6 months), than in those attached to a broadcaster (9 months) or other type of orchestras (8.7 months). The average length of probation when joining an orchestra is only 3 months in Brazil, rising to 15 months in Slovakia. For musicians in the UK, France, Germany and Sweden, the probation period is between 7 and 11 months. Country Average Length of Probation Period in Months Brazil 3 Finland 4 Japan 4 Italy 6 Norway 6 New Zealand 7 UK 7.2 France 8.7 Hungary 9 Macedonia 9 Belgium 10 Germany 10.4 Denmark 10.5 Sweden 11.2 Switzerland 11.6 Austria 12 Israel 12 Luxembourg 12 Slovakia Retirement Age For the majority of American orchestras surveyed, the conditions of retirement detailed relate not to the age at which a musician can choose to retire, but rather the term of duty he or she is required to serve prior to officially retiring. This term is set at an average of 24 years. 24% of informants indicated the minimum and maximum ages limits for retirement age: in 48% of these, this is set between 60 and 65; 18% set it between 60 and 70; 22% set it between 65 and 70. In one orchestra, it is between 65 and 75. In 10% of cases, musicians can retire below the age of 60, but no older than 65. One of these is based in Japan and states that musicians can take retirement as early as 32. The minimum retirement age across the sample for 125 for which figures are available is Every type of orchestra sets their minimum retirement age between 62 and 64. All Orchestras (n=125) by Type Minimum Retirement Age Average Minimum Age for Retirement Affiliated with Broadcaster Affiliated with an Opera / Theatre Other All Orchestras The minimum retirement age across those orchestras based in Central and South America ranges from 60 (in Mexico) to 65 (in Brazil). Japan, Hungary and Belgium all set their minimum retirement age below 60, at 51, 57 and 59 respectively. The country with the highest average minimum retirement age if Denmark, at 67. The minimum age of retirement is relatively steady across the various orchestras, whereas there is greater variation in the maximum age at which musicians can retire. 25

26 All Orchestras (n=125) by Country Minimum Retirement Age Average Minimum Age for Retirement Japan Hungary Belgium Italy Mexico Slovakia France Finland Panama Sweden Austria Luxembourg Norway UK Germany Switzerland Brazil Israel Lithuania Macedonia Denmark All Orchestras Audition Procedure 18% of orchestras state that they have not agreed an audition procedure with their respective musicians Union. 82% orchestras state that the audition procedure they have in place was made in agreement with their respective musicians Union. It is less common for orchestras affiliated with a Broadcast institution to have agreed their audition procedure with their respective musicians union than it is in all other orchestras, with only half of them having done so. All Orchestras (n=154) by Type Proportion of Orchestras having Agreed their Audition Procedure with their Musicians Union Agreed with Union Not Agreed with Union Affiliated with a Broadcaster 50% 50% Affiliated with an Opera/Theatre 87% 13% Other 75% 25% 26
27 It is interesting to note that none of the orchestras based in India, Macedonia or Panama have agreed their audition procedure with their respective musicians unions. All those based in North America, Oceania and the Middle East have done do. In Europe, the majority of orchestras have also agreed their audition procedure with their respective unions, although it notably there is a 50:50 split across those based in Finland and Hungary. All Orchestras (n=154) by Country Proportion of Orchestras having Agreed their Audition Procedure with their Musicians Union Agreed with Union Not Agreed with Union Austria 100% 0 Brazil 100% 0 Canada 100% 0 Switzerland 100% 0 Israel 100% 0 Italy 100% 0 Lithuania 100% 0 Luxembourg 100% 0 Mexico 100% 0 Norway 100% 0 New Zealand 100% 0 US 100% 0 Sweden 83% 17% Germany 80% 20% Slovakia 80% 20% Japan 75% 25% Belgium 67% 33% Denmark 67% 33% UK 64% 36% France 60% 40% Finland 50% 50% Hungary 50% 50% India 0 100% Macedonia 0 100% Panama 0 100% It is also interesting to examine in more detail those countries for which only some of the orchestras based there have agreed their audition procedures with their respective musicians unions, since there appears to be some variation according to the type of orchestra. Notably, where only half of the orchestras based in Finland have an agreed audition procedure, it transpires in fact that all this 50% is made up entirely of orchestras that are attached to an Opera/Theatre. Those that have not agreed their audition procedure with the Union are all orchestras that have no affiliation with an opera/theatre or indeed a broadcast institution. In the UK, far fewer of the orchestras that are attached to a broadcast institution have agreed their audition procedures than those affiliated with an opera/theatre (100%) or any other type (63%). In France, Slovakia and Denmark, all Other types of orchestras have agreed their audition procedure with their unions. This compares in all three cases to a smaller proportion of orchestras attached to an opera/theatre: in France, it is in less than 50% of orchestras of this type that have done so. 27
 states that NONE of those that sit on audition panels are musicians or union representatives.")
28 11. Composition of Audition Panel 59% of informants provide some detail as to the composition of their audition panels. 3% of this sample (of 97) states that NONE of those that sit on audition panels are musicians or union representatives. It is particularly interesting that two of these claim to have agreed the procedure for these panels with their respective Unions. 61% of this sample (of 97) indicates that their audition panels include musicians and/or union representatives. 34% state that their audition panels include musicians, but no union representatives. 2% of them state the opposite: that union representatives do sit as members on the panel, but that musicians do not. As such, a total of 97% of orchestras appear to include musicians and/or union representatives on their audition panels. Of this cohort, 4 times as many of orchestras have agreed their audition procedure with their respective union than have not. It is important to acknowledge that in many cases, the musicians that sit on such panels may also hold the position of Union Representative. From the figures provided, it is a little difficult to discern the exact ratio of musicians to union representatives and in relation to other members sitting on each panel. 12. Dismissal Procedure 46% of orchestras claim that their dismissal procedure has not been agreed with their respective musicians unions. As such, just over half (54%) of the orchestras included here have agreed their dismissal procedures with a union. 28
29 There is no real variation according to the type of orchestra as to the proportion of them that have and have not agreed their dismissal procedure with their respective union. Proportion of Orchestras having Agreed their Dismissal Procedure with their All Orchestras (n=149) by Type Musicians Union Agreed with Union Not Agreed with Union Affiliated with a Broadcaster 38% 63% Affiliated with an Opera/Theatre 59% 41% Other 47% 53% Comparatively, there is some variation according to region and country, which in many ways reflect that noted above regarding the proportion of orchestras in these countries that have and have not agreed their audition procedures with their unions. All of those orchestras based in North America, Oceania and the Middle East have agreed their dismissal procedure with their respective musicians unions. Similarly, all those based in Austria, Italy, Luxembourg, Mexico and Norway have agreed their dismissal procedures with their Union. None of those based in Brazil, India, Macedonia or Panama can make such a claim. All Orchestras (n=149) by Proportion of Orchestras having Agreed their Dismissal Procedure with their Musicians Union Country Agreed with Union Not Agreed with Union Austria 100% 0 Canada 100% 0 Israel 100% 0 Italy 100% 0 Luxembourg 100% 0 Mexico 100% 0 New Zealand 100% 0 Norway 100% 0 US 100% 0 UK 93% 7% Denmark 67% 33% France 67% 33% Norway 67% 33% Slovakia 67% 33% Switzerland 60% 40% Finland 50% 50% Hungary 50% 50% Sweden 50% 50% Belgium 33% 67% Japan 25% 75% Germany 11% 89% Brazil 0 100% India 0 100% Macedonia 0 100% Panama 0 100% 29

30 If we examine in more detail those countries for which only some of the orchestras based there have agreed their dismissal procedure with their respective musicians unions, there is again some variation according to the type of orchestra. Notably, where only half of the orchestras based in Finland have an agreed dismissal procedure, it transpires in fact that this 50% is made up entirely of orchestras that are attached to an Opera/Theatre. Those that have not agreed their audition procedure with the Union are all orchestras that have no affiliation with an opera/theatre or indeed a broadcast institution. The same can also be said for the orchestras based in Denmark. Similarly, where the figures for all orchestras based in Norway suggest that two-thirds of them have agreed their dismissal procedure with their union, it transpires that none of those attached to a broadcaster have done so and that 100% of all Other types of orchestra have. In France, only half of the orchestras attached to an opera/theatre have agreed their dismissal procedure, whereas all other orchestras based there have done so. 13. Composition of Dismissal Panels 43 informants (26% of the total sample) provide detail pertaining to the composition of the dismissal panels their respective orchestras have in place. 19% of this cohort (of 43) state that neither musicians nor union representatives sit as members on dismissal panels. It is interesting to note that half of them claim to have already agreed their dismissal procedures with their respective union. The other 50% have not. Of the remaining 81% that all claim to have musicians and/or union representatives sitting on their dismissal panels, two-thirds of them have agreed their dismissal procedures with their respective unions. In 4 cases, the panels include union representatives but not musicians; in only one of these has the procedure for dismissal already been agreed with the Union. Comparatively, 14 informants state that their orchestras dismissal panels do have musicians sitting as members, but not Union Representatives. It is important to acknowledge that in many cases, the musicians that sit on such panels may also hold the position of Union Representative. From the figures provided, it is a little difficult to discern the exact ratio of musicians to union representatives and in relation to other members sitting on each panel. 30
.")
31 D. Performances 1. Number of Performances per year Of the total sample of 145 orchestras included in this analysis, 90% of them undertake regular concerts. Twothirds of them also include operas and broadcasts among their performances over the year. Less than half of the sample perform Ballets (43%). As would perhaps be expected, all of the orchestras that are affiliated with a broadcaster undertake broadcasts in many cases, each performance ( concert ) they do is broadcast. Only one of this cohort includes Opera and Ballet among its performances. Types of Performances Undertaken: All Number of Performances (as % of Total Orchestras) Orchestras (n=145) by Type Operas Concerts Ballets Broadcasts Other Affiliated with a Broadcaster 12.5% 100% 12.5% 100% 0 Affiliated with an Opera/Theatre 79% 84% 49% 62% 0.01% Other 57% 95% 40% 67% 0.03% Total 66% 90% 43% 66% 2% Only 62% of orchestras that are affiliated with an Opera/Theatre undertake Broadcast performances over the year. Almost 50% of them do ballet performances; with a larger proportion undertaking Operas. 1 informant from this cohort also states that their performances include Operettas and Musicals. Similarly, 3 orchestras among those not attached to either a Broadcast Institute or an Opera/Theatre of some type, claim to perform Operettas and Musicals. The large majority of this sample though, are involved in general concerts. Only 40% of them perform for Ballet; 57% undertake Operas; and 67% are involved in Broadcast performances. 2. Total & Average Number of Performances: Total Orchestras & by Type The total number of performances across the entire sample of 145 is calculated as 16,921 per year. The majority of these consist of Operas (6,274) and Concerts (7,741). Bearing in mind the disproportionate number of orchestras included in the survey that are affiliated with an Opera/Theatre it is perhaps not surprising that they perform the bulk of these operas (5,681.5); on average, 74 times a year in fact per orchestra. Those attached to a broadcaster undertake on average less than 1 opera or ballet per year. They do, however, tend to perform more concerts per year on average (60.5) than those attached to an Opera/Theatre (34.5), though less than other types of orchestra (76.7). As perhaps would be expected, it is only those orchestras attached to a broadcaster that undertake a significant number of broadcast performances each year (52%); 31
 by Type Type & Number of Performances Other Operas Concerts Ballets Broadcasts Operetta Musical Total per year Affiliated with")
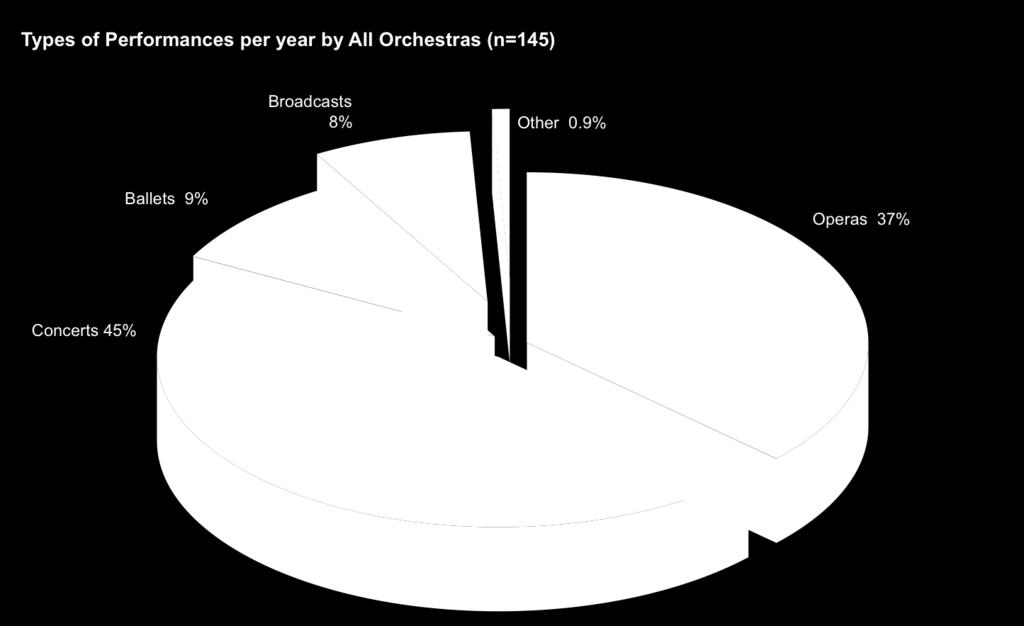
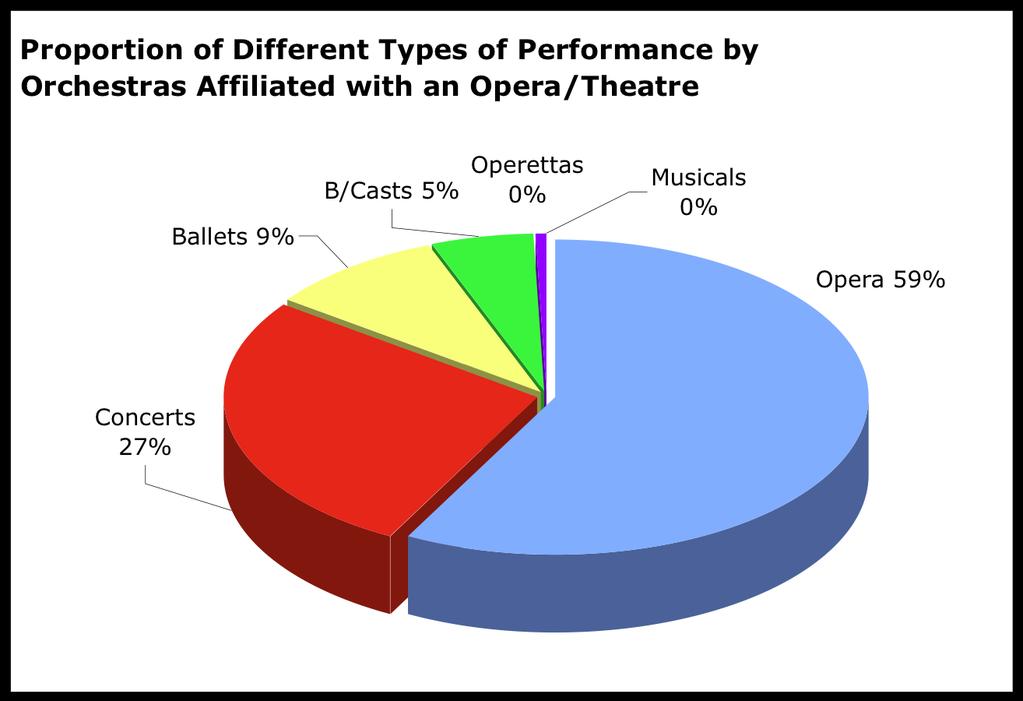
32 although, as stated in the preceding discussion, several informants state that every concert they do is broadcast. Total / Average Number of Performances: Total Orchestras (n=164) by Type Type & Number of Performances Other Operas Concerts Ballets Broadcasts Operetta Musical Total per year Affiliated with Broadcaster Total Mean No Affiliated with Opera / Total Theatre Mean No Other Total Mean No Total Orchestras Total 6, ,741 1,485 1, Mean No Proportional Split in Performances: Total Orchestras & by Type The bulk of all the performances undertaken throughout the year across the total sample of orchestras surveyed are firstly, concerts (45.8%) and secondly, operas (37%). This is the case across all types of orchestras except for the cohort affiliated with an Opera/Theatre, whose total performances are comprised primarily of operas (58%), and then only half as many concerts. Ballets comprise less than 10% of the total performances undertaken across the total sample; and aside from those orchestras attached to a Broadcaster (for whom the ratio between the concerts and broadcast performances is almost 1:1), broadcast performances tend to constitute only 5% of their total activities. Proportional Split in Proportional Split in Type of Performance Performances: Total Other Orchestras (n=164) by Type Operas Concerts Ballets Broadcasts Operetta Musical Affiliated with Broadcaster 0.33% 53% 0.67% 46% 0 0 Affiliated with Opera Theatre 57.8% 27.1% 9.3% 5.4% 0.3% 0.1% Other 9.5% 74.3% 9.1% 5.4% 0.1% 1.6% Total 37% 45.8% 8.8% 7.5% 0.2% 0.7% 32

33 33 FIM International Survey on Orchestras

34 4. Proportionate Split in Performances: by Region On average, most orchestras from every region with the exception of North America tend to perform more concerts during the year than any other type of performance. Those based in Asia very rarely undertake any other kind of performance; whereas in Europe and New Zealand, ballets and Operas are more common. Those in the Middle East undertake Concerts and Operas only, at a ratio of about 2:1. In Europe, it appears that Operas and Concerts comprise the bulk of orchestral performances; whereas in North America it is Broadcasts. Proportional Split in Performances p/year: All Orchestras (n=145) by Region Operas Concerts Ballets Broadcasts Operetta Musical Europe 40% 44.7% 9.5% 5.5% 0.2% 0.1% Central/South America 3.3% 72.3% 3.3% 21.2% 0 0 North America % 0 0 Oceania 15.5% 33.8% 16.9% 33.8% 0 0 Middle East 29.7% 70.3% Asia 0.7% 81.8% 0.5% 0.3% % 5. Obligations of Duty: Hours per Week There was significant variation in the kinds and number of responses to this question provided by informants. None was available for any of the orchestras based in North America. 34
35 6. Working Hours per Week: Total Orchestras & by Type Based on a sample of 55, the average number of working hours per week for musicians is Musicians working for orchestras attached to an Opera/Theatre tend to work on average the most number of hours per week, at 26.8; whereas those attached to a Broadcast Institution appear to work almost 2 hours less than this. Working Hours p/week: Total Orchestras (n=55) by Type The scale for the number of hours worked per week is actually quite wide, though, ranging from 7.25 to 40. Bearing this in mind, it is interesting to note that the modal average is, in fact, 29 hours per week 3 more than the mean average. 7. Working Hours per Week: by Country Average No. Hours p/week Affiliated with a Broadcaster 25.0 Affiliated with an Opera/Theatre 26.8 Other 26.2 Total 26.3 Only 10% of this sample are not based in Europe. Nevertheless, it is worth reviewing the difference in the average number of working hours per week across countries, as shown in the table below. All Orchestras (n=55) by Country Average Number of Working Hours p/wk Panama 15 Switzerland 16 Brazil 20 Hungary 21 Mexico 22 Germany 23 Norway Luxembourg 25 Denmark 25.4 France 26.5 Belgium 27 Italy 28 UK 28.9 Sweden 29 Japan 30.5 Slovakia 31 Finland 36 Lithuania 40 Macedonia 40 Total 26.7 Orchestras in Panama and Switzerland have the lowest number of working hours per week (15 and 16 respectively); whereas their counterparts in Lithuania and Macedonia tend to work the most (40). With the majority of the countries in this analysis having very few orchestras included in this sample, it is difficult to consider these figures particularly significant indicators of a typical working week for orchestral musicians. As such, it is perhaps the modal average of 29, rather than the mean, that should be taken as the number most likely to reflect real life. As illustrated in the Line Chart below, almost ¾ of orchestral musicians work between 21 and 30 hours: 14% work more than this on average. In line with common belief on the continent, Europeans do, it seems, tend to work a longer week than the rest of the world; albeit only just! 35

36 8. Obligations of Duty: Maximum Duties per Week Musicians working for orchestras based in Europe tend on average to undertake more duties per week than those from any other region. Aside from the one orchestra based in New Zealand, whose musicians are obligated to less than 5 duties per week, musicians from all other regions tend to undertake around 7 duties per week. Region* Total No. Duties Mean Average No. Duties p/week Europe Oceania Middle East 14 7 C/Sth. America 21 7 Nth. America Total Average No. Duties p/week: Total Orchestras (n=98) by Type Total No. Duties Mean Average No. Duties p/week Affiliated with a Broadcaster Affiliated with an Opera/Theatre Other Total Musicians working for orchestras affiliated with a broadcaster have on average a higher number of duties to undertake each week (10) than any other orchestra (8). Where the largest regional samples for this question are for Europe (62) and North America (30), it is possible to illustrate the variation across their respective orchestras by type. The average number of duties to which musicians in each cohort are obliged each week is 7.65 and 8.1 respectively. 36
, with Co-Principals working 196 days and Tuttis 200 days per year. No.")
 by Category of Orchestra Affiliation Employment Opera Broadcaster Other Tutti 187 217 233 Co-Principal 185 217 224 Principal 183 217 220 Total 185 217 226 On the whole,")
37 9. Obligations of Duty: Working Days per Year The average number of days worked per year is 196. Those holding Principal roles work the least number of days per year (194), with Co-Principals working 196 days and Tuttis 200 days per year. No. Working Days p/year: All Orchestras (n=42) by Category of Employment Total No. Days Average No. Working Days p/year Principal Co-Principal Tutti Total 23, No. Days Worked per Year (n=42) by Category of Orchestra Affiliation Employment Opera Broadcaster Other Tutti Co-Principal Principal Total On the whole, musicians working for orchestras that are attached to an Opera/Theatre tend to work fewer days per year than those working for orchestras with some other affiliation. 10. Obligations of Duty* Minimum Basic Salary The minimum basic salary for musicians across this sample of 56 orchestras can be shown below to increase with the number of duties they are obligated to per week. 37


38 The number of days musicians in North America are obligated to work per year increases only slightly as the average minimum wage increases. The minimum basic salary increases as the average number of hours musicians are obligated to work per week decreases; as perhaps might be expected. 38

39 11. Length of Rehearsals Concert Rehearsals The average rehearsal for a concert across the entire sample (of 127) lasts a minimum length of minutes, or 2 hours 25 minutes. The maximum length of a rehearsal for a concert is 194 minutes, or 3 hours 14 minutes. Many respondents provided only a single figure to indicate the length of rehearsals, rather than suggesting minimum and maximum lengths. When calculating the average length of rehearsal across each orchestra (midpoint), the average length of rehearsal for a concert is 183 minutes, or just over 3 hours. Where figures are available for minimum and maximum lengths for concert rehearsals (n=50), nearly 50% of orchestras set their rehearsals to last between 2½ and 3 hours. For 20% of orchestras, they are set between 2 and 3 hours; and for a tenth of orchestras, the rehearsal period is far longer, between 4 and 6 hours - all of which are based in Norway. It is interesting to note that concert rehearsals tend on average to be shorter overall for orchestras attached to an Opera/Theatre (2 hours 50 minutes), in comparison to those affiliated with a Broadcaster (3 hours 5 minutes) and all Other orchestras (3 hours 13 minutes). Average Length of Concert Rehearsals: All Average length Average (minutes) Orchestras (n=127) by Type (minutes) Minimum Maximum Range Affiliated with a Broadcaster Affiliated with an Opera/Theatre Other Total There does not appear to be variation in the length of concert rehearsals according to country or region, although it is interesting to note that Panama sets a maximum limit on rehearsals that is significantly lower (90 minutes) than most other countries. Orchestras based in Germany vary relatively widely, with the minimum length of rehearsal being under an hour. Average Length of Concert Rehearsals: All Average length Average (minutes) Orchestras (n=127) by Country (minutes) Minimum Maximum Range Panama Austria Belgium Israel Italy Luxembourg Macedonia NZ Germany Switzerland UK
40 France Finland Hungary Japan Mexico Brazil Slovakia Sweden Lithuania Denmark Norway Opera Rehearsals The average rehearsal for an Opera performance across the entire sample (of 84) lasts a minimum of minutes, or 2 hours 44 minutes. The maximum length of a rehearsal for an opera is minutes, or 3½ hours. When calculating the average length of rehearsals for each orchestra, it appears that in general, the average length of a rehearsal for an opera is 194 minutes, or 3 hours 14 minutes. Average Length of Opera Rehearsals: All Average (minutes) Average length (minutes) Orchestras (n=127) by Country Minimum Maximum Range Affiliated with a Broadcaster Affiliated with an Opera/Theatre Other Total It is interesting to note that the average length of a rehearsal for an orchestra attached to a Broadcast institution is longer at 4 hours 10 minutes, than all other orchestras, including those affiliated with an Opera/Theatre (3 hours 12 minutes). However, when looking at the maximum length of rehearsals across these different cohorts, they are shown to last up to 7 hours among all orchestras other than those attached to a Broadcaster. Where a range is provided for orchestras (i.e. a minimum and a maximum length), we can see that orchestras based in Sweden and Japan both claim to have rehearsals for operas that can last up to 420 minutes, or 7 hours; significantly longer than the 3¼ hour average for the entire sample. However, there is little significant variation according to country or region. Average Length of Opera Rehearsals: All Average length Average (minutes) Orchestras (n=84) by Country (minutes) Minimum Maximum Range Belgium Luxembourg Germany Austria Finland Israel NZ Switzerland UK Slovakia France Hungary Denmark Sweden Norway Japan Recording Rehearsals The average rehearsal when preparing for a recording across the entire sample (of 73) lasts a minimum of minutes, or just over 3 hours. The maximum length of a rehearsal for a recording is 216 minutes, or 3 hours 36 minutes. The mean average length for a recording rehearsal across this cohort is 208 minutes, or 3½ hours. For those orchestras attached to a Broadcast institution, rehearsals for recordings are on average almost 40 minutes 40
41 longer than this however; in some cases lasting up to 6 hours. For orchestras affiliated with an Opera/Theatre, rehearsals for recordings tend on average to be shorter than this, with an average minimum length of 167 minutes (2 ¾ hours) and a maximum average of 191 minutes (3 hours 10 minutes). They can on occasion last up to 5 hours though. For all Other orchestras, rehearsals for recordings can last up to 7 hours, although the average maximum length is 232 minutes (3 hours 50). Average Length of Recordings Rehearsals: All Average length Average (minutes) Orchestras (n=73) by Type (minutes) Minimum Maximum Range Affiliated with a Broadcaster Affiliated with an Opera/Theatre Other Total It is interesting to note that orchestras based in Lithuania have on average rehearsals for recordings that last significantly longer than the average across the entire sample (of 73), at 7 hours. That said, orchestras in Sweden also tend to have rehearsals that can last this long, although on average the maximum length is just over 5 hours (305 minutes). Orchestras based in Austria have the shortest rehearsals at only 2½ hours. There is no real variation in the minimum and maximum length of rehearsals for recordings according to Country or Region. Average Length of Recordings Rehearsals: All Average length Average (minutes) Orchestras (n=73) by Country (minutes) Minimum Maximum Range Austria France Switzerland Germany Hungary Israel Luxembourg UK Slovakia Brazil Finland Denmark Belgium Norway Sweden Lithuania In comparing the length of rehearsals for concerts, operas and recordings across the entire sample by type of orchestra, we can see that those attached to an Opera/Theatre tend on average to hold shorter rehearsals than all other orchestras. Those affiliated with a Broadcast institution tend on average to hold longer rehearsals for Operas and Recordings than all other orchestras. 41
 give their musicians 1 day off per week; 6% of them give their musicians between 1 and 2 days a week; and the remaining")
")
42 12. Number of Days Off per Week No orchestras give their musicians more than 2 days off per week. The majority of orchestras (72/103) give their musicians 1 day off per week; 6% of them give their musicians between 1 and 2 days a week; and the remaining 25 claim to give their musicians 2 days off per week. 29% informants state that their respective orchestras determine the day/s that musicians are entitled to take off during the week; the remaining 90 (71%) so not. There does not appear to be any variation in whether days are pre-fixed or not for musicians according to country or region, or by type of orchestra. 42
.")
43 13. Paid Leave In seven orchestras (4% of the total), musicians do not receive paid leave: this includes all those based in Israel. 10 informants state that paid leave is applied for on an individual, case-by-case basis or applies for only certain categories of employment (Section Principals and Concertmasters). 3 state only that a discretionary allowance exists for compassionate leave. In several other cases, leave allowance is calculated as a percentage of musicians salaries or as an equivalent to a certain number of duties. For those orchestras which detail the amount of paid leave, as it applies across all their musicians, the modal average number of weeks across the year is 6. The mean average across the sample is slightly higher at 6.4 weeks. Orchestras based in Canada, Japan, Panama and the UK all take fewer weeks paid leave than the overall average. Comparatively, orchestras based in Mexico and Lithuania take 2 weeks more per year; although this is based on so small a sample as to render this average insignificant. 43
44 The UK appears to take one week less than the rest of Europe as paid leave (5 weeks). Orchestras based in France, Norway and Germany appear to be in line with those based in the United States in giving their musicians between 6½ and 7 weeks paid leave per year. Orchestras affiliated with a Broadcast institution tend to give slightly less paid leave that the average across the entire sample: between 5 to 6 weeks. The range in number of weeks across all other types of orchestra is 1 to Conditions of Leave 35% of orchestras take their holiday entitlement in one go; generally over the summer which in many cases is said to coincide with theatre holidays. 31% indicate that their yearly allowance is to be taken in at least two parts; this tends to comprise one break taken over the summer months (August/September), and another over the Christmas / winter period, which may or may not coincide with School Holidays. 15 informants merely state that leave is taken collectively and applies to the entire orchestra. 15. On-call Duty Average No. Weeks of Paid Leave p/year: All Orchestras (n=70) by Country Mean Average No. Weeks Paid Leave p/year Canada 3.1 Japan 4 Panama 4 UK 5 Hungary 6 France 6.4 Sweden 6.5 Luxembourg 7 Norway 7 Germany 7.1 US 7.1 Switzerland 7.5 Mexico 8 Lithuania 8.4 Total 6.3 Average No. Weeks Paid Leave p/year: All Average No. Weeks Paid Leave Orchestras (n=69) by Type p/year Range Affiliated with a Broadcaster weeks Affiliated with an Opera/Theatre weeks Other weeks 54% of orchestras have an on-call system in place; 24% do not. The remainder of the sample either did not know or did not respond. Of those that do have an on-call system in place, it is in only 32% of cases for which musicians are compensated for being on-call. 68% of orchestras with an on-call system therefore do not compensate their musicians. 44


45 16. Other Activities In 96% of orchestras, musicians are allowed to hold a teaching position in a conservatory or a music school whilst employed by the orchestra. 45

 and those that do not (46%).")
46 82% of orchestras state that their employer does allow/support individual performance activities outside the orchestra said that this was the case. 18% said that they were not permitted to engage in individual music activities. E. Recordings 1. Contractual Arrangements for Recordings 21% of orchestras surveyed make no contractual arrangements for recordings for musicians. Of the 79% that do have contractual arrangements for recordings, they are split almost equally between those that include recordings in musicians salaries (54%) and those that do not (46%). 100% of those affiliated with a Broadcast Institution make contractual arrangements for recordings and, as perhaps would be expected, they are included in musicians salaries. 78% of the remaining orchestras (both those attached to an Opera/Theatre and all others) have such arrangements in place. 61% of those attached to an opera/theatre do not include such arrangements in musicians salaries; whereas 53% of all Other orchestras do include recordings in musicians salaries. 46

47 Contractual Arrangements for Recordings: Contractual Arrangements for Recordings All Orchestras (n=157) by Type None Yes: Salaried Yes: Not Salaried Affiliated with a Broadcaster 0 100% 0 Affiliated with an Opera/Theatre 22% 30% 48% Other 22% 53% 25% There is some variation in the number of orchestras that have contractual arrangements in place for recordings according to the region in which they are based. In all regions, with the exception of Oceania (based on the one orchestra from New Zealand), the majority of orchestras do have contractual arrangements in place for recordings. In most cases, recordings are not included in musicians salaries. The exceptions are in Israel, where only half of the orchestras based there do include recordings in musicians salaries. In Europe, 70% of orchestras who do have arrangements in place include recordings in musicians salaries. Contractual Arrangements for Recordings Contractual Arrangements for Recordings: All Orchestras (n=157) by Region None Yes: Salaried Yes: Not Salaried Europe 23% 54% 23% North America 7% 3.5% 92.5% Oceania 100% 0 0 Middle East 0 50% 50% Central / South America 25% 0 75% Asia 40% 20% 40% 47
 or no entry at all (for which an n/a was entered).")

48 2. Average Number of Recordings per Year Of the 164 orchestras surveyed, data concerning the number of recordings each orchestra undertook/produced each year was available for only 135 of them; with 29 recording either a Don t Know (2 in total) or no entry at all (for which an n/a was entered). 3 of the informants who provided an indication as to the number of recordings undertaken per year do not detail whether arrangements are made for them in musicians contracts. The majority of informants chose to respond to this question with a single number. It is unclear, however, whether this number refers to separate recording sessions (irrespective of length), or the number of recordings produced through a series of recording sessions. Recordings Arrangement Total Number of Recordings p/yr Average Number p/yr Don t Know / N/A None Yes: Salaried Yes: Not Salaried Total
49 The average number of recordings produced/undertaken per year across the sample of 135 orchestras included in this question is 6.3. Between them, they produce a total of 846 recordings. In most cases (93%), these recordings are included as contractual duties; though they are included in musicians salaries in only slightly more than half of them (or 49% of the total). Those musicians for whom recordings are not part of their contractual arrangement produce a smaller number of recordings per year, with an average of 2.6. Nearly 90% of orchestras surveyed included in this analysis do undertake / produce at least one recording per year. Just over half (52%) produce between 1 and 4 recordings per year on average. A significant number produce more than this: with 21.5% of orchestras averaging between 5 and 10 recordings per year; 16.2% averaging anything from 11 to more than 50 recordings per year. It is not perhaps surprising that those orchestras attached to a Broadcast institution produce the most number of recordings per year highest on average, at That said, this figure is skewed by the 1 orchestra that claims to undertake 55 recordings per year: without which, the average across this cohort of 7 would be 8. Nevertheless, this is still higher than the average number of recordings undertaken by the rest of the sample, which is calculated to be 5.4 for orchestras affiliated with an Opera/Theatre and 6.3 for all others. Average No. Recordings p/year: Total Orchestras (n=135) by Type Average No. Recordings p/year Range Affiliated with a Broadcaster Affiliated with an Opera/Theatre Other Total Average No. Recordings p/year: All Orchestras (n=135) by Region Average No. Recordings p/year Total No. Recordings p/year Europe N.America Middle East C./Sth.America Asia Comparing regions, orchestras in Asia and the Middle East produce the most number of recordings per year on average at 10.7 and 10 respectively. Those based in Central and South America produce the fewest per year on average, with only 1.4. Those in Europe and North America produce on average 6 and 8 per year respectively. Country Average No. Recordings p/ year Lithuania 1 Finland 1.5 Macedonia 2 Slovakia 2.6 Sweden 2.6 Denmark 2.8 Luxembourg 3 Norway 3.1 Switzerland 4.9 Belgium 5.8 Germany 6.6 France 6.8 Hungary 8.3 UK 9.7 Austria 15 49

50 Looking specifically at the orchestras based in Europe, Lithuania and Austria have the lowest and highest averages respectively. Those countries with the largest cohorts included in the survey vary quite widely around the average of 6.3; with those based in Sweden undertaking only 2.6 per year on average, and those in the UK almost 10, although 3 of these are affiliated with Broadcasters and as such would be expected to have a higher average than most. Those based in Germany and France produce roughly the same number of recordings per year as is suggested by the average for the total sample of 135. F. Touring 1. Number & Length of Tours per Year 10% of the entire sample does not tour throughout the year; although several state that they (instead?) occasionally have invited guests perform with them. 59% of the entire sample claim to tour at least once every two years (the majority tours significantly more than this). The average number of tours undertaken by the 101 orchestras for which specific information is available comes to 4.4, although this number refers to all kinds of tours foreign and domestic, including day trips, short trips and single trips to other cities which many informants chose to list under this question. On the other hand, some chose to merely record the total number of days per year that constitute domestic tours. The majority did not make a distinction between foreign and domestic tours, choosing instead to provide a single number for the number of tours undertaken each year. Clearly, the definition of what constitutes a tour is a somewhat broad, and as such it is somewhat difficult to make comparisons across and between orchestras. Middle East Orchestras based in Israel generally tour only once per year, abroad, for an average of 7 to 10 days. Asia The average number of tours throughout the year for orchestras India is 30 tours, each of which lasts an average of 5-6 days. The average number for those in Japan is between 5 and 6 tours per year, each of which lasts approximately 3 to 4 days. Central & South America Orchestras in Panama claim to undertake 1 national tour per year, covering 10 cities, although no information is provided as to how long this tour lasts. They also play abroad once a year, on trips that are said to last only 2 days. Those in Brazil tour an average of 6 times a year, each of which lasts between 1 to 3 days. Orchestras in Mexico state tour rarely, although when they do occur the trips last between 3 and 8 days. 50
51 North America No information was sourced for orchestras based in this region. Oceania Orchestras based in New Zealand undertake 1 to 2 tours per year, each of which lasts approximately 36 days. Europe Orchestras in Switzerland undertake an average of 3 tours per year: though this ranges across the sample from a single 1-week tour per year to 5-6 tour per year each lasting anything up 14 days. Orchestras in Austria orchestra tour around of three times a year, for an average of 8 days. Those based in Belgium tour 1 to 2 times per year, ranging in length from 3 to 10 days. The average number of days each orchestra performs outside of their home-town per year amounts to 13 days per year. It is difficult to compare the tour schedules for the orchestras based in Denmark, since they provide information of such varied form. One claims to tour abroad once every 2-3 years, in addition to several day-trips per year. Another tours abroad once a year for around a week; the other makes one three-day tour abroad per year in addition to 25 one-day trips in their home country. Orchestras in Finland tend to make between 1 and 3 tours per year, lasting anything between 2 and 14 days. 22% of orchestras based in France tour only once every couple of years, for 5 to 10 days. 67% make between one and three trips per year, in most cases lasting no more than 8 days, although a handful claim to tour for up to 2 weeks. 26% of orchestras based in Germany that provide information pertaining to tours either do not tour or do so extremely rarely, aside from the occasional 1-day domestic trip. The remaining orchestras tend on to spend an average of 8 days in total touring per year. The average number of trips across this cohort is 5 per year. The orchestras based in Hungary undertake between 2 and 10 tours per year, for between 5 and 7 days. The average number of days in total each orchestra appears to spend touring is 33 days per year. The orchestras surveyed which are based in Italy tend to tour 4 times per year, for an average of 8 days. Those in Lithuania make 1 or 2 foreign trips per year, lasting anything up to 10 days at a time. This is in addition to regular concerts in cities outwith their own each year, each constituting a single day-trip. Those based in Luxembourg tour abroad on average twice a year. Orchestras in Macedonia tour 2 to 3 times per year, with each trip lasting between 2 and 4 days. Norwegian orchestras tour at least once a year lasting anything from 2 days to 2 weeks. The orchestras surveyed that are based in Sweden do all make tours of some kind; although the number of trips ranges from only once (abroad) every couple of years for between 1 and 2 weeks, to up to 7 domestic tours per year for around a week. All of the orchestras from Slovakia claim to undertake tours of some type: half of them do so 2 to 3 times throughout the year for anything up to three weeks. The other half make between 4 and 8 trips a year for between 7 and 10 days. 86% of the total sample of orchestras based in the UK tour at least once every two years. 21% of them tour abroad once or twice a year for between 5 and 10 days; 28% undertake between 1 and 5 domestic tours each year ranging in length from 2 days to 5 weeks. Among those that do not specify if their tours take place on domestic soil or abroad do, one claims to tour 3 times a year, each lasting 8 weeks; 50% undertake 1 to 3 tours per year, of between 4 and 14 days in length; 40% tour for 5 to 6 days on average, about 7 times a year. 51
52 2. Limits on Travel 75 of the 164 orchestras surveyed provided no information as to the Limits that exist on travel: this number includes the 31 orchestras based in North America for which all data collated for them was drawn from published sources. Two informants merely entered Yes in response to this question [Ref. 108 & Ref. 115], suggesting that there are some conditions which limit travel arrangements, though it is unclear as to what these may be or who is responsible for setting them. 12% of orchestras apparently have no formal standards in place restricting or determining the conditions of travel when touring. Several others state that the limits on travel depend on the nature of the tour and the length of each journey. A handful of orchestras make reference to broader National standards for travel and the legal systems in their respective countries as the prime determinant in limiting orchestral musicians travel: these include the European Bus Driving Standards (in Hungary). In 9% of cases, orchestras are bound to the contractual and broader Collective Bargaining Agreements by which musicians in their respective countries and regions are employed. For instance, those in Germany ensure the conditions for travel adhere to those laid out by the TVK; those in the UK refer specifically to those agreements their orchestras negotiate with the Musicians Union (MU) and in some cases the Association of British Orchestras (ABO). Orchestras in Austria and France similarly refer to the collective agreements for employment in their respective countries. 3. Working Hours The conditions placed on the length of tours and working weeks vary widely across the sample of orchestras; from limiting the number of days musicians tour per year to 120; to limiting the length of time any one tour should last to a maximum of anything between 21 and 35 days at a time. In several cases, the hourage for rest and work time per week are as at home, and thereby limiting the working week to 40 hours, or 12 hours a day, to ensuring 8 hours of rest are taken in any 24-hour period. A number of orchestras afford their musicians one day off (free of work duties and travel) per 6-7 days, although in most cases this means 24 hours free after working for 4-5 days consecutively (this may consist purely of concert performances or concerts and other duties). In only one case is it stated that musicians may not get a day off whilst on tour; and in another the journey day is itself counted as the day-off. Whilst on tour, most musicians appear to be entitled to anything between 15 minutes rest and 3 hours on arrival at their destination after travelling, depending on their schedule. In one case, the evening of arrival is set aside for the orchestra as free-time to do with as they wish, as is the following morning. In Denmark, musicians are variously entitled to anything from one to five hours rest between rehearsals and concert performances. In the UK, several orchestras relieve musicians from their on-call responsibilities during meal breaks. Several orchestras count a journey of more than 4 hours as a duty or in someway remunerate for such a journey. 4. Length of Journey In the majority of cases, informants detail the limits that exist on travel arrangements with reference to the maximum time any journey may be per day, and how long they can go without a rest-stop. In the UK, there is a limit on the number of miles orchestras can travel on any one day: set in the majority of cases at 250 miles; in one case it is 180 miles with the caveat that the orchestra are either home or at their lodgings by 2am. In Hungary, this limit is 1000km. In a handful of cases the limits on journey times and distance relates specifically to travelling on a concert day. For instance, several orchestras limit journeys to a maximum of 4.5 hours when they are due to perform that day. 52
 rather than by")
53 On days where the orchestra is not due to play a concert, the maximum length of any journey is set between 5 and 13 hours. Journeys tending towards the upper end of this scale tend to be in cases where orchestras are travelling by public transport (with musicians not, therefore, having to drive themselves) rather than by car. In Mexico and in several Swiss and French orchestras, the limit on travelling by bus is lower than this average, at around 3 hours; although this could refer to the maximum time they can travel without a rest-stop rather than the maximum journey hours per day. Several orchestras in Sweden and Belgium limit journey time on a non-concert day to 5 hours; Others based in Europe (21% of the total sample) travel for a maximum of 6-7 hours in any one go; half as many have a higher maximum journey time of 8 to 10 hours. In general, breaks whilst travelling are set per 2-4 hours of journey time. It is typical for orchestras to take a rest-stop every 2 to 2.5 hours, for anything between minutes. 5. Conditions of Transport Information pertaining to the standards and modes of travel is minimal: several of the orchestras based in France specify that when using the train, they travel 1st class, and economy class when flying. In Brazil, orchestras will always have their musicians travel by air for journeys of more than 500km. 50% of those based in Japan state that they fly only when absolutely necessary, and as a point of principle use the train rather than travel by road. 7% of those based in the UK aim to provide a minimum of 3 seats per two people on tour coaches. 6. Does travel time count as service? 66% of orchestras do count travel time as service. 34% do not; although in two cases, travel expenses are reimbursed. The majority of orchestras in Europe and Central and South America do count travel as service. In contrast, the majority in North America do not count travel as service. The entire cohort based in Asia do count travel as service; none in Middle East do. 7. Daily Allowance (Per Diem) 10% of orchestras state that their per diem allowance varies and/or depends on the country in which they areis in at the time. Another 9% state that the amount is negotiated with management and/or attached to the Collective Agreement to which the orchestra is bound. Just under 50% of orchestras provided figures as to the actual amount of daily allowance their musicians receive whilst on tour. The average per diem allowance across this sample is Orchestras based in Asia tend to award their musicians the highest per diem allowance on average, at just over 100. The rest of the sample tend to cluster quite tightly around the overall average, with orchestras in the 53

54 Middle East being just slightly higher with 46.54, and Europe just 1 below. Those based in Central and South America have the lowest per diem, followed by those in North America. There is great variation in the average per diem allowance across countries based in Europe. Orchestras based in Germany have the lowest average at only which, is considerably less than the UK (the only other country with a comparatively sized sample) who give their musicians more than twice this amount. Orchestras in Italy appear to have an average per diem of 120, although the sample on which this is based is too small to consider this result significant. Average Per Diem allowance on tour: Europe (n=42) Average Per Diem ( ) Germany Sweden Belgium France Hungary Denmark UK Switzerland Norway Luxembourg Italy Total Quality of Hotel 86% of orchestras that responded to this question claim to always have their musicians staying in a hotel with a minimum of 3 stars when on tour. 3% guarantee their musicians a five-star hotel. The one orchestra that claims to use only 1-star accommodation is based in Slovakia. Category of Hotel Europe Asia Oceania Middle East C./Sth. America Total 1-star 1% 1% 2-star 11% 50% 50% 20% 13% 3-star 47% 50% 100% 50% 20% 47% 4-star 40% 36% 5-star 1% 50% 3% 54


55 9. Single Rooms 79% of orchestras who responded to this question do provide musicians with single rooms, whereas 21% of them cannot guarantee this. None of the orchestras based in either Oceania or the Middle East guarantee their musicians single rooms whilst on tour. The majority of those based in Europe, Asia and North America can do so. Only 25% of those in Central and South America can ensure their musicians get to stay in single rooms. When looking specifically at the countries based in Europe, we can see a correlation between the quality of hotel in which musicians generally get to stay when on tour and the degree to which they will be guaranteed a single room. All of those orchestras that use hotels of only 4-star and above can always guarantee their musicians single rooms. For those at the lowest end of the scale of accommodation, musicians are likely to have to share rooms. 55


56 G. Organisation & Employee Relations 1. Representation The large majority of Orchestras surveyed (82%) have their musicians represented in some way on the Orchestra / Delegation Committee. Only 75% of orchestras claim to have their musicians represented by a Union steward or on a Union-based committee. 46% of orchestras have musicians represented in some way on their artistic committees. 20% of orchestras have their musicians represented on other types of committees or forums, in addition to the aforementioned; in half of these, it is a specific Workers / Players committee. 27% of this total of 157 orchestras claim their musicians are represented in only one form: 57% of them state this is in the form of a delegation/orchestra committee; 5% state musicians are represented on the artistic committee; and 38% state it is by way of a Union steward or committee. 40% of orchestras therefore claim that their musicians are represented on 2 of these forums. Musicians are represented in some form or another across all three forums in 33% of orchestras. 56

57 There does not appear to be any regional variation across the sample, other than to say that musicians in orchestras in Europe appear to be represented in more ways than other regions. The published documents from which data was drawn for the 31 orchestras based in North America indicate that musicians in all but 2 of them are represented in all three forms of a delegation / orchestra Committee, an Artistic Committee and through Union representation. Representations across All Orchestras (n=164) by Region Delegation/ Orchestra Committee Type of Representation Artistic / Programming Committee Union Steward / Committee Work/Players Committee Europe 81% 33% 67% 12% 12% Asia 20% 60% Central / South America 75% 50% Middle East 50% 100% 100% North America 97% 100% 97% Oceania 100% 100% 100% Total 81.71% 43.9% 71.95% 10.98% 12% Musicians working in orchestras that are affiliated with a Broadcast institution are in every case represented on their orchestra s delegation committee. This compares to only 88% of orchestras that are attached to an Opera/Theatre and 70% of all others that claim to have their musicians represented on their delegation committee. All orchestras tend in general to have musicians represented on their artistic and programming committees less often: with just over half (54%) those attached to an Opera/Theatre claiming to have such representation, but it is only in 38% of orchestras those attached to a broadcaster and 28% of all others that make a similar claim. A larger proportion of the orchestras attached to a broadcaster appear to have their musicians represented in the form of a Union steward and/or Union committee than in orchestras of other types, although the sample sizes vary so much as to make the comparison insignificant. Other Representation across All Orchestras (157) by Type Delegation/ Orchestra Committee Artistic / Programming Committee Union Steward / Committee Work/ Players Committee Affiliated with broadcaster 100% 38% 88% 13% 25% Affiliation with Opera/Theatre 88% 54% 74% 11% 7% Other Affiliation 70% 28% 67% 10% 8% Other 2. The Composition of Committees Very little information is available pertaining to the composition of these committees (in a form similar to that discussed regarding audition and dismissal panels). In North America, the number of musicians that sit as members on these organizations Orchestra Committees ranges from 5 to 10. In Slovakia, the average Orchestra Committee is comprised of 9 members (which includes at least one Union official). 57

58 Among those Orchestras surveyed from the United States and Canada, number of musicians sitting on their respective Artistic Committee ranges from 5 to 15, depending on the size of the Orchestra. 3. Collective Agreements in Place Of the sample of 121 that provided responses to this question, 26.22% claim to have at least 1 collective arrangement in place. 72% of the total sample employ an Orchestra Arrangement; 45% employ a Branch Agreement; and 17% employ a Broader Agreement. A smaller proportion of orchestras affiliated with an Opera/Theatre have an Orchestra-specific collective agreement in place (66%) than either those attached to a broadcaster (100%) or any Other orchestra (75%); but more of them employ Branch-specific agreements (54%, in comparison to none and 40% respectively). In general, a relatively small number of orchestras employ collective agreements that extend beyond the Orchestra itself or the branch (17%). Types of Collective Agreement in Place: Type of Collective Agreement All Orchestras (n=121) by Type Orchestral Branch Broader Affiliated with a Broadcaster 100% % Affiliated with an Opera/Theatre 66% 54% 15% Other 75% 40% 21% Total 72% 45% 17% Of the 121 Orchestras that claim to have collective agreements in place, 28% employ at least 2 kinds. Of those, almost half of them (47%) have Orchestra and Branch Agreements, and 29% have Orchestra and Broader agreements in place. Almost 6% of the total sample has Orchestra, Branch and Broader Agreements in place. Orchestral Orchestral & Broader Broader Orchestral & Branch & Broader Agreements Branch & Broader Branch 58 Orchestra & Broader
59 4. Type of Collective Agreements in Force by Type: Europe All the orchestras based in the Middle East, in Central and South America and in Asia claim to have only one type of agreement in place. It is only in Europe that orchestras have all three kinds of agreement in place, albeit only 6% of them. The bulk of those in Europe (72%) have orchestral agreements in place, whereas less than half of them use Branch-specific agreements (47%), and only 18% have a broader agreement in force. Types of Collective Agreement in Place: All Type of Agreement Orchestras (n=121) by Region Orchestral Branch Broader Single Agreement All Three Europe 72% 47% 18% 70% 6% Middle East 100% 100% North America 100% 100% C. / South America 75% 25% 100% Asia 60% 40% 100% 70% of orchestras based in Europe currently employing a single agreement specific to either the Orchestra, or the branch or some broader framework. 24% are employing two forms of collective agreements: 5. Forms of social dialogue within the orchestra The majority of orchestras do engage in some form of social dialogue, although the responses to the question of what forms of communication existed within the orchestra were very varied. Opportunities for social dialogue are clearly varied and numerous, clearly dependent on the dynamic of the orchestra. They can summarised as follows: General / Information / Orchestral Meetings 10% of orchestras (the bulk of which are German) hold General discussion meetings when and if required. For some others, meetings are noted to be regular though rarely fixed. The nature of these meetings ranges from the exchange of information and the arrangement of duties to the discussion of problems and union matters. In many cases, they are called as-and-when needed depending on the topic at hand, which in all cases is said to be a regular occurrence. Orchestras tend to meet up in the form of a Full Orchestra Meeting, General Meeting or Conference, though they differ in the number of times this occurs throughout the year. In several cases, it is monthly; the majority meet between once and four times a year. Occasionally, the Full Orchestra is said to meet up with the Orchestra committee, with management and/or with the Administration. Official Committee Meetings In only a handful of cases is it explicitly stated that there is open and free exchange within the orchestras; responses primarily detailed the more formal forms of dialogue that exist. A large proportion of informants indicate that it is through the committee forum that musicians have the opportunity to discuss their work. Union Representation appears to be one of the more common forms of dialogue within orchestras, where employees are able to communicate to the organisation via their Union Steward s attendance at various meetings (particularly those of the Orchestra Committee). In some cases, special meetings are held between the Union officials and the Orchestra employees. Meetings are held between the Union Steward and/or Union Officials and the Orchestra Committee, Management/Executive and Administration and perhaps unsurprisingly have the express purpose of negotiating the Collective Agreement for employees; as well as general company policies and procedures for things such as health and safety, family leave, sick leave etc. 10% of informants indicate that the Orchestra Committee is one of the primary means of communicating with each other and with management. Similarly, another 10% highlight the Artistic Committee (and/or the Programme Committee). 6% of orchestras (all of them German) list the Employees or Workers Committee as an important forum within the Orchestra. Other official forums that were shown to exist include, as would be expected, meetings of the Board and Senior Management and Meetings between the Executive and the Conductor. It is not made clear whether musicians are represented in these instances. 59
60 Cross-Committee Meetings As would be expected, it is common practice for various committees and orchestra departments to meet: Regular meetings between the Orchestra Committee and the Administration. In some cases, they are weekly. In others, it is between 10 and 12 times a year. Regular meetings between the Orchestra Committee and Management the nature of which is stated to include finalisation of working schedules, specific problems, collective/individual grievances, and contractual/artistic matters. Regular meetings between Employers / Board / Management and Union representatives. These findings should be read in the context of those from question 1: where in more than 80% of the orchestras surveyed, musicians are represented on the Orchestra Committee, and in 72% of cases, there is some form of Union representation. As such, it is highly likely that the forms of social dialogue does include meetings between these groups in far more of the orchestras surveyed here than is suggested by the findings drawn from the questionnaires. This relates also to the absence of detail in the completed questionnaires regarding the non-committee based forms of communication and discussion among musicians. Topics of Discussion and Efficacy of Communicative Modes There is little to no data relating to the quality of these dialogues; irrespective of their type. Informal Dialogue / Social Events Parties were mentioned specifically by several respondents as one of the more informal kinds of social events that take place. In some cases these are fixed and occur at regular times through the year: in one case the biannual Orchestra parties are sponsored by an external organisatio; in another, two members from the Players Committee are appointed to the Governing Board to oversee the organisation for the orchestra s Christmas Party. Other forms of socialising listed include season opening and ending parties, after-concert arrangements and collective events involving sports and exercise (incl. yoga class in breaks ) and in one case, group therapy for some sections. Opportunities to interact socially with each other in a less formal manner also exist for musicians by way of the facilities available to them on a day-to-day basis. Few respondents chose to list within their answers the kind of informal dialogue that occurs in the pub, though it is highly probable that this was presumed to not be relevant to the research. Several explicitly mentioned chatting in the canteen and the pub and hanging out in the bar and café in the workplace : all of which are Scandinavian. What they highlight is the value to musicians of spaces backstage to the typical rehearsal or performance sites in which they can relax and talk on a more personal level to that permitted in public and official forums such as committee and general orchestral meetings. In looking at the state of each orchestra s Green Room (if there is one), it is clear that the opportunities for engaging in such informal dialogue is clearly limited by the relative space, and in many cases absence, of such places. Other Other means by which musicians can communicate with themselves and other members of the Orchestra include: s personal interviews with the Director and/or Board and/or Management and individual meetings with other departmental contacts [in one case, the Safety Deputy]. H. Instruments 1. Employee Responsibility for Damages to Instruments 87.4% of orchestras for which there were responses for this question do take responsibility for damages to instruments during duty; 12.6% do not. There does not appear to be any significant variation across orchestras of either different type or country. 60


61 2. Bonus for the upkeep and maintenance of instruments 70% of orchestras for which there were responses to this question do provide a bonus to musicians for the upkeep and maintenance of their instruments; 30% do not. There does not appear to be any significant variation across orchestras of either different type or country. 3. Assistance for the purchase of instruments 43% of orchestras for which responses were provided to this question do provide assistance for the purchase of instruments. The majority (57%) do not. 61
62 J. Insurance 1. Cover for Occupational Injuries Those WITHOUT Cover 10% of orchestras state that their employers do not provide cover for occupational injuries; this includes all orchestras based in Macedonia and Lithuania. None of the orchestras included in this sample that are based in Canada provide medical care or life insurance for their musicians, but will pay musicians for up to 8 working days or up to 12 services missed through sickness. Those WITH Cover 88% of the entire sample claim to provide Cover to their musicians for occupational injuries. Only 75% of them provide any detail as to the types of risk that are covered. 4% of those with cover all of which are based in Germany have Community Accident Insurance in place. Similarly, 2% merely indicated that some form of Professional Assurance was in place for musicians. Another 2%, both based in Slovakia, refer to the National Labour Code on Work Safety and Health Protection as the chief means by which injuries, accidents and work-related problems are handled, and to which musicians would defer in the case of a work-related issue pertaining to loss, theft, injury, sickness or death. 14% of orchestras merely state they have insurance in place that covers everything or all risks. 2. Types of Risks Covered 31% orchestras offer insurance which cover accidents caused in or in the process of travelling to or from the workplace. 7% state that travel incidents are NOT covered in addition to those occurring in the workplace; in 1% of cases, the opposite is true. 9% of orchestras in total state that musicians are covered for damage to, theft or loss of their instruments; 60% of this cohort are also covered for work/travel-related accidents. 40% of them offer additional insurance for loss or theft of items other than instruments. 32% of orchestras offer Personal Liability Insurance, covering sickness, death and bodily injury. 14% of these specifically mention that loss of hearing, other ear-related problems and other noise-related risks are covered. 11% of orchestras offer insurance which includes cover for all kinds of accidents and personal liability. Only 17% of these offer instrument insurance in addition to this. 62

63 3. Consultation with Musicians over Chairs 81% of orchestras for which responses were provided to this question do consult musicians over the choice of chairs; 16% do not. 4. Special Measures to Reduce Noise-related Risks 83% of orchestras for which responses were provided to this question do have special measures in place to reduce noise-related risks; 17% do not. 63
Efficient, trusted, valued
 Efficient, trusted, valued Your ABC: Efficient, trusted, valued ABC Open Today, the ABC is better value for Australians than ever before. The ABC continues to adopt smarter ways of working and harness
SALES DATA REPORT
 SALES DATA REPORT 2013-16 EXECUTIVE SUMMARY AND HEADLINES PUBLISHED NOVEMBER 2017 ANALYSIS AND COMMENTARY BY Contents INTRODUCTION 3 Introduction by Fiona Allan 4 Introduction by David Brownlee 5 HEADLINES
STUDY OF THE EMERGENCE OF A NEW GENERATION OF EUROPEAN FEMALE FILM DIRECTORS Updated
 STUDY OF THE EMERGENCE OF A NEW GENERATION OF EUROPEAN FEMALE FILM DIRECTORS Updated - 2017 Supported by In partnership with FOREWORD For the 9 th edition of Les Arcs European Film Festival, (16-23 December
BFI RESEARCH AND STATISTICS PUBLISHED AUGUST 2016 THE UK FILM MARKET AS A WHOLE. Image: Mr Holmes courtesy of eone Films
 BFI RESEARCH AND STATISTICS PUBLISHED AUGUST 2016 THE UK FILM MARKET AS A WHOLE Image: Mr Holmes courtesy of eone Films THE UK FILM MARKET AS A WHOLE The UK is the third largest film market in the world,
The Most Important Findings of the 2015 Music Industry Report
 The Most Important Findings of the 2015 Music Industry Report Commissioning Organizations and Objectives of the Study The study contained in the present Music Industry Report was commissioned by a group
Musicians, Singers, and Related Workers
 http://www.bls.gov/oco/ocos095.htm Musicians, Singers, and Related Workers * Nature of the Work * Training, Other Qualifications, and Advancement * Employment * Job Outlook * Projections Data * Earnings
THE UK FILM ECONOMY B F I R E S E A R C H A N D S T A T I S T I C S
 THE UK FILM ECONOMY BFI RESEARCH AND STATISTICS PUBLISHED AUGUST 217 The UK film industry is a valuable component of the creative economy; in 215 its direct contribution to Gross Domestic Product was 5.2
2018 GUIDE Support for cinemas
 Strasbourg, 15 December 2017 2018 GUIDE Support for cinemas SUMMARY I Introduction 3 Support for cinemas... 4 Objectives... 4 II - Regulations concerning support for cinemas... 5 1. Eligibility... 5 2.
International film co-production in Europe
 International film co-production in Europe A publication May 2018 Index 1. What is a co-production? 2. Legal instruments for co-production 3. Production in Europe 4. Co-production volume in Europe 5. Co-production
Supplemental Information. Form and Function in Human Song. Samuel A. Mehr, Manvir Singh, Hunter York, Luke Glowacki, and Max M.
 Current Biology, Volume 28 Supplemental Information Form and Function in Human Song Samuel A. Mehr, Manvir Singh, Hunter York, Luke Glowacki, and Max M. Krasnow 1.00 1 2 2 250 3 Human Development Index
Composer Commissioning Survey Report 2015
 Composer Commissioning Survey Report 2015 Background In 2014, Sound and Music conducted the Composer Commissioning Survey for the first time. We had an overwhelming response and saw press coverage across
2017 GUIDE. Support for theatres
 2017 GUIDE Support for theatres SUMMARY I Introduction 3 Support for theatres... 4 Objectives... 4 II - Regulations concerning support for theatres... 5 1. Eligibility... 5 2. Support access threshold...
A BIBLIOMETRIC ANALYSIS OF ASIAN AUTHORSHIP PATTERN IN JASIST,
 A BIBLIOMETRIC ANALYSIS OF ASIAN AUTHORSHIP PATTERN IN JASIST, 1981-2005 HAN-WEN CHANG Department and Graduate Institute of Library and Information Science, National Taiwan University No. 1, Sec. 4, Roosevelt
UK RULES OF DISTRIBUTION Appendix
 UK RULES OF DISTRIBUTION 2012 A. Types of Work Appendix A. DRAMA (including Comedy) i Single Drama A one off single story transmitted in one or more parts with all parts directed by the same director.
Global pay TV revenues crawl to $200 billion
 Global pay TV revenues crawl to $200 billion Based on forecasts for 80 countries, pay TV revenues will climb to US$200 billion in 2017, up by US$23 billion on 2011 but up by only US$2 billion (1%) on 2016,
Media Salles - Digital Cinema Training Helsinki, Saturday 20 th February. Guillaume Thomine Desmazures
 Media Salles - Digital Cinema Training Helsinki, Saturday 20 th February Guillaume Thomine Desmazures ALTERNATIVE CONTENTS Opera & Ballet ROYAL OPERA HOUSE 18 Events -Summer 2008 Season -Sept 08 July 09
UK Television Exports FY 2013/2014
 UK Television Exports FY 2013/2014 Page 1 of 5 The annual UK Television Exports Survey highlights the popularity of UK programming abroad by collecting revenue figures relating to the international activity
Sunday Maximum All TV News Big Four Average Saturday
 RTNDA/Ball State University Survey 2004 Additional Data: Newsroom Staffing and Amount of News Television Hours of Local TV News Per Day TV News Budgets: Up, Down or Same? TV News Profitability by Size
Planning by the Groningen Arts Centre
 Planning by the Groningen Arts Centre Another opportunity During a meeting on Tuesday, April 6, 1999, executives of the Groningen Arts Centre raised a number of points, including the following. Karin of
Commissioning Report
 Commissioning Report August 2014 Background Sound and Music conducted a Composer Commissioning Survey, which ran from 23rd June until 16th July 2014. We gathered 466 responses from composers engaged in
2018 RTDNA/Hofstra University Newsroom Survey
 Highlights 2018 Staffing Research The latest RTDNA/Hofstra University Survey has found that total local TV news employment has surpassed total newspaper employment for the first time in more than 20 years
FILM POLICY FOR IRELAND S NATIONAL BROADCASTER
 FILM POLICY FOR IRELAND S NATIONAL BROADCASTER 1 P a g e 2015 SCREEN PRODUCERS IRELAND Film Policy for Ireland s National Broadcaster CORE POLICY In most European territories Public Service Broadcasters
BBC Television Services Review
 BBC Television Services Review Quantitative audience research assessing BBC One, BBC Two and BBC Four s delivery of the BBC s Public Purposes Prepared for: November 2010 Prepared by: Trevor Vagg and Sara
FILM POLICY FOR IRELAND S NATIONAL BROADCASTER
 FILM POLICY FOR IRELAND S NATIONAL BROADCASTER 2016 1 Page 2016 SCREEN PRODUCERS IRELAND Film Policy for Ireland s National Broadcaster Screen Producers Ireland is the national representative organisation
Public Service Broadcasting Annual Report 2011
 Public Service Broadcasting Annual Report 2011 Research Document Publication date: 21st July 2011 1 Public Service Broadcasting: Annual Report 2011 Executive summary Ofcom has a duty to assess the designated
Television and the Internet: Are they real competitors? EMRO Conference 2006 Tallinn (Estonia), May Carlos Lamas, AIMC
, May Carlos Lamas, AIMC") Television and the Internet: Are they real competitors? EMRO Conference 26 Tallinn (Estonia), May 26 Carlos Lamas, AIMC Introduction Ever since the Internet's penetration began to be significant (from
Television and the Internet: Are they real competitors? EMRO Conference 26 Tallinn (Estonia), May 26 Carlos Lamas, AIMC Introduction Ever since the Internet's penetration began to be significant (from
Appendix H: International Production Support Program
 Appendix H: International Production Support Program Fear of U.S. as content Hub 630 631 Leads to Protectionism in Content Imports Arguments for Content Protectionism National culture Employment Projection
UK RULES OF DISTRIBUTION Appendix
 UK RULES OF DISTRIBUTION - 2017 A. Types of Work Appendix A. DRAMA (including Comedy) i Single Drama A one-off single story transmitted in one or more parts with all parts directed by the same director.
The circulation of European co-productions and entirely national films in Europe
 The circulation of European co-productions and entirely national films in Europe 2001 to 2007 Report prepared for the Council of Europe Film Policy Forum co-organised by the Council of Europe and the Polish
BROADCAST. The following concepts help ensure the way we distribute revenue to members is equitable.
 BROADCAST Key concepts The following concepts help ensure the way we distribute revenue to members is equitable. Commercial licensee blanket revenues that cover more than one radio or TV station are divided
Bibliometric evaluation and international benchmarking of the UK s physics research
 An Institute of Physics report January 2012 Bibliometric evaluation and international benchmarking of the UK s physics research Summary report prepared for the Institute of Physics by Evidence, Thomson
Jazz Bandleader Composer
 Jazz Bandleader Composer The following is the breakdown of 2006-2011 income for a Jazz Bandleader-Composer, who writes, records and performs his own works and leads and participates in multiple ensembles
Community Choirs in Australia
 Introduction The Music in Communities Network s research agenda includes filling some statistical gaps in our understanding of the community music sector. We know that there are an enormous number of community-based
Motion Picture, Video and Television Program Production, Post-Production and Distribution Activities
 The 31 th Voorburg Group Meeting Zagreb Croatia 19-23 September 2016 Mini-Presentation SPPI for ISIC4 Group 591 Motion Picture, Video and Television Program Production, Post-Production and Distribution
The Communications Market: Digital Progress Report
 The Communications Market: Digital Progress Report Digital TV, 2009 This is Ofcom s twenty-third Digital Progress Report covering developments in multichannel television. The data are the latest available
Legal conditions and criteria for film funding in Europe
 Legal conditions and criteria for film funding in Europe Maja Cappello Head of Department for Legal Information European Audiovisual Observatory Film Funding Schemes A European Overview Podgorica, 11 June
AUDIOVISUAL TREATY COPRODUCTIONS GOVERNED BY CANADIAN TREATIES THAT HAVE ENTERED INTO FORCE AS OF JULY 1, 2014
 AUDIOVISUAL TREATY COPRODUCTIONS GOVERNED BY CANADIAN TREATIES THAT HAVE ENTERED INTO FORCE AS OF JULY 1, 2014 GUIDELINES Ce document est également disponible en français Preamble These guidelines follow
COMMISSION OF THE EUROPEAN COMMUNITIES COMMISSION STAFF WORKING DOCUMENT. accompanying the. Proposal for a COUNCIL DIRECTIVE
 EN EN EN COMMISSION OF THE EUROPEAN COMMUNITIES Brussels, 16.7.2008 SEC(2008) 2288 COMMISSION STAFF WORKING DOCUMENT accompanying the Proposal for a COUNCIL DIRECTIVE amending Council Directive 2006/116/EC
Digital Day 2016 Overview of findings
 Digital Day 2016 Overview of findings Research Document Publication date: 5 th August 2016 About this document This document provides an overview of the core results from our 2016 Digital Day study, drawing
ARTICLE 31. PROGRAMS MADE PRIMARILY FOR THE BASIC CABLE MARKET
 ARTICLE 31. PROGRAMS MADE PRIMARILY FOR THE BASIC CABLE MARKET SECTION A. TERMS AND CONDITIONS FOR HIGH BUDGET DRAMATIC PROGRAMS ONE-HALF HOUR OR MORE IN LENGTH MADE PRIMARILY FOR THE BASIC CABLE MARKET
The FOOTBALL Sponsoring Qualifiers for EURO June. 2010, Ulrike Schmid/Peter Rossegg
 The FOOTBALL Sponsoring Qualifiers for EURO 2012 June. 2010, Ulrike Schmid/Peter Rossegg The Groups and Group A Group B Group C Group D 1 Germany 1 Russia 1 Italy 1 France 2 Turkey 2 Slovakia 2 Serbia
Data will be analysed based upon actual screen size, but may be presented if necessary in three size bins : Screen size category Medium (27 to 39 )
") Mapping Document Country: Technology: Sub Category: All Introduction The first stage in the Mapping and Benchmarking process is the definition of the products, i.e. clearly setting the boundaries that
Mapping Document Country: Technology: Sub Category: All Introduction The first stage in the Mapping and Benchmarking process is the definition of the products, i.e. clearly setting the boundaries that
English National Opera and The Musicians Union. Orchestra Agreement
 English National Opera and The Musicians Union Orchestra Agreement Dated 31 st July 2017 0 INDEX Clause Page 1 Definitions 2 2 Precedent 4 3 Duration of agreement 4 4 Financial provisions and Orchestra
DISTRIBUTION B F I R E S E A R C H A N D S T A T I S T I C S
 BFI RESEARCH AND STATISTICS PUBLISHED J U LY 2017 The UK theatrical marketplace is dominated by a few very large companies. In 2016, the top 10 distributors generated over 1.2 billion in box office revenues,
NAA ENHANCING THE QUALITY OF MARKING PROJECT: THE EFFECT OF SAMPLE SIZE ON INCREASED PRECISION IN DETECTING ERRANT MARKING
 NAA ENHANCING THE QUALITY OF MARKING PROJECT: THE EFFECT OF SAMPLE SIZE ON INCREASED PRECISION IN DETECTING ERRANT MARKING Mudhaffar Al-Bayatti and Ben Jones February 00 This report was commissioned by
Sundance Institute: Artist Demographics in Submissions & Acceptances. Dr. Stacy L. Smith, Marc Choueiti, Hannah Clark & Dr.
 Sundance Institute: Artist Demographics in Submissions & Acceptances Dr. Stacy L. Smith, Marc Choueiti, Hannah Clark & Dr. Katherine Pieper January 2019 SUNDANCE INSTITUTE: ARTIST DEMOGRAPHICS IN SUBMISSIONS
UK FILMS AT THE WORLDWIDE BOX OFFICE
 UK FILMS AT THE WORLDWIDE BOX OFFICE BFI RESEARCH AND STATISTICS PUBLISHED AUGUST 2017 UK qualifying films released at the worldwide box office in 2016 earned one sixth of total global receipts. Rogue
The employment intensity of film and television production in Canada
 The employment intensity of film and television production in Canada July 2011 Prepared for Wit Writers Guild of Canada ACTRA Prepared by Nordicity Highlights Each dollar of ten point Canadian TV production
A year later, Trudeau remains near post election high on perceptions of having the qualities of a good political leader
 A year later, Trudeau remains near post election high on perceptions of having the qualities of a good political leader Nanos Weekly Tracking ending November 18 th, 2016 (released November 22 nd, 2016-6
NANOS. Trudeau first choice as PM, unsure scores second and at a three year high
 Trudeau first choice as PM, unsure scores second and at a three year high Nanos Weekly Tracking ending November 4 th, 2016 (released November 8 th, 2016-6 am Eastern) NANOS At a glance Preferred Prime
Multi Content Market Japan Content Showcase Features of Japan Content Showcase JCS. Online Library. TIMM & Showcase Live TIMM & Free Service
 Multi Content Market Japan Content Showcase 2017 "Japan Content Showcase 2017", a multi content market featuring TV, films, music, and animation, will be held as a joint market of the following: TIMM Tokyo
Community Orchestras in Australia July 2012
 Summary The Music in Communities Network s research agenda includes filling some statistical gaps in our understanding of the community music sector. We know that there are an enormous number of community-based
The ABC and the changing media landscape
 The ABC and the changing media landscape 1 THE ABC AND THE MEDIA LANDSCAPE The Australian media is and always has been characterised by a mix of publicly-funded broadcasters and commercial media operators.
How-To Guide. LQV (Luminance Qualified Vector) Measurements with the WFM8200/8300
 Measurements with the WFM8200/8300") Loudness Measurement LQV (Luminance Qualified Vector) Measurements with the WFM8200/8300 How-To Guide Introduction The patented Luminance Qualified Vector (LQV) Display enhances the current Diamond/Split
Loudness Measurement LQV (Luminance Qualified Vector) Measurements with the WFM8200/8300 How-To Guide Introduction The patented Luminance Qualified Vector (LQV) Display enhances the current Diamond/Split
2018 READER SURVEY REPORT READERS ON READING
 2018 READER SURVEY REPORT READERS ON READING conducted by M.K. Tod author and blogger at www.awriterofhistory.com with support from authors Patricia Sands and Heather Burch Readers On Reading September
Racial / Ethnic and Gender Diversity in the Orchestra Field
 Racial / Ethnic and Gender Diversity in the Orchestra Field A report by the League of American Orchestras with research and data analysis by James Doeser, Ph.D. SEPTEMBER 2016 Introduction This is a time
Israel Film & Television Industry Facts and Figures at a Glance 2017
 Israel Film & Television Industry Facts and Figures at a Glance 2017 Prepared by: Katriel Schory Executive Director Haya Nastovici International Relations Making Films Come True The Israel Film Fund -
Meet The Composer Commissioning Music: A Basic Guide
 Meet The Composer Commissioning Music: A Basic Guide An Introduction to Commissioning To commision music means to pay a composer to write a particular composition for a specific purpose or event. Anyone
Page 1. Musical Director / Conductor Recruitment August 2016 Candidate Information Pack
 Page 1 Musical Director / Conductor Recruitment August 2016 Candidate Information Pack Contents Introduction... 3 Background information about the Wessex Concert Orchestra... 3 Rehearsals... 4 Concerts
THE STATE OF BRITAIN S ORCHESTRAS IN 2016
 THE STATE OF BRITAIN S ORCHESTRAS IN 2016 SUMMARY This survey provides an update on key statistics for the orchestra sector in 2016. The orchestras surveyed represent 84% of the Association of British
The European Printing Industry Report
 The European Printing Industry Report Research and Publication by GAIN (Graphic Arts Intelligence Network) VERSION 2009 (including evolution from 2005 and 2013 forecast) printed products printing processes
BBC Trust Review of the BBC s Speech Radio Services
 BBC Trust Review of the BBC s Speech Radio Services Research Report February 2015 March 2015 A report by ICM on behalf of the BBC Trust Creston House, 10 Great Pulteney Street, London W1F 9NB enquiries@icmunlimited.com
City Screens fiscal 1998 MD&A and Financial Statements
 City Screens fiscal 1998 MD&A and Financial Statements Management's Discussion and Analysis (Note: Fiscal 1998 is for the year ending April 1, 1999) OPERATING RESULTS Revenues. Total revenues increased
SCHEDULE 5 PERFORMER ALLOCATION RULES
 SCHEDULE 5 PERFORMER ALLOCATION RULES A This document sets out the Performer Board s policy, known as the Performer Allocation Rules, regarding how Performer Track Allocation in respect of the exercise
Ofcom's proposed guidance on regional production and regional programming
 Ofcom's proposed guidance on regional production and regional programming Consultation document The Communications Act makes changes to the existing arrangements for a number of programming quotas that
Appendix E: Production. Soap Opera Production. Soap Opera Production
 Appendix E: Television Production 215 Source: Communication / Behaviour Change Tools: Programme Briefs - NO. 1 Entertainment Education, January 2002 http://www.unfpa.org/upload/lib_pub_file/160_filename_bccprogbrief1.pdf
Chapter 1 Midterm Review
 Name: Class: Date: Chapter 1 Midterm Review Multiple Choice Identify the choice that best completes the statement or answers the question. 1. A survey typically records many variables of interest to the
Pantomime SALES DATA REPORT
 SALES DATA REPORT 2013-16 Pantomime The numbers of performances and ticket sales for Pantomime rose in 2014 and 2015 before dipping back to levels similar to 2013 in 2016. Ticket sales have grown by 2%
Screen Industry: 2015/16
 Screen Industry: 2015/16 Embargoed until 10:45am 12 April 2017 Key facts In 2016: Gross screen industry revenue increased 3 percent to $3.3 billion. Wellington film revenue recovered, to $644 million,
Trudeau top choice as PM, unsure second and at a 12 month high
 Trudeau top choice as PM, unsure second and at a 12 month high Nanos Weekly Tracking ending October 14 th, 2016 (released October 18 th, - 6 am Eastern) NANOS At a glance Preferred Prime Minister Asked
Almost seven in ten Canadians continue to think Trudeau has the qualities of a good political leader in Nanos tracking
 Almost seven in ten Canadians continue to think Trudeau has the qualities of a good political leader in Nanos tracking Nanos Weekly Tracking ending September 16 th, 2016 (released September 20 th, - 6
Trudeau remains strong on preferred PM measure tracked by Nanos
 Trudeau remains strong on preferred PM measure tracked by Nanos Nanos Weekly Tracking ending May 27 th, 2016 (released May 31 st, - 6 am Eastern) NANOS At a glance Preferred Prime Minister Trudeau remains
UK TV Exports. A global view in 2016/17
 UK TV Exports A global view in 216/17 2 Foreword... UK TV Exports 216/17 Rona Fairhead Minister of State at the Department for International Trade This year marks a new format of the UK TV Exports Report.
Black and Frozen Frame Detection
 Black and Frozen Frame Detection WFM6120/7020/7120 & WVR6020/7020/7120 Version 5.0.2 Software How To Guide How To Guide Figure 1. Input Monitor Mode Configuration. What is Black and Frozen Frame Detection?
Introduction. The report is broken down into four main sections:
 Introduction This survey was carried out as part of OAPEN-UK, a Jisc and AHRC-funded project looking at open access monograph publishing. Over five years, OAPEN-UK is exploring how monographs are currently
Positive trajectory for Trudeau continues hits a twelve month high on preferred PM and qualities of good political leader in Nanos tracking
 Positive trajectory for Trudeau continues hits a twelve month high on preferred PM and qualities of good political leader in Nanos tracking Nanos Weekly Tracking ending August 12 th, 2016 (released August
On these dates the submission has to be completed: online entry form as well as digital file have to be sent to Go Short.
 1.0 General requirements for entry 1.1 Films are eligible for Go Short competitions if: - The film is no longer than 30 minutes. - The film is produced in (geographical) Europe 1, the director or producer
Selection Results for the STEP traineeships published on the 9th of April, 2018
 Selection Results for the STEP traineeships published on the 9th of April, 2018 Please, have in mind: - The selection results are at the moment incomplete. We are still waiting for the feedback from several
Don t Stop the Presses! Study of Short-Term Return on Investment on Print Books Purchased under Different Acquisition Modes
 Claremont Colleges Scholarship @ Claremont Library Staff Publications and Research Library Publications 11-8-2017 Don t Stop the Presses! Study of Short-Term Return on Investment on Print Books Purchased
Trudeau hits 12 month high, Mulcair 12 month low in wake of Commons incident
 Trudeau hits 12 month high, Mulcair 12 month low in wake of Commons incident Nanos Weekly Tracking ending May 20 th, 2016 (released May 24 th, - 6 am Eastern) NANOS At a glance Preferred Prime Minister
Contemporary Chamber Ensemble
 Contemporary Chamber Ensemble The following is the breakdown of 2002 2010 revenue for a Contemporary Chamber Ensemble, which performs classical, contemporary and crossover jazz works, and records and tours
I thought it would be useful to append a list of our main points from Wednesday s meeting on the next page.
 Independent Producers Scotland Film City Glasgow 401 Govan Road GLASGOW G51 2QJ Friday 23 rd January 2015 Dear Members of Economy, Energy and Tourism Committee, Thank you for taking notice of the state
Bibliometric Study of Journal of Marketing Research,
 International Journal of Scientific and Research Publications, Volume 7, Issue 5, May 2017 364 Bibliometric Study of Journal of Marketing Research, 2008-2016 Jincy Joseph (Msc, Mlisc.) Carmelite Provincial
Toronto Alliance for the Performing Arts
 79195 Covers 1/22/08 3:04 PM Page 1 A Presentation to the Toronto Alliance for the Performing Arts Members Survey December 2007 79195 InsidePages 1/22/08 7:21 PM Page 1 Table of Contents Introduction and
RESEARCH TRENDS IN INFORMATION LITERACY: A BIBLIOMETRIC STUDY
 SRELS Journal of Information Management Vol. 44, No. 1, March 2007, Paper E. p53-62. RESEARCH TRENDS IN INFORMATION LITERACY: A BIBLIOMETRIC STUDY Mohd. Nazim* and Moin Ahmad** This study presents a bibliometric
Appendices 4 and 5: Methodology and Historical Analysis
 Appendices 4 and 5: Methodology and Historical Analysis Appendix 4 Methodology 14 APPENDIX 4 METHODOLOGY 1. Introduction The following appendix outlines the key elements of the methodology that used to
Follow this and additional works at: Part of the Library and Information Science Commons
 University of South Florida Scholar Commons School of Information Faculty Publications School of Information 11-1994 Reinventing Resource Sharing Authors: Anna H. Perrault Follow this and additional works
Film and TV locations as a driver of tourism
 Film and TV locations as a driver of tourism Foresight issue 160 VisitBritain Research February 2018 1 Contents Introduction Highlights Film/TV location and holiday destination choice By market Propensity
19 th RENDEZ-VOUS WITH
 19 th RENDEZVOUS WITH french cinema paris / JANUARY 12 16 2017 PERFORMANCE OF FRENCH FILMS IN FOREIGN MARKETS IN 2016 2016 FIGURES THE PERFORMANCE OF FRENCH FILMS IN FOREIGN MARKETS KEY FIGURES AND TRENDS
COMMISSION STAFF WORKING DOCUMENT. Accompanying document to the
 EUROPEAN COMMISSION Brussels, 23.9.2010 SEC(2010) 995 final COMMISSION STAFF WORKING DOCUMENT Accompanying document to the COMMUNICATION FROM THE COMMISSION TO THE EUROPEAN PARLIAMENT, THE COUNCIL, THE
Case No COMP/M SONY/ MUBADALA DEVELOPMENT/ EMI MUSIC PUBLISHING. REGULATION (EC) No 139/2004 MERGER PROCEDURE
 No 139/2004 MERGER PROCEDURE") EN Case No COMP/M.6459 - SONY/ MUBADALA DEVELOPMENT/ EMI MUSIC PUBLISHING Only the English text is available and authentic. REGULATION (EC) No 139/2004 MERGER PROCEDURE Article 6(1)(b) in conjunction with
EN Case No COMP/M.6459 - SONY/ MUBADALA DEVELOPMENT/ EMI MUSIC PUBLISHING Only the English text is available and authentic. REGULATION (EC) No 139/2004 MERGER PROCEDURE Article 6(1)(b) in conjunction with
D PSB Audience Impact. PSB Report 2011 Information pack June 2012
 D PSB Audience Impact PSB Report 2011 Information pack June 2012 Contents Page Background 2 Overview of PSB television 11 Nations and regions news 25 Individual PSB channel summaries 33 Overall satisfaction
A G R E E M E N T. between. Børneteatersammenslutningen (The Children s Theatre Organisation - BTS) along with
 along with") A G R E E M E N T between Børneteatersammenslutningen (The Children s Theatre Organisation - BTS) along with Foreningen af Små Teatre i Danmark (The Association of Small Theatres in Denmark - FAST) (since
A G R E E M E N T between Børneteatersammenslutningen (The Children s Theatre Organisation - BTS) along with Foreningen af Små Teatre i Danmark (The Association of Small Theatres in Denmark - FAST) (since
Baltic Sea Philharmonic Talent Tour 2019 Frequently Asked Questions
 Baltic Sea Philharmonic Talent Tour 2019 Frequently Asked Questions Conditions and Timeline What are the conditions for participating in the Talent Tour 2019? All applicants for the Baltic Sea Philharmonic
Digital Switch Over Experiences across Europe
 Digital Switch Over Experiences across Europe ITU International Symposium- Digital Switchover Geneva June 17th Bernard Pauchon Chairman DigiTAG Spectrum and Networks Group Table of content What is DigiTAG
Swedish Research Council. SE Stockholm
 A bibliometric survey of Swedish scientific publications between 1982 and 24 MAY 27 VETENSKAPSRÅDET (Swedish Research Council) SE-13 78 Stockholm Swedish Research Council A bibliometric survey of Swedish
Europeana Foundation Governing Board Meeting
 Paper 9A Public Europeana Foundation Governing Board Meeting 16 November 2016 16h30 18h00 CET Teleconference Call Content Report Action proposed: For information and Q&A Circulation: Europeana Foundation
NANOS. Trudeau sets yet another new high on the preferred PM tracking by Nanos
 Trudeau sets yet another new high on the preferred PM tracking by Nanos Nanos Weekly Tracking ending August 5 th, 2016 (released August 9 th, - 6 am Eastern) NANOS At a glance Preferred Prime Minister
Trudeau scores strongest on having the qualities of a good political leader
 Trudeau scores strongest on having the qualities of a good political leader Nanos Weekly Tracking ending September 9 th, 2016 (released September 13 th, - 6 am Eastern) NANOS At a glance Preferred Prime
Pulling the plug: Three-in-ten Canadians are forgoing home TV service in favour of online streaming
 Pulling the plug: Three-in-ten Canadians are forgoing home TV service in favour of online streaming Despite availability of skinny cable packages, most current subscribers say TV service is too expensive