EDL8 Race Dash Manual Engine Management Systems
|
|
|
- Clementine Jennings
- 5 years ago
- Views:
Transcription
1 Engine Management Systems EDL8 Race Dash Manual Engine Management Systems
2 Page 1

3 EDL8 Race Dash Page 2
4 EMS Computers Pty Ltd Unit 9 / 171 Power St Glendenning NSW, 2761 Australia Phone.: support@emsefi.com Web: or Page 3
5 Table of Contents Before you start... 7 Dash Manager Overview... 7 Initializing an SD card... 8 Loading a pre-saved configuration... 9 Connecting to EMS EM-Tech ECUs... 9 Screen Functions Logger Settings Log Activation Start / Stop Channel Start / Stop Trigger Start Trigger Value Stop Trigger Value Start/Stop Delay Log Packets per second Timer Timer Resolution Start Timer Channel Start Trigger Trigger Value Stop Timer Channel Stop Trigger Trigger Value Screen Return Delay Screen Delay Seconds GPS Active Lap Timer Set Date and Time Channel Translation Changing the default channel name Changing the default measure Translating a channel value Appling a translation formula Applying a Translation Table Linear translation Step translation Loading and Saving Translation Tables Select Channels to log Select Channels to Display LED Light Functions Programming an LED light to turn on Trigger Channel Activation Trigger Trigger Value LED Action Activating different LED configurations How to set up shift lights PWM Outputs Operation Mode Look up Channel Page 4
6 PWM Frequency Reverse Action Output Modulation Table PWM output example Pulse Inputs Input Function Frequency RPM Speed Pulses per revolution Distance Travelled in centimetres Calculate wheel speed Measure for recording distance Screen Designer Adding Gauges to the Dash Screens Repositioning and resizing Gauges Removing Gauges Clearing the designer screen Loading a pre-save screen Setting Gauge Properties Dial gauge Channel Minimum Value and Maximum Value Number formatting Start and End Danger Zone Divider Number of Labels Number of Ticks Gauge Title Layer Order Danger Colour Face Colour Face Border Colour Background Colour Text Colour Show Danger Zone Segment Gauge Data Channel Gauge Title Number of digits Number of Decimals Show Frame Layer Order Normal Colour LED Contrast Background Colour Show gauge tile Text Gauge Data Channel Gauge Title Layer Order Max Danger Min Danger Number formatting Danger Colour Page 5
7 Normal Text Colour Background Colour Show gauge tile Show Frame Indicator gauge Channel Minimum Value and Maximum Value Number formatting End of colour zone End of colour zone Number of LEDs Gauge Title Gauge Layer Background colour Text Colour Show Value as text Show Gauge title Vertical indicator LED Contrast Updating Dash Firmware Updating Dash Function firmware Updating the Display function firmware Data View Importing a log file from the SD card Opening an imported Log File Channel Data Selecting a channel to display Remove a data channel from the chart Sorting the data Un-sorting the data Set Display Options Selecting only specific data channels Smoothen Channel Save the log file Track Timing Selecting different Chart options Separated charts Overlaying charts Line charts Zooming into the chart Dragging a chart Zeroing the log time reference EDL8 Loom Pin out Pin plug Pin plug Page 6
8 Before you start Dash Manager Overview All dash functions and settings are programmed using the Dash Manager. The settings are saved to the SD card while it is in the laptop SD card slot. The saved settings are then loaded into the race dash when you place the SD card into the SD Card slot of the dash and switch the dash on. Before the SD card will work with the EDL8 race dash it must initialised using the card initialization function of the Dash Manager software. The SD card that came with the EDL8 Race dash is not usable until it is properly formatted for use with the Race Dash. The USB Flash drive that came in the kit has the EDL8 Data View software. This software must be installed on to a Windows laptop or PC. To install the EDL8 Data View software. Insert the USB Flash into a USB slot on the computer. Open the USB Flash with Windows Explorer and run the EDL8Installer.exe file. The installer will put the software on to the computer and also add the EDL8 Data View Icon on to the desktop. Double click the EDL8 Icon to start the software then: Go to Dash Manager -> EDL8 menu option. Go to SD Card -> Initialise new card. See next page on initialising the SD card. Page 7

9 Initializing an SD card Once you have initialized the SD card for the EDL8 Race dash it will not be compatible with windows. Initializing an SD card for the EDL8 race dash. 1. From the Dash Manager menu select SD Card -> Initialise new Card. This will show the card initialisation screen. 2. Select a Race Dash model. 3. Select the ECU model used with this Race Dash. 4. Enter a card name in the field provided 5. Press the Initialize Card button. The card name is important. The system will use this to group all extracted data logs together under the card name. When the initialisation is complete the SD card will have a blank Dash Configuration. You can either load a pre-saved configuration file or set up a new configuration file with new screen layout, Display channels and Acquisition channels and also any required channel translations. If using the LED lights, PWM outputs or Pulse Inputs then these must also be configured. Once you have finished setting up the dash configuration it must be saved to the SD card and loaded in to the race dash. To save the configuration file on to the SD card press the Save to SD card button at the top of the screen. To load the settings from the SD card in to the dash, insert the card into the SD card slot on the dash and turn the dash on. The dash will indicate that it is loading the new settings by flashing the LED lights on the right hand side. Loading should take about 1 minute. Once loaded the dash will start operating with the new settings. The EDL8 software comes with pre-saved configuration files for each of the EMS ECUs. After initializing the SD Card you can load a pre-saved configuration file and then adjust and change it to suit you requirements. Before loading a saved configuration file the SD card must be initialized. Page 8


10 Loading a pre-saved configuration 1. From the Dash Manager menu select File -> Open EDL File. This will show a folder with pre-saved configuration files. 2. Select a file matching the ECU used with the Race Dash 3. Press the Open Button This will load a pre-saved configuration file in to the Dash Manager Software. You can now customise this configuration to suit your specific needs and save it again or save it with a different name. Connecting to EMS EM-Tech ECUs The CAN data channels must be enabled on the EM-Tech ECU. This is done using the EM-Tech Manager Software. While the ECU is connected to the laptop and communication with the EM-Tech Manager software go to the ECU setup screen and set the CAN Baud Rate to 250 Kbps and select the data packet for each frame. Page 9

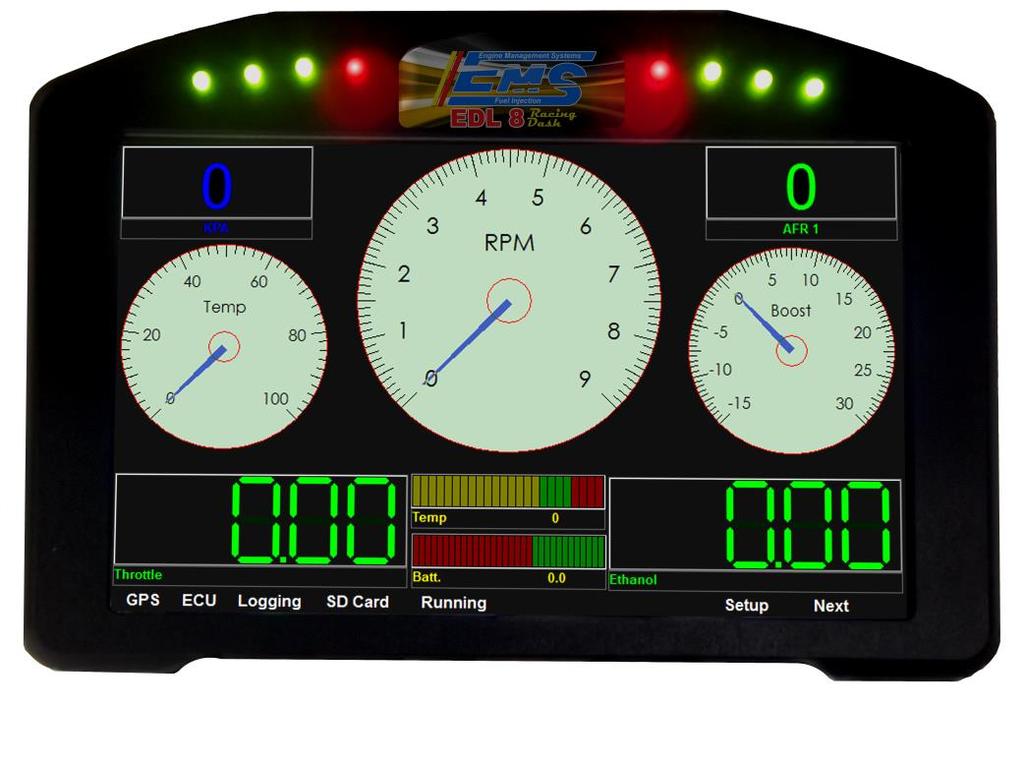
11 Screen Functions Please Note: This is a demonstration screen layout. Colours and gauges are fully customisable by using the screen designer. The borders around each gauge will not be visible on the EDL8 Race Dash. GPS Indicator This indicator will show yellow when a GPS module is connected and bright green when the GPS has locked onto the GPS satellites. The number of satellites is also shown Logging Indicator This indicator will show bright green when the EDL8 is saving data to the SD card memory. ECU Indicator This indicator will show bright green when the EDL8 is connected to an ECU SD Card Indicator This indicator will show bright green when a valid SD card is inserted in the Dash SD card slot. Setup Button When you have a mouse plugged in then you click on this button to display the setup screen. Use this screen to load new screen display firmware. Next Button When you have a mouse plugged in then you click on this button to display the secondary dash screen. Page 10

12 Logger Settings Log Activation This is used to select how the logger will start and stop logging. The logger can used any channel value or the switch input 2 wire. Start / Stop Channel Set the channel used to start and stop the logging. Start / Stop Trigger This has 2 main functions. Selecting greater than or equal to or Less Than will tell the logger how to compare the start / stop channel. It will either compare if the channel value is more than or less than the trigger value. Selecting switch input 2 will tell the logger to start logging whenever the switch input 2 wire is grounded. Start Trigger Value This is the value used to compare the start/stop channel value. If Start/Stop Trigger is set to greater than, then the logger will commence logging when the data channel value is higher than the trigger value. If Start/Stop Trigger is set to Less than, then the logger will commence logging when the data channel value is lower than the trigger value. Stop Trigger Value This is the value used to compare the start/stop channel value. If Start/Stop Trigger is set to greater than, then the logger will stop logging when the data channel value is lower than the trigger value. If Start/Stop Trigger is set to Less than, then the logger will stop logging when the data channel value is higher than the trigger value. Start/Stop Delay This tells the logger how long to wait before logging commences and stops. This time is represented in milliseconds. Page 11
13 Example: To commence logging when the RPM is higher than 2000 for 300 milliseconds and stop logging when the RPM is less than 1500 RPM for 300 milliseconds. Set the Start/Stop Channel to ECU Engine RPM Set the Start/Stop Trigger to Greater or Equal Set the Start Trigger value to 2000 Set the Stop Trigger value to 1500 Set the logging Start/Stop delay to 300 Log Packets per second A log packet contains all of the data channels selected to log. This can be from 1 channel up to 40 channels. Use this to set the number of logs packets per second. If you set it to 200 then the logger will record every channel 200 times per second. Set it to 100 to log every channel 100 timers per second. Page 12
14 Timer This can be used to count time. It counts time in seconds and milliseconds. The timer resolution can be set to OFF, 10mS or 1mS. Each time the timer is stopped the time counters are reset back to zero (0). Timer Resolution Setting this to OFF will disable the timer. Setting it to 1mS will set the timer resolution to every 1 millisecond. Setting to 10mS will set the timer resolution to 10 milliseconds. Start Timer Channel Set the channel you want to use to start the timer. Start Trigger This tells the timer how to compare start channel. When set to greater than, then the timer will commence when the channel value is higher than the trigger value. When set to less than then the timer commence when the channel value is lower than the trigger value. Trigger Value This is the value used to compare the start channel value. Stop Timer Channel Set the channel used to stop the timer. Stop Trigger This tells the timer how to compare stop channel. When set to greater than, then the timer will stop when the channel value is higher than the trigger value. When set to less than then the timer stop when the channel value is lower than the trigger value. Trigger Value This is the value used to compare the stop channel value. Example: If you want to start the timer when the Engine RPM is more than 1500 and stop it when the engine RPM is lower than 1500 and have a timer resolution of 1 millisecond. Set Timer resolution to 1mS Set Start Timer Channel to ECU Engine RPM Set Start Trigger to Greater than Set Trigger Value to 1500 Set Stop Timer Channel to ECU Engine RPM Set Stop Trigger to Less Than Set Trigger Value to 1500 Page 13
15 Screen Return Delay The second screen can be momentarily displayed by switching switch input 1 to ground. This can sets the delay before the dash reverts back to the main screen. Screen Delay Seconds Set the delay in seconds before the momentary screen returns back to the main screen. Example: To display the momentary second screen for 8 seconds after pressing the switch then set this value to 8. GPS Active If you have a GPS module and want to record speed and track mapping then this must be set to Activated Lap Timer The minimum lap time in seconds parameter is used identify sector beacons from lap beacons. If the lap time reading is less than the minimum lap time then the dash will assume the beacon signal to be a sector. Set this value to a time that is less than your fastest lap time but more that the last sector time. Set Date and Time The Dash has a built-in clock that runs off a small battery when power is off. Once the battery is discharged the time is lost and must be reset. Resetting the date and time on dash is done via the SD card. Set the correct date and time in the fields provides and then tick the Set Dash Time on settings upload. The time clock will be reset once you put the SC card into the dash an turn the dash on. Page 14

16 Channel Translation Data can come from the dedicated Race Dash channel inputs and ECU channel inputs. In both cases data may need to be translated into an engineering unit of measure or translated from one measure to another. You may also want to change channel names to something more meaningful to you. All saved data logs will use the translated channel values and new channel names. This screen has multiple functions. 1. Change the value of a channel to a different value by applying a calculation formula or translation table. 2. Change the default channel name and unit of measure. 3. Select data channels to record during a log. 4. Select data channels to display on the dash screen. The main purpose for using a translation formula or translation table is to change the default unit of measure of any channel value. Use this feature to translate voltage to PSI, Celsius to Fahrenheit, KPA to PSI or any other unit of measure. Example: EMS ECUs transmit manifold pressure in KPA but PSI may be preferred. A formula or translation table can be used to convert KPA to PSI. Page 15
17 Changing the default channel name The default channel names can be changed directly within the Available Data Channels list box. Click twice (not double click) in the channel name and type the new name. This new name will now appear in the all drop down list boxes and saved in the data log files. Changing the default measure The measure field is only informational and does not affect the data logging or other parts of the system. Change this field if a formula is applied to a data channel that changes its default data measurement. Click twice in the measure and type the new measure. Example 1: If you set a formula for the ECU Manifold Pressure channel to convert it from KPA to PSI then you can change the measure to PSI. Example 2: If a temperature sensor is connected to an EDL Analogue input channel and a translation table to is defined to translate voltage into temperature. Page 16

18 Translating a channel value Appling a translation formula Select the channel to define from the Available Channels list. Click Calculation in the Translation Method selector box. This will show the formula definition screen. There are four calculation formulas you can use to translate data into a different value. 1. Channel plus value 2. Channel minus value 3. Channel multiply by value 4. Channel divided by value Each one of these will use the default channel data and apply one of the formulas with the value entered into the value field. Page 17
19 Example: Translate the ECU Manifold Pressure channel from KPA to PSI. 1. Scroll to the ECU Manifold Pressure channel in the available channels list. 2. Click Calculation in the Translation Method box. 3. Select Channel multiplied by value in the Operation selection drop-down. 4. Type into the Value field. The logger will now multiply the default value by to convert it to PSI. Page 18

20 Applying a Translation Table Use this method of translation for channels that need a complicated formula or have a non-linear coefficient. Select the channel to translate from the Available Channels list. Click Translation Table in the Translation Method selector box. This will show the translation table definition screen. There are 2 translation modes you can select from, Linear or Step. Linear mode is used to define a table for a sensor that does not have a linear coefficient. You can define up to 11 translation points and enter a translation value for each point. The Race Dash will perform a linear extrapolation between each point to calculate an accurate data value. Step mode is used to define a table with up to 11 translation points. But instead of performing an extrapolation between each point to calculate an exact value it will use the entered value directly. This is useful if you are using a voltage to determine the selected gear. To create a translation table you need 3 parameters, the number of translation points, the sensor voltage range and the sensor unit of measure range. The number of translation points should be kept to a minimum. If the sensor is linear then you only need 3 5 translation points. If the sensor is non-linear then you can use up to 11 translation points. Example: To create a translation table for a sensor that is rated to produce a voltage from 500 mv (0.5V) to 4500 mv (4.5V) and gives a PSI unit of measure from 0 to 150 PSI. First, enter 500 in the Min Millivolts field, enter 4500 in the Max Millivolts field, enter 0 (zero) in the Min Units, enter 150 in the Max Units, Enter 5 in the Translation points field and press the Create Table button. For a non-linear sensor you can use this method to create an initial table to start with then adjust the Translation Value row of values according to the sensor s ratings. The EDL-8 Race Dash will interpolate between translation points to produce a smooth gauge reading and data log value. Page 19
21 Linear translation This method of translation interpolates between translation points to produce a linear value. Step translation This method of translation does not interpolate between translation points. It looks for the first value point that is less than the data channel value and uses the value in the particular translation point. This is useful for displaying a gear number if you are using a variable voltage to indicate the currently selected gear. Loading and Saving Translation Tables Once a translation table has been defined for a particular sensor it can be saved and reload for another channel. To save the table press the Save Translation button. This will display the Save screen where you can leave the default folder location or select a different one. Enter a file name for the table and press the Save button to save the new file. To load a saved translation table press the Load Translation button. This will show the open screen. Select the table needed and press the Open button. Page 20

22 Select Channels to log Up to 40 channels can be selected for logging from the list of available channels. To select the channels for logging press the Add / Remove Channels button that is directly under the Selected Acquisition Channels to show the channel selection screen. Each available channel has a selection tick box beside the channel name. Select the required channel by clicking on the tick box next to the channel name, a selection tick will appear in the small box. Repeat this for each channel you want to record. Once all required channels are selected press the Select -> button. To remove a selected channel press the Add / Remove Channels to display the channel selection box. Click on the tick box beside the channel name you want to remove, this will remove the selection tick. Repeat this for each channel you want to remove then press the Select -> button. Page 21

23 Select Channels to Display You can select up to 20 channels to display from the list of available channels. To select the channels you want to use on the dash display press the Add / Remove Channels button that is directly under the Selected Display Channels to show the channel selection screen. Each available channel has a selection tick box beside the channel name. You select the channel you want to display by clicking on the tick box to show a selection tick. Repeat this for each channel you want to display. Once you have selected all the channels you want press the Select - > button. To remove selected channels press the Add / Remove Channels button to display the channel selection box. Click on the tick box beside the channel name you want to remove, this will remove the selection tick. Repeat this for each channel you want to remove then press the Select -> button. All of the channels selected will become selectable in the Screen designer windows. NOTE: If you have added or removed display channels then you must reset the channel for each gauge via the screen designer. Page 22

24 LED Light Functions The EDL8 Dash Logger has 8 LED lights. These LED lights can be used as shift lights or warning lights. Each light can have different 5 configurations and be linked to a different data channel for each configuration. The LED light configuration is activated according the value of the Config Selection Channel. When the Config Selection Channel is set to Default then only the Main Configuration is active. Programming an LED light to turn on Each LED is numbered from 1 to 8 starting from the left most LED. Each one can be linked to a different channel or all LED lights can be linked to the same channel. Trigger Channel This links each LED to a channel. Select the desired channel from the dropdown box. Activation Trigger This tells the dash how to compare the channel value with the trigger value. Use this to select when to activate the LED. Select Greater than if you want to activate the LED whenever the channel value is higher than the trigger value. Select Less than if you want to activate the LED whenever the channel value is lower than the trigger value. Trigger Value The dash logger compares the channel value with this value to activate the LED light. LED Action Use this to program the LED to either turn on or stay off. Page 23


25 Activating different LED configurations The EDL8 dash logger can have up to 5 LED light configurations. This is useful if you need set multiple functions for the LED lights. For example when using the LEDs as shift lights, you can set different set points based gear number. Main Configuration In this configuration the LED lights will progressively turn on starting at 4000 RPM. LED 1 and 8 will turn on first, then LED 2 & 7, then 3 & 6 and last LED 4 & 5. Configuration 2 In this configuration the LED lights will progressively turn on starting at 4500 RPM. LED 1 and 8 will turn on first, then LED 2 & 7, then 3 & 6 and last LED 4 & 5. Configuration 3 In this configuration the LED lights will progressively turn on starting at 4300 RPM. LED 1 and 8 will turn on first, then LED 2 & 7, then 3 & 6 and last LED 4 & 5. The above images demonstrate how the LEDs are set to function as shift lights with a different LED configuration for each gear. The main configuration image shows the set points for gear 1, configuration 2 shows the set points for gear 2 and configuration 3 shows the set points for gear 3. Page 24


26 How to set up shift lights Follow the steps below to set up a different shift point for each gear. Step 1. Select an analogue input to function as a gear indicator. This screen shows how EDL Analogue Input 1 is set to indicate gear number based on channel voltage. You can also see that channel name is changed to Gear Number. Step 2. Set the configuration for each gear. This screen shows how the the LED configuration will be selected according to the Gear Number channel. The Main Configuration will be used whenever the Gear number is 1. The LED Configuration Selection Channel is set to Gear Number, The Config Activation Trigger is set to Less Than and trigger value is set to 2. This screen shows how Configuration 2 is used whenever the Gear number is 2. In this screen shot you will see that the Config Trigger value is set to 3. This is because we set the Config Activation Trigger as Less Than This screen shows how Configuration 3 is used whenever the Gear number is 3. In this screen shot you will see that the Config Trigger value is set to 4 Page 25
27 PWM Outputs The EDL8 has 4 pulse width modulated outputs. These can be used to control devices like boost control values, thermo fans, etc. Each PWM output signal can be varied from 0 to 100 percent in 255 increments. Each output must be linked to an input data channel and a table must be defined to control the PWM duty. Operation Mode This parameter sets how the EDL8 will use the control table. When set to Linear Look up mode the EDL8 will interpolate between set points to give a linear PWM duty modulation. When set to Step Look up mode then there is no interpolation and the PWM output modulation is stepped. Look up Channel This is the channel that is linked to the PWM output. The EDL8 will use data values from this channel to look up the correct PWM Duty from the PWM modulation table. PWM Frequency This will set the frequency of the PWM output signal. This value will depend the PWM device being controlled. A good starting point will be around 40Hz. Although the EDL8 has 4 PWM outputs the frequency setting values are shared. PWM output 1 and 2 share the frequency setting for output 1. PWM outputs 3 and 4 share the frequency setting for output 3. However, the modulation tables are completely separate for each output. Reverse Action This setting controls the polarity of the PWM output signal. In Normal mode the output voltage is high for the duration of the ON duty cycle and in Reverse mode the output voltage is low during the ON duty cycle. Output Modulation Table This table controls the PWM output duty. It has 2 rows that must be defined. The Look up Value row and the PWM Duty row. The EDL8 will read the data value of the Look up Channel and use it to find which PWM duty to set the output. Page 26

28 PWM output example This example demonstrates how to set up PWM output 1 to operate as a variable boost controller based on ethanol content. The EDL8 will look up and find what PWM duty to use at different ethanol percentages. It will find the first point that is less than or equal to the channel data value. Please note that these settings will not work. They are only intended to be an example. 1. Set Operation Mode to Linear Look up 2. Set Look up Channel to ECU Ethanol 3. Set PWM Frequency to 30Hz 4. Set each ethanol content look up value in the Output Modulation Table 5. Set each PWM duty value for each of the ethanol content values Page 27

29 Pulse Inputs The EDL8 has 6 pulse inputs. These can be used the measure frequency, revs per minute and wheel speed. The first 4 inputs can also record distance travelled when set as speed inputs. Input Function Use this dropdown box to select the function of the particular pulse input. The possible selections are Frequency, RPM and Speed. Different parameters will become active depending on which function was chosen. Frequency This has only the divider parameter. This would normally be set to 1. Page 28


30 RPM The only parameter available for this function is Pulses per Revolution. You would set this if the pulse sensor counts more than 1 pulse per one full revolution. Example: If you want to measure tail shaft revolutions per minute and the tail shaft has 4 equally spaced teeth then you need to set the pulses per revolution to 4. Speed This function has 3 parameters, Pulses per revolution, Distance travelled in one revolution and Measure for recording distance. Pulses per revolution. If the speed sensor is reading directly off the wheel axle then set this to the number of pulses the sensor will produce per one full wheel revolution. If the speed sensor is reading off the tail shaft them you must also consider the differential ratio. Example: If the sensor is reading a 4 tooth pulse wheel on the wheel axle then the sensor will produce 4 pulses per each wheel revolution. In this case you must put 4 in the pulses per revolution parameter and the wheel circumference (in centimetres) in the Distance travelled in one revolution. If the sensor is reading 4 pulses from the tail shaft then you must still put 4 pulses per revolution but now instead of using the wheel circumference directly you must divide the circumference by the differential ratio. Distance travelled in one revolution in centimetres Enter the wheel circumference in centimetres. The Dash will use this to calculate speed. Speed is calculated in centimetres per second. To convert centimetres per second in to KPH then use the channel translation for the respective pulse input channel. Please Note: If the pulses are measured from the tail shaft then measure the wheel travel for one tail shaft revolution in centimetres and use this value in place of wheel circumference. Page 29
31 Calculate wheel speed The EDL8 race dash calculates speed in centimetres per second. This needs to be translated into Kilometres per hour. Example: Wheel circumference = 200 cm Wheel revolutions per second = 10 If the wheel is turning 10 revolutions per second then the distance per second is 200 cm multiplied by 10. This is 2000 cm per second, multiply this value by to convert this to KPH. Long Explanation. 10Hz X 200cm = 2000cm per second 2000cm per second X 60 seconds = cm per minute cm per minute X 60 minutes = cm per hour cm per hour / 100 cm = meters per hour meter per hour / 1000 meters = 72 KPH Short explanation 2000 X = 72 kilometres per hour Setting the channel translation to show kilometres per hour. 1. Go to the channel translation screen and select the respective pulse input channel. 2. Select Calculation in the translation method selection box 3. Set Operation to Channel Multiplied by Value 4. Set Value to This will convert the pulse input channel value from cm per second to kilometres per hour. Page 30

32 Measure for recording distance The Dash can also calculate distance travelled in either meters or centimetres. Use this parameter to set the distance measurement. Please note that there is a maximum distance limit that the dash can record. If distance measure is set to Meters then the maximum is 65,535 meters. If distance measure is set to Centimetres then the maximum distance is meters. (65535 centimetres) Page 31

33 Screen Designer Use this feature to design the Race Dash screens. Any changes made with screen designer are saved to the SD Card and will become active once the SD card is inserted into the Race Dash and the dash is turned on. The EDL8 race dash can display 2 screens, the main screen and a secondary screen. The second screen is activated via an input switch. It is a momentary screen that remains active for a defined period then the main screen becomes active again. See Screen Return Delay to define the delay period. Adding Gauges to the Dash Screens To add new gauges place the mouse pointer on an area of the screen that is clear of any gauge and press the right mouse button. A pop-up menu will be shown allowing for the selection of various gauges. Select the desired gauge from the pop-up menu. You can now resize and position by clicking and dragging with the mouse pointer. Page 32
34 Repositioning and resizing Gauges You can reposition and resize any gauge by placing the mouse pointer on the gauge you want to modify and press the right mouse button and select the Move/Resize/Lock option. This will show a window border around the gauge. Use the top border to drag and reposition the gauge. Click and drag the side borders to resize the gauge. To lock the gauge position and size press the right mouse button again and select the Move/Resize/Lock option. Removing Gauges To remove a gauge place the mouse pointer on the gauge you want to remove and press the right mouse button and select the Remove Gauge option. Clearing the designer screen If you need to clear the entire screen then press the right mouse button on an area of the screen that is clear of any gauge and select the Clear Screen option from the pop-up menu. Loading a pre-save screen You can load a pre-saved screen from a different configuration file. Press the right mouse button on an area of the screen that is clear of any gauge and select the Loaf Screen option from the pop-up menu. A selection window showing available pre-saved files. Select the desired file and press the Open button. This will load only the screen layout from the file and you must re-set the channel for each gauge. Page 33
35 Setting Gauge Properties To set gauge properties such as Title, Colour and data channel place the mouse pointer on the gauge and press the right mouse button. Select Gauge Properties option from the popup menu to show the property screen for the selected gauge. Dial gauge Channel Select the data channel you want displayed on this gauge. If there are no channels to select then you have not selected any channels to display. See Select Channels to Display Minimum Value and Maximum Value These values set the minimum and maximum number span for the gauge. IE if this gauge is used to show Engine RPM and you want the gauge limit to be 7000 RPM, then you will set the max value to 7000, min value to 0. Page 34
36 Number formatting This describes the numerical formatting for text values. # = Do not show leading zeros. 0 = Show leading zeros. = Decimal place This format ##0.00 will show numbers with 3 significant digits and 2 decimal digits. The # symbols will only show numbers that are greater than zero. Start and End Danger Zone These numbers determine where to start and stop the danger zone for the gauge. If you want to show an RPM danger zone from 5500 RPM to 7000 RPM, then set max danger zone to 7000 and min danger zone to Divider This allows you to show the full value in the text but a divided value on the gauge. This is useful when displaying RPM. If you want to show RPM in thousands (1 = 1000, 5 = 5000) then you set the divider to IE: If you want the gauge to show a maximum of 8 for 8000 RPM then you would set the gauge parameters Max Value to 8000 and the divider to This will draw a gauge with numbers from 0 to 8 that represent 0 to 8000 RPM. Page 35
37 Number of Labels This number of major marks visible on the gauge. Set this value to a number that divides evenly into the gauge span. This will provide an even range of numbers around the gauge. To calculate the gauge span then subtract the gauge minimum from the gauge maximum. IE: if the gauge is used to show manifold pressure in KPA from -100 to +100 KPA then the gauge span is = 200. Number of Ticks Set this number to a value that the Number of Marks can divide evenly into. This will give you an even number if small ticks between each mark. Gauge Title The text displayed on each gauge depends on the channel selected. This is set when you define the channel translation table. The gauge will display the Translation name and Unit of Measure (UOM) defined using the EDL7 Dash Manager option found in the Analysis Software. Page 36
38 Layer Order This controls whether a gauge is shown on top of another. A gauge with a higher number is show on top of a gauge with a lower number. This allows you place gauges in positions that partly obscure another gauge. Danger Colour This allows you to choose the colour you want to display in the danger zone. Face Colour This is the colour for the round dial background colour. Face Border Colour This is the colour around the edge of the dial face. Background Colour This is the colour for the area of gauge outside of the round dial face. Text Colour This is the colour of the text and ticks of the gauge. Show Danger Zone Tick this field if you want to show the danger zone. Page 37
39 Segment Gauge Data Channel Select the data channel you want displayed on this gauge. If there are no channels to select then you have not selected any channels to display. See Select Channels to Display Gauge Title The title text displayed on each gauge. If this is left blank then the channel name will be displayed Number of digits This refers to the total number of digits the gauge will show. Set this to a value that can accommodate the maximum value of the channel including the number of decimals. EG: If the data value is then you would set then number of digits to 5 and number of decimals to 2. Page 38
40 Number of Decimals This refers to the precision of the value being shown. If you only want to show whole numbers then set it to zero. If you want an accuracy of 100ths then set this value to 2. Show Frame If you want a frame around the gauge the tick this field. Layer Order This controls whether a gauge is shown on top of another. A gauge with a higher number is show on top of a gauge with a lower number. This allows you place gauges in positions that partly obscure another gauge. Normal Colour The gauge will be displayed in this colour. LED Contrast This sets the brightness difference between LEDs that are on and those that are off. Background Colour This is the colour for the area behind the displayed value. Show gauge tile Tick this field if you want to show the gauge title. Page 39
41 Text Gauge Data Channel Select the data channel you want displayed on this gauge. If there are no channels to select then you have not selected any channels to display. See Select Channels to Display Gauge Title The title text displayed on each gauge. If this is left blank then the channel name will be displayed Layer Order This controls whether a gauge is shown on top of another. A gauge with a higher number is show on top of a gauge with a lower number. This allows you place gauges in positions that partly obscure another gauge. Max Danger This allows you to display a different colour whenever the channel value higher than this value. Min Danger This allows you to display a different colour whenever the channel value lower than this value. Number formatting This describes the numerical formatting for text values. # = Do not show leading zeros. 0 = Show leading zeros. = Decimal place This format ##0.00 will show numbers with 3 significant digits and decimal digits. The # symbols will only show numbers that are greater than zero Page 40
42 Danger Colour The gauge will change to the selected colour when its data channel value is not within the Min and Max danger range. Normal Text Colour The gauge will displayed in this colour when its value is below the danger limit. Background Colour This is the colour for the area behind the displayed value. Show gauge tile Tick this field if you want to show the gauge title. Show Frame If you want a frame around the gauge the tick this field. Page 41
43 Indicator gauge Channel Select the data channel you want displayed on this gauge. If there are no channels to select then you have not selected any channels to display. See Select Channels to Display Minimum Value and Maximum Value These values set the minimum and maximum number span for the gauge. IE if this gauge is used to show Exhaust gas temperature then you will set the max value to 1200, min value to 0. Number formatting This describes the numerical formatting for text values. # = Do not show leading zeros. 0 = Show leading zeros. = Decimal place This format ##0.00 will show numbers with 3 significant digits and 2 decimal digits. The # symbols will only show numbers that are greater than zero. End of colour zone 1 The indicator gauge can display 3 colour zones. Set the value for the end of zone one. Gauge values below this value will be shown using the Zone 1 on Colour End of colour zone 2 Set the value for the end of zone two. Channel data values below this value and above zone one value will be shown using the Zone 2 on Colour. Any channel data values above the End of colour zone 2 will be shown using the Zone 3 on Colour. Page 42
44 Number of LEDs This gauge shows a series of LEDs that span from left to right or bottom to top. Select the number of LEDs to use in the span. More LEDs give a finer gauge. If you select too many and the gauge is not long enough then they will not be displayed Gauge Title Set the title you want displayed on the dash screen. If left blank then the channel name will be shown. This is only active it you select to show the gauge title. Gauge Layer This controls whether a gauge is shown on top of another. A gauge with a higher number is show on top of a gauge with a lower number. This allows you to place a gauge in a position that partly obscures another gauge. Background colour This is the colour for the area of gauge outside of the round dial face. Text Colour This is the colour of the text and ticks of the gauge. Show Value as text Tick this field if you want to show the gauge value as text just above the gauge. Show Gauge title Tick this field if you want to show the gauge title just above the gauge. Vertical indicator This gauge can span from left to right or bottom to top. To make the gauge span from bottom to top then tick this property. LED Contrast This is a number between 5 and 10 that controls the LED brightness difference between ON and OFF. A value of 5 will show the OFF LED brightness at half the level of the ON LED brightness. A value of 9 will show the LED at 9 times less bright and a value of 10 will completely turn the LED OFF. Page 43
45 Updating Dash Firmware The EDL8 race has 2 types of firmware, one is used for the dash functions and data logging and the other is used for the dash display functions. Each firmware is updated in a different manor. The Dash function firmware is updated using the SD card and the display functions firmware is updated using a USB memory stick. Updating Dash Function firmware Before you can use an SD card for the EDL8 race dash it must be initialized See Initializing the SD card for instructions. Initialization only needs to be done once for each SD card. 1. From the Data View screen menu select Dash Manager -> EDL8 to show the Dash Manager screen. 2. Select the SD card drive letter using the Select SD Card selection box. 3. From the Dash Manager menu select SD Card -> Load New Firmware to SD Card. This will show a screen where you can select the firmware file you want to load. Each firmware file is named EDL8_X.fim where X will indicate the firmware version. After selecting the firmware file press the Open button. This will put the new firmware on to the SD card. 4. Put the SD card in to the dash SD card slot and turn on the race dash. The LED lights on the left side will flash to indicate that is it loading the new firmware. 5. After the LED lights stop flashing you must re-start the race dash. Page 44
46 Updating the Display function firmware This procedure has 2 phases. Phase one is performed on the laptop, this phase saves the display firmware onto the USB stick. Phase two is done on the Race dash, this phase puts the new firmware into the Race dash memory. Before you can complete these steps you must have a USB hub so you can connect a mouse and USB stick to the race dash. Phase one: 1. From the Data View screen menu select Dash Manager -> EDL8 to show the Dash Manager screen 2. Place a standard USB Memory stick in to one of the laptop USB slots 3. From the Dash Manager menu select SD Card -> Load screen Firmware to USB. This will show a screen listing all available firmware files. Click the box next to the firmware file you want to load. A tick will indicate the selection 4. Press the Save to USB button. This will place the select firmware file on to the USB memory stick. Phase two: 1. Plug the USB hub in to the USB port on the side of the race dash. 2. Turn on the Race dash if it is not already on. 3. Remove the USB memory stick from the laptop and place it into the USB hub that is connected to the Race Dash 4. Also, connect a mouse to the USB hub. Once the Race dash detects a mouse the mouse pointer will appear. 5. Move the mouse pointer to the word Setup at the bottom of the dash screen and click it. This will show the firmware update screen with a list of firmware files saved on he USB memory stick. 6. Click on the box next to the firmware file you want to load. A tick will appear next to the selected firmware file. 7. Press the Load new Firmware button. 8. After about 15 seconds a message will appear indicating that you must re-set the dash. Once the dash re-starts, the new firmware will be loaded and running. Note: You may need to restart the dash a second time if you find that is it not connected to the ECU. Firmware Update Screen Page 45
47 Data View The Data View screen is the initial screen shown when you start the analyser software. It allows you to view log data in a graphical form. You can view multiple log files together so you can compare two or more sessions. When you select channels to display, the software will automatically display channels with the same name together in the same graph. This allows you to overlay similar data for easier comparison. The channel data values are also shown in text form on the left side of the screen. As you move the mouse pointer over the chart the text data changes to show the numeric value for each channel in the log pointed to by the mouse cursor. When adding a channel to the data chart and display setting for the channel have not be set then the chart minimum and maximum span will be automatically set based on the minimum and maximum data value detected in the log. Page 46


48 Importing a log file from the SD card The EDL8 saves all log files to the SD card. Each log session is saved as a separate file on the SD card. Before the recorded data can be displayed it must be extracted from the SD card. To import a log file from the SD card: Select menu option File -> Import file from SD card Select the SD card from the Selected SD Card dropdown box, Click on the log session you want and press the Extract Log File button. After extraction, the log file will be saved using the Log Name, it will also be automatically loaded into the analysis screen. Page 47

49 Opening an imported Log File To open an imported log file as a session, go to menu option File -> Open Log as Session. The log data from each card is grouped into a folder having the same name as the SD card. Double click on the folder name to show all saved logs in the selected folder. Then select the log you want to view and press the Open button. This will create a column of channel values. You can also open a second log file in the same way and the system will create a second column for the newly opened log. The amount of time to open a log file will depend on the amount of data recorded in the file. Page 48

50 Channel Data The Channel Data section displays data in a textual way and also provides a means of selecting individual channels for displaying and sorting. All functions are accessible from the popup menu. The popup menu is activated when you press the right mouse button while the mouse pointer is on channel data grid. The selected function will be done on the selected data channel. The selected data channel is shown with a blue background colour. To select a data channel you must click in the data for the desired channel with the left mouse button. All of the following functions are accessed from the popup menu. Selecting a channel to display. Select Add to Chart from the popup menu. You can select as many channels as can reasonably fit onto the chart screen. If you are analysing multiple logs or multiple laps, the system will overlay data channels with the same name. If you select channels with different names then the software will create a new chart for each channel. Page 49
51 To display data for a channel double click on it or you can click it once then press the right mouse button. This will show a pop-up menu where you must select the Add to Chart option. Do this for each channel you want to view. Remove a data channel from the chart Select Remove from Chart from the popup menu. To remove a data channel from the chart, first click on the channel you want to remove then press the right mouse button to display the pop-up screen, now select the Remove from Chart option. Page 50
52 Sorting the data Select Sort on Selected Channel for the popup menu. The logged data is sorted in the same sequence that it was recorded, however there are times when you may want to sort the information in ascending order of a particular channel. To sort the data according to a particular channel first click on the desired channel and press the right mouse button to display the pop-up menu. Select the Sort on Selected Channel option and wait for the software to re-sort the data. Once sorted the channel name of the sorted channel will be shown as a darker grey colour. Un-sorting the data Select Un-sort data from the popup menu. If you sorted the data but now want it sorted back into the default recorded sequence first click on any data channel, then press the right mouse button and select the Un-sort Data option. You must wait until the software re-sorts the data back to the default sequence. Page 51
 for the selected channel, the plot colour, grid colour, text colour, grid increments (spacing) and grid lines.")
53 Set Display Options Select Set Display Options from the popup menu. This allows you to set the graph span (Min / Max) for the selected channel, the plot colour, grid colour, text colour, grid increments (spacing) and grid lines. These settings can be saved permanently when you save the log file. Each time you open this same log file these setting will be used. If they are changed them the file must be re-saved. Display Option Screen Minimum Range and Maximum Range will set the vertical span of values for the selected channel. Axis Label Colour will set the number and text colour on the left side of the axis. Plot Colour will set the line colour of the graph. Grid increment will set the horizontal grid spacing for the selected axis. Page 52

54 Selecting only specific data channels Select the Select Field option from the popup menu. This function will list all available data channels. You can select to display only a selected set of channels. Click the square beside the channels you want to view and leave all other channels un-ticked. When finished press the Save and Done button. Smoothen Channel You can make the graph lines look smoother by selecting one of the smoothen level filters. Select the data channel you want to apply the smoothen filter and then select it level you want from the popup menu. Page 53
55 Save the log file Each Channel Data column is a separate log file. To save a log file of a specific column you must have at least on data channel selected in the column so the system knows which log file you want to save. To save the log file select Save Log File from the popup menu. This will display the Save screen where you can change the file name or file location and press the save button. You can also save the file in the same location and with the same name. A log file needs to be saved if there were changes made to display settings and other parameters and you want to make these changes permanent. Page 54

56 Track Timing This function allows you to draw vertical timing lines on the chart. It is mainly used for drag racing where you would enter the reaction time, 60 foot time, etc. After you entered these times you must press the apply button to show the vertical lines for each time data. To permanently save this information you must save the log file. Page 55
Introduction Display...1 Mounting...1 Firmware Version...2. ADL Operation... 3
 MoTeC MDD User Manual Contents Introduction... 1 Display...1 Mounting...1 Firmware Version...2 ADL Operation... 3 1. Full ADL Display...4 2. Gain Loss Layout for ADL...6 3. Large Numeric Layout for ADL...8
MXS Strada USER GUIDE
 MXS Strada USER GUIDE AiM TECH Srl. Via Cavalcanti, 8 20063 Cernusco S/N (MI) Italia Tel. (+39) 02.9290571 Made in Italy www.aim-sportline.com MXS Strada 01. INTRODUCTION 02. WHAT IS IN THE KIT 03. LAYOUT
Configuring the Stack ST8961 VS Module when used in conjunction with a Stack ST81xx series display.
 Configuring the Stack ST8961 VS Module when used in conjunction with a Stack ST81xx series display. Your Stack ST8961 VS module allows you to synchronize, overlay, and record data available on your Stack
Video VBOX Pro RLVD10P2P/RLVD10P2PV/RLVD10P4PV/RLVD20P2PV/RLVD20P4PV. Features
 Video VBOX Pro combines a powerful GPS data logger with a high quality multi-camera video recorder and real-time graphics engine. Multi Camera Recording Taking up to four waterproof cameras and combining
VOB - data over Video Overlay Box
 VOB - data over Video Overlay Box Real time data overlayed onto video, both PAL and NTSC versions available Real time lap and sector times without a track side optical beacon User configurable display,
ORM0022 EHPC210 Universal Controller Operation Manual Revision 1. EHPC210 Universal Controller. Operation Manual
 ORM0022 EHPC210 Universal Controller Operation Manual Revision 1 EHPC210 Universal Controller Operation Manual Associated Documentation... 4 Electrical Interface... 4 Power Supply... 4 Solenoid Outputs...
Transmitter Interface Program
 Transmitter Interface Program Operational Manual Version 3.0.4 1 Overview The transmitter interface software allows you to adjust configuration settings of your Max solid state transmitters. The following
Video VBOX Waterproof
 () Video VBOX Waterproof combines a powerful GPS data logger with a high quality multi-camera video recorder and real-time graphics engine, allowing you to carry out detailed driver training and vehicle
ED3. Digital Encoder Display Page 1 of 13. Description. Mechanical Drawing. Features
 Description Page 1 of 13 The ED3 is an LCD readout that serves as a position indicator or tachometer. The ED3 can display: Speed or position of a quadrature output incremental encoder Absolute position
Video VBOX Lite RLVBVD10LT2. Powerful VBOX data logging and video technology in a user-friendly, affordable product. What can Video VBOX Lite do?
 Powerful VBOX data logging and video technology in a user-friendly, affordable product Video VBOX Lite is a one box solution, incorporating a solid state video recorder, a VBOX 10 Hz GPS data logger and
SPA MICROPROCESSOR SPEEDOMETER INSTALLATION AND OPERATING MANUAL PAGE 2...INSTRUMENT FEATURES PAGE 3...OPERATING INSTRUCTIONS PAGE 3...
 SPA MICROPROCESSOR SPEEDOMETER INSTALLATION AND OPERATING MANUAL PAGE 2...INSTRUMENT FEATURES PAGE 3...OPERATING INSTRUCTIONS PAGE 3...MENU SYSTEM PAGE 7...INSTALLATION DIAGRAMS PAGE 10...INSTALLATION
Operating Instructions
 Operating Instructions HAEFELY TEST AG KIT Measurement Software Version 1.0 KIT / En Date Version Responsable Changes / Reasons February 2015 1.0 Initial version WARNING Introduction i Before operating
Getting started with
 Getting started with Electricity consumption monitoring single phase for homes and some smaller light commercial premises OVERVIEW: The OWL Intuition-e electricity monitoring system comprises of three
Quick Setup Guide for IntelliAg Model CTA
 STEP 3: Auto Configuration (identifies sensors connected to each module) Auto config is performed at the factory, but may need to be done in the field as changes are made to the system or if options are
Quick Setup Guide for IntelliAg Model NTA
 STEP 3: Auto Configuration (identifies sensors connected to each module) Auto config is performed at the factory, but may need to be done in the field as changes are made to the system or if options are
This document is a reference document that shows the menus in the 5500sc, 9610sc and 9611sc analyzers. There are 3 top-level menus:
 Controller menus 5500sc, 9610sc and 9611sc analyzers DOC273.53.80566 Introduction This document is a reference document that shows the menus in the 5500sc, 9610sc and 9611sc analyzers. There are 3 top-level
The Measurement Tools and What They Do
 2 The Measurement Tools The Measurement Tools and What They Do JITTERWIZARD The JitterWizard is a unique capability of the JitterPro package that performs the requisite scope setup chores while simplifying
KNX Dimmer RGBW - User Manual
 KNX Dimmer RGBW - User Manual Item No.: LC-013-004 1. Product Description With the KNX Dimmer RGBW it is possible to control of RGBW, WW-CW LED or 4 independent channels with integrated KNX BCU. Simple
Getting started with
 PART NO. CMA11 3 MADE IN CHINA 1. Measuring CAT II 2. Max. voltage 250V ~ 3. Max. current 71 Amp Getting started with Electricity consumption & Solar PV generation monitoring single phase, for homes fitted
Part No. ENC-LAB01 Users Manual Introduction EncoderLAB
 PCA Incremental Encoder Laboratory For Testing and Simulating Incremental Encoder signals Part No. ENC-LAB01 Users Manual The Encoder Laboratory combines into the one housing and updates two separate encoder
imso-104 Manual Revised August 5, 2011
 imso-104 Manual Revised August 5, 2011 Section 1 Getting Started SAFETY 1.10 Quickstart Guide 1.20 SAFETY 1.30 Compatibility 1.31 Hardware 1.32 Software Section 2 How it works 2.10 Menus 2.20 Analog Channel
Installation / Set-up of Autoread Camera System to DS1000/DS1200 Inserters
 Installation / Set-up of Autoread Camera System to DS1000/DS1200 Inserters Written By: Colin Langridge Issue: Draft Date: 03 rd July 2008 1 Date: 29 th July 2008 2 Date: 20 th August 2008 3 Date: 02 nd
USER MANUAL FOR THE ANALOGIC GAUGE FIRMWARE VERSION 1.1
 by USER MANUAL FOR THE ANALOGIC GAUGE FIRMWARE VERSION 1.1 www.aeroforcetech.com Made in the USA! WARNING Vehicle operator should focus primary attention to the road while using the Interceptor. The information
D-901 PC SOFTWARE Version 3
 INSTRUCTION MANUAL D-901 PC SOFTWARE Version 3 Please follow the instructions in this manual to obtain the optimum results from this unit. We also recommend that you keep this manual handy for future reference.
PHY221 Lab 1 Discovering Motion: Introduction to Logger Pro and the Motion Detector; Motion with Constant Velocity
 PHY221 Lab 1 Discovering Motion: Introduction to Logger Pro and the Motion Detector; Motion with Constant Velocity Print Your Name Print Your Partners' Names Instructions August 31, 2016 Before lab, read
Getting started with Spike Recorder on PC/Mac/Linux
 Getting started with Spike Recorder on PC/Mac/Linux You can connect your SpikerBox to your computer using either the blue laptop cable, or the green smartphone cable. How do I connect SpikerBox to computer
LedSet User s Manual V Official website: 1 /
 LedSet User s Manual V2.6.1 1 / 42 20171123 Contents 1. Interface... 3 1.1. Option Menu... 4 1.1.1. Screen Configuration... 4 1.1.1.1. Instruction to Sender/ Receiver/ Display Connection... 4 1.1.1.2.
Linkage 3.6. User s Guide
 Linkage 3.6 User s Guide David Rector Friday, December 01, 2017 Table of Contents Table of Contents... 2 Release Notes (Recently New and Changed Stuff)... 3 Installation... 3 Running the Linkage Program...
127566, Россия, Москва, Алтуфьевское шоссе, дом 48, корпус 1 Телефон: +7 (499) (800) (бесплатно на территории России)
 (800) (бесплатно на территории России)") 127566, Россия, Москва, Алтуфьевское шоссе, дом 48, корпус 1 Телефон: +7 (499) 322-99-34 +7 (800) 200-74-93 (бесплатно на территории России) E-mail: info@awt.ru, web:www.awt.ru Contents 1 Introduction...2
127566, Россия, Москва, Алтуфьевское шоссе, дом 48, корпус 1 Телефон: +7 (499) 322-99-34 +7 (800) 200-74-93 (бесплатно на территории России) E-mail: info@awt.ru, web:www.awt.ru Contents 1 Introduction...2
Chapter 23 Dimmer monitoring
 Chapter 23 Dimmer monitoring ETC consoles may be connected to ETC Sensor dimming systems via the ETCLink communication protocol. In this configuration, the console operates a dimmer monitoring system that
CARLO GAVAZZI Automation Components
 CARLO GAVAZZI Automation Components UDM 35/40 Digital Panel Meter Programming Guide Index Description 2 Programming Fundamentals 3 Access to Programming Mode/Password Protection 4 Programming 5-18 Inputs
GLog Users Manual.
 GLog Users Manual GLog is copyright 2000 Scott Technical Instruments It may be copied freely provided that it remains unmodified, and this manual is distributed with it. www.scottech.net Introduction GLog
Pre-processing of revolution speed data in ArtemiS SUITE 1
 03/18 in ArtemiS SUITE 1 Introduction 1 TTL logic 2 Sources of error in pulse data acquisition 3 Processing of trigger signals 5 Revolution speed acquisition with complex pulse patterns 7 Introduction
E X P E R I M E N T 1
 E X P E R I M E N T 1 Getting to Know Data Studio Produced by the Physics Staff at Collin College Copyright Collin College Physics Department. All Rights Reserved. University Physics, Exp 1: Getting to
R5 RIC Quickstart R5 RIC. R5 RIC Quickstart. Saab TransponderTech AB. Appendices. Project designation. Document title. Page 1 (25)
") Appendices 1 (25) Project designation R5 RIC Document title CONTENTS 2 (25) 1 References... 4 2 Dimensions... 5 3 Connectors... 6 3.1 Power input... 6 3.2 Video I... 6 3.3 Video Q... 6 3.4 Sync... 6 3.5
Appendices 1 (25) Project designation R5 RIC Document title CONTENTS 2 (25) 1 References... 4 2 Dimensions... 5 3 Connectors... 6 3.1 Power input... 6 3.2 Video I... 6 3.3 Video Q... 6 3.4 Sync... 6 3.5
Data Acquisition Using LabVIEW
 Experiment-0 Data Acquisition Using LabVIEW Introduction The objectives of this experiment are to become acquainted with using computer-conrolled instrumentation for data acquisition. LabVIEW, a program
802DN Series A DeviceNet Limit Switch Parameter List
 802DN Series A DeviceNet Limit Switch Parameter List EDS file Version 2.01 1. Operate Mode 1 (Sensor Output #1) Normally Open Normally Closed 2. Operate Mode 2 (Sensor Output #2) Normally Open Normally
OPERATING GUIDE. HIGHlite 660 series. High Brightness Digital Video Projector 16:9 widescreen display. Rev A June A
 OPERATING GUIDE HIGHlite 660 series High Brightness Digital Video Projector 16:9 widescreen display 111-9714A Digital Projection HIGHlite 660 series CONTENTS Operating Guide CONTENTS About this Guide...
USER MANUAL FOR THE ANALOGIC GAUGE FIRMWARE VERSION 1.0
 by USER MANUAL FOR THE ANALOGIC GAUGE FIRMWARE VERSION 1.0 www.aeroforcetech.com Made in the USA! WARNING Vehicle operator should focus primary attention to the road while using the Interceptor. The information
Outback STX. User Guide Supplement. Parts List. STX Terminal Overview
 Outback STX User Guide Supplement This supplement details the following changes from STX v1.0 to STX v1.1: Parts List below STX Terminal Overview below Connection Diagram on page 2 AC110 Power Up and Power
Spektrum AirWare Change Log 2016-November-15
 Version 1.06 Spektrum AirWare Change Log 2016-November-15 Changes since 2016-February-05 Special Note In the Telemetry menu, some sensors may not be reported properly on the display or audibly after updating.
VBOX 3i Dual Antenna Measures Slip and Pitch/Roll (RLVB3iSL)
") A VBOX 3i Dual Antenna (VB3iSL) uses a GPS/GLONASS receiver to achieve high level accuracy has the ability to measure slip and pitch/roll angles at 100 Hz. Enabling users to intuitively measure set parameters
A VBOX 3i Dual Antenna (VB3iSL) uses a GPS/GLONASS receiver to achieve high level accuracy has the ability to measure slip and pitch/roll angles at 100 Hz. Enabling users to intuitively measure set parameters
PicoScope. User guide. Copyright 2005 Pico Technology Limited. All rights reserved. PSW044 v1.5
 PicoScope User guide I PicoScope User Guide Table of Contents 1 Introduction...3...3 1 What is PicoScope?...3 2 Why use PicoScope?...4 3 Screen layout...4 4 Display area...5 5 Customisation...5 6 Exporting
OPERATOR S GUIDE OPERATOR S GUIDE OPERATOR S GUIDE OPERATOR S GUIDE OPERATOR S GUIDE OPERATOR S GUIDE OPERATOR S GUIDE.
 OPERATOR S GUIDE OPERATOR S GUIDE OPERATOR S GUIDE OPERATOR S GUIDE OPERATOR S GUIDE OPERATOR S GUIDE OPERATOR S GUIDE Engine Vision Introduction Introduction Caterpillar Engine Vision System displays
Operating Instructions
 CNTX Contrast sensor Operating Instructions CAUTIONS AND WARNINGS SET-UP DISTANCE ADJUSTMENT: As a general rule, the sensor should be fixed at a 15 to 20 angle from directly perpendicular to the target
PQ-Box 100 Quick Start Instructions
 PQ-Box 100 Quick Start Instructions These instructions are provided for the purpose on providing a quick start to PQ-Box 100 installation and operation. Please refer to the user handbook for full details.
Single Axis Position Controller
 SERIES P9511 Single Axis Position Controller Compact Construction Simple Go-to operation Integrated Relay Output Integrated Mains Power Supply ELEKTRO-TRADING sp. Z o.o. 44-109 Gliwice, ul. Mechaników
Dave Jones Design Phone: (607) Lake St., Owego, NY USA
 Lake St., Owego, NY USA") Manual v1.00a June 1, 2016 for firmware vers. 2.00 Dave Jones Design Phone: (607) 687-5740 34 Lake St., Owego, NY 13827 USA www.jonesvideo.com O Tool Plus - User Manual Main mode NOTE: New modules are
Manual v1.00a June 1, 2016 for firmware vers. 2.00 Dave Jones Design Phone: (607) 687-5740 34 Lake St., Owego, NY 13827 USA www.jonesvideo.com O Tool Plus - User Manual Main mode NOTE: New modules are
Variwrap Controller Manual
 Variwrap Controller Manual Operation The controller has two operating modes Manual and Auto. The mode is changes by pressing the (F1) Auto/Manual button. The mode setting is displayed in the top right
TASKI Service Tool Edition: V5.10/2014
 Edition: V5.10/2014 Index 1 General 1.1 General information 1 1.1.1 Part reference 1 1.1.2 Consumable supplies 1 1.1.3 Direction description 1 1.1.4 Power source 1 1.2 Required material 2 1.2.1 Tools 2
Instructions for DataMark PDF Temperature Logger
 Instructions for DataMark PDF Temperature Logger DataMark provides a convenient way to obtain high accuracy temperature data in transit. The unit is a self contained temperature logger that plugs directly
User s Manual. Log Scale (/LG) GX10/GX20/GP10/GP20/GM10 IM 04L51B01-06EN. 3rd Edition
 GX10/GX20/GP10/GP20/GM10 IM 04L51B01-06EN. 3rd Edition") User s Manual Model GX10/GX20/GP10/GP20/GM10 Log Scale (/LG) 3rd Edition Introduction Thank you for purchasing the SMARTDAC+ Series GX10/GX20/GP10/GP20/GM10 (hereafter referred to as the recorder, GX,
User s Manual Model GX10/GX20/GP10/GP20/GM10 Log Scale (/LG) 3rd Edition Introduction Thank you for purchasing the SMARTDAC+ Series GX10/GX20/GP10/GP20/GM10 (hereafter referred to as the recorder, GX,
PYROPTIX TM IMAGE PROCESSING SOFTWARE
 Innovative Technologies for Maximum Efficiency PYROPTIX TM IMAGE PROCESSING SOFTWARE V1.0 SOFTWARE GUIDE 2017 Enertechnix Inc. PyrOptix Image Processing Software v1.0 Section Index 1. Software Overview...
Application Note 11 - Totalization
 Application Note 11 - Totalization Using the TrendView Recorders for Totalization The totalization function is normally associated with flow monitoring applications, where the input to the recorder would
Ultra 4K Tool Box. Version Release Note
 Ultra 4K Tool Box Version 2.1.43.0 Release Note This document summarises the enhancements introduced in Version 2.1 of the software for the Omnitek Ultra 4K Tool Box and related products. It also details
ToshibaEdit. Contents:
 ToshibaEdit Contents: 1 General 2 Installation 3 Step by step a Load and back up a settings file b Arrange settings c Provider d The favourite lists e Channel parameters f Write settings into the receiver
The BAT WAVE ANALYZER project
 The BAT WAVE ANALYZER project Conditions of Use The Bat Wave Analyzer program is free for personal use and can be redistributed provided it is not changed in any way, and no fee is requested. The Bat Wave
FRQM-2 Frequency Counter & RF Multimeter
 FRQM-2 Frequency Counter & RF Multimeter Usage Instructions Firmware v2.09 Copyright 2007-2011 by ASPiSYS Ltd. Distributed by: ASPiSYS Ltd. P.O.Box 14386, Athens 11510 (http://www.aspisys.com) Tel. (+30)
Vorne Industries. 87/719 Analog Input Module User's Manual Industrial Drive Itasca, IL (630) Telefax (630)
 Telefax (630)") Vorne Industries 87/719 Analog Input Module User's Manual 1445 Industrial Drive Itasca, IL 60143-1849 (630) 875-3600 Telefax (630) 875-3609 . 3 Chapter 1 Introduction... 1.1 Accessing Wiring Connections
Vorne Industries 87/719 Analog Input Module User's Manual 1445 Industrial Drive Itasca, IL 60143-1849 (630) 875-3600 Telefax (630) 875-3609 . 3 Chapter 1 Introduction... 1.1 Accessing Wiring Connections
013-RD
 Engineering Note Topic: Product Affected: JAZ-PX Lamp Module Jaz Date Issued: 08/27/2010 Description The Jaz PX lamp is a pulsed, short arc xenon lamp for UV-VIS applications such as absorbance, bioreflectance,
Operating instructions Electronic preset counter Type series 717
 Operating instructions Electronic preset counter Type series 717 1. Description 5.98.3_gb 6-digit adding/subtracting counter with two presets Very bright 8mm high LED display Counting and preset range
KRAMER ELECTRONICS LTD. USER MANUAL
 KRAMER ELECTRONICS LTD. USER MANUAL MODEL: Projection Curved Screen Blend Guide How to blend projection images on a curved screen using the Warp Generator version K-1.4 Introduction The guide describes
imso-104 Manual Revised July 19, 2012
 imso-104 Manual Section 1 Getting Started SAFETY 1.10 Quickstart Guide 1.20 SAFETY 1.30 Compatibility 1.31 Hardware 1.32 Software Section 2 How it works 2.10 Menus 2.20 Analog Channel 2.21 On / Off 2.22
SigPlay User s Guide
 SigPlay User s Guide . . SigPlay32 User's Guide? Version 3.4 Copyright? 2001 TDT. All rights reserved. No part of this manual may be reproduced or transmitted in any form or by any means, electronic or
BLUNIK II ACCESSORIES SPORT DRIVE SPORT CALCULATOR... 49
 USER GUIDE 12/2016 2 INDEX DESCRIPTION of BLUNIK II...6 DESCRIPTION of parameters...7 ADJUSTMENT OF PARAMETERS...7 Parameter: CLOCK SYNCHRO...8 Parameter: TIRES...9 Parameter: CALIBRATION... 10 Calibration
SIDRA INTERSECTION 8.0 UPDATE HISTORY
 Akcelik & Associates Pty Ltd PO Box 1075G, Greythorn, Vic 3104 AUSTRALIA ABN 79 088 889 687 For all technical support, sales support and general enquiries: support.sidrasolutions.com SIDRA INTERSECTION
Tutorial 3 Normalize step-cycles, average waveform amplitude and the Layout program
 Tutorial 3 Normalize step-cycles, average waveform amplitude and the Layout program Step cycles are defined usually by choosing a recorded ENG waveform that shows long lasting, continuos, consistently
Event recording (or logging) with a Fluke 287/289 Digital Multimeter
 with a Fluke 287/289 Digital Multimeter") Event recording (or logging) with a Fluke 287/289 Digital Multimeter Application Note One of the major features of the Fluke 280 Series digital multimeters (DMM) with TrendCapture is their ability to record
Event recording (or logging) with a Fluke 287/289 Digital Multimeter Application Note One of the major features of the Fluke 280 Series digital multimeters (DMM) with TrendCapture is their ability to record
Portable Data Recorder HMG Operating Manual (Original Manual)
") Portable Data Recorder HMG 3010 Operating Manual (Original Manual) Edition 2012-06-28 - V04 R01 Part No.: 669855 HMG 3010 Page 2 HMG 3010 Page 3 Table of contents 1 Tasks and Functions of the HMG 3010...
Portable Data Recorder HMG 3010 Operating Manual (Original Manual) Edition 2012-06-28 - V04 R01 Part No.: 669855 HMG 3010 Page 2 HMG 3010 Page 3 Table of contents 1 Tasks and Functions of the HMG 3010...
Casambi App User Guide
 Casambi App User Guide Version 1.5.4 2.1.2017 Casambi Technologies Oy Table of contents 1 of 28 Table of contents 1 Smart & Connected 2 Using the Casambi App 3 First time use 3 Taking luminaires into use:
Show Designer 3. Software Revision 1.15
 Show Designer 3 Software Revision 1.15 OVERVIEW... 1 REAR PANEL CONNECTIONS... 1 TOP PANEL... 2 MENU AND SETUP FUNCTIONS... 3 CHOOSE FIXTURES... 3 PATCH FIXTURES... 3 PATCH CONVENTIONAL DIMMERS... 4 COPY
VBOX3i Dual Antenna. Measures Slip and Pitch/Roll (RLVB3iSL) Features
 Features") VBOX3i dual antenna (VB3iSL) is Racelogic s most powerful GPS data logging system. By utilising two GPS engines configured in a Fixed Baseline RTK setup, the VB3iSL combines high level accuracy and test
VBOX3i dual antenna (VB3iSL) is Racelogic s most powerful GPS data logging system. By utilising two GPS engines configured in a Fixed Baseline RTK setup, the VB3iSL combines high level accuracy and test
American DJ. Show Designer. Software Revision 2.08
 American DJ Show Designer Software Revision 2.08 American DJ 4295 Charter Street Los Angeles, CA 90058 USA E-mail: support@ameriandj.com Web: www.americandj.com OVERVIEW Show Designer is a new lighting
Using different reference quantities in ArtemiS SUITE
 06/17 in ArtemiS SUITE ArtemiS SUITE allows you to perform sound analyses versus a number of different reference quantities. Many analyses are calculated and displayed versus time, such as Level vs. Time,
fxbox User Manual P. 1 Fxbox User Manual
 fxbox User Manual P. 1 Fxbox User Manual OVERVIEW 3 THE MICROSD CARD 4 WORKING WITH EFFECTS 4 MOMENTARILY APPLY AN EFFECT 4 TRIGGER AN EFFECT VIA CONTROL VOLTAGE SIGNAL 4 TRIGGER AN EFFECT VIA MIDI INPUT
Application Note AN-708 Vibration Measurements with the Vibration Synchronization Module
 Application Note AN-708 Vibration Measurements with the Vibration Synchronization Module Introduction The vibration module allows complete analysis of cyclical events using low-speed cameras. This is accomplished
VBOX 3i. 100Hz GPS Data Logger (VB3i-V3) Features
 Features") VBOX 3i (VB3i-V3) is one of the best known and highly valued test instruments for non-contact speed and distance measurement. Using a powerful GPS engine, VBOX 3ilogs data at 100 times a second and features
VBOX 3i (VB3i-V3) is one of the best known and highly valued test instruments for non-contact speed and distance measurement. Using a powerful GPS engine, VBOX 3ilogs data at 100 times a second and features
Manual Version Ver 1.0
 The BG-3 & The BG-7 Multiple Test Pattern Generator with Field Programmable ID Option Manual Version Ver 1.0 BURST ELECTRONICS INC CORRALES, NM 87048 USA (505) 898-1455 VOICE (505) 890-8926 Tech Support
VBOX 3i Dual Antenna RTK
 The VBOX 3i RTK, RACELOGIC s most powerful GPS data logging system, is an RTK enabled version of the VBOX 3i Dual Antenna which can be used in conjunction with an RTK differential Base Station to obtain
NOTICE: This document is for use only at UNSW. No copies can be made of this document without the permission of the authors.
 Brüel & Kjær Pulse Primer University of New South Wales School of Mechanical and Manufacturing Engineering September 2005 Prepared by Michael Skeen and Geoff Lucas NOTICE: This document is for use only
PicoScope for Windows user guide Chapter 1: Overview Chapter 2: Views Chapter 3: How To.. Chapter 4: Menus Chapter 5: Dialogs
 PicoScope for Windows user guide This user guide contains over a hundred pages of information about the PicoScope for Windows program. Please take a few minutes to read chapters 1 and 2, as this will quickly
Yellow Frog. Manual Version 1.1
 Yellow Frog Manual Version 1.1 1 YellowFrog Contents PC Requirements...... 2 YellowFrog Power Meter Measurement.... 3 YellowFrog PC Software..... 3 Main Screen....... 4 Input Overload....... 5 Battery
Statement SmartLCT User s Manual Welcome to use the product from Xi an NovaStar Tech Co., Ltd. (hereinafter referred to as NovaStar ). It is our great
. It is our great") LED Display Configuration Software SmartLCT User s Manual Software Version: V3.0 Rev3.0.0 NS110100239 Statement SmartLCT User s Manual Welcome to use the product from Xi an NovaStar Tech Co., Ltd. (hereinafter
LED Display Configuration Software SmartLCT User s Manual Software Version: V3.0 Rev3.0.0 NS110100239 Statement SmartLCT User s Manual Welcome to use the product from Xi an NovaStar Tech Co., Ltd. (hereinafter
Data Acquisition Instructions
 Page 1 of 13 Form 0162A 7/21/2006 Superchips Inc. Superchips flashpaq Data Acquisition Instructions Visit Flashpaq.com for downloadable updates & upgrades to your existing tuner (See the next page for
VBOX 3i. 100Hz GPS Data Logger. Features
 VBOX 3i is one of the best known and highly valued test instruments for non-contact speed and distance measurement. Using a powerful GPS engine, VBOX 3i logs data at 100 times a second and features a 400MHz
1 OVERVIEW 2 WHAT IS THE CORRECT TIME ANYWAY? Application Note 3 Transmitting Time of Day using XDS Packets 2.1 UTC AND TIMEZONES
 1 OVERVIEW This application note describes how to properly encode Time of Day information using EIA-608-B Extended Data Services (XDS) packets. In the United States, the Public Broadcasting System (PBS)
LEDBlinky Animation Editor Version 6.5 Created by Arzoo. Help Document
 Version 6.5 Created by Arzoo Overview... 3 LEDBlinky Website... 3 Installation... 3 How Do I Get This Thing To Work?... 4 Functions and Features... 8 Menus... 8 LED Pop-up Menus... 16 Color / Intensity
Fluke 190-Series II Firmware Upgrade V11.44
 Fluke 190-Series II Firmware Upgrade V11.44 Requirements 1. Fluke 190- Series II ScopeMeter with firmware prior to V11.44 2. Supported models are: 190-102, 190-104, 190-062, 190-202, 190-204, 190-502,
PulseCounter Neutron & Gamma Spectrometry Software Manual
 PulseCounter Neutron & Gamma Spectrometry Software Manual MAXIMUS ENERGY CORPORATION Written by Dr. Max I. Fomitchev-Zamilov Web: maximus.energy TABLE OF CONTENTS 0. GENERAL INFORMATION 1. DEFAULT SCREEN
VIDEO GRABBER. DisplayPort. User Manual
 VIDEO GRABBER DisplayPort User Manual Version Date Description Author 1.0 2016.03.02 New document MM 1.1 2016.11.02 Revised to match 1.5 device firmware version MM 1.2 2019.11.28 Drawings changes MM 2
Log viewer and analyser for switchboard and downhole sensor
 Log viewer and analyser for switchboard and downhole sensor Novomet-Perm cc, 2010 2013 User guide User manual 2 http://www.novomet.ru/eng Novomet-Perm cc 395 Cosmonauts st, Perm, 614065, Russia Novomet
FS3. Quick Start Guide. Overview. FS3 Control
 FS3 Quick Start Guide Overview The new FS3 combines AJA's industry-proven frame synchronization with high-quality 4K up-conversion technology to seamlessly integrate SD and HD signals into 4K workflows.
Revision 1.2d
 Specifications subject to change without notice 0 of 16 Universal Encoder Checker Universal Encoder Checker...1 Description...2 Components...2 Encoder Checker and Adapter Connections...2 Warning: High
Lab experience 1: Introduction to LabView
 Lab experience 1: Introduction to LabView LabView is software for the real-time acquisition, processing and visualization of measured data. A LabView program is called a Virtual Instrument (VI) because
Field Test 2. Installation and operation manual OPDAQ Installation and operation manual
 Field Test 2 Installation and operation manual OPDAQ 17.08.25 Installation and operation manual January 2016 How to get copies of OpDAQ technical publications: 53, St-Germain Ouest Rimouski, Québec Canada
Intelligent Security and Fire Ltd
 User Manual Product ranges covered by this manual Vi-P14 Vi-P14A Document Reference Date Firmware Vi-Q4C1 Viq601a.doc 26/11/2009 From Viq001a21 Videoswitch Telephone 01252-851510 Ocean House, Redfields
EZ Encoder : Optical Incremental (P Series)
") 1. Introduction Our EZ Encoders effectively eliminate multiple encoder part numbers by bringing intelligence and security to the design. A four-digit LED display with two push-buttons enables the user
1. Introduction Our EZ Encoders effectively eliminate multiple encoder part numbers by bringing intelligence and security to the design. A four-digit LED display with two push-buttons enables the user
EAN-Performance and Latency
 EAN-Performance and Latency PN: EAN-Performance-and-Latency 6/4/2018 SightLine Applications, Inc. Contact: Web: sightlineapplications.com Sales: sales@sightlineapplications.com Support: support@sightlineapplications.com
SINGLE ZONE CLIMATE ZONING SYSTEM. Technical Manual. Polyaire Pty Ltd
 SINGLE ZONE CLIMATE ZONING SYSTEM Technical Manual Polyaire Pty Ltd 11-13 White Road GEPPS CROSS South Australia, 5094 Tel: (08) 8349 8466 Fax: (08) 8349 8446 www.polyaire.com.au CONTENTS Features 1 Application
Torsional vibration analysis in ArtemiS SUITE 1
 02/18 in ArtemiS SUITE 1 Introduction 1 Revolution speed information as a separate analog channel 1 Revolution speed information as a digital pulse channel 2 Proceeding and general notes 3 Application