2. Television and audio visual
|
|
|
- Victor Thomas
- 5 years ago
- Views:
Transcription
1 2. Television and audio visual 0
2 Figure 2.1 Industry metrics UK television industry Total TV industry revenue ( bn) Proportion of revenue generated by public funds 25% 25% 25% 24% 25% 23% Proportion of revenue generated by advertising 35% 33% 32% 31% 28% 30% Proportion of revenue generated by subscriptions 35% 36% 37% 39% 41% 41% TV as a proportion of total advertising spend 30% 28% 27% 27% 28% 29% Spend on originated output by 5 main networks ( bn) Digital TV take-up 61.9% 69.7% 86.3% 87.1% 91.4% 92.5% Proportion of DTV homes paying for TV (Q1) 64% 60% 55% 53% 55% 55% Viewing per head, per day (hours) in all homes Share of the five main channels in all homes 70% 67% 64% 61% 58% 56% Number of channels broadcasting in the UK Source: Ofcom/broadcasters/Advertising Association/Warc/BARB/GfK. Note: Public funds include the DCMS grant to S4C and BBC funding that is allocated to TV; TV as a proportion of total advertising spend excludes direct mail and is based on Advertising Association/Warc Expenditure Report ( spend on originations includes spend on nations and regions programming (not Welsh and Gaelic language programmes but some Irish language). Note that digital television take-up in Q had reached 93%. 1
3 2 Figure 2.2 Total TV industry revenue, by source Revenue ( m) 11,800 11,700 11,600 +6% +12% 54m +6% 49m +1% +3% 27m 19m +5.7% 11, m 11, % 11,747m 11,300 11, m 11,100 11,000 11,109m 2009 revenue PSB NAR Subscriber revenue PSB portfolio NAR Other NAR BBC TV spending Other 2010 revenue Source: Ofcom/broadcasters
4 3 Figure 2.3 Advertising revenue, by share m 4,000 3,136m 3,486m 1-year change (%) 11.2% 3,000 2,000 1, m 51m 453m 835m 786m 216m 207m 600m 538m 1,100m 1,273m m 7.8% 11.9% 6.2% 4.3% 11.5% 15.7% GMTV1 PSB portfolio channels Other multichannels Five Channel 4/S4C ITV1/Channel 3 Source: Ofcom/broadcasters. Note: Totals may not equal the sum of the components due to rounding. ITV1/Channel 3 includes ITV Plc, STV, UTV and Channel Television. GMTV1 includes ITV Breakfast.
5 Figure 2.4 Multichannel take-up in UK households % of homes 41.7% 44.7% 48.0% 56.7% 64.9% 71.8% 80.3% 87.2% 89.6% 92.1% 93.1% TV Households (m) Q Q Q Q Q Q Q Q Q Q Q Analogue terrestrial only Digital terrestrial only Analogue cable Digital cable Free-to-view digital satellite Analogue satellite Pay digital satellite Source: Ofcom, GfK NOP research from Q1 2007, previous quarters include subscriber data and Ofcom market estimates for DTT and free satellite Note: Digital terrestrial relates to DTTonly homes.
6 Figure 2.5 Number of broadcast HD homes: BSkyB, Virgin Media, Freesat and Freeview 9,000 Homes (000s) 8,000 7,000 6,000 5,000 4,000 3,000 2,000 1,000 0 Q Q Q Q Q Q Q Q Q Freeview HD Freesat HD Virgin Media Sky+ HD Source:BSkyB/Virgin Media/GfK Note: Figures represent latest available data. Freesat HD and Freeview HD figures based on HD device sales, therefore the cumulative number of HD homes is indicative only and 5 should be regarded as an upper boundary figure.
7 Figure 2.6 Usage and access to Freeview DTT services: Total Freeview enabled TVs (000) Homes (000 s) Total homes using Freeview Freeviewonly homes 0 Q Q Q Q Q Q Q Source: Ofcom estimates based on GfK research and sales data. Note: Q total Freeview-enabled TVs figure has been adjusted by Ofcom. 6
8 7 Figure 2.7 Live vs. time-shifted TV viewing, DVR homes Proportion of viewing (%) 100% 90% 80% 70% 60% 50% 40% 30% 20% 10% 0% 8% 8% 8% 7% 7% 7% 7% 7% 85% 85% 85% 86% Viewed 1-7 days after broadcast Viewed on same day Live Source: BARB. All individuals with DVRs. Note: New BARB panel introduced 1 Jan As a result pre- and post-panel change data must be treated with caution
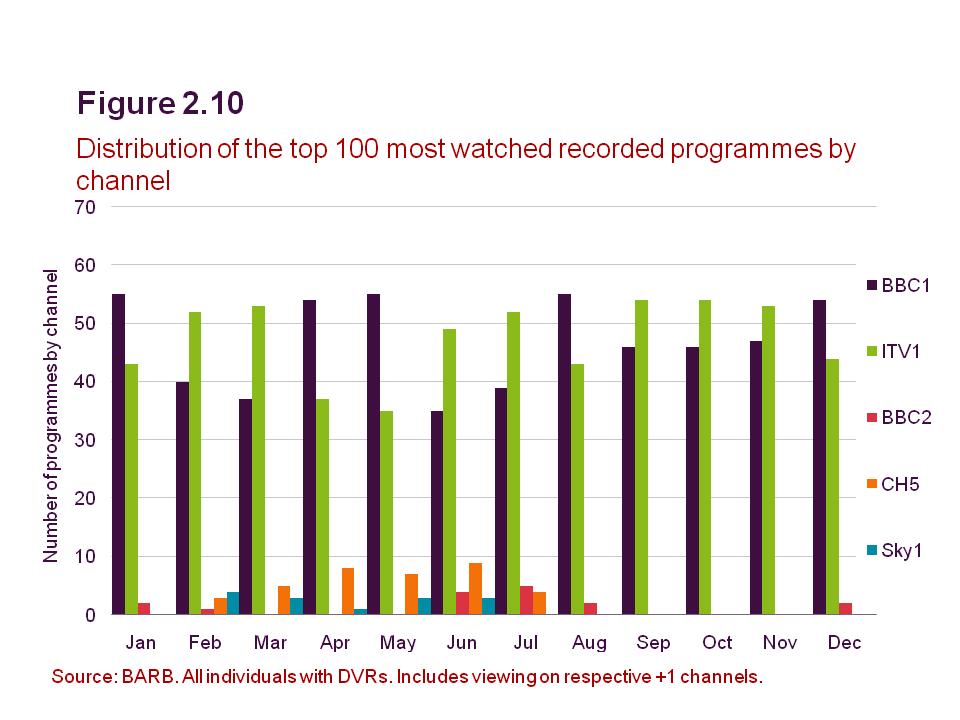
9 8 Figure top ten programmes all channels, DVR homes Programme Channel Date Recorded viewing (m) Live viewing (m) 1 Doctor Who BBC1 25/12/ Come Fly With Me BBC1 25/12/ The X Factor ITV1 03/10/ The Royle Family BBC1 25/12/ Sherlock BBC1 25/07/ EastEnders BBC1 19/02/ Gavin & Stacey BBC1 01/01/ Strictly Come Dancing BBC1 18/12/ Britain s Got Talent ITV1 05/06/ Upstairs Downstairs BBC1 26/12/ Source: BARB. All individuals with DVRs. Includes viewing on respective +1 channels. Only highest incidence of programmes reported.
10
11
12 11 Figure average, all time-shifted content 48% Proportion of total recorded content 52% Distribution of DVR viewing within 24 hours of broadcast Distribution of DVR viewing within one-seven days of broadcast 80 Proportion of viewers % % 14% 8% 5% 9% 6% 35% 25% 14% 9% 7% 6% 3% 0-1 hours 1-2 hours 2-3 hours 3-4 hours 4-8 hours 8-24 hours 1 day after 2 days after 3 days after 4 days after 5 days after 6 days after 7 days after Source: BARB. All individuals with DVRs. Includes viewing on respective +1 channels.
13 Figure 2.12 Average online catch-up TV requests, 2010 Average monthly sessions per person Universe Reach (%) BBC iplayer 4OD ITV Player Sky Player Source: UKOM/ Nielsen. Home and work panel. Applications included. Note: Universe reach is the percentage of all UK internet-accessible persons (aged 2+) who visited the site or used the application in the average month. Internet-accessible is defined as anyone who has access to an internet-enabled computer within the time periods covered. These figures are based on averages across each calendar month of
14 13 Figure average monthly online catch-up TV requests, by age group 100% 90% 80% 70% % 50% % 30% 20% 10% 0% BBC iplayer Channel 4oD ITV Player Sky Player Source: UKOM/ Nielsen. Home and work panel. Applications included. These figures are based on averages across each calendar month of
15 14 Figure average monthly online catch-up TV requests, by gender 100% 90% 80% 70% 60% Male 50% 40% 30% 20% 10% Female 0% BBC iplayer Channel 4oD ITV Player Sky Player Source: UKOM/ Nielsen. Home and work panel. Applications included. These figures are based on averages across each calendar month of 2010
16 15 Figure 2.15 Age profile of those who have a games console at home Any games console Fixed games console Handheld/ portable games player Total Source: Ofcom residential tracker, w Base: All adults 16+ (3,474). Which of the following do you, or does anyone in your household, have in your home at the moment?
17 16 Figure 2.16 Age profile of those who personally use a games console Any games console Fixed games console Handheld/ portable games player Total Source: Ofcom residential tracker, w Base: all adults 16+ (3,474). And do you personally use.
18 17 Figure 2.17 What consumers use games consoles for online gaming 19 Watching DVD/ Blue Ray DVDs 11 Browsing the web/internet 9 Watching programmes on BBC Iplayer 4 Watching 'live' TV programmes/content 22 Watching video content 10 IPTV Source: Ofcom residential tracker, w Base: all adults 16+ with access to a games console at home (1,793). QB4 (QB4) Which, if any, of these do you use your games console for?
19 Figure 2.18 Size of the children s television audience by time of year % of viewing audience Average Audience, 000s 06:00-06:30 07:30-08:00 09:00-09:30 10:30-11:00 12:00-12:30 13:30-14:00 15:00-15:30 16:30-17:00 18:00-18:30 19:30-20:00 21:00-21:30 22:30-23:00 Average Audience % iof viewing audience Source: BARB
20 19 Figure 2.19 Average hours of weekly TV viewing by children Average weekly viewing (Hrs, Mins) Children Children 4-9 Children Source: BARB
21 Figure 2.20 Proportion of time-shifted viewing by children, by daypart 25 % of viewing Children Children :00-07:00 07:00-08:00 08:00-09:00 09:00-10:00 10:00-11:00 11:00-12:00 12:00-13:00 13:00-14:00 14:00-15:00 15:00-16:00 16:00-17:00 17:00-18:00 18:00-19:00 19:00-20:00 20:00-21:00 21:00-22:00 22:00-23:00 23:00-24:00 Children Source: BARB
22 Figure 2.21 Proportion of total viewing in the child s bedroom, by daypart % of viewing Children Children :00-07:00 07:00-08:00 08:00-09:00 09:00-10:00 10:00-11:00 11:00-12:00 12:00-13:00 13:00-14:00 14:00-15:00 15:00-16:00 16:00-17:00 17:00-18:00 18:00-19:00 19:00-20:00 20:00-21:00 21:00-22:00 22:00-23:00 23:00-24:00 Children Source: BARB
23 Figure 2.22 Total TV industry revenue, by source Revenue ( m) 10,030 10,502 10,619 11,041 11,157 11,109 5,000 4,000 3,000 3,410 3,699 3,795 3,431 3,615 3,462 4,064 4,277 3,576 3,470 4,596 4,839 3,136 Growth: 11,747 3,486 1 year 5.7% 5% 11% 5yr CAGR 2% 6% -1% Subscription revenue Net advertising revenue 2,000 1,000 2,443 2,464 2,525 2,622 2,623 2,663 2, % 2% 3% 0% BBC income allocated to TV Other revenue Source: Ofcom/broadcasters Note: Figures expressed in nominal terms and replace previous Ofcom revenue data for TV industry, owing to restatements and improvements in methodologies. Subscription revenue includes Ofcom s estimates of BSkyB, Virgin Media, BT Vision, TalkTalkTV, Setanta Sports (until its closure), ESPN and Top Up TV television subscriber revenue in the UK (Republic of Ireland revenue is excluded). It also excludes revenue generated by broadband and telephony. Other includes TV shopping, sponsorship, interactive (including premium-rate telephony services), programme sales and S4C s grant from the DCMS. The BBC restated licence fee revenue in Totals may not equal the sum of the components due to rounding. 22
24 23 Figure 2.23 TV industry revenues, by share TV industry revenue shares (%) 10,030 10,502 10,619 11,041 11,157 11,109 11, % 40% 41.4% 40.8% 34.0% 35.2% 35.7% 36.8% 38.3% 30% 34.2% 34.4% 32.6% 32.4% 28.2% 31.1% 29.7% Subscription revenue Net advertising revenue 20% 10% 24.4% 23.5% 23.8% 23.7% 23.5% 24.0% 22.7% BBC income allocated to TV 0% 7.4% 6.9% 7.9% 7.1% 7.1% 6.4% 6.2% Other revenue Source: Ofcom/broadcasters Note: Figures expressed in nominal terms and replace previous Ofcom revenue data for TV industry, owing to restatements and improvements in methodologies. Subscription revenue includes Ofcom s estimates of BSkyB, Virgin Media, BT Vision, TalkTalkTV, Setanta Sports (until its closure), ESPN and Top Up TV television subscriber revenue in the UK (Republic of Ireland revenue is excluded). It also excludes revenue generated by broadband and telephony. Other includes TV shopping, sponsorship, interactive (including premium-rate telephony services), programme sales and S4C s grant from the DCMS. The BBC restated licence fee revenue in Totals may not equal the sum of the components due to rounding.
25 Figure 2.24 Total TV industry revenue by sector Revenue ( m) 12,000 10,030 10,502 10,619 11,041 11,157 11,109 11,747 Growth 5yr 1 year CAGR 5.7% 2% 10,000 8,000 6,000 3,410 3,699 3,795 4,064 4,277 4,596 1,239 1,300 1,477 1,650 1,726 1,619 4,839 1,755 5% 8% 6% 6% Platform operators Commercial multichannels 4,000 2,843 2,906 2,725 2,603 2,420 2,123 2,359 11% -4% Main commercial PSB channels 2, ,538 2,597 2,622 2,725 2,734 2,768 2, Publicly-funded channels Source: Ofcom/broadcasters Note: Figures are nominal. Main commercial PSB channels comprise ITV1, STV, UTV, Channel Television, GMTV1, Channel 4, Five and S4C. Commercial multichannels comprise all multichannels including those owned by ITV1, Channel 4 and Five. Publicly-funded channels comprise BBC One, BBC Two, the BBC s portfolio of digital-only television channels and S4C. S4C is listed under publicly-funded and commercial analogue channels because it has a mixed advertising and public funding model. The BBC restated licence fee revenue in Totals may not equal the sum of the components due to rounding. 1% 1% 24
26 25 Figure 2.25 TV net advertising revenues, by source Net advertising revenue ( m) ,239m 3,431m 3,615m 3,462m 3,576m 3,470m 3,136m 3,487m Growth 1 year 5yr CAGR m 640m 758m 105m 173m 759m 803m 276m 386m 808m 459m 786m 453m 835m 507m 11% 6% 12% -1% 2% 24% Commercial multichannels Commercial PSB portfolio channels ,563m 2,686m 2,684m 2,427m 2,387m 2,204m 1,896m 2,144m 13% -4% Main commercial PSB channels Source: Ofcom/broadcasters. Note: Figures expressed are in nominal terms and replace previous data published by Ofcom. Main commercial PSB channels comprise ITV1, STV, UTV, Channel Television, 1/DaybreakGMTV1/Daybreak, Channel 4, Five and S4C; Commercial PSB portfolio channels include, where relevant, ITV2, 3, 4, Men & Motors, CiTV, E4, More 4, Film 4, 4Music, Five USA and Fiver (and their +1 channels). For previous years closed channels have also been included. Sponsorship revenueis not included. Totals may not equal the sum of the components due to rounding.
27 26 Figure 2.26 TV net advertising revenue market shares: Proportion of NAR by broadcaster (%) 100% 80% 60% 40% 20% 0% Total = 3,470m Total = 3,136m Total = 3,486m 23.3% 25.1% 24.0% 13.2% 14.4% 14.5% 1.6% 1.6% 1.6% 7.8% 6.6% 6.2% 18.1% 17.2% 17.2% 36.1% 35.1% 36.5% Other multichannels PSB portfolios GMTV1 Five Channel 4/S4C ITV1/Channel 3 Source: Ofcom/broadcasters. Note: ITV1/Channel 3 includes ITV1, STV, UTV and Channel Television.
28 Figure 2.27 Breakdown of other / non-broadcast revenue: 2010 Total non-broadcast revenue = 732m (2.7%) Other Revenue 125m (7%) Sponsorship 178m (-6%) TV Shopping 190m (16%) Programme Sales 36m (39%) Interactive 53m (-21%) Other Public Funding (S4C) 102m (-1%) Pay-per view 48m (-17%) Source: Ofcom/broadcasters. Note: Percentage figures in brackets represent year-on-year change. TV shopping represents aggregate operating margin of products sold via television. Percent figures represent year-on-year change. Totals may not equal the sum of the components due to rounding. Owing to the nature of these revenue components, annual changes may be a function of a higher number of broadcaster returns being made by the time of writing, rather than material changes in the contributions that these revenue components are making to total industry income. 27
29 28 Figure 2.28 Revenue generated by multichannel broadcasters, by genre: 2010 Total revenue = 4,100m across the eight genres included (10%) News 64m (-52%) Leisure 54m (-22%) Movies 561m (4%) Music 104m (-4%) Entertainment 1,200m (11%) Sport 1,800m (17%) Factual 201m (36%) Children's 164m (3%) Source: Ofcom/broadcasters Note: Percentage figures in brackets represent year-on-year change. The figures in this chart include all sources of revenue accruing to multichannels and are expressed in nominal terms. This includes those set out in Figure 1.22 plus wholesale subscriber payments from platform operators.
30 Figure 2.29 Spend on network TV programmes: m 5,500 5,000 4,500 4,000 3,500 3,000 2,500 2,000 1,500 1, ,972m 5,108m 5,107m 191m 219m 224m 378m 528m 623m 840m 802m 868m 205m 149m 224m 210m 216m 206m 361m 357m 507m 467m 672m 755m 856m 810m 799m 1,166m 1,199m 1,338m 5,369m 162m 204m 230m 348m 475m 716m 847m 869m 1,546m yr change Source: Ofcom/broadcasters. Note: Figures expressed in nominal terms. Figures do not include spend on nations and regions output. BBC digital channels includes BBC Three, BBC Four, BBC News Channel, BBC Parliament, CBBC and CBeebies (but not BBC HD). Other digital channels include all genres (excluding Sports and Films). Programme spend comprises in-house commissions, productions, commissions from independents, spend on first-run acquired programmes, spend on rights and on repeats (originations or acquisitions). 5% 9% -3% 12% -3% 2% -5% 5% 9% 16% Five Other PSB portfolio channels BBC digital channels BBC Two Channel 4 Other digital channels ITV1 + GMTV1 BBC One Film/Sport channels 29
31 30 Figure 2.30 Spend on first-run originated output on the five main networks m 3,000 2,636m 2,633m 2,598m 2,616m 2,413m 2,522m Growth 1 year 5yr CAGR 5% -1% 2,500 2,000 1, m 321m 323m 303m 335m 285m 246m 239m 615m 620m 603m 646m 266m 256m 185m 208m 614m 628m 4% 13% 2% -5% -9% 0% Regional Late night Day time 1, ,349m 1,407m 1,427m 1,427m 1,358m 1,420m 5% 1% Peak time Source: Ofcom/broadcasters. Note: Figures are expressed in 2010 prices. They include GMTV1, spending in the nations and regions on Englishlanguage programming (and a small amount of Irish-language programmes) but do not include the BBC s digital channels.
32
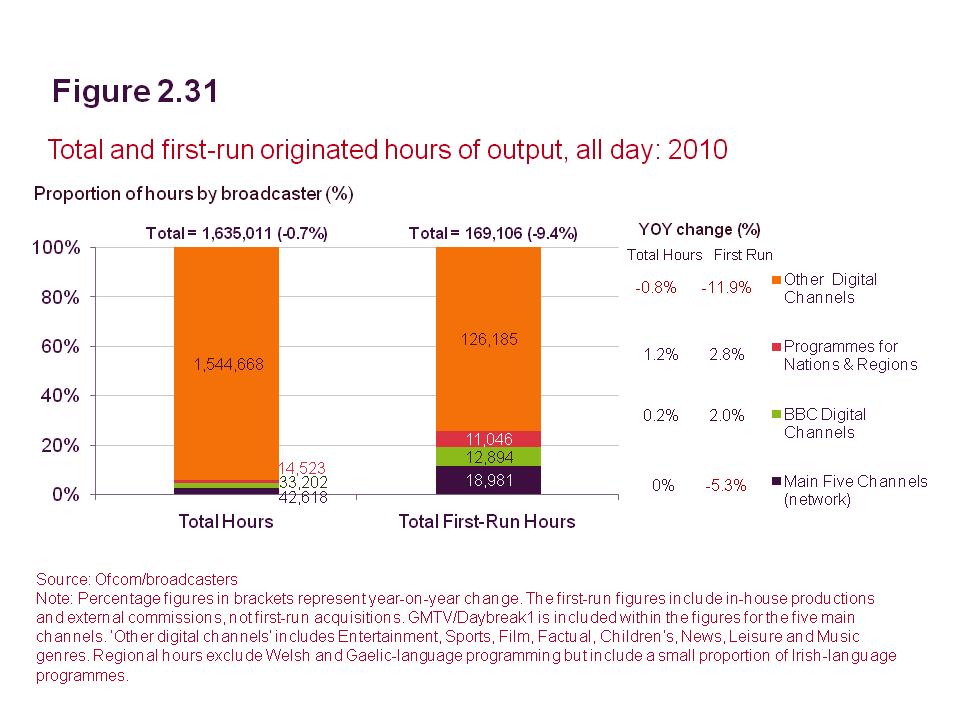
33 Figure 2.32 Hours of first-run originated output on the five main channels Growth 1 Year 5 yr CAGR 32,866 33,379 34,048 33,045 30,485 30, % -1.8% 35,000 30,000 25,000 12,114 11,825 11,859 11,912 10,439 11, % -1.8% Regional 20,000 15, % -2.5% Non-peak network 15,142 16,021 16,646 15,536 14,632 13,316 10,000 5,000 5,610 5,533 5,543 5,597 5,414 5, % 0.2% Peak-time network Source: Ofcom/broadcasters. Note: Figures include GMTV1 but do not include the BBC s digital channels. Regional hours exclude Welsh and Gaelic-language programming but do include a small proportion of Irish-language programmes. 32
34 33 Figure 2.33 First-run originated output by the PSBs per week, all day and peak time All Day Peak-Time Hours per week BBC digital channels Five Channel 4 ITV1+GMTV1 Hours per week BBC digital channels Five Channel 4 ITV1+GMTV BBC Two BBC One BBC Two BBC One Source: Ofcom/broadcasters. Note: Figures do not include spend on nations and regions output.
35 Figure 2.34 Genre mix on five main PSB channels in peak time, by hours Proportion of total hours 100% 80% 60% 7,933 7,936 7,929 7,923 7,978 7,964 1,395 1, , ,935 1, ,954 1,277 1, ,952 1,833 1, ,746 8, , ,648 Sport Light Entertainment & Modern Music Films Drama Education General Factual 40% 2,105 2,253 2,149 2,370 2,365 2,656 2,512 Religious/Ethics Children's 20% 0% Arts & Classical Music Current Affairs Source: Ofcom/broadcasters. Note: Includes five main channels including GMTV1, figures do not include hours of nations and regions output. News 34
36 35 Figure 2.35 Genre mix on five main PSB channels in daytime Proportions of total hours 100% 80% 60% 21,668 21,553 21,313 21,703 21,612 21,597 21,654 1,958 1,837 1,753 1,687 1,796 1,505 1,650 2,810 2,713 2,491 2,370 2,435 2,814 2,596 1,811 1,716 1,593 1,645 1,557 2,080 2,464 2,056 1,797 2,654 2,759 2,817 2,590 2, Sport Light Entertainment & Modern Music Films Drama Education 40% 3,150 3,512 3,744 4,368 4,637 4,775 5,232 General Factual Religious 4,906 4,575 4,333 4,275 Children's 4,074 4,137 4,214 20% Arts & Classical Music ,299 3,191 3,041 3,068 2,901 2,881 Current Affairs 2,793 0% News Source: Ofcom/broadcasters. Note: Includes five main channels plus GMTV1. Figures do not include hours of nations and regions output.
37 36 Figure 2.36 The BBC s digital channels genre mix by hours: all day Output (hrs) Investment ( m) 100% 80% 60% 40% 32, m 233m 223m 224m 216m 206m 230m 1,738 1,690 2,210 1,788 1,576 1,622 1,588 1,143 1,452 1,478 1,386 1,743 1,569 1,532 1,768 1,167 1,077 1,048 1,182 1,077 1,296 2,297 2,482 2,503 2,335 2,471 2,629 2,405 8,021 8,033 7,957 8,326 8,347 8,406 8, ,838 32, , ,168 1,331 1,339 1,472 Other Light Entertainment & Modern Music Arts & Classical Music General Factual Children's 20% 17,890 17,674 16,762 16,740 16,593 16,546 16,460 Current Affairs 0% Source: Ofcom/broadcasters. Note: BBC digital channels include BBC Three, BBC Four, BBC News 24, BBC Parliament, CBBC, CBeebies. Investment figures are in 2009 prices. Other includes: Education, Drama, Film, Religion and Sports. The BBC allocated Parliamentary coverage to the Current Affairs genre in the data for 1998 to From 2004, it has been allocated to either News or Current Affairs. News
38 37 Figure 2.37 Total multichannel hours and first-run originations/acquisitions, 2010 Proportion of hours by channel genre (%) Total = 1,544,668 Total (2009 = 1,562,613) Total = 250,253 (Total 2009 = 250,819) 1 year change % Total First Run 100% 171,074 17,598 4% 206% Movies 80% 281,280 34,045 1,496 6% -15% Music 32, ,884 81,042-65% -60% Leisure 60% 40% 20% 0% 224, , , ,615 All Hours 50,271 5,085 6,729 53,987 First-Run Hours 6% -10% 46% 46% -15% -64% -17% 9% 0% -5% News Source: Ofcom/broadcasters Note: Broadcast hours exclude Sky Box Office and barker channels, which promote TV content. First-run hours include first-run in-house, commissioned and acquired content. Sport Factual Kids Entertainment
39 38 Figure 2.38 Content spend by commercial multichannels in key genres: m 2,500 2,000 1,500 Total 2,086m 23m 59m 100m 279m 32m 56m Total 2,322m 23m 23m 71m 42m 99m 257m 518m 1 year change % 2% -29% -24% Music Leisure Children's 479m 19% Factual 1,000-1% News m 1,289m -8% Films % 22% Entertainment Sport Source: Ofcom/broadcasters. Note: Excludes BBC digital channels.
40 39 Figure 2.39 Online TV revenues Revenues ( m) Annual Growth 95% 116% 14% 12% 152% Total FTV views Subscriptions PPV transactions DTO transactions Source: Screen Digest. Note: FTV = free to view; PPV = pay per view; DTO = download to own. Due to different data sources this chart is not directly comparable with previous charts.
41 40 Figure 2.40 Availability of digital television platforms Proportion of population covered (%) 100% 80% 60% 40% 20% 0% 98% 85% Digital satellite television Digital terrestrial television Digital cable television 48% Source: Ofcom research/operators. Note that the DTT coverage figures represent the availability of a service of 17 television channels. DTT coverage levels represent Ofcom estimates. Data correct as at June 2011.
42 Figure 2.41 Take-up of multichannel TV on main sets TV Households (m) Q Q Q Q Penetration of homes (%) 41.7% 44.7% 48.0% 56.7% 64.9% 71.8% 80.3% 87.2% 89.6% 92.1% 93.1% Q Q Q Q Q Q Q Digital terrestrial only Analogue cable Digital cable Free-to-view digital satellite Analogue satellite Pay digital satellite Source: Ofcom, GfK, Sky, Virgin Media. Data from Q are based on consumer research, previous quarters use platform operator data, research and Ofcom estimates. Note: Digital terrestrial relates to DTT-only homes.
43 Figure 2.42 Platform share, by TV set Penetration (%) 100% 80% 60% 40% 20% 0% Main TV set TV Set 2 TV Set 3 TV Set Q Q Q Q Q Q Q Q Q Q Q Q Q Q Q Q Q Q Q Q Analogue terrestrial DTT Cable Satellite Source: GfK NOP consumer research. Note: columns do not always equal 100% due to the exclusion of some services from the chart, such as TV via broadband.
44 Figure 2.43 DTT, satellite and cable net additions, year to Q Homes added (000 s) DTT-only additions Pay-satellite additions Free-to-air satellite additions Cable additions Source: Pay platform additions based on Virgin Media results and Ofcom- estimated UK figures based on BSkyB UK & Ireland results. DTT and free satellite additions based on Q and Q consumer survey results. Note: Chart uses multiple sources and is therefore intended to be considered only as a general indication of performance. *
45 Figure 2.44 Platform demographics by age, socio-economic group and viewing hours: 2010 % platform profile Average Hours per day 100% 80% 60% 40% 20% 0% AB C1 C2 DE 18% 23% 13% 11% 27% 23% 23% 44% 39% 32% 30% 31% 30% 18% 31% 18% 21% 16% 19% 24% 38% 44% 40% 30% 31% 31% 32% 27% 28% 20% 15% 13% 14% 13% 19% 25% 19% 21% 28% 26% Source: Ofcom and BARB 44
46 Figure 2.45 Average hours of television viewing per day, by age, all homes Hours viewed 6 Individuals Children Adults Adults Adults Adults Adults Adults Source: BARB. Note: due to a new BARB measurement panel from 2010 onwards, 2010 data are not directly comparable with previous years. 45
47 Figure 2.46 Average weekly TV reach in all homes, by channel 15-minute consecutive weekly reach full weeks (%) 100% 80% 60% 40% 20% 82% 83% 80% 79% 78% 78% 79% 77% 77% 71% 70% 69% 79% 74% 74% 63% 69% 68% 60% 61% 68% 57% 64% 57% 58% 63% 59% 62% 56% 50% 58% 55% 57% 54% 54% 41% 44% 44% 40% 42% 40% 40% Multichannels BBC One BBC Two ITV1 C4 + S4C Five 0% Source: BARB Note: due to a new BARB measurement panel from 2010 onwards, 2010 data are not directly comparable with previous years. Note: In 2010 C4 and S4C became two separate channels following digital switchover in Wales. For the purposes of this report the two channels remain labelled together in relevant charts. S4C weekly reach s in 2010 was 0.7%. 46
48 Figure 2.47 Average 2010 audiences, weekdays/weekends: by day part, all homes Average audience (millions) Weekend Weekday :00-07:00 09:00-10:00 12:00-13:00 15:00-16:00 18:00-19:00 21:00-22:00 00:00-01:00 03:00-04:00 Source: BARB 47
49 48 Figure 2.48 Average 2010 weekday audiences, by day part and age, all homes Average audience (millions) Children Adults Adults Adults Adults Adults Adults :00-07:00 Source: BARB 09:00-10:00 12:00-13:00 15:00-16:00 18:00-19:00 21:00-22:00 00:00-01:00 03:00-04:00
50 49 Figure 2.49 Average 2010 weekend audiences, by day part and age, all homes Average audience (millions) Children Adults Adults Adults Adults Adults Adults :00-07:00 Source: BARB 09:00-10:00 12:00-13:00 15:00-16:00 18:00-19:00 21:00-22:00 00:00-01:00 03:00-04:00
51 Figure 2.50 Channel shares in all homes: 1983 to 2010 Audience share, all homes (%) 60% 50% 40% 30% 20% 10% BBC One BBC Two ITV 1 Channel 4 + S4C Five Others 0% Source: BARB, TAM JICTAR and Ofcom estimates. Note: due to a new BARB measurement panel from 2010 onwards, 2010 data are not directly comparable with previous years. Note: In 2010 C4 and S4C became two separate channels following digital switchover in Wales. For the purposes of this report the two channels remain labelled together in relevant charts.s4c 2010 channel share = 0.1%. 50
52 Figure 2.51 Five main PSB channels audience share, all homes Audience share (%) 80% 70% 60% 50% 40% 30% 20% 10% 0% 73.8% 70.3% 66.8% 63.6% 60.8% 57.8% 55.5% 6.6% 9.8% 22.8% 10.0% 6.4% 9.7% 21.5% 5.7% 9.8% 5.2% 8.6% 5.0% 7.8% 4.9% 6.8% 4.5% 6.3% 19.7% 19.2% 18.4% 17.8% 17.0% 9.4% 8.8% 8.6% 7.8% 7.5% 6.9% 24.7% 23.3% 22.8% 22.0% 21.8% 20.9% 20.8% Source: BARB. Note: due to a new BARB measurement panel from 2010 onwards, 2010 data are not directly comparable with previous years. Note: In 2010 C4 and S4C became two separate channels following digital switchover in Wales. For the purposes of this report the two channels remain labelled together in relevant charts.s4c 2010 channel share = 0.1%. Five Channel 4 + S4C ITV1 BBC Two BBC One 51
53 Figure 2.52 Five main PSB channels audience shares, by platform Audience share (%) 100% 100% 80% 60% 40% 74% 69% 65% 69% 62% 60% 65% 62% 60% 58% 49% 48% 49% 48% 48% 56% 56% 49% Terrestrial homes Digital terrestrial homes All homes 20% Cable and satellite homes 0% Dec-05 Dec-06 Dec-07 Dec-08 Dec-09 Dec-10 Source: BARB, all homes, all viewers, various platforms. Note: due to a new BARB measurement panel from 2010 onwards, 2010 data are not directly comparable with previous years. Note: In 2010 C4 and S4C became two separate channels following digital switchover in Wales. For the purposes of this report the two channels remain grouped together in relevant charts.s4c 2010 channel share (all homes)= 0.1%. 52
54 53 Figure 2.53 Channel share, by platform: 2010 Audience share (%) 60% Analogue terrestrial Digital terrestrial Digital cable Digital satellite 53% 50% 40% 37% 42% 28% 20% 0% 21% 18% 18% 17% 16% 16% 15% 11% 7% 6% 6% 6% 6% 5% 5% 4% 3% 3% BBC One BBC Two ITV1 C4 + S4C Five Other Source: BARB. Note: In 2010 C4 and S4C became two separate channels following digital switchover in Wales. For the purposes of this report the two channels remain labelled together in relevant charts.s4c 2010 channel share (all homes) = 0.1%.
55 Figure 2.54 PSB and portfolio channel shares in multichannel homes Audience share (%) 100% 80% 60% 40% 20% 35.1% 33.1% 31.2% 29.7% 28.1% 28.4% 28.6% 7.4% 9.2% 11.3% 13.6% 15.9% 16.9% 17.4% 57.5% 57.7% 57.6% 56.7% 56.0% 54.8% 54.0% Other digital channels PSB portfolio channels PSB channels 0% Source: BARB. Note: due to a new BARB measurement panel from 2010 onwards, 2010 data are not directly comparable with previous years. Note: In 2010 C4 and S4C became two separate channels following digital switchover in Wales. For the purposes of this report the two channels remain grouped together in relevant charts.s4c 2010 channel share = 0.1%. 54
56 Figure 2.55 Broadcaster portfolio shares in multichannel homes Audience share (%) 100% 14.3% 14.0% 12.9% 12.8% 12.3% 11.8% 12.8% 2.8% 2.8% 2.6% 2.7% 2.6% 2.6% 3.4% 3.1% 2.9% 2.7% 2.6% 2.7% 1.9% 4.2% 4.0% 4.0% 3.9% 3.9% 4.0% 4.1% 80% 10.4% 9.3% 8.7% 7.6% 6.8% 7.4% 8.4% 5.1% 5.3% 5.1% 5.6% 5.9% 6.0% 5.9% 60% 8.6% 9.6% 11.2% 11.2% 11.7% 11.5% 11.5% 40% 21.7% 22.1% 22.0% 22.3% 22.6% 22.6% 22.7% Other Virgin Media Viacom UKTV BSkyB* Five 20% 29.5% 29.8% 30.6% 31.2% 31.8% 31.4% 32.3% Channel 4 ITV 0% Source: BARB. Note: due to a new BARB measurement panel from 2010 onwards, 2010 data are not directly comparable with previous years.*bskyb took ownership of VMTV in June 2010, Virgin Media TV portfolio shares are included in the BSkyB figure for the whole of ITV includes all ITV network channels, not just those owned by ITV plc. Note: In 2010 C4 and S4C became two separate channels following digital switchover in Wales. For the purposes of this report the two channels remain grouped together in relevant charts.s4c 2010 channel share = 0.1%. BBC 55
57 Figure 2.56 BBC portfolio share in multichannel homes Audience share (%) 29.5% 29.8% 30.6% 31.2% 31.8% 31.4% 32.2% 1.0% 0.4% 1.1% 0.4% 1.2% 0.5% 0.5%0.6% 0.6% 0.5% 0.6% 0.6% 0.6% 1.2% 1.3% 1.3% 0.5% 0.6% 0.8% 0.8% 0.6% 1.3% 1.3% 30% 0.6%0.7% 1.3% 1.3% 0.8% 1.1% 0.7% 0.9% 1.3% 1.4% 0.2% 0.3% 25% 6.7% 6.9% 7.1% 7.0% 6.9% 6.6% 6.9% 20% 15% 10% 19.5% 19.3% 20.0% 19.9% 20.4% 20.0% 20.2% 5% Other CBeebies CBBC BBC News 24 BBC Four BBC Three BBC Two BBC One 0% Source: BARB Note: Other includes BBC Parliament, BBC Choice, BBC HD and BBC Knowledge. Due to a new BARB measurement panel from 2010 onwards, 2010 data are not directly comparable with previous years 56
58 Figure 2.57 ITV portfolio shares in multichannel homes Audience share (%) 25% 21.7% 22.1% 22.0% 22.3% 22.6% 22.6% 22.7% 20% 1.0% 1.7% 1.2% 2.0% 0.5% 0.7% 0.9% 0.9% 1.0% 1.4% 1.4% 1.6% 1.8% 2.2% 2.0% 2.2% 2.4% 2.6% 2.6% Other CITV 15% ITV4 10% 18.9% 18.4% 17.5% 17.6% 17.2% 16.9% 16.6% ITV3 5% ITV2 0% Source: BARB Note: Other includes (when relevant) ITV Play, Men & Motors, GMTV2, Granada Breeze, Plus, ITV News. ITV1, ITV2, ITV3 and ITV4 and include +1 services share and HD services from Due to a new BARB measurement panel from 2010 onwards, 2010 data are not directly comparable with previous years. ITV1 57
59 Figure 2.58 Channel 4 portfolio shares in multichannel homes Audience share (%) 8.6% 9.6% 11.2% 11.2% 11.7% 11.5% 12% 10% 8% 6% 4% 2% 1.2% 7.3% 0.1% 1.6% 0.6% 0.5% 1.9% 7.9% 8.2% 0.2% 0.8% 0.9% 1.8% 7.4% 11.5% 0.3% 0.3% 0.3% 0.8% 0.8% 0.8% 1.0% 1.2% 1.2% 1.0% 1.0% 1.2% 1.8% 1.8% 1.9% 6.8% 6.4% 6.1% 4Music C4+1 More4 Total Film4 Total E4 Total C4 + S4C 0% Source: BARB. Note: due to a new BARB measurement panel from 2010 onwards, 2010 data are not directly comparable with previous years.e4, More4 and Film 4 respective +1 channel shares are included. Note: In 2010 C4 and S4C became two separate channels following digital switchover in Wales. For the purposes of this report the two channels remain labelled together in relevant charts.s4c 2010 channel share = 0.1%. 58
60 Figure 2.59 Five portfolio shares in multichannel homes Audience share (%) 7% 5.1% 5.3% 5.1% 5.6% 5.9% 6.0% 5.9% 6% 5% 4% 0.1% 0.6% 0.1%0.4% 0.7% 0.8% 0.6% 0.6% 0.9% 0.5% Five USA/5 USA 3% 2% 5.1% 5.3% 4.9% 4.6% 4.7% 4.7% 4.5% Fiver/5* Five 1% 0% Source: BARB Note: 5* and 5 US include their +1 service share. Due to a new BARB measurement panel from 2010 onwards, 2010 data are not directly comparable with previous years 59
61 60 Figure 2.60 BSkyB portfolio shares in multichannel homes Audience share (%) 12% 10% 8% 6% 4% 2% 0% 10.4% 9.2% 8.7% 7.6% 6.8% 7.4% 0.3% 0.6% 2.9% 3.1% 0.3% 0.1% 0.6% 0.5% 2.4% 2.5% 2.7% 2.2% 0.5% 2.2% 1.6% 3.6% 3.4% 3.2% 3.2% 0.5% 2.1% 1.5% 1.5% 2.6% 2.9% 2.7% Source: BARB. Note: due to a new BARB measurement panel from 2010 onwards, 2010 data are not directly comparable with previous years. *BSkyB took ownership of VMTV in June 2010, Virgin Media TV portfolio shares are included in the BSkyB figure for the whole of % 2.4% 8.4% 1.5% 0.0% 0.6% 2.2% 1.3% Former Virgin TV portfolio* Sky Arts/Real Lives Sky Travel Sky News Sky One/Two/Three Sky movie channels Sky sports channels
62 61 Figure 2.61 UKTV portfolio shares in multichannel homes Audience share (%) 5% 4.2% 4.0% 4.0% 3.9% 3.9% 4.0% 4.1% Other 4% 3% 2% 1% 0% 0.2% 0.2% 0.1% 0.2% 0.3% 0.4% 0.8% 1.9% 0.3% 0.3% 0.1% 0.1% 0.2% 0.1% 0.2% 0.4% 0.2% 0.7% 1.3% 0.2% 0.5% 1.2% 1.3% 0.3% 0.2% 0.6% 0.5% 0.2% 0.1% 0.4% 0.6% 0.2% 0.5% 0.4% 0.1% 0.1% 0.7% 0.6% 0.3% 0.1% 0.1% 0.2% 0.6% 0.4% 0.4% 0.4% 0.4% 0.2% 0.3% 0.3% 1.6% 1.4% 1.2% 1.1% 1.2% 1.2% UKTV G2/Dave UKTV Drama/Alibi UKTV Documentary/Eden UKTV Food/Good Food UKTV History/Yesterday UKTV Style/Home UKTV Gold/G.O.L.D/Watch Source: BARB Note: UKTV portfolio channels have evolved over the past twelve months. In the 2008 figures, new channel names and shares have been matched to old channels. Due to a new BARB measurement panel from 2010 onwards, 2010 data are not directly comparable with previous years.
63 62 Figure % 22% 20% 18% 16% 14% 12% 10% Aggregate shares of channel genres in multichannel homes Audience share (%) 8% 6% 4% 2% 0% Dec-04 Dec-05 Dec-06 Dec-07 Source: BARB. Note: Number of channels does not include +1 services. Due to a new BARB measurement panel from 2010 onwards, 2010 data are not directly comparable with previous years Dec-08 Dec-09 Dec-10 Entertainment Childrens Sport Movies Documentaries Music News Lifestyle and Culture No. of channels
64 63 Figure 2.63 The top channels by share in multichannel homes: 2009 to 2010 Share Rank Share Rank Channel Channel BBC One 20.2% 1 1 Film4 1.2% ITV1 16.6% 2 2 Dave 1.2% Channel 4 7.0% 3 3 Sky Sports 1 1.2% 13 9 BBC Two 6.6% 4 4 More 4 1.1% Five 4.5% 5 5 BBC News 1.1% ITV2 2.5% 6 6 ITV4 1.0% ITV3 2.3% 7 8 Sky One 0.9% E4 1.9% 8 7 Pick TV 0.9% BBC Three 1.4% 9 12 Channel One 0.9% CBeebies 1.3% USA 0.9% Source: BARB. Note: Includes channels +1 services. Due to a new BARB measurement panel from 2010 onwards, 2010 data are not directly comparable with previous years.
65 64 Figure 2.64 Age and gender profile of the 30 most-viewed channels in multichannel homes Older Sky Living Female Cbeebies ITV1 ITV2 ITV3 E4 5 USA BBC1 CH5 Pick TV More4 CH4 5* BBC2 BBC3 Yesterday BBC4 BBC News Sky News GOLD Film4 Sky 1 Channel One Comedy Central ITV4 Dave Sky Sports 1 Sky Sports News Male Disney Channel CBBC Younger Source: BARB Note: The profile of a channel is calculated relative to the television population in multichannel homes. Includes channel s +1 services.
66 65 Figure 2.65 Unique audiences to selected online film and TV sites Unique audience (m) Growth (%) 2.5 Apr10 Apr LOVEFiLM. com MSN Video n/a blinkbox Virgin Media Movies SeeSaw Hulu 0 Apr- 10 May- 10 Jun- 10 Jul- 10 Aug- 10 Sep- 10 Oct- 10 Nov- 10 Dec- 10 Jan- 11 Feb- 11 Mar- 11 Apr FindAnyFilm.com Source: UKOM/Nielsen, home and work panel.
67 Figure 2.66 Monthly time spent per person on selected online film and TV sites Time per person (h:mm:ss) 0:25:00 blinkbox 0:20:00 LOVEFiLM.com 0:15:00 SeeSaw 0:10:00 Virgin Media Movies 0:05:00 MSN Video 0:00:00 FindAnyFilm.com Apr- 10 May- 10 Jun- 10 Jul- 10 Aug- 10 Sep- 10 Oct- 10 Nov- 10 Dec- 10 Jan- 11 Feb- 11 Mar- 11 Apr- 11 Hulu Source: UKOM/Nielsen, home and work panel. 66
68 67 Figure 2.67 Proportion of adults with home internet who watch online catch-up TV Proportion of households (%) 50% 40% 30% 20% 40% 41% 35% 33% 31% 23% Q Q Q % 38% 35% 31% 29% 24% 24% 24% 24% 18% 14% 26% 34% 38% 21% 32% 29% 10% 10% 0% Total Male Female Source: Ofcom research Q QE12. Which, if any, of these do you or your household use the internet for whilst at home? Base: All adults who have the internet at home (n=2534 UK, , , , , , 1234 Male, 1300 Female)
69 68 Figure 2.68 Video on demand use in Virgin Media homes VoD views per month/vod reach m 53m 87m Average total VoD views per month Average VoD views per month per user 47% 52% 64% Average VoD reach Q Q Q Source: Virgin Media company results
70 69 Figure 2.69 Unique audiences to selected video-sharing sites Unique audience (m) Growth (%) Apr10 Apr Apr-10 Jul-10 Oct-10 Jan-11 Apr Total Videos / Movies YouTube Google Video MSN Video Dailymotion Bing Videos Metacafe Vimeo Yahoo! Video Source: UKOM/Nielsen, home and work panel.
71 Figure 2.70 Monthly time spent per person on selected video-sharing sites Time per person (h:mm:ss) 1:15:00 1:00:00 0:45:00 0:30:00 0:15:00 0:00:00 Apr-10 Jul-10 Oct-10 Jan-11 Apr-11 Ave. Videos / Movies YouTube Veoh Dailymotion Bing Videos Metacafe MSN Video Yahoo! Video Google Video Source: UKOM/Nielsen, home and work panel. 70
72 71 Figure 2.71 Popularity of top ten most viewed UK YouTube channels Number of views (m) Subscribers to channel (000) Number of views (m) Subscribers (000) The X Factor UK BBC Britain's Got Talent Parlophone Source: YouTube statistics June BBC Worldside HDCYT ITN Showbiz AATW Eagle Rock Massagevideo
73 72 Figure 2.72 Consumer attitudes towards television programme standards, by age: 2010 % of respondents 100% 4% 8% 7% 12% 13% 17% Don't know 80% 60% 55% 59% 58% 51% 44% Improved 40% Stayed the same 20% 0% 31% All Adults (16+) 20% 28% 41% 48% Got worse Source: Ofcom 2010 Media Tracker survey. Fieldwork carried out by BDRC Continental Research. Q30 Do you feel that over the past year, television programmes have improved, got worse or stayed about the same? Base: All adults aged 16+ (2104) (643 aged 16-34, 710 aged 35-54,328 aged 55-64, 423 aged 65+)
74 73 70% 60% 50% 40% 30% 20% 10% 0% Figure 2.73 Reasons why viewers thought TV programme quality deteriorated, 2010 % of respondents. Base: All those who felt TV programme standards got worse over the past year 60% 51% 61% All Adults (16+) % 61% 42% 42% 38% 37% 35% More repeats Lack of variety General lack of quality 38% 37% 34% 31% 31% 31% 27% 26% 26% 24% More reality shows 13% 12% 10% 8% 8% 6% 6% 7% 7% 8% 5% 6% 5% 5% 2% More bad language More Violence More sex/sexual content Source: Ofcom 2010 Media Tracker survey. Fieldwork carried out by BDRC Continental Research. Q32 In what ways do you think the television programmes have got worse over the past year? Base: All adults 16+ saying programmes got worse over past year (673) (130 aged 16-34, 204 aged 35-54, 134 aged 55-64, 205 aged 65+).
75 74 Figure 2.74 PIN/password-protected TV, 2010 % of respondents. Base: All those aware of features their systems have to block certain programmes/channels 100% 80% Don't Know 60% 74% 61% 86% No 40% 20% 0% 37% 24% 13% Total Any Children in HH No children in HH Yes Source: Ofcom 2010 Media Tracker survey. Fieldwork carried out by BDRC Continental Research. Q52 Have you ever used this blocking system? Base: All adults 16+ aware of a feature on their systems enabling them to block/hide access to certain programmes/channels (1,051) (479 - Any children in household, 572 No children in household)
The Communications Market: Digital Progress Report
 The Communications Market: Digital Progress Report Digital TV, 2009 This is Ofcom s twenty-third Digital Progress Report covering developments in multichannel television. The data are the latest available
MID d ata data 2009 PSB Report 2010
 MID data 29 PSB Report 21 PSB Report 21 PSB Report 21 7 th July 21 PSB Spend PSB overall network programme spend Total 2.7b 2.8b 3.b 3.1b 3.3b 3.3b 3.4b 3.3b 3.2b 3.1b 3.b 2.8b m 3 3, 2, 1, 1.67b 1.7b
Public Service Broadcasting Annual Report 2011
 Public Service Broadcasting Annual Report 2011 Research Document Publication date: 21st July 2011 1 Public Service Broadcasting: Annual Report 2011 Executive summary Ofcom has a duty to assess the designated
The Communications Market: Digital Progress Report
 The Communications Market: Digital Progress Report Digital TV, Q2 2007 This is the fifteenth Ofcom Digital Progress Report covering developments in digital television take-up. The data are the latest available
2 Television and audio-visual content Recent developments in Scotland
 2 Television and audio-visual content 2 2.1 Recent developments in Scottish Government In October 2011 the Scottish Government published its final progress report on the Scottish Broadcasting Commission
Digital Television Update Q4 2004
 Digital Television Update Q4 2004 This is the fifth of Ofcom s Digital Television Update quarterly reports. As far as possible, data is based upon the latest figures provided by platform operators; however,
Wales. BBC in the nations
 Wales The BBC s expenditure in Wales during /16 was 177.7 million across all services and platforms. Total expenditure represents an increase of 8.5 million on network content and 1.7 million on local
FACTSHEET 1 TV Output
 FACTSHEET 1 TV Output Oxford Media Convention March 2017 1 This factsheet has been compiled by Ofcom and provides some background to aid discussion at the 2017 Oxford Media Convention. It looks at the
2 Television and audio-visual content Recent developments in Northern Ireland
 2 Television and audio-visual content 2 2.1 Recent developments in Northern Ireland NI Assembly given more oversight of the BBC The Northern Ireland Executive is being given more oversight of the BBC.
BSAC Business Briefing. TV Consumption Trends in the Multi-Screen Era. October 2012
 BSAC Business Briefing TV Consumption Trends in the Multi-Screen Era October 2012 Traditional TV Viewing Is Holding Up Well Despite all the hype about social networking, over-the-top video services, smartphones,
3. Television and audio-visual
 3. Television and audio-visual 3. Key Market Developments Figure 3.1 TV industry metrics UK FRA GER ITA USA CAN JPN AUS ESP NED SWE IRL POL BRA RUS IND CHN TV revenue ( bn) 11.3 10.4 11.0 8.1 94.0 4.0
The Communications Market in Scotland. 2 TV and audio-visual content
 The Communications Market in 2 2 TV and audio-visual content 49 2.1 TV and audio-visual content 2.1.1 Recent developments in The Scottish Government and Scottish Broadcasting Commission In September 2009,
DIGITAL SWITCHOVER & THE BBC S ROLE
 DIGITAL SWITCHOVER & THE BBC S ROLE Dr David Levy Controller, Public Policy BBC OXFORD UNIVERSITY, JULY 2006 1 2 What s special about Digital TV? Changing standards is relatively common Gas, Currencies
FILM ON DIGITAL VIDEO
 FILM ON DIGITAL VIDEO BFI RESEARCH AND STATISTICS PUBLISHED OCTOBER 2017 Digital video enables audiences to access films through a range of devices, anytime, anywhere. Revenues for on-demand services in
FACTSHEET 4 Consumption of broadcast TV
 FACTSHEET 4 Consumption of broadcast TV Oxford Media Convention March 2017 1 This factsheet has been compiled by Ofcom and provides some background information to aid discussion at the 2017 Oxford Media
Public Service Broadcasting: Annual Report 2015 Annex Information Pack Methodologies
 Public Service Broadcasting: Annual Report 2015 Annex Information Pack Methodologies Annex Publication date: July 2015 Contents Annex Page 1 Methodologies 2 1.1 Output and spend data 2 1.2 Viewing figures
D PSB Audience Impact. PSB Report 2011 Information pack June 2012
 D PSB Audience Impact PSB Report 2011 Information pack June 2012 Contents Page Background 2 Overview of PSB television 11 Nations and regions news 25 Individual PSB channel summaries 33 Overall satisfaction
Northern Ireland: setting the scene
 Northern Ireland: setting the scene Key facts about Northern Ireland Figure Nation UK Population 1,779m (mid-2009 estimate); population is estimated to have risen by 5.6%, or 94,000 people, since 2001
49 ƒ. Communications Market Report: Scotland
 49 ƒ Communications Market Report: Research Document Publication date: 4 August Introduction This is Ofcom s sixth annual review of communications markets in, offering an overview of the take-up and use
The Communications Market in England. 2 TV and audio-visual content
 The Communications Market in 2 2 TV and audio-visual content 45 2.1 TV and audio-visual content 2.1.1 Recent developments in HD and 3D TV Towards the end of 2009, Freeview started technical transmission
PSB Annual Report 2015 PSB Audience Opinion Annex. Published July 2015
 PSB Annual Report 2015 PSB Audience Opinion Annex Published July 2015 Contents Page Background 2 Overview of PSB television 5 Overall satisfaction with PSB 19 Nations and regions news 29 Children s PSB
ThinkTV FACT PACK NEW ZEALAND JAN TO DEC 2017
 ThinkTV FACT PACK NEW ZEALAND JAN TO DEC 2017 TV Has Changed NEW ZEALAND Today s TV is a sensory experience enjoyed by over 3 million viewers every week. Powered by new technologies to make TV available
2 Television and audio-visual content 2
 2 Television and audio-visual content 2 2.1 Recent developments in BBC Cymru Programming Highlights of BBC Dylan Thomas season included a re-telling of Under Milk Wood, starring a array of Welsh acting
Ofcom s second public service broadcasting review Phase 2: preparing for the digital future - Response from Nickelodeon UK
 Ofcom s second public service broadcasting review Phase 2: preparing for the digital future - Response from Nickelodeon UK Nickelodeon UK Nickelodeon UK is the No. commercial children s TV network in the
2 Television and audio visual content
 2 Television and audio visual content 2.1 Recent developments in Wales 15 2.2 Television platform take up in Wales 18 2.3 Broadcast television content 23 2.4 TV programming for viewers in Wales 31 2.5
A quarterly review of population trends and changes in how people can watch television
 1 A quarterly review of population trends and changes in how people can watch television 217 Analysis by 2 CONTENTS 3 THE PRIMARY ROLE OF SECONDARY TV SETS Secondary TV sets are becoming increasingly important
B - PSB Audience Impact. PSB Report 2013 Information pack August 2013
 B - PSB Audience Impact PSB Report 2013 Information pack August 2013 Contents Page Background 2 Overview of PSB television 11 Nations and regions news 27 Individual PSB channel summaries 35 Overall satisfaction
AUSTRALIAN MULTI-SCREEN REPORT QUARTER
 AUSTRALIAN MULTI-SCREEN REPORT QUARTER 02 Australian viewing trends across multiple screens The edition of the Australian Multi-Screen Report provides the latest estimates of technologies present in Australian
Television, Internet and Mobile Usage in the U.S. A2/M2 Three Screen Report
 Television, Internet and Mobile Usage in the U.S. A2/M2 Three Screen Report VOLUME 5 2nd Quarter 2009 Viewership on the Rise as More Video Content Spans All Three Screens 57% of Internet Consumers Use
Communications Market Report: Scotland
 Communications Market Report: Research Document Publication date: 4 August 2016 Introduction This is Ofcom s 11th annual review of communications markets in, offering an overview of the take-up and use
AUSTRALIAN MULTI-SCREEN REPORT QUARTER
 AUSTRALIAN MULTI-SCREEN REPORT QUARTER 02 Australian viewing trends across multiple screens Since its introduction in Q4 2011, The Australian Multi- Screen Report has tracked the impact of digital technologies,
Media Nations. Annex 1: methodologies
 Media Nations Annex 1: methodologies Contents Section 1. Research survey methodologies 1 2. TV output and spend analysis 3 3. TV and AV consumption analysis 8 4. Listening analysis: RAJAR 13 1. Research
MEDIA NATIONS: UK Published 18 July 2018
 MEDIA NATIONS: UK 2018 Published 18 July 2018 About this document This is Ofcom s first annual Media Nations report. The report reviews key trends in the television and audiovisual sector as well as the
THE SVOD REPORT CHARTING THE GROWTH IN SVOD SERVICES ACROSS THE UK 1 TOTAL TV: AVERAGE DAILY MINUTES
 1 THE SVOD REPORT CHARTING THE GROWTH IN SVOD SERVICES ACROSS THE UK January 219 A lot can change in a year. In 218, England had a football team that the public actually enjoyed watching and the Beast
PSB Review 2008 Research findings
 PSB Review 2008 Research findings Contents Introduction 2 Broadcaster output data 3 PAGE Broadcaster investment data 23 Audience viewing habits 27 Audience research summary 41 The purposes of TV 44 Role
Australian. video viewing report
 Australian video viewing report QUARTER 4 2 Introduction W elcome to the Australian Video Viewing Report spanning the year through. This issue builds on the continuing story of how Australians are embracing
Communications Market Report: Northern Ireland
 Communications Market Report: Northern Ireland Research Document Publication date: 18 July Introduction Welcome to Ofcom s annual review of communications markets in Northern Ireland. This report gives
MEDIA NATIONS: Wales Published 18 July 2018
 MEDIA NATIONS: Wales 2018 Published 18 July 2018 About this document This is Ofcom s first annual Media Nations: Wales report. The report reviews key trends in the television and audio-visual sector as
australian multi-screen report QUARTER 2, 2012 trends in video viewership beyond conventional television sets
 australian multi-screen report QUARTER 2, trends in video viewership beyond conventional television sets VIDEO CONTENT ACROSS MULTIPLE SCREENS Australians watched more than 104 hours of video per month
Scotland The Communications Market Report Extended Chart Pack
 The Communications Market Report Extended Chart Pack s communications market 1. Market in Context 4 Key facts about Figure UK Population 5.373 million (mid-2015 estimate) 65.11 million (mid-2015 estimate)
Ofcom s Annual Report on the BBC: 2017/18. Annex 2: BBC Performance Report
 Ofcom s Annual Report on the BBC: 2017/18 Contents Section Overview 4 Core BBC audience metrics 8 Public purpose 1: news and current affairs 13 Public purpose 2: learning 35 Public purpose 3: creative,
Public Service Broadcasting: Annual Report 2014 Annex 8.i Information Pack Methodologies
 Public Service Broadcasting: Annual Report 2014 Annex 8.i Information Pack Methodologies Annex Publication date: December 2014 Contents Annex Page 1 Methodologies 2 1.1 PSB Tracker 2 1.2 PSB Portfolio
Connected Life Market Watch:
 Connected Life Market Watch: Transitions in U.K. Consumer Video Entertainment Cisco Internet Business Solutions Group October 2010 Internet Business Solutions Group 1 Connected Life Market Watch Program:
AUSTRALIAN MULTI-SCREEN REPORT QUARTER
 AUSTRALIAN MULTI-SCREEN REPORT QUARTER 03 Australian viewing trends across multiple screens The Australian Multi-Screen Report shows Australian homes have more screens, channel and platform choices and
BBC Television Services Review
 BBC Television Services Review Quantitative audience research assessing BBC One, BBC Two and BBC Four s delivery of the BBC s Public Purposes Prepared for: November 2010 Prepared by: Trevor Vagg and Sara
The Future of Digital Terrestrial Television Enabling new services for viewers
 Ofcom The Future of Digital Terrestrial Television Enabling new services for viewers Ofcom Consumer Workshop 19 February 2008 Ofcom 1 Objectives of DTT consumer workshop To review the proposals outlined
Public service broadcasting in the digital age. Supporting PSB for the next decade and beyond
 Public service broadcasting in the digital age Supporting PSB for the next decade and beyond Publication Date: 8 March 2018 About this document Three years on from Ofcom s third review of public service
Ofcom and Digital UK Switchover Tracker Survey. Switchover Progress Report Q1 2007
 Ofcom and Digital UK Switchover Tracker Survey Switchover Progress Report Q1 2007 Publication Date: 8th May 2007 Contents Executive Summary 2 Chapter 1 The Q1 2007 Dashboards: 6 (1) By Regions (2) By Consumer
THE SVOD REPORT: CHARTING THE GROWTH IN SVOD SERVICES ACROSS THE UK 1 DAILY CONSOLIDATED TV VIEWING 2 UNMATCHED VIEWING
 1 THE REPORT: CHARTING THE GROWTH IN SERVICES ACROSS THE UK January 218 In the UK, television is still king. We are investing in ever larger sets; more than half of all UK households have a at least 4
AUSTRALIAN MULTI-SCREEN REPORT
 AUSTRALIAN MULTISCREEN REPORT TRENDS IN VIDEO VIEWERSHIP BEYOND CONVENTIONAL TELEVISION SETS QUARTER 2 VIDEO CONTENT ACROSS MULTIPLE SCREENS The latest edition of the Australian MultiScreen Report ( )
Communications Market Report: Northern Ireland
 Communications Market Report: Northern Ireland Research Document Publication date: 19 August 2010 Introduction This is Ofcom s fifth annual review of communications markets in Northern Ireland. The report
Jersey Competition Regulatory Authority ( JCRA ) Decision M799/11 PUBLIC VERSION. Proposed Joint Venture. between. Scripps Networks Interactive Inc.
 Decision M799/11 PUBLIC VERSION. Proposed Joint Venture. between. Scripps Networks Interactive Inc.") Jersey Competition Regulatory Authority ( JCRA ) Decision M799/11 PUBLIC VERSION Proposed Joint Venture between Scripps Networks Interactive Inc. and BBC Worldwide Limited The Notified Transaction 1. On
Jersey Competition Regulatory Authority ( JCRA ) Decision M799/11 PUBLIC VERSION Proposed Joint Venture between Scripps Networks Interactive Inc. and BBC Worldwide Limited The Notified Transaction 1. On
AUSTRALIAN MULTI-SCREEN REPORT QUARTER
 AUSTRALIAN MULTISCREEN REPORT QUARTER 4 TV AND OTHER VIDEO CONTENT ACROSS MULTIPLE SCREENS The latest edition of the Australian MultiScreen Report ( ) shows robust viewing of broadcast television on inhome
SKY NETWORK TELEVISION. John Fellet CEO Jason Hollingworth - CFO 27 February 2007
 SKY NETWORK TELEVISION John Fellet CEO Jason Hollingworth - CFO 27 February 2007 Jun-06 Subscribers 700,000 600,000 500,000 400,000 300,000 200,000 100,000 0 Jun-05 Jun-04 Jun-03 Jun-02 Jun-01 Jun-00 Jun-99
UK children s media literacy: Annex. Websites visited and top 20 television programmes viewed
 UK children s media literacy: Annex Websites visited and top 20 television programmes viewed Research Document Publication date: March 2010 UK children s media literacy annex: websites visited and top
AUSTRALIAN MULTI-SCREEN REPORT QUARTER
 AUSTRALIAN MULTI-SCREEN REPORT QUARTER 04 Australian viewing trends across multiple screens Over its history, the Australian Multi-Screen Report has documented take-up of new consumer technologies and
Communications Market Report Scotland Published 3 August 2017
 Communications Market Report Scotland Published 3 August 2017 The Kelpies Communications Market Report Main Contents Introduction 1 Setting the scene 2 1 Scotland s communications market 3 2 Television
Submission to: A Future for Public Service Television: Content and Platforms in a Digital World - A Public Inquiry: Chaired by Lord Puttnam
 Submission to: A Future for Public Service Television: Content and Platforms in a Digital World - A Public Inquiry: Chaired by Lord Puttnam The contribution of the UK s commercial public service broadcasters
Architecting the new TV. Daniel Knapp, Director Advertising Research
 Architecting the new TV Daniel Knapp, Director Advertising Research Media trends have always sparked speculations and visions sometimes remarkably accurate How we will live in the year 2000 (German artist
Communications Market Report United Kingdom Published 3 August 2017
 Communications Market Report United Kingdom Published 3 August 2017 Angel of the North About this document The report contains statistics and analysis of the UK communications sector. It is a reference
ThinkTV FACT PACK NEW ZEALAND JAN TO DEC 2017
 ThinkTV FACT PACK NEW ZEALAND JAN TO DEC 2017 TV Has Changed NEW ZEALAND Today s TV is a sensory experience enjoyed by over 3 million viewers every week. Powered by new technologies to make TV available
BROADCAST. The following concepts help ensure the way we distribute revenue to members is equitable.
 BROADCAST Key concepts The following concepts help ensure the way we distribute revenue to members is equitable. Commercial licensee blanket revenues that cover more than one radio or TV station are divided
Television access services report 2015
 Television access services report 2015 Statement Publication date: 7 April 2016 About this document Under the Communications Act 2003, certain television broadcasters licensed by Ofcom are required to
BARB Establishment Survey Annual Data Report: Volume 1 Total Network and Appendices
 BARB Establishment Survey Annual Data Report: Volume 1 Total Network and Appendices Apr 2017 to Mar 2018 BARB ESTABLISHMENT SURVEY OF TV HOMES Page 1 DATA PERIOD: ANNUAL Apr 2017 - Mar 2018 Contents Page
6 th Annual TMT Conference. Barcelona, 15 th -17 th November 2006
 6 th Annual TMT Conference Barcelona, 15 th -17 th November 2006 1 Mediaset Group Structure Italian Business International Spanish Business Gestevision Tele5 Tele5 (52%) (50.1%) Advertising Sales Force
MEDIA NATIONS: Scotland Published 18 July 2018
 MEDIA NATIONS: Scotland 2018 Published 18 July 2018 About this document This is Ofcom s first annual Media Nations: Scotland report. The report reviews key trends in the television and audio-visual sector
The Communications Market 2006
 The Communications Market 2006 Publication date: 10 August 2006 Key points: The communications market Total retail revenue in the UK communications sector reached 50bn in 2005, a 5% increase compared to
TMT Conference. London, 7 th June 2006
 TMT Conference London, 7 th June 2006 Mediaset 2003-2006, Consistency with our Strategy Focus on the Core Business Profitability Assessing All the Growth Opportunities November 2002 TECHNOLOGICAL DEVELOPMENT
The International Communications Market TV and audio-visual
 The International Communications Market 017 TV and audio-visual 84 Contents.1 TV and audio-visual: overview and key market developments 86.1.1 The UK in context 87.1. Key market development: Live TV is
Response to Ofcom Consultation The future use of the 700MHz band. Response from Freesat. 29 August 2014
 Response to Ofcom Consultation The future use of the 700MHz band Response from Freesat 29 August 2014 1 1 About Freesat Freesat is a subscription free satellite and IP TV service offering digital television
MEDIA NATIONS: Northern Ireland Published 18 July 2018
 MEDIA NATIONS: Northern Ireland 2018 Published 18 July 2018 About this document This is Ofcom s first annual Media Nations: Northern Ireland report. The report reviews key trends in the television and
BARB Establishment Survey Quarterly Data Report: Total Network
 BARB Establishment Survey Quarterly Data Report: Total Network Jan 2018 to Mar 2018 BARB ESTABLISHMENT SURVEY OF TV HOMES DATA PERIOD: QUARTERLY Jan - Mar 2018 Page 1 Contents Page Total Network (All Areas)
The BBC s services: audiences in Scotland
 The BBC s services: audiences in Scotland Publication date: 29 March 2017 The BBC s services: audiences in Scotland About this document The operating licence for the BBC s UK public services will set the
Appendix 3. TV Viewing Data
 Appendix 3 TV Viewing Data hat is the range of influences on children s food choices? ole of TV How much TV is viewed? Children (aged 4-15) watch an average of 17 hours of TV a week 12 hours (71%) is spent
In accordance with the Trust s Syndication Policy for BBC on-demand content. 2
 BBC One This service licence describes the most important characteristics of BBC One, including how it contributes to the BBC s public purposes. Service Licences are the core of the BBC s governance system.
North West Media Briefing
 Digital Television Switchover North West Media Briefing Gemma McNeilis Smith & Smith PR 0161 236 5560 / 07962 532 098 gemma@smithandsmithpr.co.uk October 2009 What is digital TV switchover? Switchover
Communications Market Report
 Communications Market Report Wales Millennium Centre Wales Published 3 August 2017 Communications Market Report Main Contents Introduction 1 Setting the scene 2 1 Wales communications market 4 2 Television
Communications Market Report: England
 Communications Market Report: Research Document Publication date: 19 August 2010 Introduction This is Ofcom s fifth annual review of communications markets in. The report offers a detailed overview of
Department for Culture, Media and Sport. The balance of payments between television platforms and public service broadcasters
 Response to consultation: Department for Culture, Media and Sport The balance of payments between television platforms and public service broadcasters 26 June 2015 1 [BLANK] 2 1. Introduction About Digital
Television channels required to provide television access services in 2019
 Television channels required to provide television access services in 2019 Statement: Publication Date: 4 July 2018 About this document This document explains which TV channels licensed by Ofcom are required
AUSTRALIAN MULTI-SCREEN REPORT QUARTER
 AUSTRALIAN MULTI-SCREEN REPORT QUARTER 0 AUSTRALIAN VIEWING TRENDS ACROSS MULTIPLE SCREENS The 0 edition of the Australian Multi- Screen Report updates household take-up of new technologies and the trends
Future of TV. Features and Benefits
 Future of TV This report assesses the future of TV in all its forms, encompassing content, technology, consumer appliances and devices, mobile devices, evolving media and broadcast business models, the
Operating licence for the BBC s UK Public Services
 Operating licence for the BBC s UK Public Services Issued on: 13 October 2017 About this document This is the operating licence for the BBC s UK Public Services. It sets the regulatory conditions that
Communications Market Report
 Communications Market Report The Angel of the North Bitesize Published August 207 Introduction ofcom.org.uk The communications market report The communications market plays a crucial role in the lives
Appendices 4 and 5: Methodology and Historical Analysis
 Appendices 4 and 5: Methodology and Historical Analysis Appendix 4 Methodology 14 APPENDIX 4 METHODOLOGY 1. Introduction The following appendix outlines the key elements of the methodology that used to
HOW AUSTRALIANS WATCH TV
 HOW AUSTRALIANS WATCH TV WATCHING TV ON ANY DEVICE IS OUR PREFERRED ENTERTAINMENT ACTIVITY Source: Deloitte Media Consumer Survey 2016. TECHNOLOGY MAKES TV AVAILABLE EVERYWHERE AND AT ANY TIME Australians
Context The broadcast landscape
 Cynulliad Cenedlaethol Cymru / National Assembly for Wales Pwyllgor Diwylliant, y Gymraeg a Chyfathrebu / The Culture, Welsh Language and Communications Committee Dyfodol S4C / The Future of S4C CWLC(5)
BBC Trust Changes to HD channels Assessment of significance
 BBC Trust Changes to HD channels Assessment of significance May 2012 Getting the best out of the BBC for licence fee payers Contents BBC Trust / Assessment of significance The Trust s decision 1 Background
Joint submission by BBC, ITV, Channel 4, Channel 5, S4C, Arqiva 1 and SDN to Culture Media and Sport Committee inquiry into Spectrum
 Joint submission by BBC, ITV, Channel 4, Channel 5, S4C, Arqiva 1 and SDN to Culture Media and Sport Committee inquiry into Spectrum 1. Introduction and summary The above-named organisations welcome the
Viewers and Voters: Attitudes to television coverage of the 2005 General Election
 Viewers and Voters: Attitudes to television coverage of the 2005 General Election Research Study conducted by ICM Research on behalf of Ofcom Please note that figures for Five and Sky News in Table 2 (Perceptions
Television Audience 2010 & 2011
 Television Audience 2010 & 2011 Overview The 51 st edition of Television Audience continues your collection of TV Audience reports. This report continues to include annual trends of population and television
Digital UK and Ofcom Switchover Tracker Survey. Switchover Progress Report Q3 2008
 Digital UK and Ofcom Switchover Tracker Survey Switchover Progress Report Q3 2008 Publication Date: 9 December 2008 Contents Executive Summary 2 Chapter 1 The Q3 2008 Dashboards: 5 (1) By Regions (2) By
Morgan Stanley October / November 2013
 Morgan Stanley October / November 2013 Agenda BROADCAST 2 Broadcast Update 1 INTRODUCTION Strategic Update Financial Update Strategic & Financial Update DIGITAL Digital Update 3 CONTENT 4 FremantleMedia
Communications Market Report: Northern Ireland
 Communications Market Report: Northern Ireland Research Document Publication date: 1 August 2013 Introduction Welcome to Ofcom s annual Communications Market Report for Northern Ireland. The report gives
UKTV response to Ofcom consultation: Notice of proposed change to L-DTPS licence obligations of ESTV Limited (the local TV Licensee for London)
") UKTV response to Ofcom consultation: Notice of proposed change to L-DTPS licence obligations of ESTV Limited (the local TV Licensee for London) Responses close: 26 August 2014, 10am About UKTV UKTV is
UKTV response to Ofcom consultation: Notice of proposed change to L-DTPS licence obligations of ESTV Limited (the local TV Licensee for London) Responses close: 26 August 2014, 10am About UKTV UKTV is
Broadcasting Authority of Ireland
 Broadcasting Authority of Ireland A report on market structure, dynamics and developments in Irish media Supplied in support of the BAI s consultation on its Broadcasting Services Strategy December 2017
THE CROSSPLATFORM REPORT
 STTE OF THE MEDI THE CROSSPLTFORM REPORT QURTER, 0 UNDERSTNDING THE VIDEO CONSUMER The average merican today has more ways to watch video whenever, however and wherever they choose. While certain segments
PSB nations and regions compliance reporting, 2015
 PSB nations and regions compliance reporting, 2015 2 Introduction (I) TV broadcasters must comply with a range of programme and output quotas that set minimum levels of types of programmes that they must
BBC Trust Review of the BBC s Speech Radio Services
 BBC Trust Review of the BBC s Speech Radio Services Research Report February 2015 March 2015 A report by ICM on behalf of the BBC Trust Creston House, 10 Great Pulteney Street, London W1F 9NB enquiries@icmunlimited.com
October Digital Terrestrial TV
 M e d i a s e t G r o u p October 2004 Terrestrial TV Number of DTT multiplexes (every multiplex can host 4-6 channels) 2 3 3 4 5 6 1 mux 2 mux 1 mux Norway Finland Spain Germany Italy United Kingdom 1