Blueline, Linefree, Accuracy Ratio, & Moving Absolute Mean Ratio Charts
|
|
|
- Marjorie Chapman
- 6 years ago
- Views:
Transcription
1
2 INTRODUCTION This instruction manual describes for users of the Excel Standard Celeration Template(s) the features of each page or worksheet in the template, allowing the user to set up and generate charts that conform reasonably closely to those created by Ogden Lindsley. The following sections describe the various functions built into the template workbook: Set-Up page Progress Record page Notes & Phase Lines page AIMStars pages Blueline, Linefree, Accuracy Ratio, & Moving Absolute Mean Ratio Charts Summary Statistics page Celeration Lines page Supporting Worksheet page Versions page 2

3 SET-UP PAGE The Set-Up page contains all the fields (record information) needed to identify the learner, the various movements targeted for change, staff members supporting the change effort, the appropriate affiliations, and persons responsible for gathering critical counts. Record information pertinent to each field may be enter into the cells in Column C just to the right of the field name. For example, to enter the Performer s name, move the mouse to cell C2 (column C, row 2) and type the learner s name. Proceed down Column C, entering the appropriate information. 3

4 Chart Synchronization Date The example to the right illustrates a completed set of learner information. On Row 15, Column C, the date 09/02/07 is recorded. This date is the Chart Synchronization Date and corresponds to the first Sunday of the week in which school starts. This date is 9/2/2007 here in Minnesota for the academic year. Zero-count Multiple The zero-count multiple is a fractional multiplier that determines where to place frequency count marks when the performer had zero corrects or zero errors. The zero-count multiplier places the appropriate frequency symbol below the Record Floor on the Chart at a distance equal to the zero-count multiplier times the record floor. For example, if the zero-count multiplier is 0.8 and the record floor is 1- minute, then zero counts are plotted at 0.8 * 1.0 = 0.8 counts per minute using the vertical axis scale. 4

5 Skip Weekends (YES/NO) The user has the option to skip weekend dates when entering data using the Data Entry dialog box (see the Progress Record section). This is helpful for those persons who work in the public schools or other settings where weekend data are usually not gathered. By typing YES in this box, the program will automatically advance to the next Monday, jumping over the weekend dates. Housekeeping Buttons Use the Clear Set-up Fields button to erase all record information through Row 14. This action is not reversible using UNDO so a dialogue box will provide a warning before acting on the erase command. The Update Operating System Version determines the current operating system and version and sets various program parameters used by Windows and Mac operating systems. Do this only once on opening the template. Save the changes immediately. Note: If you are using Microsoft Office 2007, having a version number greater than 11.3, this program may not work. Microsoft dropped Macintosh support for the Excel 4 Macro language used in the coding of routines for these templates, and dropped support for Visual Basic for Macintosh as well. 5
 in the workbook, and click the right-bracket arrow to")

6 Navigation Panel A shows the navigational arrows (2 left; 2 right) that expose the tabs at the bottom of the workbook. Click the left-bracket arrow to expose the first tab (worksheet) in the workbook, and click the right-bracket arrow to expose the rightmost tab of the workbook. The central left and right arrows move the tabs in either direction one tab at a time. Panels B through D show the various worksheets contained in the template s workbook. Panel A Panel B Panel C Panel D 6

7 PROGRESS RECORD PAGE Use the Progress Record page to record the daily learner performance counts. This section of the workbook allows the user to enter data in only five columns; the remaining cells are locked. Protected cells prevent inadvertent data entry as most regions on this page contain formula whose functions are dependent on preserving critical relationships. Synchronization Date The synchronization date comes from the Set-up page to cell C4 by way of a formula. It determines every other date needed to set up the database and charts. To change the dates listed on the Progress Record page, change the synchronization date on the Set-Up page. 7

8 Data Entry The user may enter performance data into the record fields manually. The Record Floor field records counting times the amount of time during which pinpointed movements are counted. Record Floor entries are formatted using the h:mm:ss. For example, a counting time of 2 hours, 33 minutes, 45 seconds is entered in the Record Floor field as 2:33:45. Formulae convert the record floor entry into an appropriate decimal time fraction as shown in the table below. Conversion of Record Floor Time Entries To Decimal Time Fractions Short Form (Long Form) RecFloor Result 0:1 (0:01:00) :2 (0:02:00) :0:10 (0:00:10) The Accel Count column record the frequency of Correct movements; the Decel Count field records the frequency of Misses - movements targeted for reduction. The Total Poss # field records frequency limits imposed on the learner s performance either due to the physical arrangement of the task or limits on the number of opportunities to respond freely. Finally, the Comments column (not shown in the graphic but located to the right of the DcRate column) may be used to record any pertinent notes about the learner s performance for a particular day. 8
 red buttons on the left are used to clear data from individual pages (i.e., Phase Change Lines, Celeration Lines, & Raw Data).")

9 Control Buttons on the Progress Record Page. The two panels below show the various control buttons needs to invoke the various functions built into this template. The three (3) red buttons on the left are used to clear data from individual pages (i.e., Phase Change Lines, Celeration Lines, & Raw Data). The two yellow buttons invoke the Data Entry and Celeration Finder dialog boxes. The blue button finds the last data entry record, the purple button updates the moving absolute mean ratio chart, the last two red buttons clear the summary tables and aimstars, and the green button clears the entire workbook. Each button used to clear a page in the template workbook gives a warning to the user, allowing the options to halt the process rather than proceed. 9

10 Stu s Pretty Good Data Entry Screen The panel to the right shows a data entry screen used to facilitate rapid entry of record floors, frequency counts, and comments. Access the screen by clicking the yellow button at the top of the workbook, labeled, DATA ENTRY SCREEN. Use the Next Avail Date edit box to enter the starting date or let the program find the next available date for you. If Skip Weekends is set to Yes, the next available date will jump over a weekend and enter the next available Monday from the previous Friday. Note: when entering dates, use the format, m/d/yyyy. For example, enter September 5, 2007 as 9/4/2007. Should the user wish to skip consecutive dates, each click on the Get Next Date button will advance one day at a time. Otherwise, the user may enter any date between the Synchronization Date and End Date 140 days later. Once the Date, Record Floor, Correct and Error counts, and Comments are entered, click Save Scores/Next Date will save the data and advance to the next available date. If the user wishes to end data entry after entering new data, click Save and Exit; otherwise, click Exit Don t Save. 10


11 When entering Record Floors, enter an integer for hours, minutes and seconds. For example, Record Floor in the right hand panel shows a counting time of 20-seconds. After each new entry is saved using Save Scores/Next Date the Record Floor from the previous entry is brought forward to minimize the amount of data entry. In this way, the user need only change the Record Floor should the have been a change. The Celeration Finder Dialog Box The Celeration Finder dialog box is shown in the panel to the right. Each element of the dialog box is described below. Celeration Dates 1. Start Date: defines the first date in a series of consecutive dates over which the celeration line is drawn. 2. End Date: defines the last date in the series of consecutive dates over which the 11
12 celeration line is drawn. 3. Project To: defines the date out to which the celeration line is drawn. This line is shown as a dashed line extension of the solid blue celeration line. Apply Celeration Lines To 1. Acceleration Movement: when checked, causes a celeration line to be drawn through the selected acceleration movement data. 2. Deceleration Movement: when checked, causes a celeration line to be drawn through the selected deceleration movement data. 3. Accuracy Ratio Series: when checked, causes a celeration line to be drawn through the selected accuracy ratio data points. Chose Celeration Method 1. Median Slope (O. White, 2005): follows the rational and methods provided by Owen White, Ph.D., to draw a celeration line through the medians of frequencies and days using a routine called double back method. This method is conservative and robust, and is the recommended choice for determining celeration. The Summary Statistics Table page records the method used to calculate the celeration line. 2. Linear Regression Method: this method is a traditional method for generating a regression line using the least squares linear regression method (see Hays, W. L. (1973) Statistics for the Social Sciences). 12
13 Add Labels to Celeration Lines 1. When checked, this option imposes text on each chart describing the celeration value, bounce value, and absolute mean ratio for the line segment designated by the user. Add Bounce Lines to Chart 1. When checked, this option causes upper and lower bounce lines (the equivalent of confidence interval bands) to be imposed one either side of the celeration line. If checked, the user must specify the width of the bounce interval by selecting one of the radio buttons in the area below the check box. The options define bounce intervals in a manner similar to that used to calculate the interquartile range. The options range from a. 50% Bounce (25 th to 75 th %ile) b. 75% Bounce (12.5 to 87.5 %ile) c. 80% Bounce (10 th to 90 th %ile) d. 90% Bounce (5 th to 95 th %ile) e. 95% Bounce (2.5 to 97.5 %ile) f. Minimum / Maximum Bounce (Full Range) 2. The program calculates Total Bounce as the product of the Down Bounce and the Up Bounce. Og Lindsley referred to Total Bounce as the Bounce Unit and compared frequencies outside of the upper and lower bounce limits by the number of bounce units away from the upper or lower bounce limit. These distances give the probability that a particular data point might fall at that distance from the upper or lower bounce limit by 13


14 chance. This method is an alternative to Statistical Quality Control methods that use traditional statistical methods. Work Areas on the Progress Record Page The area to the right of the record and comment fields labeled, Celeration and Bounce Analysis Area is the area into which data get transferred prior to calculation of the celeration line (see panel to the right). Only the last line calculated is shown in this area, but the user can see the original values used, the log transformations, predicted values, and bounce values for each data point relative to the celeration line. The author locked this area to prevent accidental erasure of formula. Statistics Area The area beginning with column AF, row 4 contains the various statistical values used to establish the slope and intercept of the least squares linear regression line. This table is the standard tabled values for regression and residual sum of squares, coefficient of determination, F- statistics and degrees of freedom. The Absolute Mean Ratio is shown in the purple box to the right of the table. Below the regression statistics is a table show all start and stop dates for the celeration line, associated line values, and text labels needed to identify the line. 14


15 NOTES & PHASE CHANGE LINES PAGE The Notes & Phase Change Lines page records the date on which an important change in the learner s program took place. The critical parts of the phase line placement are: 1. Change Date: this is the date on which an intervention change or other important event happened. 2. Line From (Low): enter a value corresponding to some value along the Y-axis to designate where to begin drawing the phase change line. For convenience, set this value to that of the Record Floor on that date. 3. Line To (High): enter a value corresponding to some value along the Y-axis to designate where to stop drawing the phase change line. Choose a value high enough on the Y-axis to keep the line out of the way of the data. 4. Description: enter a short 1-3 word description of the change. This text will be attached to the top of the phase change line. The panel to the right illustrates various lines to be placed on the charts. 15

16 This panel corresponds to the tables values shown above and illustrates how the values from the table are translated into the drawing of phase change lines with text descriptors attached to each. Notice how the start and stop values move the phase change lines out of the way of the performer s data, yet keep each line anchored to the appropriate Record Floor. Erasing or Clearing the Phase Lines Table The user may erase all phase change lines by clicking the Clear All Phase Lines button. On doing so, a warning dialog box (see below) appears to give the user an opportunity to not proceed. Click OK if you wish to continue with the erasure. If the user wishes to erase a single line, click and drag from the date to description cell, then go to Edit>Clear>Contents. 16

 show the table used to set AimStars and may be accessed by clicking")


17 AIMSTAR: Setting Performance Targets AimStars set learner performance aims or targets on the Chart using up and down pointing solid colored triangles. In other words, the triangle points in the direction of the desired frequency change. The first of the three panels on the left (below) show the table used to set AimStars and may be accessed by clicking the AimStar tab at the bottom of the workbook. The middle panel shows how to set an acceleration aim by entering a date and a frequency. Enter the frequency in the Aim Star Freq Accel column on the same row as the date. The date does not have to represent a target acquisition date as it can specify any point on the SCC that makes it easy for the Chart reader to visualize the performance aim and assess how the learner is progressing. Enter deceleration aims in the same way, with a date, a frequency target, and a zero-count Record Floor should the user specify a zero-count aim. 17

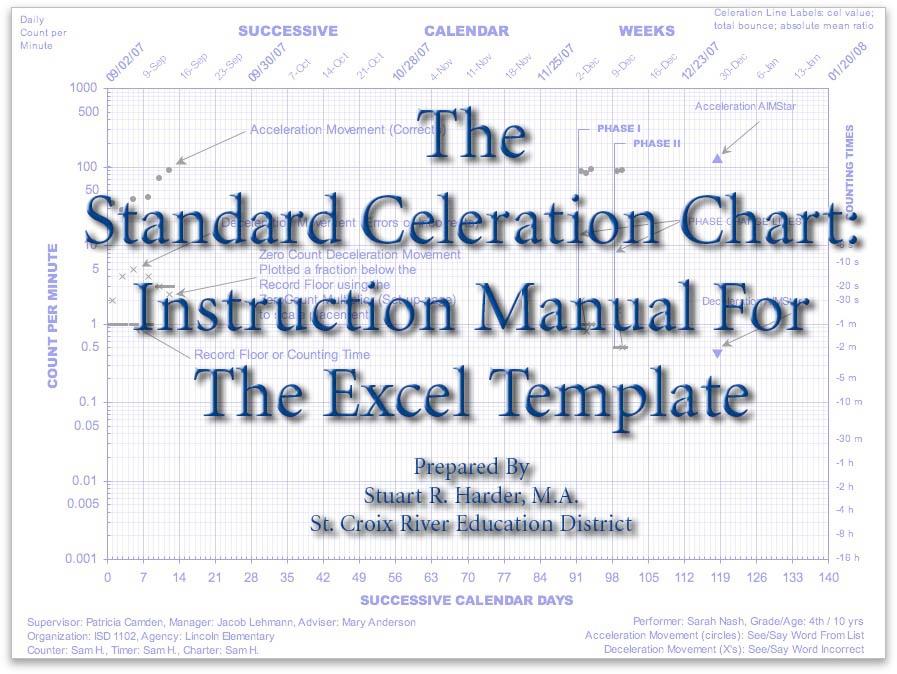
18 THE STANDARD CELERATION CHART(S) 18
19 Charting Practices 1. Circles: used to mark the acceleration movement (correct targets). 2. X s: used to mark the deceleration movement (incorrect or error targets). 3. Dashes: used to mark the Record Floor. 4. Up & Down Pointing Triangles: used to mark performance aims (called AimStars). 5. Vertical lines with text: used to mark changes in instructional conditions. Celeration Lines The panel to the right illustrates the presentation of celeration lines imposed on a selection of frequencies, acceleration and deceleration movements. The lines are limited in extent to the start and end dates set by the in the Celeration Finder dialog box found on the Progress Record page. both user 19


20 Celeration Lines with Projections The panel to the right present celeration lines (solid lines) along with lines that project the celeration lines into the future a number of days specified by the user. Generally, it is not recommended to forecast more than 10 to 14 days, because our general interest is in making near term forecasts that inform our decisions about the need to maintain or change instruction. Celeration Lines with Projection and Bounce Lines The panel to the bottom right shows data sets with imposed celeration lines, a forecast line, and upper and lower bounce lines. Please refer to the Progress Record page where the Celeration Finder dialog box for a description of the options. 20
: this value describes the rate of growth in the selected frequencies. When the X symbol precedes the celeration value, it indicates position growth.")
21 Celeration Lines with Projection, Bounce, Text Labels The right hand panel adds text to label the celeration line and its component elements. Added text includes: 1. Celeration value (cel): this value describes the rate of growth in the selected frequencies. When the X symbol precedes the celeration value, it indicates position growth. When a division sign precedes the celeration value, it indicates deceleration in the frequencies. 2. Total bounce (bnc): Total bounce refers to the distance from the lower bounce line (called down bounce) to the upper bounce line (called up bounce). 3. Absolute Mean Ratio (amr): the absolute mean ratio is a measure of bounce based on average of the absolute log distances between all pairs of observations. An individual AMR value is not easy to interpret but gives meaningful information about the relative changes in bounce (variation) from one condition to the next. These relative changes are calculated and displayed on the Summary Statistics Table page. 21


22 Moving Text Labels on the Chart Text labels can be moved out of the way of the learner s performance data following the five steps below, going from upper left to lower right. The upper right panel shows a boarder invoked by one click only. To move the text, click and drag on the boarder of the text box to its final location (lower right panel). 22

23 Sample Charts: The Blueline Chart. This Chart is a close approximation to the original blue line SCC but is missing the 7 th partial cycle at the bottom from to.001 which extends the Chart to 24-hours. 23
24 Sample Charts: The Linefree Chart. This is the same chart as the blue line chart without gridlines. 24
25 ACCURACY RATIO CHART The Accuracy Ratio Chart show the ratio of Correct movements to Error movements and these translate into percent correct using the percentage scale on the right hand side of the Chart. Accuracy ratio values greater than 1.0 show corrects greater than errors; error rates higher than correct rates have accuracy ratios less than 1.0. One expects to observe rising accuracy ratios as corrects grow while errors fall and stabilize near the Record Floor. When the frequency of a movement is recorded as zero (0), the accuracy ratio formulae convert the zero count to one (1), placing the point on the Record Floor. An Accuracy Ratio of 10:1 is the equivalent of 90.9% Correct while an Accuracy Ratio of 50:1 is equivalent to 98% Correct. The percentage scale is designed without a 100% ceiling though beyond 99%, further percentage correct gains are negligible even as frequency gains continue to be realized. 25

26 MOVING ABSOLUTE MEAN RATIO CHART AND PAGE The Moving AMR tab opens a worksheet used to store the results of calculations for the Absolute Mean Ratio. The design of the Moving AMR chart is similar to a moving average or moving median in which a fixed number of data points are averaged and plotted, a pointer is moved ahead one step and a new set of points same number of points are averaged in the same way. This is what happens with the mamr Chart. The user specifies the number of terms (days) to include in the calculation of the absolute mean ratio and the program uses that number in calculating repeated AMRs for as many sets of data points as it can. The number of terms in the moving window is entered in the yellow box in column E, row 2. Generally, windows in the range of 3 to 5 work bests, as larger windows, while smoothing the data quite nicely, cause the loss of data at the beginning of the series. To clear the mamr Chart of its data, click the red CLEAR AMR DATA button on the Moving AMR page. 26

27 Sample Charts: The Moving Absolute Mean Ratio Chart 27

28 SUMMARY STATISTICAL TABLES Whenever the user generates a celeration either for the acceleration or deceleration movement cycle, a range of statistical data are transferred to the Summary Tables page. The following is a brief description of the elements in the table. They are intended to provide researchers with a number of tools needed to evaluate various statistical propositions and may not be of use in daily practice. The left hand columns are reserved for corrects; the right hand columns are reserved for errors. 1. Start, End, Proj To Dates: these are dates defining the end points of the celeration line in question. 2. N: Indicates the actual number of data points (frequencies) included in the calculation of the celeration line. This may not be the same as the number of days over which the celeration line was calculated as there may have been no opportunity days in the mix. N represents actual data days. 3. Begin Pt, End Pt, and Proj Pt: these are the values that define the beginning and end frequencies used to generate the celeration line as well as the value to which the celeration line was projected. 4. Cel Val: This is the slope or celeration value of the celeration line. X means the line is rising; divide sign means the line is falling. 28
29 5. Fisher s Exact: this is a nonparametric test of the hypothesis that the celeration line has a slope of x1.0 (meaning the celeration is flat or horizontal). 6. Method: this describe how the celeration line was generated, using either the median slope or linear regression methods. 7. R^2: this is the coefficient of determination and indicates what percentage of the bounce or variation in the daily frequencies can be account for by celeration line. 8. p[f,v1,v2]: this column gives the F-statistic and degrees of freedom used in the test of the hypothesis that the celeration line is horizontal or flat. This test is similar to that described for Fisher s Exact, but approaches question with different mathematics. 9. AMR: this is the absolute mean ratio described earlier. 10. Up Bounce: this value indicates how far above the celeration line the data points bounce up to the limit of the confidence interval. The user sets these limits in the Celeration Finder dialog box. 11. Down Bounce: this value indicates how far below the celeration line the data points bounce down to the limit of the confidence interval. The user sets these limits in the Celeration Finder dialog box. 12. Total Bounce: this value represents the total distance or total variation of data points on either side of the celeration line. 13. Conf Interval: This is the value chosen by the user when setting up calculations for the celeration line. This was set in the Celeration Finder dialog box. 29
30 14. Relative AMR Change: this value indicates what percentage change was observed in the AMR values from the previous condition to the present condition. 15. Relative AMR Variation: this value compares the AMR values for corrects and errors over the same time period. CELERATION LINES. The Celeration Lines page records all information needed to draw celeration and bounce lines on the chart. There are two buttons at the top right of this page used to clear celeration lines from the chart. The Clear All Lines button does exactly that it removes all celeration lines from the charts. The Clear Selected Line button is used to remove individual celeration lines. To use this feature, the user must know the exact date on which the celeration line began. This page contains tables for Correct and Error celeration lines. Each line is defined by a Start and End Date along with a Day Number (relative to the beginning of the Chart) used to identify the correct celeration line. Any confusion regarding which line to select for removal may be resolved by switching to either the Blueline or Linefree charts. There, visually identify the line to be erased. Move the cursor over the solid body of the celeration line to the left end point of the line. Do this slowly and do not click the mouse button. At the end point of the line, a text box will appear giving an identifier for the line (this may be cryptic) and two numbers in parenthesis. The first number gives the Day on which this celeration line begins; the second number records the frequency relative to the y-axis (vertical) axis. Use Day # to locate the corresponding line on the Celeration lines page found in Column D. Click the cell containing this number and then click the Clear Selected Line button to erase the celeration line. 30
E X P E R I M E N T 1
 E X P E R I M E N T 1 Getting to Know Data Studio Produced by the Physics Staff at Collin College Copyright Collin College Physics Department. All Rights Reserved. University Physics, Exp 1: Getting to
Import and quantification of a micro titer plate image
 BioNumerics Tutorial: Import and quantification of a micro titer plate image 1 Aims BioNumerics can import character type data from TIFF images. This happens by quantification of the color intensity and/or
PS User Guide Series Seismic-Data Display
 PS User Guide Series 2015 Seismic-Data Display Prepared By Choon B. Park, Ph.D. January 2015 Table of Contents Page 1. File 2 2. Data 2 2.1 Resample 3 3. Edit 4 3.1 Export Data 4 3.2 Cut/Append Records
Algebra I Module 2 Lessons 1 19
 Eureka Math 2015 2016 Algebra I Module 2 Lessons 1 19 Eureka Math, Published by the non-profit Great Minds. Copyright 2015 Great Minds. No part of this work may be reproduced, distributed, modified, sold,
SIDRA INTERSECTION 8.0 UPDATE HISTORY
 Akcelik & Associates Pty Ltd PO Box 1075G, Greythorn, Vic 3104 AUSTRALIA ABN 79 088 889 687 For all technical support, sales support and general enquiries: support.sidrasolutions.com SIDRA INTERSECTION
Task-based Activity Cover Sheet
 Task-based Activity Cover Sheet Task Title: Carpenter Using Construction Design Software Learner Name: Date Started: Date Completed: Successful Completion: Yes No Goal Path: Employment Apprenticeship Secondary
PHY221 Lab 1 Discovering Motion: Introduction to Logger Pro and the Motion Detector; Motion with Constant Velocity
 PHY221 Lab 1 Discovering Motion: Introduction to Logger Pro and the Motion Detector; Motion with Constant Velocity Print Your Name Print Your Partners' Names Instructions August 31, 2016 Before lab, read
User s Manual. Log Scale (/LG) GX10/GX20/GP10/GP20/GM10 IM 04L51B01-06EN. 2nd Edition
 GX10/GX20/GP10/GP20/GM10 IM 04L51B01-06EN. 2nd Edition") User s Manual Model GX10/GX20/GP10/GP20/GM10 Log Scale (/LG) User s Manual 2nd Edition Introduction Notes Trademarks Thank you for purchasing the SMARTDAC+ Series GX10/GX20/GP10/GP20/GM10 (hereafter referred
User s Manual Model GX10/GX20/GP10/GP20/GM10 Log Scale (/LG) User s Manual 2nd Edition Introduction Notes Trademarks Thank you for purchasing the SMARTDAC+ Series GX10/GX20/GP10/GP20/GM10 (hereafter referred
Cisco Spectrum Expert Software Overview
 CHAPTER 5 If your computer has an 802.11 interface, it should be enabled in order to detect Wi-Fi devices. If you are connected to an AP or ad-hoc network through the 802.11 interface, you will occasionally
SEM- EDS Instruction Manual
 SEM- EDS Instruction Manual Double-click on the Spirit icon ( ) on the desktop to start the software program. I. X-ray Functions Access the basic X-ray acquisition, display and analysis functions through
Frequencies. Chapter 2. Descriptive statistics and charts
 An analyst usually does not concentrate on each individual data values but would like to have a whole picture of how the variables distributed. In this chapter, we will introduce some tools to tabulate
EDL8 Race Dash Manual Engine Management Systems
 Engine Management Systems EDL8 Race Dash Manual Engine Management Systems Page 1 EDL8 Race Dash Page 2 EMS Computers Pty Ltd Unit 9 / 171 Power St Glendenning NSW, 2761 Australia Phone.: +612 9675 1414
Linkage 3.6. User s Guide
 Linkage 3.6 User s Guide David Rector Friday, December 01, 2017 Table of Contents Table of Contents... 2 Release Notes (Recently New and Changed Stuff)... 3 Installation... 3 Running the Linkage Program...
User s Manual. Log Scale (/LG) GX10/GX20/GP10/GP20/GM10 IM 04L51B01-06EN. 3rd Edition
 GX10/GX20/GP10/GP20/GM10 IM 04L51B01-06EN. 3rd Edition") User s Manual Model GX10/GX20/GP10/GP20/GM10 Log Scale (/LG) 3rd Edition Introduction Thank you for purchasing the SMARTDAC+ Series GX10/GX20/GP10/GP20/GM10 (hereafter referred to as the recorder, GX,
User s Manual Model GX10/GX20/GP10/GP20/GM10 Log Scale (/LG) 3rd Edition Introduction Thank you for purchasing the SMARTDAC+ Series GX10/GX20/GP10/GP20/GM10 (hereafter referred to as the recorder, GX,
Source/Receiver (SR) Setup
 Setup") PS User Guide Series 2015 Source/Receiver (SR) Setup For 1-D and 2-D Vs Profiling Prepared By Choon B. Park, Ph.D. January 2015 Table of Contents Page 1. Overview 2 2. Source/Receiver (SR) Setup Main Menu
PS User Guide Series 2015 Source/Receiver (SR) Setup For 1-D and 2-D Vs Profiling Prepared By Choon B. Park, Ph.D. January 2015 Table of Contents Page 1. Overview 2 2. Source/Receiver (SR) Setup Main Menu
With Export all setting information (preferences, user setttings) can be exported into a text file.
 can be exported into a text file.") Release Notes 1 Release Notes What s new in release 1.6 Version 1.6 contains many new functions that make it easier to work with the program and more powerful for users. 1. Preferences Export Menu: Info
Release Notes 1 Release Notes What s new in release 1.6 Version 1.6 contains many new functions that make it easier to work with the program and more powerful for users. 1. Preferences Export Menu: Info
Project Reliability-based Control
 Project 2007-18 - Reliability-based Control EXCEL WORKBOOK INFORMATION February 03, 2010 The Excel workbooks use a calculation of the Balancing Authority ACE Limit as defined in the draft Standard BAL-007.
TL-2900 AMMONIA & NITRATE ANALYZER DUAL CHANNEL
 TL-2900 AMMONIA & NITRATE ANALYZER DUAL CHANNEL DATA ACQUISITION SYSTEM V.15.4 INSTRUCTION MANUAL Timberline Instruments, LLC 1880 S. Flatiron Ct., Unit I Boulder, Colorado 80301 Ph: (303) 440-8779 Fx:
Using DICTION. Some Basics. Importing Files. Analyzing Texts
 Some Basics 1. DICTION organizes its work units by Projects. Each Project contains three folders: Project Dictionaries, Input, and Output. 2. DICTION has three distinct windows: the Project Explorer window
MODFLOW - Grid Approach
 GMS 7.0 TUTORIALS MODFLOW - Grid Approach 1 Introduction Two approaches can be used to construct a MODFLOW simulation in GMS: the grid approach and the conceptual model approach. The grid approach involves
v. 8.0 GMS 8.0 Tutorial MODFLOW Grid Approach Build a MODFLOW model on a 3D grid Prerequisite Tutorials None Time minutes
 v. 8.0 GMS 8.0 Tutorial Build a MODFLOW model on a 3D grid Objectives The grid approach to MODFLOW pre-processing is described in this tutorial. In most cases, the conceptual model approach is more powerful
User manual. English. Perception CSI Extension Harmonic Analysis Sheet. A en
 A4192-2.0 en User manual English Perception CSI Extension Document version 2.0 February 2015 For Harmonic Analysis version 2.0.15056 For Perception 6.60 or higher For HBM's Terms and Conditions visit www.hbm.com/terms
User Guide. S-Curve Tool
 User Guide for S-Curve Tool Version 1.0 (as of 09/12/12) Sponsored by: Naval Center for Cost Analysis (NCCA) Developed by: Technomics, Inc. 201 12 th Street South, Suite 612 Arlington, VA 22202 Points
Normalization Methods for Two-Color Microarray Data
 Normalization Methods for Two-Color Microarray Data 1/13/2009 Copyright 2009 Dan Nettleton What is Normalization? Normalization describes the process of removing (or minimizing) non-biological variation
AP Statistics Sampling. Sampling Exercise (adapted from a document from the NCSSM Leadership Institute, July 2000).
.") AP Statistics Sampling Name Sampling Exercise (adapted from a document from the NCSSM Leadership Institute, July 2000). Problem: A farmer has just cleared a field for corn that can be divided into 100
AP Statistics Sampling Name Sampling Exercise (adapted from a document from the NCSSM Leadership Institute, July 2000). Problem: A farmer has just cleared a field for corn that can be divided into 100
Husky Stadium CLUB HUSKY Seat Selection Instruction Manual
 Husky Stadium 2013 CLUB HUSKY 1 Husky Athletics is very excited to share this state-of-the-art 3D technology with you. You will have the ability to view and select the best available seats according to
Data Acquisition Using LabVIEW
 Experiment-0 Data Acquisition Using LabVIEW Introduction The objectives of this experiment are to become acquainted with using computer-conrolled instrumentation for data acquisition. LabVIEW, a program
LeCroy Digital Oscilloscopes
 LeCroy Digital Oscilloscopes Get the Complete Picture Quick Reference Guide QUICKSTART TO SIGNAL VIEWING Quickly display a signal View with Analog Persistence 1. Connect your signal. When you use a probe,
Dektak Step by Step Instructions:
 Dektak Step by Step Instructions: Before Using the Equipment SIGN IN THE LOG BOOK Part 1: Setup 1. Turn on the switch at the back of the dektak machine. Then start up the computer. 2. Place the sample
Quick Reference Manual
 Quick Reference Manual V1.0 1 Contents 1.0 PRODUCT INTRODUCTION...3 2.0 SYSTEM REQUIREMENTS...5 3.0 INSTALLING PDF-D FLEXRAY PROTOCOL ANALYSIS SOFTWARE...5 4.0 CONNECTING TO AN OSCILLOSCOPE...6 5.0 CONFIGURE
SEVENTH GRADE. Revised June Billings Public Schools Correlation and Pacing Guide Math - McDougal Littell Middle School Math 2004
 SEVENTH GRADE June 2010 Billings Public Schools Correlation and Guide Math - McDougal Littell Middle School Math 2004 (Chapter Order: 1, 6, 2, 4, 5, 13, 3, 7, 8, 9, 10, 11, 12 Chapter 1 Number Sense, Patterns,
in the Howard County Public School System and Rocketship Education
 Technical Appendix May 2016 DREAMBOX LEARNING ACHIEVEMENT GROWTH in the Howard County Public School System and Rocketship Education Abstract In this technical appendix, we present analyses of the relationship
APA Research Paper Chapter 2 Supplement
 Microsoft Office Word 00 Appendix D APA Research Paper Chapter Supplement Project Research Paper Based on APA Documentation Style As described in Chapter, two popular documentation styles for research
PCM-16 Phase Synchronization Controller Operators Manual
 PCM-16 Phase Synchronization Controller Operators Manual Information furnished by EMERSON EMC is believed to be accurate and reliable. However, no responsibility is assumed by EMERSON EMC for its use.
Chapter 27. Inferences for Regression. Remembering Regression. An Example: Body Fat and Waist Size. Remembering Regression (cont.)
") Chapter 27 Inferences for Regression Copyright 2007 Pearson Education, Inc. Publishing as Pearson Addison-Wesley Slide 27-1 Copyright 2007 Pearson Education, Inc. Publishing as Pearson Addison-Wesley An
Chapter 27 Inferences for Regression Copyright 2007 Pearson Education, Inc. Publishing as Pearson Addison-Wesley Slide 27-1 Copyright 2007 Pearson Education, Inc. Publishing as Pearson Addison-Wesley An
For the SIA. Applications of Propagation Delay & Skew tool. Introduction. Theory of Operation. Propagation Delay & Skew Tool
 For the SIA Applications of Propagation Delay & Skew tool Determine signal propagation delay time Detect skewing between channels on rising or falling edges Create histograms of different edge relationships
BitWise (V2.1 and later) includes features for determining AP240 settings and measuring the Single Ion Area.
 includes features for determining AP240 settings and measuring the Single Ion Area.") BitWise. Instructions for New Features in ToF-AMS DAQ V2.1 Prepared by Joel Kimmel University of Colorado at Boulder & Aerodyne Research Inc. Last Revised 15-Jun-07 BitWise (V2.1 and later) includes features
BitWise. Instructions for New Features in ToF-AMS DAQ V2.1 Prepared by Joel Kimmel University of Colorado at Boulder & Aerodyne Research Inc. Last Revised 15-Jun-07 BitWise (V2.1 and later) includes features
UNIVERSITY OF MASSACHUSETTS Department of Biostatistics and Epidemiology BioEpi 540W - Introduction to Biostatistics Fall 2002
 1 UNIVERSITY OF MASSACHUSETTS Department of Biostatistics and Epidemiology BioEpi 540W - Introduction to Biostatistics Fall 2002 Exercises Unit 2 Descriptive Statistics Tables and Graphs Due: Monday September
Tutor Led Manual v1.7. Table of Contents PREFACE I.T. Skills Required Before Attempting this Course... 1 Copyright... 2 GETTING STARTED...
 EndNote X7 Tutor Led Manual v1.7 Table of Contents PREFACE... 1 I.T. Skills Required Before Attempting this Course... 1 Copyright... 2 GETTING STARTED... 1 EndNote Explained... 1 Opening the EndNote Program...
Measurement User Guide
 N4906 91040 Measurement User Guide The Serial BERT offers several different kinds of advanced measurements for various purposes: DUT Output Timing/Jitter This type of measurement is used to measure the
Defining and Labeling Circuits and Electrical Phasing in PLS-CADD
 610 N. Whitney Way, Suite 160 Madison, WI 53705 Phone: 608.238.2171 Fax: 608.238.9241 Email:info@powline.com URL: http://www.powline.com Defining and Labeling Circuits and Electrical Phasing in PLS-CADD
Bootstrap Methods in Regression Questions Have you had a chance to try any of this? Any of the review questions?
 ICPSR Blalock Lectures, 2003 Bootstrap Resampling Robert Stine Lecture 3 Bootstrap Methods in Regression Questions Have you had a chance to try any of this? Any of the review questions? Getting class notes
Footnotes and Endnotes
 Footnotes and Endnotes Sometimes when writing a paper it is necessary to insert text at the bottom of a page in a document to reference something on that page. You do this by placing a footnote at the
Frequently Asked Questions
 Frequently Asked Questions General Information 1. Does DICTION run on a Mac? A Mac version is in our plans but is not yet available. Currently, DICTION runs on Windows on a PC. 2. Can DICTION run on a
Topic: Instructional David G. Thomas December 23, 2015
 Procedure to Setup a 3ɸ Linear Motor This is a guide to configure a 3ɸ linear motor using either analog or digital encoder feedback with an Elmo Gold Line drive. Topic: Instructional David G. Thomas December
Table of Contents. 2 Select camera-lens configuration Select camera and lens type Listbox: Select source image... 8
 Table of Contents 1 Starting the program 3 1.1 Installation of the program.......................... 3 1.2 Starting the program.............................. 3 1.3 Control button: Load source image......................
FACSAria I Standard Operation Protocol Basic Operation
 FACSAria I Standard Operation Protocol Basic Operation 1. Checking Lasers Status a. Please check the ON / OFF of the lasers. Sufficient time (~30 minutes) need to be given to allow the laser(s) to warm
Version : 1.0: klm. General Certificate of Secondary Education November Higher Unit 1. Final. Mark Scheme
 Version : 1.0: 11.10 klm General Certificate of Secondary Education November 2010 Mathematics Higher Unit 1 43601H Final Mark Scheme Mark schemes are prepared by the Principal Examiner and considered,
INSTALATION PROCEDURE
 INSTALLATION PROCEDURE Overview The most difficult part of an installation is in knowing where to start and the most important part is starting in the proper start. There are a few very important items
The DataView PowerPad III Control Panel
 Setting Up a Recording Session in the DataView PowerPad III Control Panel By Mike Van Dunk The DataView PowerPad III Control Panel is designed for working with AEMC PowerPad III Power Quality Analyzers,
ToshibaEdit. Contents:
 ToshibaEdit Contents: 1 General 2 Installation 3 Step by step a Load and back up a settings file b Arrange settings c Provider d The favourite lists e Channel parameters f Write settings into the receiver
Application Note AN-708 Vibration Measurements with the Vibration Synchronization Module
 Application Note AN-708 Vibration Measurements with the Vibration Synchronization Module Introduction The vibration module allows complete analysis of cyclical events using low-speed cameras. This is accomplished
Lab experience 1: Introduction to LabView
 Lab experience 1: Introduction to LabView LabView is software for the real-time acquisition, processing and visualization of measured data. A LabView program is called a Virtual Instrument (VI) because
Setting Up the Warp System File: Warp Theater Set-up.doc 25 MAY 04
 Setting Up the Warp System File: Warp Theater Set-up.doc 25 MAY 04 Initial Assumptions: Theater geometry has been calculated and the screens have been marked with fiducial points that represent the limits
KRAMER ELECTRONICS LTD. USER MANUAL
 KRAMER ELECTRONICS LTD. USER MANUAL MODEL: Projection Curved Screen Blend Guide How to blend projection images on a curved screen using the Warp Generator version K-1.4 Introduction The guide describes
GLog Users Manual.
 GLog Users Manual GLog is copyright 2000 Scott Technical Instruments It may be copied freely provided that it remains unmodified, and this manual is distributed with it. www.scottech.net Introduction GLog
Overview. Teacher s Manual and reproductions of student worksheets to support the following lesson objective:
 Overview Lesson Plan #1 Title: Ace it! Lesson Nine Attached Supporting Documents for Plan #1: Teacher s Manual and reproductions of student worksheets to support the following lesson objective: Find products
Experiment: Real Forces acting on a Falling Body
 Phy 201: Fundamentals of Physics I Lab 1 Experiment: Real Forces acting on a Falling Body Objectives: o Observe and record the motion of a falling body o Use video analysis to analyze the motion of a falling
User s Manual. Log Scale (/LG) GX10/GP10/GX20/GP20 IM 04L51B01-06EN. 1st Edition
 GX10/GP10/GX20/GP20 IM 04L51B01-06EN. 1st Edition") User s Manual Model GX10/GP10/GX20/GP20 Log Scale (/LG) User s Manual 1st Edition Introduction Notes Trademarks Thank you for purchasing the SMARTDAC+ Series GX10/GX20/GP10/GP20 (hereafter referred to
User s Manual Model GX10/GP10/GX20/GP20 Log Scale (/LG) User s Manual 1st Edition Introduction Notes Trademarks Thank you for purchasing the SMARTDAC+ Series GX10/GX20/GP10/GP20 (hereafter referred to
Capstone Experiment Setups & Procedures PHYS 1111L/2211L
 Capstone Experiment Setups & Procedures PHYS 1111L/2211L Picket Fence 1. Plug the photogate into port 1 of DIGITAL INPUTS on the 850 interface box. Setup icon. the 850 box. Click on the port 1 plug in
OPERATION MANUAL OF MULTIHEAD WEIGHER
 OPERATION MANUAL OF MULTIHEAD WEIGHER Page 1 of 62 PREFACE Multihead weigher is automatic weighing equipment by using MCU control system to achieve high speed, accuracy and stable performance. Different
Operating Instructions
 Operating Instructions HAEFELY TEST AG KIT Measurement Software Version 1.0 KIT / En Date Version Responsable Changes / Reasons February 2015 1.0 Initial version WARNING Introduction i Before operating
BLUNIK II ACCESSORIES SPORT DRIVE SPORT CALCULATOR... 49
 USER GUIDE 12/2016 2 INDEX DESCRIPTION of BLUNIK II...6 DESCRIPTION of parameters...7 ADJUSTMENT OF PARAMETERS...7 Parameter: CLOCK SYNCHRO...8 Parameter: TIRES...9 Parameter: CALIBRATION... 10 Calibration
Resampling Statistics. Conventional Statistics. Resampling Statistics
 Resampling Statistics Introduction to Resampling Probability Modeling Resample add-in Bootstrapping values, vectors, matrices R boot package Conclusions Conventional Statistics Assumptions of conventional
Chapter 23 Dimmer monitoring
 Chapter 23 Dimmer monitoring ETC consoles may be connected to ETC Sensor dimming systems via the ETCLink communication protocol. In this configuration, the console operates a dimmer monitoring system that
TI-Inspire manual 1. Real old version. This version works well but is not as convenient entering letter
 TI-Inspire manual 1 Newest version Older version Real old version This version works well but is not as convenient entering letter Instructions TI-Inspire manual 1 General Introduction Ti-Inspire for statistics
SigPlay User s Guide
 SigPlay User s Guide . . SigPlay32 User's Guide? Version 3.4 Copyright? 2001 TDT. All rights reserved. No part of this manual may be reproduced or transmitted in any form or by any means, electronic or
USER MANUAL FOR THE ANALOGIC GAUGE FIRMWARE VERSION 1.1
 by USER MANUAL FOR THE ANALOGIC GAUGE FIRMWARE VERSION 1.1 www.aeroforcetech.com Made in the USA! WARNING Vehicle operator should focus primary attention to the road while using the Interceptor. The information
D-901 PC SOFTWARE Version 3
 INSTRUCTION MANUAL D-901 PC SOFTWARE Version 3 Please follow the instructions in this manual to obtain the optimum results from this unit. We also recommend that you keep this manual handy for future reference.
SIPROTEC Fault Record Analysis SIGRA
 Preface SIPROTEC Fault Record Analysis SIGRA V4.58 Manual Contents System Overview 1 Operating Functions 2 Fault Records 3 SIPROTEC Records 4 Views / Diagrams / Signals / Tables 5 Calculations/Definitions
LAB 1: Plotting a GM Plateau and Introduction to Statistical Distribution. A. Plotting a GM Plateau. This lab will have two sections, A and B.
 LAB 1: Plotting a GM Plateau and Introduction to Statistical Distribution This lab will have two sections, A and B. Students are supposed to write separate lab reports on section A and B, and submit the
ExtIO Plugin User Guide
 Overview The SDRplay Radio combines together the Mirics flexible tuner front-end and USB Bridge to produce a SDR platform capable of being used for a wide range of worldwide radio and TV standards. This
EASY-MCS. Multichannel Scaler. Profiling Counting Rates up to 150 MHz with 15 ppm Time Resolution.
 Multichannel Scaler Profiling Counting Rates up to 150 MHz with 15 ppm Time Resolution. The ideal solution for: Time-resolved single-photon counting Phosphorescence lifetime spectrometry Atmospheric and
Digital Video User s Guide THE FUTURE NOW SHOWING
 Digital Video User s Guide THE FUTURE NOW SHOWING TV Welcome The NEW WAY to WATCH Digital TV is different than anything you have seen before. It isn t cable it s better! Digital TV offers great channels,
The BAT WAVE ANALYZER project
 The BAT WAVE ANALYZER project Conditions of Use The Bat Wave Analyzer program is free for personal use and can be redistributed provided it is not changed in any way, and no fee is requested. The Bat Wave
MICROSOFT WORD FEATURES FOR ARTS POSTGRADUATES
 MICROSOFT WORD FEATURES FOR ARTS POSTGRADUATES...2 Page Setup...3 Styles...4 Using Inbuilt Styles...4 Modifying a Style...5 Creating a Style...5 Section Breaks...6 Insert a section break...6 Delete a section
Graphical Displays of Univariate Data
 . Chapter 1 Graphical Displays of Univariate Data Topic 2 covers sorting data and constructing Stemplots and Dotplots, Topic 3 Histograms, and Topic 4 Frequency Plots. (Note: Boxplots are a graphical display
Appendix D. UW DigiScope User s Manual. Willis J. Tompkins and Annie Foong
 Appendix D UW DigiScope User s Manual Willis J. Tompkins and Annie Foong UW DigiScope is a program that gives the user a range of basic functions typical of a digital oscilloscope. Included are such features
GS122-2L. About the speakers:
 Dan Leighton DL Consulting Andrea Bell GS122-2L A growing number of utilities are adapting Autodesk Utility Design (AUD) as their primary design tool for electrical utilities. You will learn the basics
For an alphabet, we can make do with just { s, 0, 1 }, in which for typographic simplicity, s stands for the blank space.
 Problem 1 (A&B 1.1): =================== We get to specify a few things here that are left unstated to begin with. I assume that numbers refers to nonnegative integers. I assume that the input is guaranteed
EndNote Online. Getting Started Guide (Windows)
") EndNote Online Getting Started Guide (Windows) Volda University College, 2017 Table of Contents Registering and creating an account... 2 Downloading and installing the Cite While You Write EndNote Plug-In
EndNote Online Getting Started Guide (Windows) Volda University College, 2017 Table of Contents Registering and creating an account... 2 Downloading and installing the Cite While You Write EndNote Plug-In
Introduction to capella 8
 Introduction to capella 8 p Dear user, in eleven steps the following course makes you familiar with the basic functions of capella 8. This introduction addresses users who now start to work with capella
Training Note TR-06RD. Schedules. Schedule types
 Schedules General operation of the DT80 data loggers centres on scheduling. Schedules determine when various processes are to occur, and can be triggered by the real time clock, by digital or counter events,
Formatting Dissertations or Theses for UMass Amherst with MacWord 2008
 January 2015 Formatting Dissertations or Theses for UMass Amherst with MacWord 2008 Getting started make your life easy (or easier at least) 1. Read the Graduate School s Guidelines and follow their rules.
Vision Call Statistics User Guide
 The Vision Call Reporting package is a web based near real time statistical tool that enables users to understand the call flow of inbound traffic both in terms of where calls have come from and also how
Frequency Response and Standard background Overview of BAL-003-1
 Industry Webinar BAL-003-1 Draft Frequency Response Standard and Supporting Process July 18, 2011 Agenda Frequency Response and Standard background Overview of BAL-003-1 What s changing Field Trial Frequency
Chapter 5 Printing with Calc
 Calc Guide Chapter 5 Printing with Calc OpenOffice.org Copyright This document is Copyright 2005 by its contributors as listed in the section titled Authors. You can distribute it and/or modify it under
Math 81 Graphing. Cartesian Coordinate System Plotting Ordered Pairs (x, y) (x is horizontal, y is vertical) center is (0,0) Quadrants:
 (x is horizontal, y is vertical) center is (0,0) Quadrants:") Math 81 Graphing Cartesian Coordinate System Plotting Ordered Pairs (x, y) (x is horizontal, y is vertical) center is (0,0) Ex 1. Plot and indicate which quadrant they re in. A (0,2) B (3, 5) C (-2, -4)
Math 81 Graphing Cartesian Coordinate System Plotting Ordered Pairs (x, y) (x is horizontal, y is vertical) center is (0,0) Ex 1. Plot and indicate which quadrant they re in. A (0,2) B (3, 5) C (-2, -4)
Analyzing and Saving a Signal
 Analyzing and Saving a Signal Approximate Time You can complete this exercise in approximately 45 minutes. Background LabVIEW includes a set of Express VIs that help you analyze signals. This chapter teaches
Background. About automation subtracks
 16 Background Cubase provides very comprehensive automation features. Virtually every mixer and effect parameter can be automated. There are two main methods you can use to automate parameter settings:
ME EN 363 ELEMENTARY INSTRUMENTATION Lab: Basic Lab Instruments and Data Acquisition
 ME EN 363 ELEMENTARY INSTRUMENTATION Lab: Basic Lab Instruments and Data Acquisition INTRODUCTION Many sensors produce continuous voltage signals. In this lab, you will learn about some common methods
USER MANUAL FOR THE ANALOGIC GAUGE FIRMWARE VERSION 1.0
 by USER MANUAL FOR THE ANALOGIC GAUGE FIRMWARE VERSION 1.0 www.aeroforcetech.com Made in the USA! WARNING Vehicle operator should focus primary attention to the road while using the Interceptor. The information
Experiment PP-1: Electroencephalogram (EEG) Activity
 Activity") Experiment PP-1: Electroencephalogram (EEG) Activity Exercise 1: Common EEG Artifacts Aim: To learn how to record an EEG and to become familiar with identifying EEG artifacts, especially those related
Experiment PP-1: Electroencephalogram (EEG) Activity Exercise 1: Common EEG Artifacts Aim: To learn how to record an EEG and to become familiar with identifying EEG artifacts, especially those related
Dot Plots and Distributions
 EXTENSION Dot Plots and Distributions A dot plot is a data representation that uses a number line and x s, dots, or other symbols to show frequency. Dot plots are sometimes called line plots. E X A M P
The following exercises illustrate the execution of collaborative simulations in J-DSP. The exercises namely a
 Exercises: The following exercises illustrate the execution of collaborative simulations in J-DSP. The exercises namely a Pole-zero cancellation simulation and a Peak-picking analysis and synthesis simulation
NanoTrack Cell and Particle Tracking Primer
 NanoTrack Cell and Particle Tracking Primer The NanoTrack Pnode allows the user to track single cells and particles with nanometer precision at very fast tracking speeds. The speed of the tracking is dependent
CNC Router Parts Plasma Software Setup and Usage Guide
 Plasma Software Setup and Software Setup for the TMC3in1 Mach3 If your control PC is not currently set up with Mach3 software, follow the CNC Router Parts CNC Software Setup Guide to install the correct
GBA 327: Module 7D AVP Transcript Title: The Monte Carlo Simulation Using Risk Solver. Title Slide
 GBA 327: Module 7D AVP Transcript Title: The Monte Carlo Simulation Using Risk Solver Title Slide Narrator: Although the use of a data table illustrates how we can apply Monte Carlo simulation to a decision
The Measurement Tools and What They Do
 2 The Measurement Tools The Measurement Tools and What They Do JITTERWIZARD The JitterWizard is a unique capability of the JitterPro package that performs the requisite scope setup chores while simplifying
Application Note: Using the Turner Designs Model 10-AU Fluorometer to Perform Flow Measurements in Sanitary Sewers by Dye Dilution
 Instrument set-up: Model 10-AU Digital Fluorometer equipped with the 13 mm x 100 mm cuvette holder; and a 10-056/10-056R (546 nm) Excitation Filter, a 10-052/10-052R (>570 nm) Emission Filter, 10-053/10-053R