SpectraFoo v4.0 User Manual METRIC HALO Copyright Metric Halo Distribution, Inc. All rights reserved.
|
|
|
- Holly Dickerson
- 6 years ago
- Views:
Transcription


1 SpectraFoo v4.0 User Manual METRIC HALO Copyright Metric Halo Distribution, Inc. All rights reserved.
2 2 SpectraFoo User Manual Congratulations! You are now the owner of the most powerful audio analysis and metering system on the planet. SpectraFoo is capable of monitoring up to 24 separate channels simultaneously (depending on your input hardware). You may be asking 24 channels all at once? How is this possible? The answer is that SpectraFoo uses Metric Halo s ultra efficient high-resolution analysis engine. This technology uses the power of your Mac s processor in conjunction with your audio hardware to provide blazingly fast and incredibly detailed sample-accurate analysis and metering of any channel or an entire mix. SpectraFoo technology is unique in its ability to provide you, the engineer, spectral, power, and phase analysis which is truly useful to your production tasks. About This Guide This guide is divided into three sections: The SpectraFoo analysis engine - This is an introduction to the underlying technology behind SpectraFoo and how it differs from other Audio Analysis techniques. SpectraFoo instruments - This is an overview of the 12 types of track assignable Analysis instruments available in SpectraFoo. Using SpectraFoo - This section explains how you interact with SpectraFoo. SpectraFoo utilizes Metric Halo s innovative multiwindow, multi-channel audio routing technology to allow you to create multiple resizable instrument windows that always remain active. About SpectraFoo Configurations SpectraFoo is available in two configurations: SpectraFoo Standard provides a comprehensive set of real-time metering instruments. For most mixing and monitoring tasks, SpectraFoo Standard contains all the tools you will need. It gives you a comprehensive, multi-
3 SpectraFoo User Manual 3 channel view of signal levels, wave form data, signal histories, spectrum analysis and spectral histories, and a variety of phase monitoring tools, including a lissajous phase scope, correlation metering, and the unique Phase Torch. It does not provide any of the deeper analysis tools found in SpectraFoo Complete. SpectraFoo Complete provides all of the metering tools included in SpectraFoo Standard, but also includes a number of additional features that allow more detailed analysis of audio signals and systems. SpectraFoo Complete adds a multitone high-resolution sweeping signal generator, a recording, capture and static analysis system, high-resolution bit-level metering facilities, and a detailed two-channel FFT transfer function measurement system, with support for Music Based Measurement, Time Delay Spectroscopy and multiple overlays with coherence-based averaging. SpectraFoo Complete is a critical tool if you will be doing acoustical measurements, sound system or monitor tuning, musical instrument measurements, mastering, or any type of metering or measurement in which you need to be able to capture and strore the signals that you are measuring. This manual documents both configurations of SpectraFoo, Standard and Complete. Features that are only present in SpectraFoo Complete are notated with [SFC] at the begining of the section that documents the feature. Metric Halo has a no-penalty upgrade policy for all software products. If you have purchased SpectraFoo Standard and later decide that you need the power offered by SpectraFoo Complete, you can upgrade for the difference between the suggested retail price of SpectraFoo Standard and SpectraFoo Complete at the time of the upgrade. Contact Metric Halo directly at <sales@mhlabs.com> for more information.
4 4 SpectraFoo User Manual Introduction Welcome to the SpectraFoo Visual Audio Monitoring System the world s first audio analysis environment that actually lets you see music. SpectraFoo is a high precision, low latency, fully realtime audio visualization and analysis system. SpectraFoo takes advantage of the phenomenon known as synesthesia. The word synesthesia, meaning joined sensation, denotes the rare capacity to see sounds, taste shapes, or experience other equally startling sensory blendings whose quality seems difficult for most of us to imagine. Very few people experience natural synesthesia. Those who do usually possess distinct cognitive advantages over the rest of us. For example, many people with perfect pitch associate particular pitches with particular colors. They see sound as well as hear it. The interaction of vision and hearing helps these people maintain an absolute point of reference with regard to pitch. This allows them to discern absolute pitch values without the need for a reference tone. SpectraFoo allows anyone to experience the benefits of synesthetic sensation. In order for the human brain to properly integrate multiple sensory inputs and derive greater value from them, the inputs must be truly synchronized. SpectraFoo is the first audio visualization system to provide high resolution spectral and phase information that is fluidly animated and absolutely synchronized to the live audio signal. It is the first audio analyzer anywhere to allow the user to tap into the power of synesthesia. Like many other audio analyzers, SpectraFoo s analysis engine is based on the Fast Fourier Transform (FFT). The FFT algorithm is an efficient means of computing a Fourier Transform on a computer. The Fourier transform was developed between by the mathematician Joseph Fourier as part of a study of heat transfer. The Fourier transform converts a continuous record of amplitude vs. time into a record of amplitude vs. frequency. A modification of the Fourier Transform called the Discrete Fourier Transform (DFT) was developed to deal with sampled rather than continuous waveforms. The FFT algorithm was developed as an efficient way of computing the DFT on digital computers.
5 SpectraFoo User Manual 5 FFT-based analysis facilitates highly precise measurements. As a result, it has become a natural choice for audio analysis systems. Unfortunately, FFT-based methods have historically been more suited to Electrical Engineering-type audio measurements than dynamic measurements of musical program material. A traditional technique is to subject the system being measured to a known, controlled test signal. In order to get high-resolution measurements from the analyzer, one must wait for a significant period of time while the output of the system is captured by the analyzer and then transformed. If you want to measure the average response of the system, you have to wait for the analyzer to make many captures, transform them and average them before you see the results. With traditional transformation algorithms, the rate at which the signal is transformed is constrained by the spacing of the spectral lines. As a result, many professionals who work in the creative side of audio have resorted to using low-resolution RTA-type analyzers to get real-time information. SpectraFoo utilizes patent pending technology to decouple the transformation resolution from the transformation rate. As a result, SpectraFoo is fast, fast, fast! It can perform multichannel FFTs up to 84 times a second, allowing you to see spectral features as small as 5 Hz wide while staying absolutely synchronized with the source material. This allows you to experience and analyze sonic events simultaneously! In addition to its unmatched realtime performance, SpectraFoo also provides a full suite of highly precise quantitative analysis tools, including a capture and storage system which is seamlessly integrated into the monitoring environment. All of the intuitive knowledge you have gained via synesthesia can be leveraged on top of the quantitative measurements that SpectraFoo provides. The following is a guide that provides an overview of SpectraFoo s features and capabilities. This guide assumes that you have a basic working knowledge of the Mac OS and its standard techniques. If you are new to Mac OS X, you should consult your Apple documentation before continuing.
6 6 SpectraFoo User Manual System Requirements A Macintosh computer running Mac OS X or newer. SpectraFoo is compatible with OS 10.2 (Jaguar), 10.3 (Panther) and 10.4 (Tiger). We generally recommend that you use the latest available version of the OS. If you are using one of the previous releases (10.2 or 10.3), we recommend that you updated to Apple s final System Update for that release; Metric Halo only tests SpectraFoo with the final System Update of previous OS releases. RAM while SpectraFoo is completely compatible with OS X virtual memory, like all media applications, it benefits from more available physical memory. As a practical rule of thumb, all OS X systems ought to have at least 512 MB of physical memory installed. If you plan on using the capture engine or the delay finder, you will benefit from having more physical RAM installed, but it is not required for correct operation. OpenGL SpectraFoo can optionally take advanatage of OpenGL acceleration to increase performance, reduce system loading and reduce the likelihood of the fan turning on when used on a laptop. In order for SpectraFoo to use OpenGL, your system must be capable of supporting Apple s Quartz Extreme technology. All shipping Macs do support this technology, and this has been the case for a number of years (at the time of this writing). If you have a very old Mac, it may not support Quartz Extreme, and if this is the case, you will not be able to take advantage of the OpenGL optimizations available in SpectraFoo. A CoreAudio compliant audio I/O device. Under Mac OS X 10.2 and 10.3, SpectraFoo can use one CoreAudio device at a time. Since many USB devices are implemented as two separate devices, one CoreAudio device for input and one for output, you may not be able to use certain USB devices for full-duplex operation. Under OS 10.4, Apple has provided Aggregate Device Support which allows you to configure multiple CoreAudio devices to appear to SpectraFoo (and all other CoreAudio clients) as a single unified device. SpectraFoo s physical I/O capability and support-
7 SpectraFoo User Manual 7 ed sample rates are controlled by the audio hardware you choose to use with SpectraFoo. For best results, and the highest degree of compatibility testing out-of-the-box, we recommend that you use a member of Metric Halo s Mobile I/O Family of Firewire audio interfaces.
8 8 SpectraFoo User Manual SpectraFoo Basics SpectraFoo provides you with a wide variety of audio monitoring and analysis instruments.you may access any combination of the instruments at any time. This allows you to use as much or as little analysis as you want. The following section describes the instruments available to you and how they work. Please refer to the Section on Control and Routing to learn how to control the flow of signal through SpectraFoo. Common Features Instruments All of the instruments have the following controls: a power button a solo button parameter control button The power button, when turned off, disables the instrument. The solo button works much like the solo button on a recording console in that it shuts off all of the other instruments. However, if more than one instrument is in solo mode, all of the soloed instruments will continue to run, while the un soloed instruments will be disabled. If an instrument is in solo mode and turned off, it will be disabled, as will all of the un soloed instruments. These controls are provided to allow you to focus your attention on measurements made by a subset of SpectraFoo s instruments. Although SpectraFoo is always analyzing the signal in real time, limitations in the drawing speed of the host computer can cause the display to slow down when many instruments are enabled. By soloing the instruments that you are specifically interested in at a given point in time, you will improve real time performance of the display. For faster host machines, the difference in graphics performance will be less noticeable. When the parameter control button is clicked, it opens a floating window which allows you to control, in real time, many of the display parameters for the instrument in question. These control windows will be described in more detail below.
9 SpectraFoo User Manual 9 Some of the instruments have additional controls when they are in the consolidated Real Time Rack window. These controls provide hardwired linking functionality for the instruments. The controls for the realtime rack instruments are illustrated and described in the picture below: Common Features Control Windows As with the instruments themselves, the control windows for the instruments also contain some common features. The control window for each instrument contains one or more Active Channel pop-up menus. These allow you to select which analyzer channel is routed into the instrument for display (for instruments that only meter one channel at at time). For stereo instruments, there will be more than one Active Channel pop-up menu one for each channel that can be routed into the instrument, and generally labelled Channel 1 and Channel 2. The control window for each instrument also contains the parameter library popup menu (in the upper left-hand corner). This popup provides access to an integrated library system. You can use it to save and recall snapshots of the instrument s configuration. All the snapshots you create are available to instruments of the same type, and are maintained between each use of SpectraFoo. The control window for each instrument also contains the Groups popup meu (in the upper right-hand corner). The Groups popup menu provides access to a flexible parameter link-

10 10 SpectraFoo User Manual ing system. The items listed in the menu are the names of parameter groups. By selecting one or more groups, you add the instrument to one or more parameter group. Each parameter group will automatically broadcast all parameter changes from any member of the group to all the members of the group. By configuring your parameter groups and adding various instruments to the groups, you can keep the state of multiple instruments synchronized as you change the configurations of the instruments. One of the really cool features of parameter groups is that they allow you to link between instruments of different types. For example you can link the frequency controls between Spectragrams and Spectragraphs. For the real-time rack window, you have an additional way of controlling the enable and solo states of the instruments in the rack. You can set up predefined groups of enabled instruments using the commands found in the group menu. This allows you to quickly and easily switch modes as far as where your attention is focussed. These instrument groups only effect instruments in the consolidated Real Time Rack view described below. Even though these are called Instrument Groups they have no connection to the Link Groups described above.

11 SpectraFoo User Manual 11 - Instrument Groups Menu Only applies to instruments in the Real Time Rack The Real Time Rack SpectraFoo provides a two-channel consolidated Real Time Rack view that contains all of the instruments in one convenient window. When you use this view, the Spectragram, Spectragraph and Oscilloscope instruments have linking buttons that allow you to either stereo link the control parameters between the left and right channel instruments, or to link the control parameters of the Spectragram and Spectragraph of the same channel. These linking buttons are very similar in concept to the link feature that appears on good-quality stereo compressors. For example, the stereo link button on the Spectragraph allows you to ensure that both the left and right channel Spectragraph instruments use the same frequency calibration. When instruments are stereo linked, the parameters for both channels can be controlled from either the left or right channel details window. These linking features are currently only available in the Real Time Rack consolidated view. For the individual instruments available from the Master Controls window, you can use the Link Group system described on the previous page for linking instruments.

12 12 SpectraFoo User Manual Real Time Rack Consolidated View You may move instruments within the rack by clicking on the instrument you want to move and dragging it to a new location. As you drag the instrument around, the rack will indicate places to which the instrument can be moved by drawing a heavy border around the empty spot. If you release the mouse button while the instrument is over a location that is already occupied, the instrument will automatically return to its original location. Moving an instrument within the rack does not interrupt the analysis process or even the display update. In fact, whenever you turn a knob or move a fader in SpectraFoo, everything responds instantaneously.
13 SpectraFoo User Manual 13 SpectraFoo Standard Instruments SpectraFoo includes the following standard set of real time metering instruments: Level Meters: high resolution, standards-based level metering with the ability to display Peak, RMS and VU levels simultaneously. Supports European and AES PPM standards and K-System metering. Highly user configurable. Spectragraph: ultra high resolution real-time two channel spectrum analyzer with snapshots, cursors and overlays. Supports a variety of scaling, spectral weighting and ballistics. Spectragram: history display to accompany Spectragraph. Like a topological map of your signal; beautiful & informative! Timecode clock: running display of current timecode source. Oscilloscope: configurable, triggerable, dual channel audio frequency oscilloscope. Provides high-resolution wave form display and simple waveform math. Versatile triggering modes make this ideal for a variety of measurements. Power History: shows a running history of the peak and RMS level of the metered signal. Envelope History: shows running envelope of the metered signal, similar to a DAW overview. Band Power History: shows the running history of the total power within a specified bandwidth around a specified center frequency. Phase Torch : Metric Halo s unique two-channel phase visualization tool, displaying phase as a function of frequency, independent of power. Lissajous Phase Meter: familiar X-Y mode O-scope two channel
14 14 SpectraFoo User Manual phase meter with a twist; supports X-Y mode, Lissajous mode, and Stereo position mode. Also supports auto gain control to provide useful readings during fades or other very low-level material. Power Balance: unique meter that shows the history of the relative power between two channels. Perfect for balancing mics or for monitoring the relative stereo soundfield balance. Correlation: A favorite in European broadcast circles; shows an instantaneous representation of how mono-compatible the monitored stereo signal is. Correlation History: a companion to the Correlation meter, the Correlation History meter shows how the correlation is changing over time. Dockable with the Correlation meter. [SFC] Code Meter: Shows the per-bit activity of the digital audio signal routed to the meter; commonly known as a Bit-Scope. [SFC] Code Matrix Meter: A unique meter designed to examine the upper 16 bits of a digital signal. Allows you to quickly discover missing codes, converter problems and code-space utilization. [SFC] Code List Meter: A 1630-style display that shows the sequence of code values in the digital signal routed to the meter. [SFC] Transfer Function: Two channel differential FFT analyzer. This instrument allows you to compare the spectral and phase content of two signals. If the two signals are related (part of a system), the Transfer Function allows you to quickly discern the effect that the system has on the signals. Coupled with the delay finder (see below), this is the critical tool for measuring the acoustic response of speakers and rooms. It is also the primary tool for measuring the electrical response of signal processors. You can also use the transfer function to analyze the difference between snapshots captured with the Spectragraph instrument.
15 SpectraFoo User Manual 15 [SFC] Delay Finder: This instrument is used to measure the delay between the two analyzer channels used by the Transfer Function. It does this by computing the impulse response of the linear transfer function that relates the response channel to the source channel. After computing the impulse response, the delay finder automatically compensates for the delay by inserting additional delay internally on the source channel so that both channels line up. You can use the delay finder tool to choose a different alignment delay. These instruments are discussed in detail on the following pages. This instrument reference section details the appearance and function of the instruments, as well as the controllable parameters that you can use to adjust the functions of the instruments. Level Meter This instrument provides a highly configurable two-channel, three in one digital level meter. Like all SpectraFoo instruments, the level meters are resizable. If you make the meter wider than it is tall, it will use a horizontal orientation. If you make it taller than it is wide, the meter will use a vertical orientation. Level Meter Horizontal Orientation Vertical Orientation SpectraFoo s Level Meters allow you to switch on the fly between modern, fast tracking, sample accurate digital ballistics and traditional standards based PPM ballistics. Many engineers are used to working with
16 16 SpectraFoo User Manual PPM standard hardware level meters and SpectraFoo can emulate standard PPM ballistics, but it can also do much more. The ballistics for both the Peak crawlback and VU level is fully configurable. The meter can show you the Peak, RMS and VU levels along with holds for Peak and RMS simultaneously. The meter also has two available color modes: The Level based color mode colors the meter bars based upon the the level of the signal. The color breakpoints are user configurable and can be adjusted to provide smooth transitions or hard edges. This mode is the standard configuration for the meters, and is required to implement the K-System calibrated meters. The second color mode causes the meter bar to be color coded to indicate Peak and RMS, and uses color to distinguish its different modes. The yellow part of the meter indicates the instantaneous peak to peak level of the program material. The purple part of the meter indicates the RMS level. These colors are user definable. The Peak and RMS meters each have independent, resettable peak hold functions. The peak holds are represented by triangular carets of the same color as the meter to which they correlate. The hold indicators can also be drawn as bars. The VU meter is an adjustable ballistic average indicator that is represented by the grey triangular carets (or bar if selected). Detailed meter readings (1/100 db accuracy) and meter control parameters can be accessed by clicking on the Show Details button. The meter also contains a numerical counter that indicates the largest number of consecutive samples surpassing 0dBFS, as well as the number of times the input signal has exceeded the clip threshold. The calibration of the meters is referenced against 0dBFS, unless you have selected one of the dbu calibrated meter scales.

17 SpectraFoo User Manual 17 Digital Level Meters (Peak, RMS and VU meters w/ Clipped Sample Counter) USER-DEFINABLE OVER (DIGITAL CLIP) COUNTER The Level Meter counts consecutive full scale samples and displays the largest count encountered. This is displayed in the field labeled cfs. You can also define how many consecutive full scale samples the Level Meter has to see before it considers the signal to have clipped. You control this behavior using the Physical Unit calibration system in SpectraFoo (see Physical Unit Calibration In SpectraFoo ). The Level Meter has a numerical counter which keeps track of the number of overs which have occurred. This is displayed in the field labeled cnt.

18 18 SpectraFoo User Manual Over Counter The true flexibility of the meters is controlled using the Level Meter Controls window. Click the Meter s parameter control button to display the Level Meter Controls window: Level Meter Controls Window SUM & DIFFERENCE METER MODE The Level meters provide a Sum & Difference mode that shows L+R and L-R metering. When the Sum & Difference mode is selected, the left bar is the sum and the right bar is the difference (if the meter is in the vertical orientation; if the meter is horizontal the sum is in the top bar and the difference is in the bottom bar). The level meter mode is selected with the Meter Mode pop-up menu which allows you to configure a meter to run as a straight level meter or as a Sum & Difference meter. LEVEL METER DETAILED READOUT AND HOLD INDICATOR CONTROLS The Level Meter Controls window also contains detailed numerical readouts for the Peak, RMS and VU levels for each channel. Next to the labels for the readouts, there are checkbox controls. These controls allow you to determine whether or not to display the associated hold indicators on the meters. LEVEL METER OPTIONS WINDOW The rest of the meter configuration controls are in a second control window called the Level Meter Options window. You access this window by clicking the Options button at the bottom of the Controls window. Clicking the Options button brings up the Level Meter Options window:
19 SpectraFoo User Manual 19 Level Meter Options Window
20 20 SpectraFoo User Manual The table below describes the controls which are available in the Level Meter Options window. Control Level Meter Options What It Does VU Settling Time slider PPM Settling Time slider Peak Float Size slider PPM Hold Release Time slider Meter Scaling slider Tick Spacing slider Scale Type pop-up menu Use Level Based Color checkbox Controls the settling time of the VU indicator. When the slider is set on the VU mark, the indicator will use VU ballistics. This parameter is global for all channels and meters in the system. Controls the settling time of the level meter when Use PPM ballistics is checked. This parameter is global for all channels and meters in the system. Controls the size of the floating peak indicators. Sets the amount of time the Peak Holds wait before resetting when Auto-Release Holds is checked. Sets the dynamic range of the Level Meter. Sets the calibration mark spacing of the meter when the SpectraFoo scale is selected Selects the PPM standard to use for the meter scale. Activates level based transition colors for the meters. When this checbox is unchecked, meters use original SpectraFoo color coding for Peak and RMS levels.
21 SpectraFoo User Manual 21 Level Meter Options Control What It Does Use PPM Ballistics checkbox Exchange VU and RMS checkbox Draw Peak Level as Bar checkbox Draw Holds as Arrows checkbox Auto Relase Holds checkbox Activates PPM decay for the meter. If this is unchecked, the meter will use the original instantaneous SpectraFoo ballistics. Exchanges the VU indicator with the RMS bar. This allows you to create a bar meter which uses VU ballistics. When checked, the Level Meter will display the Peak and RMS levels as one continuous bar (as in previous versions of SpectraFoo). When unchecked, the Peak level will be displayed as a seperate indicator which floats above the RMS bar. Useful for creating meters that read peak-only. When checked, Peak holds will be displayed as arrows (like previous versions of SpectraFoo). When unchecked Peak Holds will be displayed as lines. When checked, the Peak Holds will reset after the amount of time you specify using the PPM Hold Release Time slider. USER SELECTABLE PPM BALLISTICS The Level Meter can be set to use PPM decay or to provide instantaneous digital metering with no crawlback. In order to operate as a traditional Peak Program Meter, you must configure the meters to use PPM ballistics and choose the standard crawlback speed. This is the default configuration for the meters. You can also choose non-standard crawlback speeds
22 22 SpectraFoo User Manual to make the meters more responsive or to provide a longer persistance time; choose the settings that work best for you. To configure a Level Meter to use PPM ballistics: 1. Open the Level Meter controls window and click the Options button. The Level Meter Options window will appear: Level Meter Options Window 2. Check Use PPM Ballistics. The meter will now use the standard PPM decay time. You can change the decay time using the PPM Settling Time slider. USER SELECTABLE IEC/EBU/AES/IEEE STANDARD PPM/VU METER SCALES SpectraFoo now has a variety of User Selectable scale calibrations. In addition to the equally spaced level calibration (aptly called the SpectraFoo Calibration), you can choose from the following international PPM and VU standards: 1. UK PPM UK Standard 1-7 Scale. Line-up calibration is 0dBu for marking EBU PPM EBU Standard PPM Scale. Line-up calibration is 0dBu
23 SpectraFoo User Manual 23 at marking Test. 3. IEEE PPM IEEE Standard PPM Scale. Line-up calibration is 0dBu at marking Test. 4. IEEE VU IEEE Standard VU Scale. Line-up calibration is +4dBu at marking DIN PPM DIN Standard PPM Scale. Line-up calibration is +6dBu at marking Nordic PPM Nordic Standard PPM Scale. Line-up calibration is +6dBu at marking Test. 7. Digital PPM Digital PPM Scale. Line-up calibration is 0 dbfs at marking SpectraFoo dbu calibrated scale with even spacing of calibration marks. The PPM crawlback ballistics in the meters conform to a crawlback rate of 20dB in 1.7 seconds. Fast PPM can be accomplished by setting the PPM settling time to 0.85 seconds. USER SELECTABLE METER BAR COLORS SpectraFoo has two different ways of color-coding its meters. The first method, which corresponds to the original SpectraFoo color scheme, provides one color for peak-level and another for RMS level. The second method, called level-based color, changes the color of the meter bar based on the level of the audio. You can change the colors in both of the color-coding methods from within the Level Meters Options window. To change the Peak and RMS and VU colors for a meter: 1. If the Meter s Control window is not visible, show the Control window by clicking the Show Controls button, and then selecting the Options button at the bottom of the Controls window. 2. Click the appropriate color tile within the Controls Window. The
24 24 SpectraFoo User Manual Macintosh Color Picker dialog will appear. 3. Select the new color in the dialog. 4. The Peak, RMS, and VU colors are used for the Peak, RMS, and VU holds respectively. If Use Level Based Color is unchecked the Peak and RMS colors are used for the Peak and RMS meter bars, respectively. To change the Level-based Colors: 1. If the Meter s Control window is not visible, show the Control window by clicking the Show Controls button, and then selecting the Options button at the bottom of the Controls window. 2. Click the appropriate color tile within the Controls Window. The Macintosh Color Picker dialog will appear. The three Level-based color tiles correspond to the Safe color, the Caution color, and the Danger color respectively. These colors also correspond to low, medium, and high levels. The standard configuration of these colors is Safe = Green, Caution = Yellow, Danger = Red. USER SELECTABLE METER BAR COLOR TRANSITION LEVELS The level-based color coding scheme assigns colors to the meter bars based on the corresponding level of the signal at each point along the bar. The colors are taken from the level based colors as described above. The transition points, e.g. levels at which the color changes from Safe to Caution and from Caution to Danger, are user selectable. This allows you to set the points at which the color bar changes to match your needs and expectations. To change the transition levels: 1. If the Meter s Control window is not visible, show the Control window by clicking the Show Controls button, and then select the Options button. 2. Adjust the appropriate Level Slider in the bottom of the control
25 SpectraFoo User Manual 25 window. 3. The Danger level slider controls the level at which the meter bar is completely at the Danger color. 4. The Caution level slider controls the level at which the meter bar is completely set to the Caution color. 5. The Safe Until level slider controls the level below which the meter bar is completely set to the Safe color. The meter bar is displayed in the Safe color from to the Safe Until level. Real Time High Resolution Spectrum Analyzer (Spectragraph) The spectrum analysis within SpectraFoo utilizes a multichannel, high resolution, real time FFT engine. At its highest resolution setting, SpectraFoo utilizes 64k point FFTs, allowing you to see features with widths as small as 2/3 Hz. SpectraFoo creates a new analysis up to 84 times per second, allowing you to see musical structure even at the highest tempos. Although the Spectragraph excels at traditional applications such as analyzing the distortion characteristics of audio equipment, its true strength lies in its sheer speed. SpectraFoo s Spectragraph is fast enough to create a highly detailed, animated movie of sonic events. If you have been watching SpectraFoo monitor a favorite album of yours while reading this guide, you probably have already noticed this. Because the Spectragraph is so completely synchronized with the material it is monitoring, the information it displays can be experienced in a sensory rather than intellectual way much the same way as you experience music itself. The key to making the most out of the Spectragraph (as well as all of the other instruments) is to spend some time listening to and looking at your favorite music music that you know really well. After a relatively short amount of time, details of the recordings such as phase structure, overall spectral balance, dynamic range, frequency range, and low frequency roll-off will literally leap out at you. You will be experiencing, rather than thinking about, quantitative analysis.

26 26 SpectraFoo User Manual The Spectragraph utilizes a triple display for each input channel. The bright green trace provides instantaneous spectral analysis. The purple trace shows the average spectral content referenced over a user specified length of time; this is controlled from the Details window. The dark green trace represents the peak spectral power monitored since the peak was last reset. Using the Details window, you can alter the Spectragraph s frequency and power scaling as well as its averaging characteristics in realtime. This allows you to easily focus on very fine details. In addition, the Control window allows you to adjust the colors assigned to each trace. DUAL CHANNEL MODES The Spectragraph can run as a 6 trace, dual channel instrument, allowing you to route any two channels to one Spectragraph window. For example, you could route the left and right channels of a stereo pair into a Spectragraph.

27 SpectraFoo User Manual 27 Figure 10: Spectragraph showing the left and right channels of a stereo pair You can also route two different instruments such as a kick drum and a bass to a Spectragraph and do a live comparison between them. To display a second trace in a Spectragraph: 1. Select the two channels that you wish to display using the channel pop-ups in the controls window. 2. Select the mode of the second trace using the second traces pop-up. If the mode of the second trace is set to None, the Spectragraph will only display channel 1. SUM, MULTIPLY AND OVERLAP MODES You use the Spectragraph Controls window to display and control second traces. The second trace in a dual trace Spectragraph can represent the second input channel as in the examples above, or one may be set to one of the following: None: This does not draw a second trace. Channel 2: This draws the Channel 2 selection as the second trace.
-3dB: The sum of the two channels routed to the Spectragraph -3dB. This shows the average total power in the stereo signal. 1*2: The product of the two channels routed to the Spectragraph.")
28 28 SpectraFoo User Manual 1+2: The sum of the two channels routed to the Spectragraph. This shows the sum total power in the stereo signal. (1+2)-3dB: The sum of the two channels routed to the Spectragraph -3dB. This shows the average total power in the stereo signal. 1*2: The product of the two channels routed to the Spectragraph. This filters the power of one signal with the power of the other. sqrt(1*2): The square root of the product of the two channels routed to the Spectragraph. This shows the overlap of the power in the two signals. Spectragraph Second Traces pop-up EQUAL POWER PER OCTAVE AND EQUAL POWER PER HZ ACCUMULATION MODES SpectraFoo s underlying FFT generates more data than can be displayed on screen at once. The way that this data is treated when the system computes the trace is called the accumulation mode. SpectraFoo provides two accumulation modes that you can choose using the Spectragraph Controls window:

29 SpectraFoo User Manual 29 Figure 12: Accumulation Mode pop-up 1. When the Accumulation Mode is set to White Noise is Flat, the Spectragraph shows the maximum power of all of the spectral lines in the FFT that fit into each point in the displayed trace. This has the effect displaying white noise (or noise that has an equal amount of power at each frequency) as a flat line. This mode is traditionally used when the frequency scale of the graph is linear. 2. When the Accumulation Mode is set to Pink Noise is Flat, the Spectragraph shows the sum of the power of all of the spectral lines in the FFT that fit into each point in the displayed trace. This has the effect of displaying pink noise (or noise that has an equal amount of power in each octave) as a flat line. This mode is traditionally used when the frequency scale of the graph is logarithmic and corresponds to the type of display available on a traditional RTA. The figures below show the results of the two weighting accumulation

.")


30 30 SpectraFoo User Manual modes with the two different kinds of noise. Figure 13: Pink Noise with Pink is Flat Figure 14: Pink Noise with White is Flat Figure 15: White Noise with Pink is Flat Figure 16: White Noise with White is Flat PHYSICAL UNIT CALIBRATION SpectraFoo can be globally calibrated to Physical Units (i.e. dbu, dbv). You can use dbu units in the power calibration for the Spectragraph by checking the Use dbu Calib checkbox in the instrument s Spectragraph Control window. See Physical Unit Calibration In SpectraFoo for more information about physical unit calibration in SpectraFoo. USER SELECTABLE TRACE COLORS The traces in the Spectragraph can be set to any color supported by your Mac. To change the color of a trace in the Spectragraph: 1. Click on the colored well to the left of the trace visibility check box in the Spectragraph Controls window.

31 SpectraFoo User Manual 31 Figure 17: Accessing Trace Color controls The Macintosh Color Picker will appear. The Mac OS color picker 2. Choose the color you want, and click OK. The trace will now appear in the color you selected. OCTAVE ANALYSIS The Spectragraph includes octave modes which allow you to display frequency data in resolutions ranging from 1 octave to Continuous. You use the Resolution pop-up in the Spectragraph Controls window to set the display resolution.

32 32 SpectraFoo User Manual Spectragraph display Resolution pop-up The Resolution pop-up does not affect the resolution of the actual FFT analysis being performed, it only affects the way that the FFT data is displayed. To control the resolution of the FFT you still use the FFT size commands found in the Analyzer menu.


33 SpectraFoo User Manual 33 Here are some examples of the different modes: 1 octave display resolution 1/2 octave display resolution 1/3 octave display resolution 1/6 octave display resolution 1/12 octave display resolution 1/24 octave display resolution LOG AND LINEAR AVERAGING There are two natural ways to average the power spectrum of an audio signal. The first method, which corresponds to SpectraFoo s Log Averaging Mode, averages the power data after it has been converted to decibels. It is consistent with a visual average of the trace in the display, and mathematically it corresponds to averaging the level in decibels. An average computed this way would be, for example, (1dB + 2 db)/2 = 1.5 db. While this is not mathematically correct and appears to over-represent the
34 34 SpectraFoo User Manual contribution of low-level signals, it is still useful as a measurement tool. The second mode, which corresponds to SpectraFoo s Lin Averaging Mode, and is mathematically correct, averages the actual power level and then takes the logarithm of the average to give the level in db. This give the true average level of the signal, but does not correspond to the expected visual average. With this averaging mode (1dB + 2 db)/2 = db which is mathematically correct. This difference is not trivial. Consider the average of -10dB and -40dB. The Log average is: (-10dB - 40dB)/2 = -25dB. The linear average is (-10dB - 40dB)/2 = dB. As stated, the Log average over-weights low level signals. Log Averaging is more useful for showing overall spectral balance in the monitored material. This is probably because the human ear over-weights low level signals in much the same way that Log averaging does. For building EQ curves, linear averaging makes the same average measurement as what an EQ will see. Not surprisingly, we have found the Linear Averaging mode works better when attempting to capture spectral templates of material for matching purposes. Spectral Snapshots, Overlays & Libraries You can use the Spectragraph to create spectral snapshots and save them as library files. The library file that is created does not contain the actual audio samples that the spectragraph was analyzing, but rather the transformed Fourier power data that the Spectragraph uses to draw its traces. This allows you to take spectral snapshots of sounds and post-process them at a later time. You can take a number of snapshots and average them to form a new average snapshot. You can also use a pair of snapshots to create a transfer function which can be displayed in the Transfer Function Window (SpectraFoo Complete). To take a spectral snapshot: 1. Route a sound that you want to take a snapshot of to a Spectragraph.


35 SpectraFoo User Manual 35 Spectragraph Snap Button 2. Click the Snap button on the left side of the Spectragraph.The Spectral Snapshots dialog will appear The Spectral Snapshots dialog 3. Name the snapshots. The Spectral Snapshots dialog has two name fields, one for each trace set of the Spectragraph.The first trace set is composed of the three traces associated with the first input channel. The second trace set is composed of the three traces associated with the data created by the Second Trace Mode. Thus, if the Second Trace Mode is Channel 2, the second trace set is composed of the three traces associated with the second input channel. 4. Select the traces you want to save using the checkboxes. If you select a checkbox for a trace which is not currently active in the Spectragraph, the trace will be saved anyway. For example, if you

36 36 SpectraFoo User Manual take a snapshot of an instantaneous trace but decide that you really want a snapshot of the average also, just select the Average Trace checkbox in the Spectral Snapshots dialog. The average trace will be saved as a snapshot using the averaging parameters that are currently set in the Spectragraph controls window. If you want to take a snapshot of only one channel, make sure that the snapshot checkboxes for the channel you want to discard are left unchecked. 5. Type any comments you might have about the snapshot into the comments field. 6. Click OK. The snapshots will be created and the Spectral Snapshots List window will appear: The Spectral Snapshots window The Spectral Snapshots List allows you to assign and display snapshots in Spectragraph instruments. You also use the Spectral Snapshots List to access the post-processing functions that can be performed on Spectral Snapshots. To assign and display a Spectral Snapshot in a Spectragraph: 1. If the Spectral Snapshots List is not visible, choose Show Spectral Snapshots Window from the Window menu. 2. Use the Show In pop-up menus to the right of the snapshot names to assign snapshots to particular Spectragraphs.


37 SpectraFoo User Manual 37 Show In pop-up The snapshot will appear in the Spectragraph you choose. You can display each snapshot in any number of Spectragraphs. Simply select each Spectragraph that you want the snapshot to appear within. Snapshot assigned to a Spectragraph Each Spectragraph that you create in SpectraFoo displays a number and the name of the channels routed to it on the left side of the instrument window. The numbers are assigned to Spectragraphs in the order they are created. So the first Spectragraph you create will be numbered 1, the second Spectragraph 2 and so on (The Spectragraphs that appear in the Real-Time Rack window are a special case. These instruments are numbered 254 and 255). These numbers and channel names match the items you will find in the Show In pop-up in the Spectral Snapshots window. This allows you to assign a snapshot to any Spectragraph you want without confusion. To create an average snapshot from a number of Spectral Snapshots: 1. If the Spectral Snapshots List is not visible, choose Show Spectral Snapshots Window from the Window menu. 2. Select the snapshots you want to include in the average.


38 38 SpectraFoo User Manual Selection for Snapshot Averaging 3. Choose Average Selected Snapshots from the Spectral Snapshots mini-menu. The Spectral Snapshots minimenu 4. The Average Snapshots dialog will appear. Average Snapshots Dialog 5. Name the average and type any comments you might have. By default, SpectraFoo places the names of the Snapshots that you are averaging in the comments field. Click OK when you are ready to save the average. The new Average will appear in the Snapshots List. Average appears in the Spectral Snapshots List Now the average can be displayed in a Spectragraph as a snapshot.

39 SpectraFoo User Manual 39 To create a Transfer Function from two Spectral Snapshots: 1. Select the two snapshots in the Spectral Snapshots List 2. Choose Create Transfer Function from the Spectral Snapshots mini-menu. 3. The Transfer Function snapshot dialog will appear. The Transfer Function Snapshot Dialog 4. Name the Snapshot and add any comments you might have. By default, SpectraFoo labels the source and response channels. The source channel will be the channel that appears first in the Spectral Snapshots list. 5. Click OK. SpectraFoo will automatically open the Transfer Function window and display the newly created Transfer Function.

40 40 SpectraFoo User Manual Transfer Function Created From Two Spectral Snapshots You can use this tool for a variety of purposes. One application is for measuring system response with an RMS average instead of the normal vector averaging that is used by the transfer function. This can allow you to measure approximate system response in the case where the system time delay is not constant (e.g. outdoor systems in a windy environment, etc.) This functionality can also be used to make transfer functions between unrelated sound sources (two different songs, noise floor of two different rooms, etc.) Oscilloscope The oscilloscopes are single-trace-style scopes which provide a display of the program waveform of the assigned input channels. Pressing the details button on the oscilloscope brings up a Control window with several adjustable features, such as trigger mode. If the oscilloscope is contained within the Real Time Rack you can Stereo link the two oscilloscopes with the SLink button on the left channel scope. When you click the SLink button, the control parameters for the right channel scope are set to the


41 SpectraFoo User Manual 41 corresponding values from the left scope. Triggering Oscilloscope Within the Oscilloscope details window is the Sensitivity slider, which controls the magnification of the oscilloscope trace, allowing you to see the wave shape characteristics of very low level signals. The Timebase slider controls the timescale of the oscilloscope grid. The timebase of the grid is precisely indicated in the numerical readout at the top of each scope. Each mark on the slider indicates the number of samples represented by each pixel in the trace. Each oscilloscope can trigger and hold the wave form of the signal being
42 42 SpectraFoo User Manual monitored. There are seven available trigger modes: Trigger Mode Behavior Free automatically retriggers on the internal clock Normal triggers the drawing trace once channel input matches your trigger settings Hold triggers a drawing trace and holds the signal until rearmed Hold and Retrigger same as Hold, but the trigger is automatically rearmed Timed Hold same as Hold, but the trigger is automatically rearmed after the desired retrigger time Polarity Check same as Hold, but displays all the data prior to the trigger point and triggers on either polarity and either slope Timed Polarity Check rearms after the desired retrigger time Clip Capture same as Polarity Check but triggers when signal reaches full scale
43 SpectraFoo User Manual 43 Trigger Mode Behavior Timed Clip Capture rearms after the desired retrigger time Trigger Modes The Trigger Level slider sets the trigger threshold level in percent of full scale. 0 represents - dbfs. When the slider is to the right of 0 the scope will trigger on the positive portion of a full scale signal; when it is to the left it will trigger on the negative portion of a full scale signal. The Retrig Time slider controls the amount of time that the system waits before retriggering when a "Timed" is mode selected. The Slope Switch controls how the scope is triggered. When in the up position, the scope will trigger when the signal reaches the threshold level and is moving in a positive direction. When the switch is down, the trigger occurs when the threshold is reached and is moving in a negative direction. The Arm Trigger button manually rearms the trigger. Clicking on the Grid disclosure triangle at the bottom of the Control window causes the oscilloscope details window to expand and reveal controls for manipulating the oscilloscope calibration grid, or graticule. The Grid Vert Spacing slider controls the vertical spacing of the horizontal grid lines. The Grid Horiz Spacing slider controls the horizontal spacing of the vertical grid lines. The VOffset slider controls the vertical offset of the trace zero line. The HOffset slider controls the horizontal offset of the trace trigger point.


44 44 SpectraFoo User Manual The Illumination slider controls the brightness of the grid. Sliding it all the way to the left shuts off the grid as well as the grid details readout on the scope. The Oscilloscope has been enhanced to provide two input channels. This allows you to show two different channels on the scope at the same time. Oscilloscope running in dual-trace mode SINGLE AND DUAL CHANNEL MODES The Oscilloscope supports two input channels and a variety of second trace modes. The second channel mode is selected using the Mode popup menu in the Oscilloscope Controls window. Oscilloscope Controls window SINGLE, DUAL, SUM, DIFFERENCE, AND MULTIPLY TRACE DISPLAY MODES Five different modes are provided: 1. Single Trace Only The scope runs in the original single trace mode. The trace corresponds to the signal in the first input chan-
45 SpectraFoo User Manual 45 nel. 2. Dual Trace Two traces, one corresponding to each of the input channels, are displayed on the scope. 3. Subtract Second Channel One trace, corresponding to Channel 1 - Channel 2, is displayed on the scope. 4. Add Second Trace One trace, corresponding to Channel 1 + Channel 2, is displayed on the scope. 5. Multiply Second Channel One trace, corresponding to Channel 1 * Channel 2, is displayed on the scope. SELECTABLE TRIGGER CHANNEL The trigger channel is now user selectable. This allows you to run the trigger off of Channel 1, Channel 2, or Either input channel. You select the trigger channel with the Trig. Chan pop-up menu in the Oscilloscope Controls window. Power History This instrument allows you to see the history of the information displayed by the Peak and RMS meters. The light grey tick marks indicate the passage of one second of time, and the height of the color for each time slice indicates the Peak (yellow) & RMS (purple) power levels of the program. The ratio between these two levels is responsible for the perceived volume of program material. When there is a large difference between the Peak and RMS levels of program material, the perceived volume will be low as compared to the peak levels on the tape. Conversely, when the difference between Peak and RMS levels is small, the perceived volume will be louder. This instrument can help you determine how much compression and limiting is needed for specific program material. If you have a full-featured mastering compressor, this display can also help you determine whether the compressor should be set to react to Peak or RMS levels.


46 46 SpectraFoo User Manual Note: This meter is scaled logarithmically in decibels. When the average level is high, the signal can change relatively dramatically in level without creating a large change in the display. In this situation it is useful to refer to the envelope history display which is described below. Envelope History This instrument is a sample editor style scrolling envelope overview. It can help you calibrate your eyes if you are experienced with DAW-style displays. Because it uses linear scaling, it is useful for identifying large level changes when the average level is high. It should be used in conjunction with the Peak and Average History display to obtain a good view of the overall dynamics of program material. Power Balance History

47 SpectraFoo User Manual 47 The Power Balance History compares the power balance between the two input channels as a function of time. When the power level on the first input channel is greater than the second input channel the display turns green and shifts above the centerline. When the power level on the second input channel is greater than the first input channel, the display turns red and shifts below the centerline. The length of the indicator expresses the difference in power between the right and left sides as a percentage of the total power present in both signals. The light grey lines appear once per second as the history scrolls to the left. This meter is very helpful for precisely identifying the aspects of mixes that don t have a natural flow of energy between the left and right channels. It is also great for power-balancing natural stereo recordings and two channel measurements of equipment. Lissajous Phase Scope Lissajous Phase Scope (vector mode) Lissajous Phase Scope (X-Y mode) The Lissajous Phase Scope is equivalent to an oscilloscope running in either vectorscope, X Y mode, or stereo position mode. You can switch the mode by opening the Controls window, and selecting the appropriate mode with the Scope Mode popup menu. This tool shows you the ampli-

 the left and right channels are predominantly in")
48 48 SpectraFoo User Manual tude of the first input signal versus the amplitude of the second input channel signal. This instantly lets you know if a mix has polarity problems. It also allows you to see the width of the stereo field of the material being monitored. When the scope is in vector mode, in-phase material appears as a vertical line while out of phase material appears horizontal. When the scope is in X Y mode and the activity of the trace occurs mostly in the lower left and upper right quadrants of the display (as pictured) the left and right channels are predominantly in polarity. When the activity of the trace occurs mostly in the lower right and upper left quadrants of the display, the left and right channels are predominantly out of polarity (commonly referred to as out-of-phase, or mono-incompatible). STEREO POSITION MODE In addition to the X-Y and Vectorscope modes, SpectraFoo has a Stereo Position mode. This mode displays each of the relative phase vectors in the signal. The length of each phase vector is log-scaled. Vectors pointing along the L 45 line are mono sources that are panned to input channel 1. Vectors pointing along the R 45 line are mono sources that are panned to input channel 2. Vectors within the L-R 90 cone correspond to normal, substantially in-phase program material. Vectors that are outside the L-R 90 cone correspond to program material that is more or less out of phase. Under normal, mono-compatible signal conditions the vectors will be generally within the in-phase cone and there will be occasional, short vectors that appear within the out-of-phase region. If the signal is substantially out of phase or not mono-compatible, the majority of the vectors will appear in the out-of-phase region Lissajous in Stereo Position Mode Lissajous Control window
49 SpectraFoo User Manual 49 To change the Lissajous mode 1. If the Lissajous Scope s Control window is not visible, show the Control window by clicking the Show Controls button. 2. Select the desired Lissajous mode (Vectorscope, X-Y, or Stereo Position) from the Scope Mode pop-up menu. ADJUSTABLE SENSITIVITY The sensitivity of the meter can be adjusted using the Sensitivity slider in the Lissajous Control window. The sensitivity can be increased to make the phase of low-level signals visible. AUTO-SENSITIVITY MODE Often the dynamic range of the signals being monitored is quite large. When the dynamic range is large, no one setting of the sensitivity is correct to show all of the details of the phase of the signal. Sometimes the sensitivity is too small and the lissajous trace looks like a single dot. Other times the sensitivity is too large and the trace extends way past the edge of the meter. Auto Sensitivity mode automatically calculates the appropriate sensitivity setting for the meter at each instant of time. It is activated by checking the Auto Sensitivity button in the Lissajous Control window. HI-RES MODE To increase the speed of display, the Lissajous scope computes its display from every fourth sample. This gives a reasonably accurate representation of the phase information. It also generates a display that is not quite as smooth and clean as an analog scope. The Lissajous Hi-Res Mode makes the Lissajous scope compute its display from every sample. This mode is activated by checking the Hi-Res Mode button in the Lissajous Control window. Phase Torch This is a revolutionary tool which compares the phase difference between two channels as a function of frequency, independent of power. The display looks like a multicolored fountain or torch. The graphing scheme is a polar pattern. The radius from the center is determined by the frequency


50 50 SpectraFoo User Manual and the angle is determined by the phase difference between the left and right channels. The center of the graph represents DC while the outer radius represents the Nyquist value. In order to help you intuitively identify the frequencies, the phase points are also colored according to their frequency. You can get a color frequency calibration chart by clicking on the Phase Torch s parameter control button, and viewing the relationship between the Power Threshold s power scale and the frequency range in the color bar. A mono (in-phase) signal is indicated by what looks like a torch precisely aligned with the Y axis of the scope. The in-phase torch illustrated below fuzzes-out at high-frequencies because the signal used to create the display did not have very much high frequency energy so the display is dominated by noise at high frequencies. An out of polarity signal appears as a negative version of a mono signal. Delays appear as spirals within the scope. Phase Torch This meter is very useful when recording a musical instrument with multiple microphones. You can use the Phase Torch to identify the frequency ranges in which phase cancellations are occurring as a result of the comb filter created by the use of multiple mics on a single source. Phase points that are oriented on the negative Y axis of the meter represent the null

51 SpectraFoo User Manual 51 points of the comb filter. This can help set up multiple microphone placements that create nulls which are outside of the critical frequency range of the instrument you are recording. The Phase Torch can can also be used as a very quick and elegant troubleshooting tool for identifying phase anomalies in studio wiring. If you suspect a phase compensation or delay problem between multiple audio paths in your studio, simply run a common signal into two paths and route one to SpectraFoo s left input and the other to its right input. If a phase problem exists, the Phase Torch will display it immediately. The Phase Torch is also effective for a number of other applications including: Setting azimuth on analog tape recorders Checking for time alignment in complex PA systems Identifying frequency dependent phase and polarity problems (such as an out of polarity high frequency driver in a sound reinforcement system). Frequency sensitive mono compatibility analysis The Phase Torch controls window has a threshold slider which allows you to set a level threshold for the meter. Phase Torch Control window In the past, the display in the Phase Torch had an infinite dynamic range. This was useful for some applications (e.g. looking at phase dispersion in noise and dither and detecting dither in processes when there is no signal present). Unfortunately it could also make the Phase Torch difficult to interpret. The Power Threshold slider allows you to limit the dynamic range of the instrument. Only the phase points with a RMS power level that is greater than the specified threshold are displayed.


52 52 SpectraFoo User Manual Phase Torch with threshold at -60dB Phase Torch Full Range Band Power History This instrument allows you to see the history of the amount of power in a specified band of the spectrum. The instrument s details window allows you to set the center frequency and the bandwidth of the power band that you are interested in monitoring. The preset values for this instrument are 1/12 of an octave at 6kHz. This allows it to function as a very effective sibilance meter. Band Power History Timecode Clock The timecode clock can lock to external timecode sources such as tape machines with SMPTE, the Alesis BRC, Tascam SY88, and MOTU MTP AV or any other device capable of producing MIDI Time Code. In addi-
53 SpectraFoo User Manual 53 tion, the clock can lock to the computer s internal clock or the computer s CD drive.you can select between the different timecode sources by clicking on the radio buttons under the timecode readout. The format of the timecode readout is the standard SMPTE HH:MM:SS.FF. SpectraFoo will reference all recorded captures to timecode. Timecode Clock Correlation Meter SpectraFoo s Correlation meter is a standard tool for reducing the complex relative phase information between two channels to a single number between -1 and 1. Correlation is a measure of how well two signals line up with each other. When two signals have a correlation of +1, they are the same signal. Similarly, when two signals have a correlation of -1, one is the inverse (opposite polarity copy) of the other. When two signals are unrelated to each other, they have a correlation of 0. Mathematically, the correlation is the average of the sign (e.g. + or -) of product of the two signals. The SpectraFoo version of the correlation meter has a relatively fast averaging time to give you a clear picture of the correlation at any given time. To understand how the correlation is changing over time, you can use the Correlation History meter. Vertical Correlation Meter Horizontal Correlation Meter As with the Level Meters, the Correlation meter can be put into a verti-
 Correlation History Meter The Correlation history meter provides you with a time history of the correlation meter.")

54 54 SpectraFoo User Manual cal or horizontal orientation to meet your tastes. When the meter is in a vertical configuration it can be docked to the left side of the Correlation history meter. ( See Docked Correlation & History ) Correlation History Meter The Correlation history meter provides you with a time history of the correlation meter. This allows you to see how the correlation evolves over time and can help you to track down specific phase problems by allowing you to see blips in the phase-correlation at the same time you hear the events that cause the blips. For example, if the correlation dips every time the snare drum hits, it is very likely that the channels that contain the snare are causing the problem. Maybe you need to time align the snare mic with the overheads, or maybe that return on the bussed compressor needs some delay compensation. Other tools in Foo (like the Phase Torch) can help you track down the solution to the problem. The Correlation Meter and the Correlation History Meter can help you find the problem. Correlation History Docked Correlation & History The centerline on the Correlation History Meter corresponds to a correlation of 0 while the top edge corresponds to +1 and the bottom to -1, respectively. The Correlation Meter in its vertical orientation can be docked to the left side of the Correlation History Meter, providing both instantaneous and historical data in one composite instrument. Code Meter The Code Meter is the first of three sample code metering tools included in SpectraFoo Complete. Along with the Code Matrix Meter and the
55 SpectraFoo User Manual 55 Code List Meter, they provide a comprehensive set of sample code metering tools that can show you the nitty-gritty details of your digital signal stream. These tools can be used to check for, among other things, DC- Offset, sample-word width, Stuck Bits, Codespace utilization, and padded clips. They can also be used for bit-clone testing and for looking at lowlevel structures like dither. 16 bit signal in the Code Meter The Code Meter displays the range of sample codes exercised in the assigned channel in each time slice. It shows the activity in each bit of the sample word and shows you which bits are being exercised. This can be used to tell, for example how wide the samples in the signal are. The example above is a 16 bit signal so only the 16 most significant bits (MSb) are being exercised. Code Matrix Meter The Code Matrix Meter is designed to work with 16-bit delivery media and only utilizes the top 16 bits of the samples in the signal. The meter takes the 16-bit samples and divides them into two groups: the most significant byte (MSB) which is the top 8 bits, and the least significant byte (LSB) which is the bottom 8 bits.
 and vertical (LSB) offsets into a 256x256 pixel matrix.")

56 56 SpectraFoo User Manual x y = x (signed) (unsigned) y = = Origin of Matrix (x,y) Definition of the offsets in the Bit Matrix Visual of the Bit Matrix For each sample these groups are then converted to horizontal (MSB) and vertical (LSB) offsets into a 256x256 pixel matrix. For each sample in the time-slice the corresponding pixel is turned-on: Instantaneous Snapshot of Bit Matrix Accumulation Snapshot of Bit Matrix The meter can be switched into an accumulation mode by clicking within the instrument. The accumulation mode does not erase the bit matrix with each new time-slice and this accumulates a picture of all of the sample codes that have been exercised by the signal. Normal program material will generate an accumulation that looks like the corresponding figure above. This snapshot shows us that while most of the codespace is exercised by the signal, the top 3dB or so is pretty sparse. This indicates that we could compress this signal with a pretty hard ratio and a 3dB threshold and introduce very little distortion.
 and can be used in designing and testing DSP algorithms. Code List Meter The Code List Meter displays a list of the codes of all of the samples in the time slice.")
57 SpectraFoo User Manual 57 Since the Code Matrix Meter shows you the utilization of the code space, it can help pinpoint problems with processing algorithms (e.g. skipped codes, etc.) and can be used in designing and testing DSP algorithms. Code List Meter The Code List Meter displays a list of the codes of all of the samples in the time slice. This allows you to see low-level activity in the signal, stuck bits, DC offsets and the like. When you resize this window, it attempts to create an equal number of equal length columns of samples; length of the column is determined by the height of the window and the width of the window is computed automatically the width that you set is ignored. Bit Scope Layout with 512 Sample Time Slice and 8 Columns Each time the display is updated, all of the samples in the time slice are shown. The number of samples in the time slice are determined by the I/O hardware s buffer size. For all of SpectraFoo s supported input hardware except the Sound Manager and the PCXPocket, the buffer size is 512 samples. For the Sound Manager and the PCXPocket, the size of the buffer depends on the machine being used and the version of the MacOS system software. The samples are displayed starting with the first sample in the time-slice in the upper left hand corner of the instrument. Each successive sample is place under the previous one until the bottom of the column is reached. The next sample is placed at the top of the next column. So, in the figure below the samples 1 64 are in column 1; are in column 2; and

58 58 SpectraFoo User Manual so on with samples in column 8. The layout of the bits in each sample are shown below: Bit Layout in Bit Scope Controlling Audio and Instruments When you first launch SpectraFoo, the Analyzer Control & Routing and the Master Controls windows will appear. The Analyzer Control & Routing window allows you to control the global properties of SpectraFoo s analysis engine. The Master Controls window allows you to add, delete and configure specific instruments.

59 SpectraFoo User Manual 59 The Master Controls window contains two types of items: Instrument Classes and Instrument Controllers. Instrument classes contain a disclosure arrow, the name of an instrument type such as spectragraph, level meter etc. and an add button. Instrument controllers contain (from left to right) a visibility checkbox, an on/off button, a solo button, a show details button, a channel assignment, and a remove button. In the picture above, the Real Time Rack item is an example of an Instrument Controller and the Spectragram item is an example of an Instrument Class. To the right of each instrument class is an add button. Clicking this button adds another instance of the particular instrument to the system and creates a new instrument controller item. Click on the show/hide checkbox of the new instrument controller item and a free standing resizable window will appear containing the selected instrument. Each instrument class can have many instances. You could, for example, create four Spectragraphs to monitor the left channel: one adjusted to monitor the entire audible spectrum, one zoomed in on low frequencies, another zoomed in on the midrange, and another focused on the high end. You could create another 4 instances set the same way but assigned to a different analyzer channel. Of course if you want the consolidated view provided by the virtual rack interface, simply click the show/hide icon for the Real Time Rack in the Master Controls window and SpectraFoo will create a consolidated two channel metering view. To remove an instance of an


60 60 SpectraFoo User Manual instrument click on its remove button in the Master Controls window. A dialog will appear as shown below: If you wish to avoid this dialog option-click the remove button in the Master Controls window. The instrument will be immediately removed. Channel assignment is controlled via the instrument's details window. The details window is accessed by clicking the show details button either the Master Controls window or in the instrument itself. in The Master Controls window allows you to have as much or as little analysis as you need. It also allows you to completely personalize your configuration. SpectraFoo remembers the configuration of windows and rack panels. After you have set up a personalized configuration, SpectraFoo will launch using that configuration until you make a change. You can also save and recall different window configurations by using Window Sets, which are covered later in this manual. You can hide and show the Master Controls window from the Window menu or by using a key command.
61 SpectraFoo User Manual 61 Analyzer Control & Routing Window The Analyzer Control & Routing window allows you to control SpectraFoo s global analyzer parameters and how signal is globally routed through the analysis system. SpectraFoo s analysis routing model has two layers for maximum flexibility. By selecting an audio input path from the Audio I/O menu s Configure Hardware selection you choose the audio hardware that SpectraFoo uses to acquire the audio streams to analyze. SpectraFoo uses an internal M-> N routing matrix to allocate each of the N analysis channels to any of the M inputs. Each of the SpectraFoo instruments has an internal routing control that allows you to select one of the analyzer channels to feed the instrument. This process is illustrated below: M Inputs Hardware Input Path N analyzer channels Routing Window Inst Inst Inst Inst Inst Inst Inst Inst
62 62 SpectraFoo User Manual Although it seems a bit complicated in practice it is very flexible and quite easy to use. Analyzer Channels In SpectraFoo there is a difference between analyzer channels and analysis instruments. In SpectraFoo you can have many different types of instruments monitoring the same channel as well as many different versions of the same instrument monitoring the same channel. You can also monitor multiple channels simultaneously. With the analyzer pop-up in the control and routing window you can set the number of channels you want to be able to monitor simultaneously. If you set the number of Analyzer Channels to 2 you will be able to actively monitor two channels from your input hardware at one time. However, the number of analyzer channels within SpectraFoo and the number of hardware channels are independent. The number of hardware channels depends on the hardware input path that you are using. Once you have selected an input path you can route from any of the hardware the analyzer channels the fly, without stopping the audio using the analyzer channels pop-ups in the Control and Routing window (this is described below). The number of channels you can analyze simultaneously is limited by the speed of your Macintosh. If you are using a fast computer you will be able to monitor 24 channels simultaneously with impressive update performance. If you are using a slower machine the update rate might appear sluggish. The default number of analyzer channels for SpectraFoo is two. This will work fine on PCI-based PowerPCs. SpectraFoo is fully qualified to run at all channel depths on all G3-based Macs and 8600/9600/300 machines. If you do not have one of these machines it does not mean that you cannot run SpectraFoo. It just means that your machine might not support 24 channels of simultaneous analysis. If you are interested in determining the upper limit of your computer s multichannel analysis capability you should start SpectraFoo at a non-
63 SpectraFoo User Manual 63 critical time and step up the channel depth from the 2 channel default setting to six channels then to 8 and so on. Of course it makes no sense to increase the number of analysis channels to be greater than the number of hardware channels that are available. Each time you change the analyzer depth, evaluate the performance of the analysis instruments. When the update of the instruments begins to get sluggish it is an indication that you are beginning to overtax your host processor. On some slower machines it is possible that 2 analyzer channels will be the maximum that is practical. Truthfully, there are probably very few situations in which you would want or need to be analyzing 24 channels at the same time. It s hard to concentrate on that much different information at the same time plus most people don t have the screen real estate to accommodate 24 simultaneous Spectrum Analyzers! It is nice however to be able to look at 4-8 channels at the same time. A four channel example would be to use two channels to monitor the main LR stereo mix and the other two channels to matrix switch on the fly between the individual channels of the mix. You could check out the kick drum and the bass for example to see if there was a masking effect inducing frequency overlaps that could be cured with EQ (remember you can pull up an EQ while continuing to monitor with SpectraFoo). Then you could switch to a stereo miked guitar and check out the phase relationship between the two channels, then switch to snare top and bottom etc. All of this matrix switching can be done without stopping playback. Adjusting the Number of Analyzer Channels You can adjust the number of channels of simultaneous analysis available in SpectraFoo. There is a small trade-off between the number of channels and overall system performance. The more channels of analysis that you have, the more the system is loaded down. For best performance leave the number of channels in the 4-8 region. If you have a need to analyze more channels, by all means do so, but don t set the number of analyzer channels to a large number arbitrarily... you will get better performance by selecting the number of channels that you actually need. To change the number of analysis channels, simply select the number you


64 64 SpectraFoo User Manual want from the # of Analyzer Channels popup menu in the upper right hand corner of the Analyzer Control & Routing window. SpectraFoo needs to restart in order to change the number of analysis channels. When you change the number of analyzer channels you will be presented with a dialog confirming that you want to restart SpectraFoo: If you hit Cancel the number of channels will return to its previous setting. If you click the Quit button SpectraFoo will quit. To restart it, double-click on the SpectraFoo application; SpectraFoo will restart with the newly selected number of analyzer channels. The number of analyzer channels is saved as a preference, so SpectraFoo will remember the number of analyzer channels each time it is started.
 but it tends to smear the high end in")
65 SpectraFoo User Manual 65 Changing the analysis depth You can change the number of samples that SpectraFoo uses in its FFT analysis. Increasing the number of points increases the frequency resolution of the analysis (it allows you to see narrower spectral features - especially on the low end) but it tends to smear the high end in time and can lead to a desynchronization of the audio from the analysis. Metric Halo recommends using either a 4096 pt or a 8192 pt FFT Analyzer depth for music production work. Changing the analyzer depth is simple. Just select the desired depth from the Analyzer popup menu in the upper left hand corner of the Analyzer Control & Routing window. This control is also available in the Analyzer menu. The change takes place automatically and instantly. Configuring the routing matrix Once you have selected your audio input path, you should configure the routing matrix to remove any ambiguity from the process of monitoring your audio. If your audio path is two-channel the default configuration is probably fine (Left Channel named Left, Right Channel named Right). If you are using a multi-channel input path, the first step is to name the input channels. SpectraFoo provides a mechanism for naming the input

66 66 SpectraFoo User Manual channels. To access this mechanism, simply click on the small lock icon on the lower left hand corner of the Analyzer Control & Routing window. The window will expand to show the M input channel names. It looks like this: You can type the proper input channel names into the edit text areas. The <tab> key will move the input focus to the next field. After you have named all of the channels that you are using, click the lock icon again. This will close the channel names and rename all of the channels within SpectraFoo. If you want to hide the list of channel names you can click on the Channel Names disclosure arrow and the window will shrink down. Now that your input channels are named and you have an easy way to refer to them, you need to route the channels that you want to analyze to the analyzer. This is accomplished with the routing portion of the Analyzer Control & Routing window. Each analyzer channel has a popup menu associated with it. This menu allows you to select the name of the input channel that you would like to send to the associated global analyzer channel.

67 SpectraFoo User Manual 67 The number of analyzer channels determine how many different channels you can analyze at once. If you need to analyze more channels at one time, see the section on changing the number of analysis channels. If you just want to quickly switch analysis to a different one of your input channels, use the analyzer channel popup menu. Note that you do not have to stop the transport to change the routing from within SpectraFoo. Each instrument in SpectraFoo is assigned an analyzer channel that it gets its analysis data from. The Active Channel popup menu in the control window of each instrument is used to select the instrument s source analyzer channel.

68 68 SpectraFoo User Manual Once you have assigned an input channel to an analyzer channel the input channel s name is propagated throughout SpectraFoo. So, as you see above, the channel names that appear in the instrument Active Channel popup menu are those of the input channels that have been associated with the analyzer channels. If you change the input channel associated with an analyzer channel, all of the instruments that are assigned to the analyzer channel will update automatically. This two-layer mechanism works extremely well when you have a large number of source tracks that you want to alternately apply the same type of analysis to. For example, lets say that you are mixing from a 24 track master. It is unlikely that you would need or even want to do spectrum, level and phase analysis on all 24 channels at once. But you may want to set up 4 clusters of instruments with each cluster assigned to a different analyzer channel. You can easily switch any cluster to any of the 24 master channels by using the analyzer routing control. Any of the channels is just a click of the mouse away.

69 SpectraFoo User Manual 69 Difference monitoring for all instruments The Analyzer can analyze the sum & difference of each pair of channels as well as analyzing each channel separately. This can be useful for a number of applications including looking at the comb filtering caused when a stereo pair is summed to mono. Figure 44: Sum/Difference pair modes menu To analyze the sum and difference of a pair of channels 1. If the Analyzer Control & Routing window is not visible, show the Analyzer Control & Routing window by selecting Show Routing Window from the Window menu. 2. Each pair of channels has an associated mode menu on the left side of the Analyzer Control & Routing window. Select + & - from the channel pair Mode pop-up menu. To analyze each channel in the pair separately: 1. If the Analyzer Control & Routing window is not visible, show the Analyzer Control & Routing window by selecting Show Routing Window from the Window menu. 2. Each pair of channels has an associated mode menu on the right side of the Analyzer Control & Routing window. Select Norm from the channel pair Mode pop-up menu.

70 70 SpectraFoo User Manual Physical Unit Calibration To change the physical unit calibration & clipping parameters in SpectraFoo: 1. Choose Level Calibration from the Analyzer menu. The following dialog will appear: Level Calibration Dialog 2. Enter the number of dbu or dbv that is output by your system s D/ A when it is driven by a full-scale signal. For Mobile I/O hardware the system outputs +24dBu at full scale, and Pro Tools generally outputs +18 dbu at full-scale. 3. This setting can also be determined by using the Signal Generator to generate a 0 db 1kHz sine wave. Run the signal out to your analog console or other hardware that will act as your studio calibration standard. Note the meter level on your calibration standard (this should be a peak reading meter). That is the value to enter into the Calibration dialog in the dbu field. Level calibrations will now match your calibration standard. The level calibration dialog also allows you to define what is considered a clip : 1. A clip is defined as a certain number of consecutive full scale samples. You can specify the number of full-scale samples in the calibration dialog. When the system detects the specified number of full-scale samples in a row, it will register a clip.
71 SpectraFoo User Manual A full-scale sample is defined as a sample that is within the specified number of Least Significant Bits (LSB) of digital full scale. Dither can confuse a clip detection algorithm that only looks for full-scale samples. This parameter allows you to specify a margin of error, 2-3 LSBs generally works well.
72 72 SpectraFoo User Manual SpectraFoo Workflow Features SpectraFoo has a suite of features integrated into the application to help you manage the workflow of utilizing the wide variety of tools included. Since there are so many instruments and parameters that may be controlled in the SpectraFoo metering system, and different engineers have different preferred methods of working, SpectraFoo provides comprehensive parameter management facitilies at many different levels in the application. The lowest level of parameter management is implemented with the pervasive link group mechanism. Link groups allow you to easily arrange to keep multiple instruments and their parameters linked together so that adjustements to one instrument are automatically reflected in all the instruments that are included in the same link group. Link groups also allow you to link instruments selectively only linking the desired parameters. The next higher level of parameter management is the parameter library management system. Each instrument type has a parameter library associated with it, and you can create your own parameter presets to store in the library. All presets are available to all instruments of the same type. This mechanism allows you to establish a set of customized settings for your favorite instruments. Window Sets The highest level of workflow management is provided by the Window Set system. Window Sets allow you to save all aspects of SpectraFoo s configuration including instrument visibility, position, settings, size, routing, etc. A window set also captures all of the system level configuration details, including analyzer depth, global routing and global preferences. Window sets are saved in the SpectraFoo preferences folder, and are accessed from the Window Sets menu. Each window set can also be assigned a key command for quick recall. Finally, you can specify what aspects of the saved configuration are recalled when you activate the window set. If you make a habit of saving window sets whenever you

73 SpectraFoo User Manual 73 create a useful instrument configuraton, you will rapidly increase the usefulness of SpectraFoo in your own work. Parameter Management System SpectraFoo provides a complete parameter storage and retrieval library mechanism for all instruments in the system. You can create named configurations for each of the various instruments and store them as presets. There are two ways to save and recall presets: 1. From the library pop-up in an instrument s Controls window. Accessing the library system from an instrument s controls window 2. From the Library pop-up that appears in the instrument itself when you click and hold the controls button. To access this popup, click the controls button and hold for about a half of a second. Alternatively, you can command-click the controls button to pop-up the menu immediately.

74 74 SpectraFoo User Manual Figure 2: Accessing the presets library popup from the controls button Modifications of parameter libraries can be cloned to create new libraries using the Save Parameters As... command. Window Sets SpectraFoo has a Window Set system which allows you to create and store your own personal instrument configurations. You can create a complete snapshot (meter positions, visibility, configuration, channel routing, etc.) of the entire state of the system and save it as a preset document. You can also assign a snapshot to a hot key for instant one-key access to various metering configurations. To create a window set: 1. First create an instrument configuration that you like. For example, you could make two Spectragraphs assigned to left and right channels, a Level Meter, a Lissajous scope, and a Phase Torch. 2. Arrange the instruments the way that you want them to appear on the screen and set each instrument s parameters to taste. 3. Choose Save Window Set As... from the Sets menu, a dialog will appear:
. 6.")
75 SpectraFoo User Manual 75 Window Sets Dialog 4. Name the Window Set, then press the <tab> key. 5. Choose a key command to recall the Window Set. This can be any key or group of keys you like. Be aware the software will allow you to set any key or command-key combination as the key command. Don t set a command that you would really like to use otherwise (like A, or <space>). 6. Select the attributes of the instrument configuration that you want to recall using the checkboxes, and click OK. The snapshot will automatically save all information. You can now recall the window set with the command key you specified. To change what parameters are recalled after a window set has been created: 1. Select the window set that you would like to modify from the Sets menu (or type its command key). 2. Choose Rename Current Window Set from the Sets menu. A window set dialog will appear. 3. Select which types of parameters you want to be recalled. You can also change the name of the window set and the command key at this time. Click OK to save your changes.
76 76 SpectraFoo User Manual Link groups SpectraFoo provides a flexible linking system to allow you to keep all of the parameters associated with a group of instruments linked. You can use this feature to link the settings of a stereo pair (or surround group) of instruments as well as synchronizing the settings of different types of meters on the same channel. Grouping System Parameter Passing The grouping system allows you associate any number of instruments with any of the groups. Each instrument may be simultaneously associated with as many groups as needed. When an instrument that is attached to a link group (e.g. Spectragraph 1 in the figure above) has a parameter changed in its control window, it sends the parameter change to all of the groups to which it belongs (e.g. Group 1 for Spectragraph 1; both Groups 1 & 2 for Spectragraph 2, etc.). If the parameter is one that has been enabled in the group, it is passed to all of the instruments that are linked to the group. The figure above shows a parameter sent from Spectragraph 1 to Group 1. Group 1 forwards the parameter change to Spectragraph 2 and Spectragraph 3. Since Spectragraph 4 is not a member of the link group, it does not receive the parameter update. If Spectragraph 2 originated the parameter change and both Group 1 and Group 2 were enabled for the parameter, all of the Spectragraphs illus-


77 SpectraFoo User Manual 77 trated above would receive the parameter update. There are 32 link groups available in the system. They are all installed and enabled in the software as it ships. You can rename the groups to indicate what information they use for linking. You can also control what types of parameters are linked by the group. Instruments can be added and removed from any or all of the groups at will. To name and control which parameters are linked by a group: 1. Select Show Link Groups Window from the Sets menu. The Link Groups Window will appear: Link Groups Window Link Group Edit Window 2. Double-click the group you want to edit. The Link Groups Edit Window will appear. 3. Type the new name for the group. 4. The scrolling list in the window lists all of the available parameters in the system (only parameters for instruments that have been instantiated will appear). Each parameter has an associated checkbox that indicates whether that parameter will be distributed to other instruments in the group. To disable a parameter, unselect its associated checkbox. To disable all of the parameters select Disable All Parameters from the window s mini-menu. Conversely, to enable all of the parameters select Enable All Parameters from the window s mini-menu. 5. Close the Link Group Edit Window when you are done making changes.

78 78 SpectraFoo User Manual To disable a group: 1. If the Link Groups Window is not visible, Select Show Link Groups Window from the Sets menu. 2. Unselect the group s associated enable checkbox. To enable a group: 1. If the Link Groups Window is not visible, Select Show Link Groups Window from the Sets menu. 2. Select the group s associated enable checkbox. To choose which groups an instrument belongs to: 1. Display the instrument controls for the instrument that you want to link. Groups pop-up Menu 2. Each instrument control window has a Groups pop-up menu in the upper right hand corner. To add the instrument to a group, select the group name in the Groups pop-up menu. To remove the instrument from a group, unselect the group name in the Groups pop-up menu. Selecting a group in the Groups Pop-up menu

79 SpectraFoo User Manual 79 Signal Generator SpectraFoo Complete has a high-resolution multi-tone, multi-noise, sweepable, burstable signal generator. The generator is capable of running in real-time, or alternatively striping signal into a capture or into an AIFF or SDII file. This release of the signal generator creates very high quality signals, but it has not been optimized, either in computational speed or in interface. This means that it takes a pretty significant amount of CPU power to run in real-time. It can always create striped captures or files. The interface to the signal generator is numerical, which makes it very precise, but somewhat difficult to understand at first. This release of the signal generator does not always do the right thing when you change the parameters while the generator is running. Stopping and starting the generator will make it generate the proper signal. The primary expected operational mode of the generator is using the system s sweeps to automate the signal parameters. Signal Generator Control Window
80 80 SpectraFoo User Manual 9 sweepable sine waves This implementation of the Signal Generator supports up to 9 simultaneous sine sweeps at a time. Each sweep is controlled with a cluster of parameters: Sine-Sweep Parameter Cluster 1. Sine Enable checkbox. Checking this box turns the corresponding sweep on in the signal generator. 2. Start Frequency edit-text box. The frequency entered in this box is the frequency of the start of the sweep. This frequency can be any positive value (fractional or integer). If the frequency entered is negative, it will be treated as positive. 3. Start Level edit-text box. The level entered into this box is used as the starting level of the sweep. This level is in units of dbfs and may be positive or negative. 4. Start Phase edit-text box. The phase entered into this box is used as the start phase of the signal. The phase is in units of degrees and may be positive or negative. 5. End Frequency edit-text box. The frequency entered in this box is the frequency of the end of the sweep. This frequency can be any positive value (fractional or integer). If the frequency entered is negative, it will be treated as positive. An entry of * means use the start value. 6. End Level edit-text box. The level entered into this box is used as the ending level of the sweep. This level is in units of dbfs and may be positive or negative. An entry of * means use the start value.
81 SpectraFoo User Manual Pre-Delay edit-text box. The Pre-Delay time is the period of time that will elapse before the sweep starts. 8. Duration edit-text box. The Duration is the period of time that will elapse between the start and end of the sweep. 9. Post-Delay edit-text box. The Post-Delay time is the period of time that will elapse after the end of the sweep before the sweep loops around. Each sweep in the generator loops after the pre-delay, duration, and postdelay time has elapsed. The parameters sweep over the duration only. So, if the pre-delay is 1 second, the post-delay is 1 second and the duration is 10 seconds, the total loop time is 12 seconds. The generator has two sweep modes. The sweep mode is a global property of the signal generator (the same mode is used for all sweeps). You can set the mode for the generator with the sweep mode radio buttons: Figure 65: Sweep mode radio buttons 1. The Lin button selects a linear parameter sweep. With a linear sweep the sweepable parameters (Power and Frequency) change at a uniform rate. As an example, if the start frequency is 100 Hz; the end frequency is 1100 Hz and the sweep time is 10 seconds, the frequency will increase by 100 Hz every second. 2. The Log button selects a exponential parameter sweep. With an exponential sweep the sweepable parameters (Power and Frequency) change at an increasing rate. This sort of sweep changes the frequency a uniform number of octaves per second and the level a uniform number of db per second. As an example, if the start frequency is 100 Hz; the end frequency is 200 Hz and the sweep time is 2 seconds, the frequency will increase by 1/2 octave every second.
82 82 SpectraFoo User Manual ADDITIVE WHITE NOISE WITH SWEEPABLE LEVEL In addition to the swept sine generators, the signal generator also provides additive white noise. The white-noise generated by SpectraFoo has a uniform level pdf (probability distribution function) and a uniform frequency pdf. This means that all sample values are equally likely and all frequencies are equally likely. The parameters for the white noise generator are: White Noise Parameter Cluster 1. Enable checkbox. Checking this turns on the additive white noise. 2. Start Level edit-text box. The peak level of the white noise at the start of the sweep. This level is in units of dbfs and may be positive or negative. 3. End Level edit-text box. The level entered into this box is used as the ending level of the sweep. This level is in units of dbfs and may be positive or negative. An entry of * means use the start value. 4. Pre-Delay edit-text box. The Pre-Delay time is the period of time that will elapse before the sweep starts. 5. Duration edit-text box. The Duration is the period of time that will elapse between the start and end of the sweep. 6. Post-Delay edit-text box. The Post-Delay time is the period of time that will elapse after the end of the sweep before the sweep loops around. Additive pink noise with sweepable level The signal generator also provides additive pink noise. The pink noise generated by SpectraFoo is 1/f noise with a low frequency roll-off. This means that above 30Hz the frequency distribution of the noise has equalpower per octave. The controls for the pink noise generator are:
83 SpectraFoo User Manual 83 Pink Noise Parameter Cluster 1. Enable checkbox. Checking this turns on the additive pink noise. 2. Start Level edit-text box. The peak level of the pink noise at the start of the sweep. This level is in units of dbfs and may be positive or negative. 3. End Level edit-text box. The level entered into this box is used as the ending level of the sweep. This level is in units of dbfs and may be positive or negative. An entry of * means use the start value. 4. Pre-Delay edit-text box. The Pre-Delay time is the period of time that will elapse before the sweep starts. 5. Duration edit-text box. The Duration is the period of time that will elapse between the start and end of the sweep. 6. Post-Delay edit-text box. The Post-Delay time is the period of time that will elapse after the end of the sweep before the sweep loops around. Dither & Quantization You can control the quantization and dither used by the signal generator in the generation of the signals. The generator provides for quantization from 2 bits per sample to 24 bits per sample. Quantization is always active and the signal will be truncated to the number of bits specified in the Sample Size edit-text box. Quantization and Dither controls When the Dither button is checked, the signal generator will dither the signal before truncation. Dithering replaces distortion with uncorre-

84 84 SpectraFoo User Manual lated noise. The dither in SpectraFoo is noise shaped which causes the noise floor to decrease with decreasing frequency. This has the effect of decreasing the noise where it is most audible while still removing the distortion caused by quantization. Dithered 16 bit signal FFT SYNCHRONIZATION Each of the frequencies of the generated signals can be synchronized to the analyzer width, allowing you to generate test tones that can be analyzed with no FFT windowing for the best level accuracy. Figure 70: Synchronization Controls

85 SpectraFoo User Manual 85 Synchronization is enabled by checking the Synchronize checkbox. When synchronization is turned on the generator will not sweep the sine parameters it will only use the parameters entered in the start column. The parameters for the two noise sources will continue to sweep. If you have turned on synchronization you can select the Rectangular window for the system analyzer. This window will allow the analyzer to recognize that the synchronized sines fit exactly into one analyzer spectral line. To select the rectangular analyzer window: 1. If the FFT Window window is not visible, make it visible using the Show FFT Window Control command from the Window menu. Figure 71: Selecting the Rectangular window from the FFT Window library 2. Choose Rectangular Window from the Window Library popup menu. Now the analyzer will use the rectangular window for all future analysis. This will provide single spectral line analysis for synchronized sines. Switch the window back to Hanning, Hamming or Blackman before you begin analyzing music or unsynchronized tones. Windowed Bursts You can burst the generated signal using the burst controls. You can specify the length of the burst in milliseconds and the period of burst repetition in seconds. You may also specify whether or not the burst is windowed. When you enable bursting, the underlying generated signal is passed for


86 86 SpectraFoo User Manual the period of time corresponding to the burst length and then cut off. The signal stays off for the time remaining in the burst period. It will then be passed again for the period of time corresponding to the burst length. Bursting Controls If the Window checkbox is checked, the burst is not abrupt, but is instead faded up and then faded out with a raised-cosine window. If you are bursting sines it is a good idea to use the window since it is possible to generate clicks if you do not have the window enabled. Figure 73: 1 second of 125 ms bursts every 1/4 of a second Figure 74: 1 second of 125 ms windowed bursts every 1/4 of a second Arbitrary signal sample rates You can tell the signal generator what the sample rate of the eventual output hardware will be. This is controlled with the Sample Rate edit-text box. All of the times and frequencies in the signal generator will be scaled relative to the generator sample rate. This can be used for special effects (e.g. generate a 88.2 khz signal and play it through 44.1 khz hardware) or to generate signals to be used on high-density hardware (like Sonic Solutions).
87 SpectraFoo User Manual 87 Building Files & Captures You can generate Signal Files or Captures directly from the signal generator. The buttons in the lower right hand corner of the signal generator are used to issue these commands: Figure 75: Signal generator control cluster The button in the far bottom right corner of the signal generator window controls the real-time generators and is labeled either Run or Stop. Pressing this key will toggle the run state of the real-time generator. The button labeled Capture will allow you to create a capture directly from the signal generator without having to loop the signal back. You can name the new capture and specify the length, in seconds, of the new capture. Note: All captures in the system are currently limited to 16 bits. To generate distortion-free captures, please ensure that you have the bitdepth of the signal generator to 16 bits or less and the dither is turned on. The button labeled File will create an audio file directly from the signal generator without having to loop the signal back. You can specify the name, bit-depth, file type (SDII or AIFF) and the length, in seconds, of the new file. The button labeled Save saves the current set of signal generator parameters to a signal generator parameter file. The button labeled Load loads a signal generator parameter file and resets the state of all of the signal generator parameters to those saved in the signal generator parameter file. While most of the functionality in the signal generator is straight forward, many unique sounds can be created through creative use of the parameters. A number of interesting sample signal generator parameter sets
88 88 SpectraFoo User Manual are available in the Signal Gen Parameters folder that is installed with SpectraFoo. These parameter sets illustrate some of the wide variety of sounds that can be created with the generator.

89 SpectraFoo User Manual 89 Controlling the FFT Window FFT Window Control Window The FFT assumes that the block of samples it is operating on is periodic. That is, it assumes that if the block of samples was to be repeated in a loop, it would form a smooth and continuous repeating waveform of some kind. Unfortunately, music is neither completely periodic nor completely random. If an FFT is performed on a group of samples taken from non periodic material, spurious data results from the discontinuity at the boundary between the last sample and the first sample of the block. Windowing helps to remove the spurious data by feathering the edges of the group of samples so that the group becomes periodic and continuous at the boundary.
90 90 SpectraFoo User Manual The FFT Window Control Window allows you to adjust the shape of the windowing function used in SpectraFoo s FFT analyzer. These adjustments can be done in real time, allowing you to see their effects as they happen. The Window Library popup menu allows you to select from a set of preconfigured FFT windows and it also allows you to save your own windows for recall.the FFT Window Control Window is accessed by using the Window Menu.
91 SpectraFoo User Manual 91 Capture and Storage SpectraFoo provides the ability to record selections of audio into the computer s RAM and perform incredibly detailed non-real time analysis. All captures are referenced to the timecode of the source material. Captures may be initiated manually or can be triggered automatically, either with a level based trigger or a time based trigger. The start and stop times for the most recent recording are retained and can be used to record material that occurs at the same time with respect to the external timecode source. You can use this to grab multiple aligned tracks of audio or to record the same audio with different types of processing. All recording is controlled and initiated with the Capture Control Window, found in the Window menu. There are three basic capture modes that you may use. You may select among these modes by clicking the appropriate radio button. 1. Manual Use manual mode to record on the fly. Click the record button to start recording and click it again to stop recording. 2. Timecode-based auto punch Use timecode-based auto punch to record a segment of audio that starts at a particular time and ends at another time. This is like the auto punch feature of many tape decks. Simply type the start and end times into the punch in and punch out fields and click the Record button. SpectraFoo will arm its autopunch mechanism and wait until the timecode clock matches the punch in time. It will then record until the timecode clock matches the punch out time, and automatically stop. 3. Level-based auto punch. Use level-based auto punch to start and stop recording based on the volume of the audio being monitored. This is great for capturing individual drum beats or for capturing entire songs. A specific example of the usefulness of level-based captures is when you are trying to determine the optimal placement of microphones on a drum kit. When coupled with the Auto Arm feature, level based punches can be used to capture individual drum beats in a hands free way, allowing you to devote your attention to placing the mic, while still benefiting from

92 92 SpectraFoo User Manual SpectraFoo s analysis. All captures are retained in RAM to assure the highest processing speed and complete random accessibility. A list of the captures that are currently available is maintained in the Capture List Window, found within the Window menu. The Capture List maintains a library of the captures that are currently loaded into RAM. Clicking on a capture name selects it. Double clicking on a capture in this list opens a Capture Overview window which will be described later. The Capture List window behaves like a standard Macintosh list. You can use the shift and command keys to make multiple selections. If you have multiple captures selected and double click, a Capture Overview window will open for each selection.

93 SpectraFoo User Manual 93 Capture List Window Captures can be saved to disk as AIFF files and SpectraFoo can import AIFF files as captures using the commands in the Capture menu. Capture Overview Windows The recorded information can be further analyzed and manipulated via the Capture Overview windows. Captures can be removed from memory to reclaim the space for more recordings. The total length of captured material is limited only by the amount of RAM in your system. Once you have opened a Capture Overview window by double-clicking on one of your captures in the capture list window, you can examine various timecode-locked historical representations of the capture, including the envelope, the power balance, the peak and average level, and the spectral power history. You can slice the capture at any instant of time to display the instrument analysis of the signal at that instant in all of the real time instruments.


94 94 SpectraFoo User Manual An Overview of the Overview Numeric Time Selector Bar Each time field in the Capture Overview Window can display its value in several different themes. Hold the command key down and click on any of the time readout fields to access the popup menu.

95 SpectraFoo User Manual 95 Analyzing Musical Structure with the Spectral History Ribbon
. During replay, you may loop the signal and also analyze it.")
96 96 SpectraFoo User Manual Creating playback loops in an Overview Window In addition to analyzing captured signals, you can replay the captured signal throughout one of the system s audio out paths (e.g. the built in line out, or the digital out of a high-quality audio interface or card). During replay, you may loop the signal and also analyze it. Looping and other playback functions are accessed by clicking on a multi-state button (see illustration above). One way that you may find this to be useful is in working on getting a mix sound for short-lived passages like tom tom fills. By re patching SpectraFoo s output into the appropriate input channels on your mixing console, you can work on compression, equalization, reverb, etc. while looping the source signal, all with an instantaneous return to
97 SpectraFoo User Manual 97 the beginning of your loop and without any wear and tear on your multitrack master tape or your deck s transport. Automatic assembly of Split Stereo files SpectraFoo can read split-stereo SDII and AIFF files if they conform to a specific format. If the files meet the expected format, they will automatically be assembled into a stereo capture. Format: 1. Both files or the pair must be of the same type. 2. Both files must be mono sound files. 3. Both files must be in the same folder. 4. Both files must have the same name with the exception that one filename ends in L and the other in R. If the files do not match these criteria, they will not be automatically opened and reassembled. SpectraFoo will not prompt for the location of the second channel of the pair if it is not found automatically.
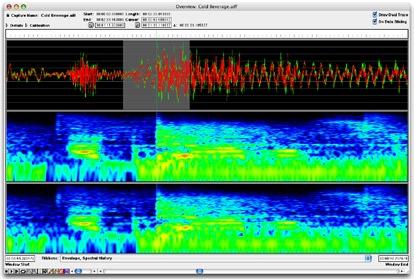
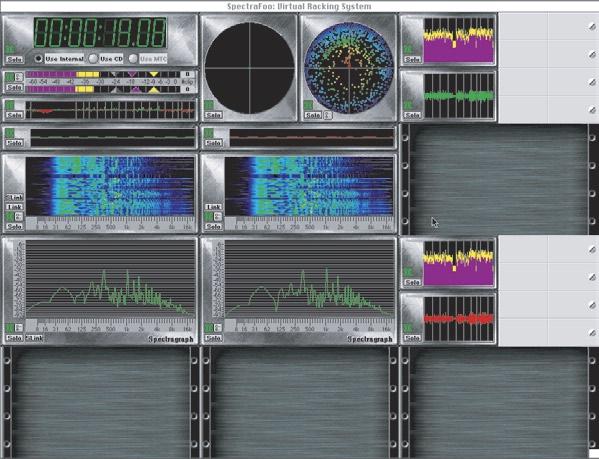
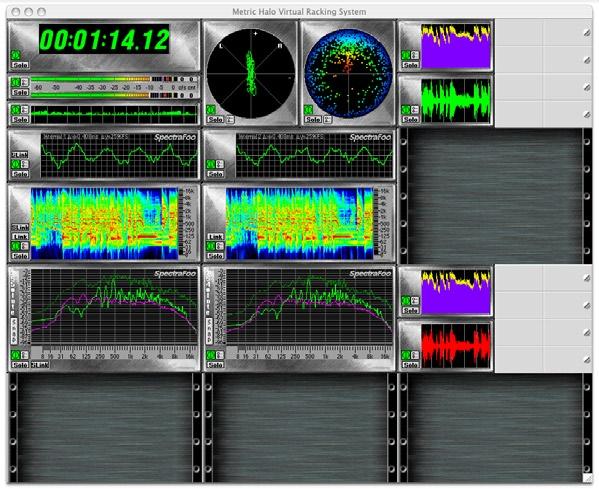
98 98 SpectraFoo User Manual
99 SpectraFoo User Manual 99 The Transfer Function For live sound, equipment testing, or any application where you need to analyze the characteristics of acoustical and electrical audio systems, SpectraFoo provides Music Based Measurement (MBM ). SpectraFoo uses a transfer function display to show you the relative power and phase response between the left and right channels. The transfer function display assumes that the signal connected to the computer s right input is a source signal and the signal connected to the left input is a response signal. SpectraFoo Signal Arrangement for MBM Transfer Function When the source signal is the input to some audio processing arrangement and the response signal is the measured output of the system, you can use music as your test tone. SpectraFoo uses the source signal as a point of reference and the transfer function display shows the differences in amplitude and phase between the source and response as function of frequency. This allows you to measure the properties of audio processing systems, including systems that contain acoustic elements. You can determine the amplitude and phase response of an equalizer in the presence of musical signal as easily as measuring the sound coloration of an acoustic space. The transfer function really only makes sense when the source signal is
100 100 SpectraFoo User Manual the input to some audio processing arrangement and the response signal is the measured output of the system. It does not generally make sense if the the source and response are truly unrelated, as in the case of the two channels of a stereo mix (in this case meaning a multi track mix, with panned elements, as opposed to a true stereo program, such as an X Y recording). Even in the case of a stereo mix, the transfer function may provide some information about the spectral balance of the recording, but, in general, the spectral balance is not constant in time. Even when the source and response signals are related, they usually will not be time-aligned. For example, if you are measuring the room response of an auditorium, there will be the speed of sound acoustic delay between the source signal and the response signal received at the measurement microphone. In order to properly measure the power and phase of the response signal relative to the source signal, the source signal must be delayed to time-align it with the response signal. SpectraFoo provides a delay detection feature that is accessed via the Compute Delay button present in the Transfer Function window. The delay finder records a segment of both signals and computes the correlation of the signals with each other. By moving the cursor to the largest correlation of the two signals, you set the system delay and compensate for the measurement delay, time aligning the two signals. Now the transfer function measurements will be accurate.


101 SpectraFoo User Manual 101 Transfer Function of a Room Response with a time delay

102 102 SpectraFoo User Manual Time Aligning the measurement with the Delay Finder Window Transfer Function after the measurement has been time-aligned The parameter controls for the Transfer Function are accessible from within the Details window of the Transfer Function. This is consistent with the operation of all other SpectraFoo instruments. The Transfer Function details window is accessed by clicking on the show details button in the Transfer Function window or in the Master Controls window. In addition, the Transfer Function now has a solo button and an on/off button. Coherence The Transfer Function window has a Coherence trace which is displayed as a red trace in the power vs. frequency display. Coherence has a value of 0 when the trace is at the bottom of the display and has a value of 1 when
103 SpectraFoo User Manual 103 the trace is at the top of the display and varies linearly in between. Coherence is a measure of how well the response signal correlates with the source signal. When Coherence is at its maximum value of 1 for a given frequency band, the source and response are perfectly correlated and the Transfer Function is completely uncontaminated by noise. When Coherence is at its minimum value of 0 for a given frequency band, there is no correlation between the source and response and the measurement in this frequency band is invalid. Coherence can be used as a guide to determine which frequency bands are equalizable. Frequency bands for which Coherence is low cannot be corrected by equalization. Frequency bands for which Coherence is high are equalizable. The Transfer Function Window The Transfer Function system provides all the tools necessary to make high quality measurements of simple systems and will allow you to easily measure and correct small-scale sound reproduction systems like control-room monitors, home theaters, and small club sound reinforcement systems. The transfer function environment is contained in the Transfer Function window. There is only one Transfer Function window in the system. It can be shown, like any other instrument in the system, using the Master Controls window. The control item for the Transfer Function appears as the second item in the list in the Master Controls window. The Transfer Function has a small number of controls in the main window: 1. Power vs. Frequency disclosure button When this control is set to disclosed (arrow pointing down) the Power vs. Frequency data panel is visible. To hide the Power vs. Frequency data panel, set this control to undisclosed (arrow pointing right). 2. Phase vs. Frequency disclosure button When this control is set to disclosed the Phase vs. Frequency
104 104 SpectraFoo User Manual data panel is visible. To hide the Phase vs. Frequency data panel, set this control to undisclosed. 3. Instrument Enable button This is the button with the IEC power symbol. When this button is On (filled with green), the Transfer Function is running. 4. Solo button When this button is On (filled with red) the Transfer Function is soloed. 5. Show Controls button This is the button between Solo and Take Snapshot. Clicking on this button opens the Transfer Function Control window. The Transfer Function Control window provides all of the detailed controls used to adjust the display of the transfer function. <control>-clicking this button pops-up a menu that allows you to select the Source channel for the Transfer Function. <option>-clicking this button pops-up a menu that allows you to select the Response channel for the Transfer Function. <command>-clicking or clicking and holding this button pops-up the parameter library menu for the Transfer Function. 6. Take Snapshot button Clicking on this button takes a snapshot of the current Transfer Function data and adds it to the Transfer Function Snapshots window. You can use Transfer Function snapshots for a number of measurement and comparison tasks. These are described in greater detail later. 7. Overlay List button Clicking on this button shows the Transfer Function Snapshots window. 8. Clear Data button Clicking on this button clears the current transfer function data and resets the transfer function to flat. This is useful when you start measuring a new system or device or move a test microphone and you want to start the measurement from scratch.
. The horizontal calibration is in units of frequency (Hz).")
105 SpectraFoo User Manual 105 The Transfer Function data is displayed in two different panels: Power Panel The power panel displays the relative power between the response signal and the source signal as a function of frequency. The relative power curve is drawn in green. The vertical calibration is in units of dbr (decibels relative). The horizontal calibration is in units of frequency (Hz). The limits of both the vertical and horizontal scales are controlled with the Transfer Function control window. The power panel also displays the coherence of the measurement as a function of frequency. The coherence curve is displayed in red. The vertical scale of the coherence is linearly scaled. The vertical limits of the coherence (which are not displayed) are 0 at the bottom of the graph and 1 at the top of the graph. These limits do not change when you change the power limits. Phase Panel The phase panel shows the relative phase between the response and source signals. The vertical scale of the phase panel is linear and is in units of degrees. Since phase is cyclic (that is, if the phase of a signal is x then x+360 is the same phase), the phase curve can wrap around from 180 to You can see this in the graph above at f = 2kHz. The
106 106 SpectraFoo User Manual phase does not really have a discontinuity at 2kHz, it has just wrapped around to The horizontal calibration is in units of frequency (Hz). The limits of the horizontal scale are controlled with the transfer function control window. UNDERSTANDING THE TRANSFER FUNCTION The purpose of the transfer function measurement is to allow you to find out what a particular electro-acoustical system is doing to the signal it is processing. We call the system being measured the System Under Test (SUT also called DUT in other literature). The SUT could be as simple as an equalizer or as complex as a multi-zone sound reproduction system coupled with a measurement microphone (or many measurement microphones, for that matter). The key thing to understand is that every system changes the signal that runs through it. An example of a simple measurement is finding the transfer function of a parametric equalizer. To make this measurement we would hook the equalizer up like this: Simple Measurement setup The signal source could be any source as long as it provides energy in the frequency bands that we are interested in. If we wanted to measure the response of the equalizer from 20Hz to 20kHz, a simple 1kHz sine wave would not be appropriate. Good source signals are: 1. Broadband musical sources. These sources have the advantage that they exercise the SUT in a way that is consistent with the way that we expect to use the SUT.
107 SpectraFoo User Manual Pink Noise. Pink noise has the benefit that, on average, it has a power spectrum that is consistent with most musical program material. It also ensures that the entire audible bandwidth will be exercised. Pink noise can be annoying when played over a Sound Reinforcement system, but should not damage any system components (e.g. high-frequency drivers). 3. White Noise. White noise does not really match the characteristics of music but it does have a uniform density of energy in the entire audio band. It can be used for testing electronic components but is very annoying when used in acoustic testing. You also run the risk of damaging high-frequency drivers if you play white noise through a sound reinforcement system at high SPL. 4. Swept sines. A sine sweep that covers the audio band to be tested will allow you to make an extremely precise, highly noise-rejecting measurement. Swept sines do not bear any resemblance to actual musical signals, can be really annoying when used for acoustic testing, and do not allow you to compare what the transfer function is telling you to what you are hearing, but they do allow you to make very accurate measurements in noisy environments. You can use this type of source signal when you have to test a system while other aspects of a venue are still being set-up. SpectraFoo s Transfer Function Measurement system needs to see both the source signal and the response signal to build the transfer function. The measurement created is a differential measurement and removes all of the common elements of the measurement path. You can use an external signal (like music from a CD or DAT player), a SpectraFoo capture, or SpectraFoo s built-in signal generator as the signal source. SpectraFoo provides an internal loopback path for capture playback and the internal signal generator, so you can route the internal signal source back to the transfer function without using one of your A/D channels.! If you do use the loopback path, your system s digital
108 108 SpectraFoo User Manual to analog and analog to digital converters (D/A/D path) are not common to both the source and the response signal. If the frequency response of the D/A/D path is not perfectly flat (in both phase and power) its response will color the measured response. You can easily measure your D/A/D chain by looping back your system s analog output directly into it s analog input. Make a measurement using the internally looped-back signal generator as the source and the system s analog input as the response. The measured transfer function is the response of your D/A/D chain. Setup for checking your D/A/D chain If the response is sufficiently flat, you can use the internal loopback method. If it is not, then you must use an external loopback of the source as the source for the transfer function (since this will remove the D/A/D chain from the measurement). One of the strengths of SpectraFoo s Transfer Function Measurement system is that it allows you to do Music-Based Measurement (MBM). This means that the system can automatically apply a threshold to the source signal to make sure that it is only measuring the response when the source is actually stimulating the SUT. MBM allows you to make accurate transfer function measurements even when the source signal is not stationary (like music) and when the signal comes and goes in various frequency bands (like music). MBM builds the transfer function up over time. In order to be able to create an accurate measurement of the system response when the test signal is non-stationary, the response signal and the source signal have to be synchronized in time. If the signals are not synchronized the relative measurement of response will be wrong. For stationary signals (like pink and white noise), even if the source and response are somewhat unsynchronized the power measurement will be pretty good, but the phase measurement is useless.
109 SpectraFoo User Manual 109 Acoustic test setup Under normal circumstances the response signal will always be delayed from the source signal. Sometimes this delay can be very short (for example, if the signal source is external and the SUT is analog and contains no acoustic elements, the delay can be less than a sample). If the SUT contains acoustic elements (like a speaker), there is always the acoustic propagation delay. In any case, the delay must be compensated to achieve an accurate measurement. When we make a typical acoustic measurement we are measuring all of the elements that are not common between the source path and the response path. In the case illustrated above, the speaker, speaker amplifier, acoustic space, measurement microphone, and preamp are not common. The amplifier, speaker and acoustic space are the elements that we want to measure. The microphone and preamp are not. In order to eliminate the pre-amp from the measurement we can pass the source signal through the same type of preamp or we can use a preamp that is flat (the LAB preamps from Earthworks are good for this purpose). We cannot eliminate the effect of the microphone, but we can reduce it by using a quality measurement microphone. Once again, Earthworks comes to the rescue with relatively inexpensive, high quality (flat from 9Hz to 30kHz) measurement mics.


110 110 SpectraFoo User Manual When we start the transfer function using the setup shown in the figure above, we get a measurement that looks like this: Transfer function without delay compensation Since this measurement was made with the microphone close to the speaker, the acoustic delay is short. As a result the power measurement is reasonably accurate and the coherence is near 1 for most of the audio bandwidth. The phase, however looks kind of like a sawtooth. This indicates that there is a time delay between the source and the response. If the time delay was larger, the phase would be a sort of random line with values near zero and the coherence would be 0 or close to zero for the entire audio bandwidth. Basically, we need to time align the signals. SpectraFoo provides internal delay compensation to allow you to time align the source and response signals. To accomplish this, you use the Delay Finder. The Delay Finder is accessed from the Transfer Function Control window. To time align the source and response signals: 1. If the Transfer Function Control window is not visible, open it by clicking on the Show Controls button in the Transfer Function window. The Transfer Function Control window will appear:

111 SpectraFoo User Manual 111 Transfer Function Controls Window 2. Click the Compute Delay button. The Delay Finder window will appear: Delay Finder window 3. The Delay Finder will automatically find the compensation delay and internally compensate the source signal. The Delay Finder records 1.5 seconds of the source and response signal and computes the impulse response of the SUT. The impulse response of a system is the signal that would come out of the SUT if you fed in an impulse. An impulse is sort of like a clap or a snap, but with an infinitely short duration of time. The impulse response of a perfect wire is a spike (the impulse) offset by the propagation delay through the wire.
112 112 SpectraFoo User Manual For a real acoustic SUT, the impulse response will not be as simple as a spike. The time delay (lag) of the maximum value of the impulse response is, in general, the delay time of the SUT. If the SUT is acoustic, we expect to see a number of smaller copies of the impulse response at different lags. These copies correspond to acoustic reflections from walls, desks, etc. If the SUT is time aligned, the impulse response will be relatively compact. The impulse shown in the Delay Finder Window figure above is of a small professional PA speaker. The small dip in the impulse response that occurs before the main impulse corresponds to the start of the impulse response of the low-frequency driver. The larger spike is the start of the impulse response of the high-frequency driver. The speaker is not fully time-aligned. As a result, we will not be able to fully time-align the measurement.! SpectraFoo s internal compensation can delay the source signal by up to 1.5 seconds. This corresponds to an acoustic delay of almost 6 football fields (at standard temperature and pressure), and should be sufficient for most work. If you need to compensate a larger delay, you will have to use an external delay line. The Delay Finder automatically finds the lag at the maximum value of the impulse response and uses that time delay to set the internal time delay compensation on the source channel. You can tweak the delay by moving the cursor in the Delay Finder window. After we have compensated for the response delay the transfer function measurement becomes:
113 SpectraFoo User Manual 113 Figure 85: Time-aligned transfer function Notice that overall the coherence of the measurement has increased and that the phase no longer has the sawtooth character. As explained earlier, the phase is not discontinuous at 2 khz it is just wrapping around due to the cyclic nature of phase. The reason we cannot get the phase measurement to appear continuous for this system is related to the fact that the system that we are measuring is not time aligned. When the measurement of the low end is time-delay compensated, the high end is not and vice-versa. INTERPRETING THE DATA So now we have a measurement of the transfer function of the system. This leads us to a few natural questions: 1. What does the data mean? 2. How do we interpret the data? 3. How do we use the data?
114 114 SpectraFoo User Manual The transfer function measurement system calculates three different functions from the source and response signals. Each of these functions adds a piece of the puzzle and will be instrumental in interpreting and using the transfer function data. The first function is the power response of the SUT. This is the effective equalization that the SUT applies to signals that run through it. The second function is the phase response of the SUT. This is the phase shift/distortion applied to the signal by the SUT. The final function computed by the transfer function measurement system is the coherence. The coherence is a measure of how much, on average, the response signal lines up with the source signal on a frequency by frequency basis. This is one of the most important pieces of the puzzle because it allows us to evaluate the quality and usefulness of the data. Coherence is a little hard to understand, so we ll examine it in a little more detail. ABOUT COHERENCE Imagine the source signal is a simple sine wave. The response signal will, in general, be another sine wave with the same frequency but a different amplitude and phase. Mathematically: l The source signal s(t) is a sine wave with unit amplitude and frequency f. The response signal r(t) is a phase-shifted sine wave with amplitude a and frequency f. These two signals are shown below (the source signal is green and the response signal is red):
115 SpectraFoo User Manual a Simple source and response signals Even though there is a phase shift between the source and response, the phase shift is constant in time. On average the signals line up the same way all the time. On the other hand, if the signals are not related to each other: Simple source Complex response signal In this case, the phase shift between the source and response signals
116 116 SpectraFoo User Manual changes over time. This means that on average the signals do not line up with each other. The coherence will be close to zero. If the SUT is stationary (e.g. it is linear, does not change over time, and passes at least a portion of the source signal) the coherence will be 1 for all frequencies. This is what we expect when we make a time aligned measurement on an electronic system (like an EQ). If the SUT is non-stationary or if the SUT does not pass any of the source signal in a particular frequency band, then the coherence in that band will be 0. Unless we are having big problems, the frequency bands for which the coherence is small or 0 should be limited, even with acoustic tests. If the coherence is 0 or near 0 for most of the audio bandwidth, this indicates that the SUT is either not properly connected, the measurement has not been time-delay compensated with the delay finder, or that the SUT is sufficiently nonlinear that it is not possible to analyze it with the transfer function (a distortion generator is an example of such a device). Under normal acoustic test conditions the response signal of the system will be the actual system response plus noise. The noise (which can be electronic or acoustic), is, by definition, uncorrelated with the source signal. The coherence of noise with any source signal (except an exact, time-aligned copy of the noise) is zero. As a result, the noise that corrupts the response signal will tend to decrease the coherence of the measurement. The fact that there is noise in the test environment is not normally a problem when doing the test we arrange for the test signal to be louder than the surrounding noise. Even if the signal is not louder than the environmental noise at all times, the MBM thresholding allows the Transfer Function to only make measurements when the source signal is louder than the environmental noise. There is one situation that is problematic when making acoustic measurements. When the system has acoustic reflections, the response signal may have hard or partial nulls at certain frequencies. These nulls depend on the specific geometry of the acoustic environment (especially the location of the test microphone) and don t really represent the response of the sys-
117 SpectraFoo User Manual 117 tem. A null is created at a specific frequency when multiple signal paths cause the test signal to cancel out at the test mic position: Acoustic test with reflected paths The reflected path introduces a copy of the signal with a time delay. The reflected signal takes longer to reach the microphone than the direct signal because of the path length difference. Path length difference l If we call the path length and the speed of sound v, the response at the microphone will have a null for frequencies where f = n v l, and n is any integer. This is just a simple comb. 0 In any real acoustic environment there will be many reflective surfaces with many different reflectivities and phase shifts, so we will not see a simple comb filter but a complex set of partial nulls. At the partial nulls in the response at microphone position, little of the source signal will be detected; only the environmental noise will be measured. This means that at the nulled frequencies, the coherence will be very low. This provides us with the key to understanding how to use the coherence. The coherence tells us where the measurement that we have made is valid. It is basically a measure of the quality of the measurement at the corresponding frequency. In terms of correcting the response of acoustic systems, the coherence 0
118 118 SpectraFoo User Manual tells us which notches or dips in the response curve are Equalizable and which are due to nulls in the measurement. If the coherence is low at a dip in the response curve, we will not be able to use an equalizer to fix it. If the null is due to the specific position of the measurement microphone, we can generate a better averaged response by making measurements at a variety of microphone positions and then averaging the measurements. This technique is described in more detail later. On the other hand, if the coherence remains low for a variety of microphone positions, the cancellation of the source signal is not due to a specific reflection, but is actually part of the system response. In order to correct these types of problems, either the configuration of the system must be changed (e.g. moving the position of the speakers or adjusting the relative time delay of different clusters in the system) or the configuration of the acoustic space will have to be changed (removing reflections, adding diffusion, etc.). ABOUT THE RESPONSE CURVES If the SUT is a simple processor (like an equalizer) the power response tells us the effect of the processor on the signal. Hopefully the response matches the expected response. In any case, the measured response is the actual response of the processor. If the SUT is a sound reinforcement system, the expected (or more to the point, desired) response of the SUT is that of a wire. The system should, ideally, reproduce the signal exactly without any coloration. No real system will do this, but often the problems in a sound system are correctable. The data provided by the transfer function allows us to determine: 1. What parts of the system are correctable with equalization. 2. What equalization is required to correct the system. As described above, the coherence allows us to determine what is correctable with equalization. The power response tells us what equalization is required to correct the system. The phase response can help determine
119 SpectraFoo User Manual 119 what type of equalization will best solve the problem and also help determine if other phase changing components (like the crossovers) of a system are causing problems. It will also help you determine if the drivers in a speaker (or a cluster of speakers) are properly time-aligned (as shown before). The basic system configuration that we will use to measure and correct an acoustic reproduction systems is: Measurement and Correction setup The equalizer in this setup is used to correct the response of the system. The switch above the pre-amp is used to select between the output of the equalizer and the output of the test mic. To measure the system response: 1. Open the Transfer Function window if it is not already open. 2. Open the Transfer Function Controls window. 3. Flatten the system equalizer or bypass it. We want to measure the un-equalized response of the system. 4. Set the response input channel to the output of the test mic. You
120 120 SpectraFoo User Manual can do this by selecting the proper input channel in the Transfer Function Controls window (if you are using multi channel input hardware) or by routing your test mic to the computer input using an external routing system (e.g. a patch bay or a mixer). 5. Set the transfer function source channel to your signal source. 6. Turn on your signal source. Make sure that the signal source is a broadband source like pink noise or pop music. Classical music does not work as well. You must also ensure that the source is louder, on average than the environmental noise. 7. Make sure that you are getting both the source and response signal into Foo. You can use a level meter instrument to make sure that you are getting signal. 8. Check to see that the input levels of the two signals are reasonably equal in level. You can eyeball this with the level meter or you can use a power-balance meter to balance the input levels. 9. Adjust the Avg. Power Cutoff slider (in the Transfer Function Controls window) so that the pointer is in the middle. This will allow you to get an accurate time delay calculation. 10. Click the Compute Delay button. The Delay Finder will appear and automatically compensate for the acoustic delay. 11. Adjust the Avg. Power Cutoff slider (in the Transfer Function Controls window) so that the pointer is near the left hand end of the slider. This will help the MBM thresholding system reject environmental noise. If the traces are not moving at all, select Age from the Fade pop-up menu. Ensure that the traces are flashing bright green all over the entire audio bandwidth. If they are not, decrease the Avg. Power Cutoff slider until the traces start flashing. (You do not want the trace to be completely bright green just flashing). 12. Adjust the Avg. Rate slider so the pointer is near the middle of the slider. This will cause the Transfer Function to average over a
121 SpectraFoo User Manual 121 reasonable period of time. 13. After a short period of time the measurement should settle down. If all is well, the coherence should be near the top of the graph for most of the audio band. If you are using music, you may not see much activity in the very high end (above 16kHz). 14. Click the Take Snapshot button in the Transfer Function window. The Transfer Function Snapshot dialog will appear: Transfer Function snapshot dialog 15. Enter a descriptive name for the snapshot (e.g. Control Room Response ). The time and date of the Snapshot is automatically logged. You can enter any comments pertinent to the snapshot in the comments box. You can also tell the system to smooth the snapshot data (when it is displayed) and to invert the snapshot data (when it is displayed). 16. Click the Invert Trace checkbox and then the OK button. The Overlay List window will appear (the list in this figure has a number of overlays; yours will have just the new one):
122 122 SpectraFoo User Manual Transfer function Overlay List window You now have a complete measurement of the transfer function of your system. You may want to make a number of measurements for further averaging, but what we have now is good enough to illustrate the correction process. Here is an example of a measurement that we have made using the procedure described above: Sample transfer function
123 SpectraFoo User Manual 123 We see that the coherence is reasonably high (with a few narrow exceptions) from about 80 Hz to 18 khz. Below 80 Hz, the sound system is not really reproducing the test signal and the environmental noise is pretty high. In addition, the test signal does not have a tremendous amount of energy below 60Hz. The test signal did not have much energy above 18 khz, so we have not really measured the system response from that point on. There are a few significant dips in the system response. Some of these are quite narrow and correspond to significant dips in the coherence curve. These dips are most likely caused by measurement nulls due to acoustic reflections and must be ignored since the coherence is so low. Some of the dips in the response correspond to places where the coherence is high. These dips are real and can be corrected with EQ. Notice that there are a series of closely spaced notches in the high end of the system response (8 khz and up). These correspond to reflection nulls that will move around when the microphone position is changed, but will not disappear. They will make the system sound ragged on the high end and will also make the system sound phase-y when the listener moves around. These are caused by acoustic reflections and are best treated with diffusion or absorptive material. We can now try to correct the system with equalization. What we want to do is adjust the system EQ to match the inverse of the system response. When we do this, we will pre-compensate the signal sent to the sound reinforcement system so that when it applies its effective equalization to the signal, the result balances out and leaves us with a (relatively) flat system response. To correct the system: 1. Switch the response signal source to be the output of the system equalizer. 2. In the Overlays window, click the checkbox in the V column of the transfer function overlay that corresponds to the system response that you want to correct. This makes the snapshot vis-
124 124 SpectraFoo User Manual ible in the Transfer Function window. (Make sure that the I checkbox is also checked. This Inverts the snapshot which makes it look like the EQ curve that we need to correct the system.)the overlay is displayed in the color of the tile next to the snapshot name. If you want to change this color, click on the tile and choose the new color. 3. Select Coherence from the Fade popup menu of the snapshot in the Overlays window. This will fade the trace based on the coherence of the measurement. It allows you to see what portions of the response are equalizable. 4. Start your signal source. Pink noise tends to work best when you are measuring your EQ, because you don t have to listen to it. You can still use music if you want to be able to listen to the effects of the system EQ as you are changing the system EQ. 5. Since there is very little environmental noise in this measurement, you can decrease the setting of the Avg. Power Cutoff slider. 6. Again since there is very little environmental noise, and since we want to be able to see the changes in the equalizer response as we change the equalizer settings, you can decrease the setting of the Avg. Rate slider. 7. Click the Compute Delay button to recompute the delay for the equalizer. The system will compute and compensate for the delay through the equalizer. 8. After a few seconds, the coherence curve should be near the top of the panel for the entire audio range and the power curve should be flat (this assumes that the EQ has been zeroed out). 9. Move the inverted system response curve so that the highest points on the curve are level with the live trace. You do this by clicking on the response curve and dragging it vertically until it is positioned properly. You want to make this adjustment so that you can correct the system using an all-cut EQ curve.

125 SpectraFoo User Manual Adjust the settings on your system EQ to match the general trends of the inverted system response curve. Avoid trying to match steep peaks in the inverted system response especially when the coherence is very low. 11. Assuming everything went well, your system has been corrected. It should now sound significantly better than when you started. You can re-measure the system response (now with the system EQ switched in), to verify that the system has been substantially improved; and of course your ears will also let you know. There are many other types of measurements you can make with the transfer function measurement system. TRANSFER FUNCTION CONTROLS REFERENCE You control the display and behavior of the transfer function window with the Transfer Function Controls window: Transfer Function Controls window Source pop-up menu You use this menu to select the source channel. Response pop-up menu You use this menu to select the response channel. Resolution pop-up menu You use this menu to select the octave resolution of the analysis. You can select from: 1. 1 Octave power is displayed as bars; each band is one octave
126 126 SpectraFoo User Manual wide. 2. 1/2 Octave power is displayed as bars; each band is one half of an octave wide. 3. 1/3 Octave power is displayed as bars; each band is one third of an octave wide. 4. 1/6 Octave power is displayed as bars; each band is one sixth of an octave wide. 5. 1/12 Octave power is displayed as bars; each band is one twelfth of an octave wide. 6. 1/24 Octave power is displayed as bars; each band is one twenty-fourth of an octave wide. 7. Continuous. power is displayed as a continuous curve. Frequency Range Slider You use this range slider to control the visible bandwidth of the transfer function. Power Range Slider You use this range slider to control the visible power range of the transfer function. The power scale is automatically scaled to keep the display logarithmic. Frequency Scaling Slider You use this slider to control the scaling of the frequency axis of the transfer function. Avg. Rate Slider You use this slider to control the averaging rate of the transfer function analysis. The far left end of the slider is No averaging and the far right end of the slider corresponds to averaging over 2 minutes (approximately). The averaging done by the transfer function is a decaying exponential average, so it is difficult to assign a numerical value to the averaging rate. In general, acoustic systems require a larger averaging rate than electronic systems. If you use music for the test signal you need a larger averaging rate than if you use noise. Avg. Power Cutoff Slider You use this slider to control threshold level applied to the spectrum of the source signal. When the source signal level
127 SpectraFoo User Manual 127 is higher than the threshold (this is computed for every spectral line in the spectrum) the transfer function adds the measurement to the average. If the level is below the threshold, the data is ignored. You can see which bands are above the threshold level by setting the Fade pop-up menu to Age. For every band that is above threshold, the response curves will be drawn in bright green. For normal acoustic testing, you want the response curves to be flashing on and off not a constant bright green and not a constant dark green. This allows the MBM thresholding to reject environmental noise the best. Display pop-up menu This pop-up menu allows you to choose what data is displayed in the transfer function window: 1. Instantaneous This mode displays each instantaneous measurement of the transfer function. 2. Average This mode displays the thresholded average of the transfer function data. Fade pop-up menu This pop-up menu allows you to choose how the response traces are faded: 1. None Don t fade the response traces. 2. Coherence Fade the color of the trace based on the coherence of the measurement. 3. Age Fade the color of the trace based on how long it has been since the source signal exceeded the threshold level. Show pop-up menu This pop-up menu select from a number options. Each option is independent of the others: 1. Coherence Trace Is Visible Shows and hides the red coherence trace. 2. Show Details Shows and hides the numerical readouts of the center frequencies and levels of each of the bands when the analyzer is in octave analysis mode.
128 128 SpectraFoo User Manual 3. Smooth Traces Makes the Transfer Function perform averaging in frequency space to display smooth response traces. This generally makes the response traces easier to interpret. Compute Delay button creates a new Delay Finder window and computes the impulse response of the system that is currently being measured. The Delay Finder will automatically compensate for the delay in the SUT. TRANSFER FUNCTION SNAPSHOT OVERLAYS REFERENCE Use the Take Snapshot button in the Transfer Function window to make a new snapshot from the current transfer function data. All other snapshot overlay management is done from the Overlay List window: Transfer Function Snapshot Overlays window This window lists all of the overlays that are loaded into the system. Each item in the list contains the following items: 1. A color well This is the base color of the response traces in the snapshot. Clicking on the chip will bring up the color picker window and allow you to change the trace color. 2. The snapshot name This is the name associated with the snapshot data. You can click on this to select the snapshot in the list. Double-click to bring up the transfer function snapshot edit dialog. You can change the name of the snapshot, its associated comments and the offset. The offset can also be controlled by

129 SpectraFoo User Manual 129 clicking and dragging the trace in the Transfer Function window. You can use the offset field to easily reset the trace position Transfer function snapshot edit dialog 3. The V checkbox controls the visibility of the associated snapshot in the transfer function window. <option>-clicking this check box will set the state of all of the snapshots in the list. 4. The S checkbox controls the smoothing of the response traces of the associated snapshot in the transfer function window. <option>-clicking this check box will set the state of all of the snapshots in the list. 5. The I checkbox allows you to select if the response traces of the associated snapshot are inverted in the transfer function window. <option>-clicking this check box will set the state of all of the snapshots in the list. 6. The Fade pop-up menu controls how the associated traces are faded in the transfer function window. <option>-selecting an item from this menu sets the state of all of the snapshots in the list. The Overlay List window also has a mini-menu window command pop-down menu in the upper right-hand corner above the scrollbar ( ). This menu provides the following commands: Save Selected Snapshots Select this command to save each of the selected snapshots to disk.
130 130 SpectraFoo User Manual Load Snapshot Select this command to load a snapshot file from disk. Remove Selected Snapshots Select this command to remove the selected snapshots from the list. Average Selected Snapshots Select this command to create a new snapshot from the average of all of the selected snapshots. You can choose to weight the average with the coherence of the measurements. If you make a number of measurements with different mic positions and create a weighted average, you can remove the effects of local nulls and generate a more accurate measurement of the response of the system. Smooth All Snapshots Select this command to smooth all the snapshots in the list. Unsmooth All Snapshots Select this command to unsmooth all the snapshots in the list. Invert All Snapshots Select this command to invert all the snapshots in the list. Uninvert All Snapshots Select this command to uninvert all the snapshots in the list. Show All Snapshots Select this command to make all the snapshots in the list visible. Hide All Snapshots Select this command to make all the snapshots in the list invisible. Ask About Unsaved Snapshots When this item is checked, the system will ask you if you want to save an unsaved snapshot before it is removed from memory. CURSORS IN THE TRANSFER FUNCTION WINDOW You can put a readout cursor in the Transfer Function window by moving the mouse cursor over one of the transfer function panels and holding
131 SpectraFoo User Manual 131 down the <command> key. If the display is one of the octave analysis modes, the cursor will snap to the center of each band. The cursors in both the power and phase panel will move simultaneously. To move these two cursors separately, hold down both the <command> and <option> keys. To remove the cursor from the display, move the cursor to the vertical calibration of one of the panels.

132 132 SpectraFoo User Manual Quick Menu Reference Edit Menu This menu contains the standard editing commands. Currently Select All and Show Clipboard are not implemented. The Edit Key Commands menu item allows you to view or change the key commands for many standard menu commands: The Preferences command allows you to bring up system-wide preferences for SpectraFoo. Currently, these preferences allow you to control the visual appearance of the components of SpectraFoo. In order to change the panel color you must have the ColorPickerLib installed in the extensions folder.this library comes standard with the Macintosh System Software. If this file is not installed,

133 SpectraFoo User Manual 133 when you click on the Panel Color color tile, nothing will happen. The Use brushed metal panels check box controls the appearance of the panels that appear within the Real Time Rack consolidated view. Finally, the Panel Highlight Tints sliders allow you to adjust the brightness of the highlights and shadows on the instrument panels. All changes that you make with this control panel are remembered as preferences. These changes take place immediately.

134 134 SpectraFoo User Manual Analyzer Menu The Analyzer Menu allows you to change the resolution of the Analyzer. Although you can switch the resolution of the analyzer to less than 4096 points, SpectraFoo is so fast that we can t see why you would want to (if the computer you are using is especially slow, or if it does not have any cache, you may want to lower the analyzer resolution in order to gain some speed at the expense of frequency resolution). You can also use this menu to increase the resolution of the analyzer. The 8192pt setting is a good compromise between speed and resolution on fast machines. The Remove DC Offset command allows you to remove any residual DC offset from the input converters. If the Spectragraph shows a hump at 0 Hz, even with no input signal present, mute the input to SpectraFoo and select the Remove DC Offset command to remove the DC offset from the input. The Reset Analyzer command causes the analyzer to disconnect and the reconnect itself from the selected input hardware. It can be used if the system appears to be behaving strangely (No instrument updates, or severe digital distortion). The Level Calibration command allows you to set a reference value for Digital Full Scale (0dBFS). This window also contains the utilities to determine when a full scale sample is detected, and how many consecutive full scale samples constitutes a clip.


135 SpectraFoo User Manual 135 Finally, the Analyzer menu contains the command to show/hide the Signal Generator. Control of the Signal Generator is covered elsewhere in this documentation. Switching Sources: The Audio I/O Menu. The items that appear in this menu will depend on the particular hardware configuration that SpectraFoo is running on. SpectraFoo gets information about available input paths from Core Audio within the Mac OS. The items in this menu will reflect the particular hardware configuration of your computer. If you are using any supported third-party I/O cards they will appear in this menu. These cards can be selected and controlled directly using the Audio I/O menu. The Monitor Input command allows you to control how the software passes audio from its input to its output. If this item is checked, the audio will be passed. If it is unchecked, the audio will be muted. If you are using the built in mic on a portable computer and are also using the built in speakers, this item must be unchecked, or you will encounter feedback. The Use Internal Clock command allows you to choose between an internal and external clock source for the currently selected input hardware. If the hardware supports changing the clock source, this command will be enabled. Generally, you will want to use an external clock if you are recording or monitoring a digital input signal. You may want to use the internal clock when you play material from a capture.


136 136 SpectraFoo User Manual Captures Menu The Captures menu is used to control the Capture List Window which is described elsewhere in this manual. You can use the commands in the Captures menu to Load, Save, and Delete Captures. You can also tell SpectraFoo to warn you if it is about to remove an unsaved capture from the system s memory. The Save Selected Captures command will save all of the captures that are currently selected in the Capture List Window. If any of the selected captures have not yet been saved to disk, you will be prompted for a name and location to save the file. The Save Selected Captures As command will allow you to save each of the currently selected (in the Capture List Window) captures to a fresh location or with a fresh name. You will be presented with the save dialog for each capture in turn.
137 SpectraFoo User Manual 137 The Load Capture command allows you to load any AIFF or SoundDesigner II file as a capture. The Delete Selected Captures removes the selected (in the Capture List Window) captures from SpectraFoo s memory. If the Ask About Unsaved Captures command has been selected, for each capture that has been changed and is being deleted, SpectraFoo will ask if you want to save the changes. A capture that has never been saved is considered to be changed. The Ask About Unsaved Captures command, when checked, causes SpectraFoo to ask you if you want to save a capture that has been changed or has never been saved before it is deleted from memory. The state of this command is remembered as a preference. You may want to turn this off if you have made a large number of captures and want to delete them all or quit SpectraFoo without being asked about each capture in turn. Groups Menu The groups menu allows you to control and select from the library of instrument enable groups. Instrument enable groups allow you to take and restore snapshots of the state of the enable and solo buttons of all of the instruments in the Real Time Rack. Unfortunately the Instrument enable groups do not currently support instruments that are not in the Real Time Rack. The Add to Group Library command allows you to take a snapshot of the current state of the buttons and save it into the library. A dialog will appear that allows you to name the Group. By appending a /x (where

138 138 SpectraFoo User Manual x is replaced with the command key that you would like to use) you can assign a command key to the group. For instance, the All Off group was defined with the name All Off/0. The Delete from Group Library command allows you to remove a snapshot from the library. Selecting any of the items that appear below the separator line will restore the associated snapshot. Window Menu The window menu allows you to control the various windows that comprise SpectraFoo. The windows in SpectraFoo are in two different layers. These two layers consist of instrument windows and control windows that float above the instrument windows. The Control and Routing window, Master Control window, FFT Window Control window, and the all the Details windows for the real time instruments are control windows. Instrument windows are used to display actual measured data. The Real Time Rack is also an instrument window, Control windows always stay in front of the Instrument windows. In order to help you manage the windows and reduce screen clutter, SpectraFoo provides a set of menu and keyboard commands. These key commands are covered in Appendix II at the end of this manual.
SpectraFoo User's Guide
 S pe c t r a F oo Us e r sgui de SpectraFoo User's Guide Metric Halo $Revision: 1656 $ Publication date $Date: 2012-04-30 13:49:05-0500 (Mon, 30 Apr 2012) $ Copyright 2011 Metric Halo Table of Contents
Operations Guide. Copyright 1998, Metric Halo Laboratories, Inc. All rights reserved.
 Operations Guide Copyright 1998, Metric Halo Laboratories, Inc. All rights reserved. SpectraFoo Operation Guide 1 Congratulations! You are now the owner of the most powerful audio analysis and metering
Precision DeEsser Users Guide
 Precision DeEsser Users Guide Metric Halo $Revision: 1670 $ Publication date $Date: 2012-05-01 13:50:00-0400 (Tue, 01 May 2012) $ Copyright 2012 Metric Halo. MH Production Bundle, ChannelStrip 3, Character,
Character Users Guide
 Cha r a c t e r Us e r sgui de Character Users Guide Metric Halo $Revision: 1619 $ Publication date $Date: 2012-02-10 20:41:00-0400 (Friday, 10 Feb 2012) $ Copyright 2011 Metric Halo Table of Contents
Abbey Road TG Mastering Chain User Guide
 Abbey Road TG Mastering Chain User Guide CONTENTS Introduction... 3 About the Abbey Road TG Mastering Chain Plugin... 3 Quick Start... 5 Components... 6 The WaveSystem Toolbar... 6 Interface... 7 Modules
Syrah. Flux All 1rights reserved
 Flux 2009. All 1rights reserved - The Creative adaptive-dynamics processor Thank you for using. We hope that you will get good use of the information found in this manual, and to help you getting acquainted
Spectrum Analyser Basics
 Hands-On Learning Spectrum Analyser Basics Peter D. Hiscocks Syscomp Electronic Design Limited Email: phiscock@ee.ryerson.ca June 28, 2014 Introduction Figure 1: GUI Startup Screen In a previous exercise,
Please feel free to download the Demo application software from analogarts.com to help you follow this seminar.
 Hello, welcome to Analog Arts spectrum analyzer tutorial. Please feel free to download the Demo application software from analogarts.com to help you follow this seminar. For this presentation, we use a
Dave Jones Design Phone: (607) Lake St., Owego, NY USA
 Lake St., Owego, NY USA") Manual v1.00a June 1, 2016 for firmware vers. 2.00 Dave Jones Design Phone: (607) 687-5740 34 Lake St., Owego, NY 13827 USA www.jonesvideo.com O Tool Plus - User Manual Main mode NOTE: New modules are
Manual v1.00a June 1, 2016 for firmware vers. 2.00 Dave Jones Design Phone: (607) 687-5740 34 Lake St., Owego, NY 13827 USA www.jonesvideo.com O Tool Plus - User Manual Main mode NOTE: New modules are
NanoGiant Oscilloscope/Function-Generator Program. Getting Started
 Getting Started Page 1 of 17 NanoGiant Oscilloscope/Function-Generator Program Getting Started This NanoGiant Oscilloscope program gives you a small impression of the capabilities of the NanoGiant multi-purpose
imso-104 Manual Revised August 5, 2011
 imso-104 Manual Revised August 5, 2011 Section 1 Getting Started SAFETY 1.10 Quickstart Guide 1.20 SAFETY 1.30 Compatibility 1.31 Hardware 1.32 Software Section 2 How it works 2.10 Menus 2.20 Analog Channel
Getting Started with the LabVIEW Sound and Vibration Toolkit
 1 Getting Started with the LabVIEW Sound and Vibration Toolkit This tutorial is designed to introduce you to some of the sound and vibration analysis capabilities in the industry-leading software tool
Linrad On-Screen Controls K1JT
 Linrad On-Screen Controls K1JT Main (Startup) Menu A = Weak signal CW B = Normal CW C = Meteor scatter CW D = SSB E = FM F = AM G = QRSS CW H = TX test I = Soundcard test mode J = Analog hardware tune
NOTICE. The information contained in this document is subject to change without notice.
 NOTICE The information contained in this document is subject to change without notice. Toontrack Music AB makes no warranty of any kind with regard to this material, including, but not limited to, the
Sonoris Meter VST 2.0
 Sonoris Meter VST 2.0 User Manual Introduction 2008 Pieter Stenekes info@sonoris.nl Copyright Sonoris Audio Engineering 2008 www.sonoris.nl 1/11 Thank you for choosing Sonoris Meter! What is it? With this
456 SOLID STATE ANALOGUE TAPE + A80 RECORDER MODELS
 456 SOLID STATE ANALOGUE TAPE + A80 RECORDER MODELS 456 STEREO HALF RACK 456 MONO The 456 range in essence is an All Analogue Solid State Tape Recorder the Output of which can be recorded by conventional
Reference. TDS7000 Series Digital Phosphor Oscilloscopes
 Reference TDS7000 Series Digital Phosphor Oscilloscopes 07-070-00 0707000 To Use the Front Panel You can use the dedicated, front-panel knobs and buttons to do the most common operations. Turn INTENSITY
WAVES H-EQ HYBRID EQUALIZER USER GUIDE
 WAVES H-EQ HYBRID EQUALIZER USER GUIDE TABLE OF CONTENTS CHAPTER 1 INTRODUCTION...3 1.1 WELCOME...3 1.2 PRODUCT OVERVIEW...3 1.3 CONCEPTS AND TERMINOLOGY...4 1.4 COMPONENTS...7 CHAPTER 2 QUICK START GUIDE...8
USER S GUIDE DSR-1 DE-ESSER. Plug-in for Mackie Digital Mixers
 USER S GUIDE DSR-1 DE-ESSER Plug-in for Mackie Digital Mixers Iconography This icon identifies a description of how to perform an action with the mouse. This icon identifies a description of how to perform
StereoTools Operation Guide
 StereoTools Operation Guide Content copyright 2009 Sonalksis Ltd Contents Introduction... 3 Installation... 4...with the Plug-in Manager 4 Authorisation 4 Operation... 5 Stereo Processing Section 5 Phase
Manual for the sound card oscilloscope V1.41 C. Zeitnitz english translation by P. van Gemmeren, K. Grady and C. Zeitnitz
 Manual for the sound card oscilloscope V1.41 C. Zeitnitz english translation by P. van Gemmeren, K. Grady and C. Zeitnitz C. Zeitnitz 12/2012 This Software and all previous versions are NO Freeware! The
PRELIMINARY INFORMATION. Professional Signal Generation and Monitoring Options for RIFEforLIFE Research Equipment
 Integrated Component Options Professional Signal Generation and Monitoring Options for RIFEforLIFE Research Equipment PRELIMINARY INFORMATION SquareGENpro is the latest and most versatile of the frequency
CLA MixHub. User Guide
 CLA MixHub User Guide Contents Introduction... 3 Components... 4 Views... 4 Channel View... 5 Bucket View... 6 Quick Start... 7 Interface... 9 Channel View Layout..... 9 Bucket View Layout... 10 Using
DRAFT RELEASE FOR BETA EVALUATION ONLY
 IPM-16 In-Picture Audio Metering User Manual DRAFT RELEASE FOR BETA EVALUATION ONLY Ver 0.2 April 2013 1 Contents Introduction...3 In Picture Audio Meter Displays...4 Installation...7 External Audio Board
imso-104 Manual Revised July 19, 2012
 imso-104 Manual Section 1 Getting Started SAFETY 1.10 Quickstart Guide 1.20 SAFETY 1.30 Compatibility 1.31 Hardware 1.32 Software Section 2 How it works 2.10 Menus 2.20 Analog Channel 2.21 On / Off 2.22
2 MHz Lock-In Amplifier
 2 MHz Lock-In Amplifier SR865 2 MHz dual phase lock-in amplifier SR865 2 MHz Lock-In Amplifier 1 mhz to 2 MHz frequency range Dual reference mode Low-noise current and voltage inputs Touchscreen data display
MAutoPitch. Presets button. Left arrow button. Right arrow button. Randomize button. Save button. Panic button. Settings button
 MAutoPitch Presets button Presets button shows a window with all available presets. A preset can be loaded from the preset window by double-clicking on it, using the arrow buttons or by using a combination
spiff manual version 1.0 oeksound spiff adaptive transient processor User Manual
 oeksound spiff adaptive transient processor User Manual 1 of 9 Thank you for using spiff! spiff is an adaptive transient tool that cuts or boosts only the frequencies that make up the transient material,
Operating Instructions
 Operating Instructions HAEFELY TEST AG KIT Measurement Software Version 1.0 KIT / En Date Version Responsable Changes / Reasons February 2015 1.0 Initial version WARNING Introduction i Before operating
Voxengo Soniformer User Guide
 Version 3.7 http://www.voxengo.com/product/soniformer/ Contents Introduction 3 Features 3 Compatibility 3 User Interface Elements 4 General Information 4 Envelopes 4 Out/In Gain Change 5 Input 6 Output
Analog Dual-Standard Waveform Monitor
 Test Equipment Depot - 800.517.8431-99 Washington Street Melrose, MA 02176 - TestEquipmentDepot.com Analog Dual-Standard Waveform Monitor 1741C Datasheet Additional Analysis Features Timing Display for
MTL Software. Overview
 MTL Software Overview MTL Windows Control software requires a 2350 controller and together - offer a highly integrated solution to the needs of mechanical tensile, compression and fatigue testing. MTL
RELEASE NOTES. Introduction. Supported Devices. Mackie Master Fader App V4.5.1 October 2016
 RELEASE NOTES Mackie Master Fader App V4.5.1 October 2016 Introduction These release notes describe changes and upgrades to the Mackie Master Fader app and DL Series mixer firmware since Version 4.5. New
ME EN 363 ELEMENTARY INSTRUMENTATION Lab: Basic Lab Instruments and Data Acquisition
 ME EN 363 ELEMENTARY INSTRUMENTATION Lab: Basic Lab Instruments and Data Acquisition INTRODUCTION Many sensors produce continuous voltage signals. In this lab, you will learn about some common methods
EASY-MCS. Multichannel Scaler. Profiling Counting Rates up to 150 MHz with 15 ppm Time Resolution.
 Multichannel Scaler Profiling Counting Rates up to 150 MHz with 15 ppm Time Resolution. The ideal solution for: Time-resolved single-photon counting Phosphorescence lifetime spectrometry Atmospheric and
ULN-8 Quick Start Guide
 Metric Halo $Revision: 1671 $ Publication date $Date: 2012-7-21 12:42:12-0400 (Mon, 21 Jul 2012) $ Copyright 2012 Metric Halo Table of Contents 1.... 5 Prepare the unit for use... 5 Connect the ULN-8 to
MIE 402: WORKSHOP ON DATA ACQUISITION AND SIGNAL PROCESSING Spring 2003
 MIE 402: WORKSHOP ON DATA ACQUISITION AND SIGNAL PROCESSING Spring 2003 OBJECTIVE To become familiar with state-of-the-art digital data acquisition hardware and software. To explore common data acquisition
Digital Storage Oscilloscopes 2550 Series
 Data Sheet Digital Storage Oscilloscopes 2550 Series The 2550 series digital storage oscilloscopes provide high performance and value in 2-channel and 4-channel configurations. With bandwidth from 70 MHz
Quick Start for TrueRTA (v3.5) on Windows XP (and earlier)
 on Windows XP (and earlier)") Skip directly to the section that covers your version of Windows (XP and earlier, Vista or Windows 7) Quick Start for TrueRTA (v3.5) on Windows XP (and earlier) Here are step-by-step instructions to get
Skip directly to the section that covers your version of Windows (XP and earlier, Vista or Windows 7) Quick Start for TrueRTA (v3.5) on Windows XP (and earlier) Here are step-by-step instructions to get
MDistortionMB. Easy screen vs. Edit screen
 MDistortionMB Easy screen vs. Edit screen The plugin provides 2 user interfaces - an easy screen and an edit screen. Use the Edit button to switch between the two. By default most plugins open on the easy
Outline ip24 ipad app user guide. App release 2.1
 Outline ip24 ipad app user guide App release 2.1 Project Management Search project by name, place and description Delete project Order projects by date Order projects by date (reverse order) Order projects
Lindell 354E User Manual. Lindell 354E. User Manual
 Lindell354EUserManual Lindell 354E User Manual Introduction Congratulation on choosing the Lindell 354E multi band compressor. This plugin faithfully reproduces the behavior and character of the most famous
DK Meter Audio & Loudness Metering Complete. Safe & Sound
 DK Meter Audio & Metering Complete Safe & Sound DK Meter at a glance Complete Audio & one-box metering Hassle-free Flexibility plug, preset and play High Quality Tools, yet outstanding value for money
The Measurement Tools and What They Do
 2 The Measurement Tools The Measurement Tools and What They Do JITTERWIZARD The JitterWizard is a unique capability of the JitterPro package that performs the requisite scope setup chores while simplifying
LeCroy Digital Oscilloscopes
 LeCroy Digital Oscilloscopes Get the Complete Picture Quick Reference Guide QUICKSTART TO SIGNAL VIEWING Quickly display a signal View with Analog Persistence 1. Connect your signal. When you use a probe,
Liquid Mix Plug-in. User Guide FA
 Liquid Mix Plug-in User Guide FA0000-01 1 1. COMPRESSOR SECTION... 3 INPUT LEVEL...3 COMPRESSOR EMULATION SELECT...3 COMPRESSOR ON...3 THRESHOLD...3 RATIO...4 COMPRESSOR GRAPH...4 GAIN REDUCTION METER...5
4 MHz Lock-In Amplifier
 4 MHz Lock-In Amplifier SR865A 4 MHz dual phase lock-in amplifier SR865A 4 MHz Lock-In Amplifier 1 mhz to 4 MHz frequency range Low-noise current and voltage inputs Touchscreen data display - large numeric
Eventide Inc. One Alsan Way Little Ferry, NJ
 Copyright 2017, Eventide Inc. P/N: 141236, Rev 4 Eventide is a registered trademark of Eventide Inc. AAX and Pro Tools are trademarks of Avid Technology. Names and logos are used with permission. Audio
Eventide Inc. One Alsan Way Little Ferry, NJ
 Copyright 2015, Eventide Inc. P/N: 141257, Rev 2 Eventide is a registered trademark of Eventide Inc. AAX and Pro Tools are trademarks of Avid Technology. Names and logos are used with permission. Audio
LIO-8 Quick Start Guide
 Metric Halo $Revision: 1051 $ Publication date $Date: 2011-08-08 12:42:12-0400 (Mon, 08 Jun 2011) $ Copyright 2010 Metric Halo Table of Contents 1.... 5 Prepare the unit for use... 5 Connect the LIO-8
Fraction by Sinevibes audio slicing workstation
 Fraction by Sinevibes audio slicing workstation INTRODUCTION Fraction is an effect plugin for deep real-time manipulation and re-engineering of sound. It features 8 slicers which record and repeat the
D-901 PC SOFTWARE Version 3
 INSTRUCTION MANUAL D-901 PC SOFTWARE Version 3 Please follow the instructions in this manual to obtain the optimum results from this unit. We also recommend that you keep this manual handy for future reference.
S op o e p C on o t n rol o s L arni n n i g n g O bj b e j ctiv i e v s
 ET 150 Scope Controls Learning Objectives In this lesson you will: learn the location and function of oscilloscope controls. see block diagrams of analog and digital oscilloscopes. see how different input
CL StageMix V6 User Guide
 Welcome: Thank you for downloading the CL StageMix ipad app for the Yamaha CL series digital mixing consoles. The latest firmware version for CL series can be downloaded from www.yamahaproaudio.com StageMix
TF5 / TF3 / TF1 DIGITAL MIXING CONSOLE. TF Editor User Guide
 TF5 / TF3 / TF1 DIGITAL MIXING CONSOLE EN Special notices Copyrights of the software and this document are the exclusive property of Yamaha Corporation. Copying or modifying the software or reproduction
MSO-28 Oscilloscope, Logic Analyzer, Spectrum Analyzer
 Link Instruments Innovative Test & Measurement solutions since 1986 Store Support Oscilloscopes Logic Analyzers Pattern Generators Accessories MSO-28 Oscilloscope, Logic Analyzer, Spectrum Analyzer $ The
SIGNAL PROCESSOR. Operation Manual
 SIGNAL PROCESSOR Operation Manual Using the PDF manual From the Contents on page 2, click on the desired topic to automatically jump to the corresponding page. Click on a link in this manual to jump to
WAVEJET 300 SERIES OSCILLOSCOPES. New Cover to Come. Unmatched Performance, Portability, and Value
 WAVEJET 300 SERIES OSCILLOSCOPES New Cover to Come Unmatched Performance, Portability, and Value ALL THE TOOLS YOU NEED Automatic Measurements Save time making measurements on your signals by using the
SIGNAL PROCESSOR. Operation Manual
 SIGNAL PROCESSOR Operation Manual Using the PDF manual From the Contents on page 2, click on the desired topic to automatically jump to the corresponding page. Click on a link in this manual to jump to
PS User Guide Series Seismic-Data Display
 PS User Guide Series 2015 Seismic-Data Display Prepared By Choon B. Park, Ph.D. January 2015 Table of Contents Page 1. File 2 2. Data 2 2.1 Resample 3 3. Edit 4 3.1 Export Data 4 3.2 Cut/Append Records
TF5 / TF3 / TF1 DIGITAL MIXING CONSOLE. TF StageMix User's Guide
 TF5 / TF3 / TF1 DIGITAL MIXING CONSOLE EN Note The software and this document are the exclusive copyrights of Yamaha Corporation. Copying or modifying the software or reproduction of this document, by
Topic: Instructional David G. Thomas December 23, 2015
 Procedure to Setup a 3ɸ Linear Motor This is a guide to configure a 3ɸ linear motor using either analog or digital encoder feedback with an Elmo Gold Line drive. Topic: Instructional David G. Thomas December
WAVES Cobalt Saphira. User Guide
 WAVES Cobalt Saphira TABLE OF CONTENTS Chapter 1 Introduction... 3 1.1 Welcome... 3 1.2 Product Overview... 3 1.3 Components... 5 Chapter 2 Quick Start Guide... 6 Chapter 3 Interface and Controls... 7
PG-AMM 2.2. Pinguin Audio-Multi-Meter. Professional multifunctional Audio metering software. Owners Manual
 PG-AMM 2.2 Pinguin Audio-Multi-Meter Professional multifunctional Audio metering software Owners Manual KEY FEATURES Turns every MAC or PC equipped with a reasonable sound card into a professional, eye
Getting started with Spike Recorder on PC/Mac/Linux
 Getting started with Spike Recorder on PC/Mac/Linux You can connect your SpikerBox to your computer using either the blue laptop cable, or the green smartphone cable. How do I connect SpikerBox to computer
Operation Manual OPERATION MANUAL ISL. Precision True Peak Limiter NUGEN Audio. Contents
 ISL OPERATION MANUAL ISL Precision True Peak Limiter 2018 NUGEN Audio 1 www.nugenaudio.com Contents Contents Introduction Interface General Layout Compact Mode Input Metering and Adjustment Gain Reduction
Multiband Noise Reduction Component for PurePath Studio Portable Audio Devices
 Multiband Noise Reduction Component for PurePath Studio Portable Audio Devices Audio Converters ABSTRACT This application note describes the features, operating procedures and control capabilities of a
WAVEJET 300 SERIES OSCILLOSCOPES. Unmatched Performance, Portability, and Value
 WAVEJET 300 SERIES OSCILLOSCOPES Unmatched Performance, Portability, and Value 1 WAVEJET 300 SERIES Unique Capabilities in a Low Bandwidth Oscilloscope The WaveJet 300 Series features unmatched performance
CONTENTS Page 1.0 System Requirements Wi-Fi Settings Getting Started Mixer Window... 14
 Welcome: Thank you for downloading the CL StageMix ipad app for the Yamaha CL series digital mixing consoles. The latest firmware version for CL series can be downloaded from https://www.yamaha.com/proaudio/
soothe audio processor Manual and FAQ
 soothe audio processor Manual and FAQ Thank you for using soothe! soothe is a spectral processor for suppressing resonances in the mid and high frequencies. It works by automatically detecting the resonances
Element 78 MPE-200. by Summit Audio. Guide To Operations. for software version 1.23
 Element 78 MPE-200 by Summit Audio Guide To Operations for software version 1.23 TABLE OF CONTENTS IMPORTANT SAFETY AND GROUNDING INSTRUCTIONS COVER 1. UNPACKING AND CONNECTING...3 AUDIO CONNECTIONS...4
Oscilloscope Guide Tektronix TDS3034B & TDS3052B
 Tektronix TDS3034B & TDS3052B Version 2008-Jan-1 Dept. of Electrical & Computer Engineering Portland State University Copyright 2008 Portland State University 1 Basic Information This guide provides basic
S I N E V I B E S FRACTION AUDIO SLICING WORKSTATION
 S I N E V I B E S FRACTION AUDIO SLICING WORKSTATION INTRODUCTION Fraction is a plugin for deep on-the-fly remixing and mangling of sound. It features 8x independent slicers which record and repeat short
Using the oscillator
 Using the oscillator Here s how to send a sine wave or pink noise from the internal oscillator to a desired bus. In the function access area, press the MON- ITOR button to access the MONITOR screen. In
A Matlab toolbox for. Characterisation Of Recorded Underwater Sound (CHORUS) USER S GUIDE
 USER S GUIDE") Centre for Marine Science and Technology A Matlab toolbox for Characterisation Of Recorded Underwater Sound (CHORUS) USER S GUIDE Version 5.0b Prepared for: Centre for Marine Science and Technology Prepared
Centre for Marine Science and Technology A Matlab toolbox for Characterisation Of Recorded Underwater Sound (CHORUS) USER S GUIDE Version 5.0b Prepared for: Centre for Marine Science and Technology Prepared
Cristina Bachmann, Heiko Bischoff, Marion Bröer, Sabine Pfeifer, Heike Schilling, Benjamin Schütte This PDF provides improved access for
 Cristina Bachmann, Heiko Bischoff, Marion Bröer, Sabine Pfeifer, Heike Schilling, Benjamin Schütte This PDF provides improved access for vision-impaired users. Please note that due to the complexity and
MDistortionMB. The plugin provides 2 user interfaces - an easy screen and an edit screen. Use the Edit button to switch between the two.
 MDistortionMB Easy screen vs. Edit screen The plugin provides 2 user interfaces - an easy screen and an edit screen. Use the Edit button to switch between the two. By default most plugins open on the easy
C8000. switch over & ducking
 features Automatic or manual Switch Over or Fail Over in case of input level loss. Ducking of a main stereo or surround sound signal by a line level microphone or by a pre recorded announcement / ad input.
Ultra 4K Tool Box. Version Release Note
 Ultra 4K Tool Box Version 2.1.43.0 Release Note This document summarises the enhancements introduced in Version 2.1 of the software for the Omnitek Ultra 4K Tool Box and related products. It also details
SPL Analog Code Plug-ins Manual Classic & Dual-Band De-Essers
 SPL Analog Code Plug-ins Manual Classic & Dual-Band De-Essers Sibilance Removal Manual Classic &Dual-Band De-Essers, Analog Code Plug-ins Model # 1230 Manual version 1.0 3/2012 This user s guide contains
Version 1.10 CRANE SONG LTD East 5th Street Superior, WI USA tel: fax:
 -192 HARMONICALLY ENHANCED DIGITAL DEVICE OPERATOR'S MANUAL Version 1.10 CRANE SONG LTD. 2117 East 5th Street Superior, WI 54880 USA tel: 715-398-3627 fax: 715-398-3279 www.cranesong.com 2000 Crane Song,LTD.
KRAMER ELECTRONICS LTD. USER MANUAL
 KRAMER ELECTRONICS LTD. USER MANUAL MODEL: Projection Curved Screen Blend Guide How to blend projection images on a curved screen using the Warp Generator version K-1.4 Introduction The guide describes
SCM820 Digital IntelliMix Automatic Mixer SEAMLESS MIXING. ADVANCED CONTROL.
 SCM820 Digital IntelliMix Automatic Mixer SEAMLESS MIXING. ADVANCED CONTROL. SCM820 Digital IntelliMix Automatic Mixer The SCM820 is the flagship Shure digital automatic mixer for seamless, natural-sounding
PulseCounter Neutron & Gamma Spectrometry Software Manual
 PulseCounter Neutron & Gamma Spectrometry Software Manual MAXIMUS ENERGY CORPORATION Written by Dr. Max I. Fomitchev-Zamilov Web: maximus.energy TABLE OF CONTENTS 0. GENERAL INFORMATION 1. DEFAULT SCREEN
Eventide Inc. One Alsan Way Little Ferry, NJ
 Copyright 2017, Eventide Inc. P/N: 141263, Rev 5 Eventide is a registered trademark of Eventide Inc. AAX and Pro Tools are trademarks of Avid Technology. Names and logos are used with permission. Audio
Credits:! Product Idea: Tilman Hahn Product Design: Tilman Hahn & Dietrich Pank Product built by: Dietrich Pank Gui Design: Benjamin Diez
 whoosh 1.1 owners manual Document Version: 2.0 Product Version: 1.1 System Requirements: Mac or PC running the full version of Native Instruments Reaktor 5.9 and up. For Protools users: We no longer support
Sound Measurement. V2: 10 Nov 2011 WHITE PAPER. IMAGE PROCESSING TECHNIQUES
 www.omnitek.tv IMAGE PROCESSING TECHNIQUES Sound Measurement An important element in the assessment of video for broadcast is the assessment of its audio content. This audio can be delivered in a range
USB AUDIO INTERFACE I T
 USB AUDIO INTERFACE EN DE FR ES IT JA Contents Introduction...3 Contents in this Operation Manual... 3 Features... 3 Panel Controls and Terminals (Details)...4 Rear Panel... 4 Front Panel... 6 Panel Controls
PicoScope. User guide. Copyright 2005 Pico Technology Limited. All rights reserved. PSW044 v1.5
 PicoScope User guide I PicoScope User Guide Table of Contents 1 Introduction...3...3 1 What is PicoScope?...3 2 Why use PicoScope?...4 3 Screen layout...4 4 Display area...5 5 Customisation...5 6 Exporting
Troubleshooting Your Design with the TDS3000C Series Oscilloscopes
 Troubleshooting Your Design with the 2 Table of Contents Getting Started........................................................... 4 Debug Digital Timing Problems...............................................
Diamond Cut Productions / Application Notes AN-2
 Diamond Cut Productions / Application Notes AN-2 Using DC5 or Live5 Forensics to Measure Sound Card Performance without External Test Equipment Diamond Cuts DC5 and Live5 Forensics offers a broad suite
Signal Stability Analyser
 Signal Stability Analyser o Real Time Phase or Frequency Display o Real Time Data, Allan Variance and Phase Noise Plots o 1MHz to 65MHz medium resolution (12.5ps) o 5MHz and 10MHz high resolution (50fs)
rekordbox TM LIGHTING mode Operation Guide
 rekordbox TM LIGHTING mode Operation Guide Contents 1 Before Start... 3 1.1 Before getting started... 3 1.2 System requirements... 3 1.3 Overview of LIGHTING mode... 4 2 Terms... 6 3 Steps to easily control
Getting Started. Connect green audio output of SpikerBox/SpikerShield using green cable to your headphones input on iphone/ipad.
 Getting Started First thing you should do is to connect your iphone or ipad to SpikerBox with a green smartphone cable. Green cable comes with designators on each end of the cable ( Smartphone and SpikerBox
LA xlimit. Manual. by tb-software (C) tb-software 2015 Page 1 of 6
 tb-software 2015 Page 1 of 6") LA xlimit Manual by tb-software 2015 (C) tb-software 2015 Page 1 of 6 1 Introduction Welcome to LA xlimit, a look ahead, wideband linked-stereo limiter including ISP (inter sample peak) detection and oversampling.
LA xlimit Manual by tb-software 2015 (C) tb-software 2015 Page 1 of 6 1 Introduction Welcome to LA xlimit, a look ahead, wideband linked-stereo limiter including ISP (inter sample peak) detection and oversampling.
Oscilloscopes, logic analyzers ScopeLogicDAQ
 Oscilloscopes, logic analyzers ScopeLogicDAQ ScopeLogicDAQ 2.0 is a comprehensive measurement system used for data acquisition. The device includes a twochannel digital oscilloscope and a logic analyser
LS9 StageMix V6 User Guide
 Welcome: Thank you for downloading the LS9 StageMix ipad app for the Yamaha LS9 digital mixing consoles. The latest firmware version for LS9 can be downloaded from www.yamahaproaudio.com StageMix is an
Import and quantification of a micro titer plate image
 BioNumerics Tutorial: Import and quantification of a micro titer plate image 1 Aims BioNumerics can import character type data from TIFF images. This happens by quantification of the color intensity and/or
!Ill ~ 168. Model490 Dual Input, Dual Trace Automatic Peak Power Meter
 Model490 Dual Input, Dual Trace Automatic Peak Power Meter No other power meter can offer you these features: Help Mode: A Help Mode feature has been added to the Model 490 Automatic Peak Power Meter.
M-16DX 16-Channel Digital Mixer
 M-6DX 6-Channel Digital Mixer Workshop Getting Started with the M-6DX 007 Roland Corporation U.S. All rights reserved. No part of this publication may be reproduced in any form without the written permission