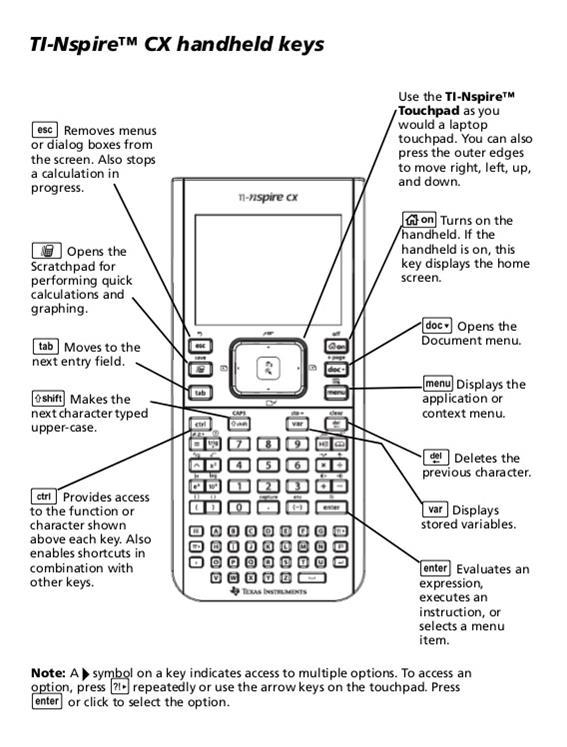
TI-Inspire manual 1. Real old version. This version works well but is not as convenient entering letter
|
|
|
- Eustace Adams
- 6 years ago
- Views:
Transcription


1 TI-Inspire manual 1 Newest version Older version Real old version This version works well but is not as convenient entering letter
2 Instructions TI-Inspire manual 1 General Introduction Ti-Inspire for statistics
3 TI-Inspire manual 2
4 General Instructions TI-Inspire manual 3 Press the On, Off button to go to Home page Quick calculation page Opens a page for entering document and texts Opens a page for calculation. This is different from scratch pad above in that it can be saved. Open a page for entering data in the form of a spread sheet Open a page for plotting and graphing data.
5 TI-Inspire manual 4 Use the middle button to navigate among the choices To select an option press, in the middle button Press [ Enter] (see below)

6 TI-Inspire manual 5 Important If you try to divide numbers TI-Inspire will give you a fraction since a decimal is only an approximation 1 1 Which I am more than happy to live with Deleting Highlight the item or column or number and hit del
7 TI-Inspire manual 6 Finding Mean, Median and Mode Step 1) Open list so you can enter your data Press Click the above icon A new document opens with Lists & Spreadsheet on the

8 Enter your data in a column (you could use any column) TI-Inspire manual 7 But usually start with A Give the column a name using the letter keys Put name in top row beside the letter Put NOTHING in this row for now.


9 TI-Inspire manual 8 use the arrow to select the page you want and then hit enter to go to that page
10 TI-Inspire manual 9 Problem: Find the mean of the number of hours of TV watched by a sample of freshmen men during their first week of college. 35, 28, 29, 31, 36, 26, 23, 34,19 Click [Menu] Enter the Data in the column

11 TI-Inspire manual Give column a title if you wish otherwise it will be known by the letter above it. Generally it is better to give each column a unique title so it can be found easily. Use alphabet keys at the bottom of the calculator to do this Press Menu Hit [Menu].
12 TI-Inspire manual 10 Choose 4: Statistics The choose 1: Stat Calculations Use arrow on navigator button to move left/ right or up/down

13 TI-Inspire manual 11 Choose 1: One-Variable Statistics Step 2) leave num of lists on "1" and and then use Tab to get to [OK] Leave Num of Lists as 1
14 TI-Inspire manual 12 This tells the TI where the data is you want the mean of. columns Leave these three alone Leave Frequency at 1 and leave the others blank This tell the calculator where to put the answers. Choose a column that does not already have data in it because it will override anything that is there You can also press the arrow at the end and it will give you the names of all thedata sets you have at that time and then use Tab to get to [OK] = mean (pronounced X bar ) Scroll down for median and other data

15 TI-Inspire manual 13 Clearing column and/ or rows of Data First columns Use Go to Click the above icon.

16 TI-Inspire manual 14 use center navigator button to the data entry button which will cause it to highlight. Click on the letter and this will cause the whole column to highlight of the top of the column you want to clear When column highlights Hold down [ctrl] and hit [del/clear] Column will empty Several rows or several columns at the same time: Drag to select additional rows or columns Copying rows or columns Use the same procedure as above to highlight the row or column. When it is highlighted press [ctrl] C to copy a column or row and [ctrl] V to paste it.
17 Constructing a Box plot TI-Inspire manual 15 IMPORTANT: The column you want to turn into a box plot must have a name Add a new number to you list of freshman tv watches. This one watches 56 hours a week and probably will not be here the second semester. On Select Graph button to get a graph screen

18 TI-Inspire manual 16 This box will appear Click here Name of several file may appear pick the one you wish to do box plot on

![[Menu] Choose 1:](/docs-images/73/69285240/images/19-1.jpg "Plot type Choose 2")
19 TI-Inspire manual 17 It looks this [Menu] Choose 1: Plot type Choose 2 Box plot

20 TI-Inspire manual 18 Move the arrow over part of the box or the outlier and it becomes a hand the number that appears is the where the outliers start. In this case 36 is not an outlier but anything greater is Move the hand to the line in the middle o fhte box and it will give you the median. Inthis case 30
21 TI-Inspire manual 19 Move the hand to the bottom of the box and it will give you Q1, etc. The dot by itself to the left is an outlier and is our 56 hour tv watcher
22 TI-Inspire manual 20 How to find Standard Deviation Go to Press Home List & spread sheet/ Data Entry Click the above icon. Enter data and give the column a name
23 4:Statistics 1: Stat Calculations 1:One Variable Statistics TI-Inspire manual 20
24 TI-Inspire manual 21 leave on "1" Press center button or Enter to [OK] and press
25 TI-Inspire manual 22 Leave Num of Lists as 1 The [OK] Tab to the last slot and then use Tab to get to [OK] This tells the TI where the data is you want the mean of. columns Leave these three alone Leave Frequency at 1 and leave the others blank Tab to [OK] This tell the calculator where to put the answers. Choose a column that does not already have data in it because it will override anything that is there


26 TI-Inspire manual 23 There are two standard deviations Sx is for a sample x is for a population You can also press the arrow at the end and it will give you the names of all the data sets you have at that time Sx is the standard deviation for a sample and the one you want to use
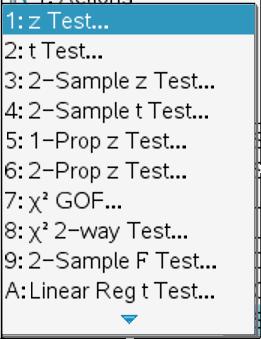
27 One sample Z-test TI-Inspire manual 24 Local citizens have been concerned that the reading program in the public schools may be inferior. The superintendent hires you to conduct an experiment to investigate. You set a = 0.05 (alpha level) for making your decision. You compare the reading level of current high school seniors to national reading proficient norms which are normally distributed with M = 75 and SD = 16. You administer the reading test to 100 randomly selected high school seniors in your city. The obtained mean of the sample = 72. What is your conclusion? [On] [Home] Calculator button at bottom [Menu] 6:Statistics 7: Stat Tests 1:zTest Push center
28 TI-Inspire manual 25


29 TI-Inspire manual 26 National mean National SD Our sample mean Our sample size Our hypothesis: there is not difference between our sample and the comparison sample The results are not significantly different. Z(100)=-1.875, p>.05 However, at.060 it s awful close to being significantly different!
30 TI-Inspire manual 27 One sample T-tests The United States has the highest teen pregnancy rate in the western world, despite the fact that US teens are not more sexually active than Swedish teens, Canadian teens, or British teens. The mean teenage pregnancy rate in the US is 11.85% The rates for states in the this area ( based on survey of year olds) Arkansas 17.28% Mississippi Louisiana 17.05% Texas 15.25% H O : There is no significant difference in the pregnancy rate of the states of Arkansas, Mississippi, Louisiana and Texas compared to the rest of the nation H A: There is no significant difference in the mean teenage pregnancy rate of the four states sample and the US average. Other Alternative hypothesis are of course possible.


31 TI-Inspire manual 28 Open a spread sheet Put the date into column as a list title it teen then choose 4: Statistics then choose 4:Stat Tests


32 TI-Inspire manual 29 Choose 2: t Test It is designed to test a sample against a larger known mean Choose Data because you entered your data into a column on the Spreadsheet page Click OK µ0: mean you a comparing to List: is the column where you put the data from your sample Frequency: always 1 Alternate Hyp: Three hypothesis are possible A two sided Ha: µ µ0 My sample mean is significantly different from the population mean, great or less it doesn t matter it s just significantly different. Ha: µ > µ0 My sample is greater, bigger, etc. than the national mean Ha: µ < µ0 My sample is less smaller, etc. than the national mean
 = 7.29, p <.006. The pregnancy rate for the nation was 11.85 and for the four states in question the average was 17.")
33 TI-Inspire manual 30 These results would be reported as There is a significant difference in the pregnancy rate of the states of Arkansas, Mississippi, Louisiana and Texas compared to the rest of the nation. t(3) = 7.29, p <.006. The pregnancy rate for the nation was and for the four states in question the average was 17.05, s = 1.43
34 TI-Inspire manual 31 However, if you are given the mean for the data the procedure is different The average age of mothers in the US when they give birth to their first child is x = 2.6. The average age of a sample of 200 women from the Arkansas Delta region is Our hypothesis is: Ha: The age of mothers giving birth to their first child is significantly lower in the Delta region of Arkansas than the national average of the sample is significantly lower than the national average. Ha: µ < µ0 [On] [Home] Calculator button at bottom [Menu] :Statistics 7: Stat Tests 1:zTest Push center

![region) is significantly lower than the Pick column for results and the [OK] These results would be written:](/docs-images/73/69285240/images/35-1.jpg "A significant difference (p<.")
 = -18.49, p <.000. With the mean for the nation being 25.")
35 TI-Inspire manual 32 Press 4: Statistics 4:Stat Tests" 2:t-test choose "Stats" this time Sample mean National standard deviation National mean N in our sample In this case our hypothesis is that our sample (Delta region) is significantly lower than the Pick column for results and the [OK] These results would be written: A significant difference (p<.000)was found in the mean age for mother giving birth to their first child in the Arkansas Delta region than the national average. t (199) = , p <.000. With the mean for the nation being 25.1 and the mean for the delta region of Arkansas being Means are usually given in addition to the t scores
36 TI-Inspire manual 33 when the difference is significant. Two Independent Sample T-Test This t-test is used when you have two separate sample that you are comparing. (They do not have to be the same size.) Ie. Rainfall in one city to rainfall in another, female scores on a selfesteem test compared to males scores on the same test. The Inspire has a 2-Sample T-Test Enter the data for the two groups you are comparing in two, usually columns 1 & 2. Give them a title Honolulu-Average Phoenix-Average San Francisco-Average Little Rock - average month Avg. month Avg. month Avg. month Ave January 73 January 54 January 51 January 44 February 73 February 58 February 54 February 46 March 75 March 63 March 55 March 56 April 76 April 71 April 56 April 63 May 78 May 79 May 57 May 71 June 80 June 89 June 59 June 80 July 81 July 93 July 60 July 81 August 81 August 91 August 61 August 83 September 81 September 86 September 63 September 75 October 80 October 75 October 62 October 62 November 75 November 62 November 57 November 54 December 74 December 55 December 52 December 44 Ho mo Jan Feb Ma Ap Ma Jun Jul Au Sep Oc No De


37 TI-Inspire manual 34 Enter Data into columns and title [menu] 4:Statistics 4:Stat Tests 4:2 Sample t Test Choose Data is your data is in columns Choose stat if you have mean and standard deviation


38 TI-Inspire manual 35 Pick the two columns of data you wish to compare. Of the four in this case any two can be chosen but only at a time. Put one name in list 1 and the other in list 2. Order does not matter Choose Alternative hypothesis (Ha:) from the drop down list µ1>µ2 the first group is significantly more, faster, greater, etc. than the second group µ1<µ2 the first group is significantly less than, smaller, etc, than the second group Leave frequency alone µ1 µ2 the difference between group 1 and group 2 is not significant
, use pooled t(22) = - 1.1841, p <.")

 with Honolulu mean temperature being 77.25 and Little Rocks mean = 63.25 (s = 14.")
39 TI-Inspire manual 36 Since it seems logical that Honolulu has a higher average than Little Rock choose 1 < 2 If the two standard deviations are similar (neither is more than twice of the other), use pooled t(22) = , p <.002 Scroll down and you find the means and Honolulu s mean = while Little Rock s mean temperature = Wriitten this way There was a significant difference(p <.002) in th eaverage temperatures of Little Rock and Honolulu, t(22) = , p <.002( s= 3.2) with Honolulu mean temperature being and Little Rocks mean = (s = 14.65) It was said earlier to used pooled unless one standard deviation and more than 2 times which in this case it is. Repeat the statistic usign non-pooled) The result change only slightly. t(12.8) = 3.23, p <.004
40 TI-Inspire manual 40 Matched pairs t-test want to know if subjects have more anxiety after they watch a slasher flick or after watching the evening news. I will measure anxiety with a state anxiety scale. The higher the score the more anxiety. I will use the same subjects twice but to compensate for order effect" I will reverse the order they see the two shows Subject Slasher flick Evening news Subject Evening news Slasher flick

41 TI-Inspire manual 40 This can be treated in terms of two columns since order is not a factor. Subject Slasher flick Evening news Put Slasher Data in Column A and news data in Column B Title each appropriately Title third column diff In the area just below this title type the following formula =a[ ]-b[ ] Hit enter and the difference will appear in the column below. This tell the calculator to subtract column b from column a dn put the difference in c
")
![into [ ] Go to Menu 4:](/docs-images/73/69285240/images/42-1.jpg "Statistics 4: Stat Test 2:t")


42 TI-Inspire manual 40 use [ctrl] That will turn ( ) into [ ] Go to Menu 4: Statistics 4: Stat Test 2:t test you are not using the 2 sample t-test because you are measuring the actual difference against 0 Data method input is Data For use 0 Always choose 0 The two tailed test Put your results in d
43 TI-Inspire manual 40 Anova Doing an ANOVA on the TI is amazing simple if you have been doing t-tests You wish to determine if College status (Fr, Soph, Jr, Sr) affects the number of time in a month that a male student goes out Goes out is defined as leaving the dorm for reason other than going home, to eat in the cafeteria, to class, to chapel, business, checking mail, or study. Dating, cruising, hanging out with the guys /"girls" would all be considered going out A sample was taken and the number of times during the school week (Mon to Fri) for 24 students over a 9-week period are given in the following table. Fr Soph Jr Sr Enter the data in to four columns and title them [Menu] 4: Statistics 4: Stat tests


44 C: AVOVA TI-Inspire manual 41 Number of groups is the number of columns. In the previous window, you indicated you had four group. Now you need to give the TI the names of the four groups. And then tell the programs where to put the answer.

45 TI-Inspire manual 42 F(3, 20) = 3.7, p <.03 You will have to scroll down for the second df, it is called the dferror

46 TI-Inspire manual 43 A source table can also be constructed from the information above The Within data row is filled with the error data from the TI Source SS df MS F p Between <.001 Within Total
![TI-Inspire manual 44 Correlations Enter the data you want to correlate into two columns in the Data and Spreadsheet. This would usually be columns A [ ] and B[ ], title them.](/docs-images/73/69285240/images/47-0.jpg "Levels of Anger 3 23 8 24 4 30 11 45 6 22 7 18 5 16 10 42 7 19 6 24 2 26 Levels of depression Punch [menu] \"4:Statistics\" \"1: Stat Calculations\" \"4:Linear Regressions(a+bx) There is also a 3: Linear")
47 TI-Inspire manual 44 Correlations Enter the data you want to correlate into two columns in the Data and Spreadsheet. This would usually be columns A [ ] and B[ ], title them. Levels of Anger Levels of depression Punch [menu] "4:Statistics" "1: Stat Calculations" "4:Linear Regressions(a+bx) There is also a 3: Linear Regression with the formula (mx+b) This one will give you a correlation but it will also give you extra data you don t want to bother with. Avoid it. X List is usually the factor you believe affects the second. If you just believe there is a relationship either factor can be X Y List is usually the factor affected by the X factor. Again if you are just positing a relationship either factor can be Y
48 Leave Save RegEqu to alone Leave Frequency as 1 TI-Inspire manual 45 Skip Category List and Include Categories Put results in an empty column r = correlation

49 Regression TI-Inspire manual 46 Getting a and b on the TI-Nspire to run a regression Run a correlation and look again it gives you a and b (see example above)

50 TI-Inspire manual 47 Chi Square As an example assume the following Chi Square or matrix Believes in Santa Does not Believe in Santa male female Undecided about The jolly old man First set up a matrix with your numbers choose calculator page (not scratch pad)
![On the calculator page type [35,43,27:43,25,10] a TI-Inspire](/docs-images/73/69285240/images/51-0.jpg "manual 48 [ctrl] and ( will give you the [ ] brackets The comma")

51 On the calculator page type [35,43,27:43,25,10] a TI-Inspire manual 48 [ctrl] and ( will give you the [ ] brackets The comma is to the left of the o Choose semi-colon The semi-colon is activated by the? button which produces a number of special symbols Choose ;
![On the calculator page type [35,43,273,25,10] a TI-Inspire manual 49 After you have closed the bracket store the matrix in letter a you](/docs-images/73/69285240/images/52-0.jpg "can store it in a different letter if a is already being used.")
52 On the calculator page type [35,43,273,25,10] a TI-Inspire manual 49 After you have closed the bracket store the matrix in letter a you can store it in a different letter if a is already being used. The is the store command sto which is activated by first hitting [ctrl] [ENTER]
![TI-Inspire manual 50 [Menu] 6: Statistics 7: stat tests 8: χ 2 2-way Test [Enter] Choose the letter a or](/docs-images/73/69285240/images/53-0.jpg "whatever you designated the matrix as for the Observed Matrix: [OK] You now have both χ 2 and you p")
53 TI-Inspire manual 50 [Menu] 6: Statistics 7: stat tests 8: χ 2 2-way Test [Enter] Choose the letter a or whatever you designated the matrix as for the Observed Matrix: [OK] You now have both χ 2 and you p value

54 TI-Inspire manual 50 Goodness of Fit 1 X Put observed numbers in column a(and name) Put expected number in column b ( and name) M&M S PEANUT: 23% cyan blue, 23% orange, 15% green, 15% bright yellow, 12% red, 12% brown. Expected can be either 1. Total divided by number of factors; You are saying that all factors will have equal amounts i.e. In the case of bags of M&M s you would be saying that there is an equal number of each color in each bag There are an average of 35 peanut M & Ms in each package and there are 6 colors 35/6 = A known statistic you are comparing your results to./ ie. We compare the number of M&M s, by color, in a sample of bags to the number of each color the company claims on its website. Assuming a bag of 35 then by percent it would be 9 blue, 8 orange, 4 green, 5 yellow, 5 red and 4 blue(roughly) [Menu]

55 TI-Inspire manual 50 The bag I opened for this sample included 12 blue 7 orange 3 green, 3 yellow 4 red 5 brown Enter data into two columns [menu] 4: Statistics 4: Stat Tests 7: χ 2 GOF [ENTER]


56 TI-Inspire manual 51 Observed List is the location of the list your sample produced, your bag in this case, column a Expected List is the location of either 1. Total/N 2. Comparison data you are using 3. df = number of categories - 1 [OK] The results gives us our χ 2 and probability
Why t? TEACHER NOTES MATH NSPIRED. Math Objectives. Vocabulary. About the Lesson
 Math Objectives Students will recognize that when the population standard deviation is unknown, it must be estimated from the sample in order to calculate a standardized test statistic. Students will recognize
E X P E R I M E N T 1
 E X P E R I M E N T 1 Getting to Know Data Studio Produced by the Physics Staff at Collin College Copyright Collin College Physics Department. All Rights Reserved. University Physics, Exp 1: Getting to
AP Statistics Sampling. Sampling Exercise (adapted from a document from the NCSSM Leadership Institute, July 2000).
.") AP Statistics Sampling Name Sampling Exercise (adapted from a document from the NCSSM Leadership Institute, July 2000). Problem: A farmer has just cleared a field for corn that can be divided into 100
AP Statistics Sampling Name Sampling Exercise (adapted from a document from the NCSSM Leadership Institute, July 2000). Problem: A farmer has just cleared a field for corn that can be divided into 100
Algebra I Module 2 Lessons 1 19
 Eureka Math 2015 2016 Algebra I Module 2 Lessons 1 19 Eureka Math, Published by the non-profit Great Minds. Copyright 2015 Great Minds. No part of this work may be reproduced, distributed, modified, sold,
Homework Packet Week #5 All problems with answers or work are examples.
 Lesson 8.1 Construct the graphical display for each given data set. Describe the distribution of the data. 1. Construct a box-and-whisker plot to display the number of miles from school that a number of
AP Statistics Sec 5.1: An Exercise in Sampling: The Corn Field
 AP Statistics Sec.: An Exercise in Sampling: The Corn Field Name: A farmer has planted a new field for corn. It is a rectangular plot of land with a river that runs along the right side of the field. The
1.1 Cable Schedule Table
 Category 1 1.1 Cable Schedule Table The Cable Schedule Table is all objects that have been given a tag number and require electrical linking by the means of Power Control communications and Data cables.
Word Tutorial 2: Editing and Formatting a Document
 Word Tutorial 2: Editing and Formatting a Document Microsoft Office 2010 Objectives Create bulleted and numbered lists Move text within a document Find and replace text Check spelling and grammar Format
W A T C H. Using Your Remote Control. 145 N. Main Lenora, KS toll free
 W A T C H Using Your Remote Control 145 N. Main Lenora, KS 67645 toll free 877-567-7872 ADB 3800 TV - Sends commands to TV DVD - Sends commands to DVD STB - Sends commands to set-top box Setup AV - Choose
Discriminant Analysis. DFs
 Discriminant Analysis Chichang Xiong Kelly Kinahan COM 631 March 27, 2013 I. Model Using the Humor and Public Opinion Data Set (Neuendorf & Skalski, 2010) IVs: C44 reverse coded C17 C22 C23 C27 reverse
Moving on from MSTAT. March The University of Reading Statistical Services Centre Biometrics Advisory and Support Service to DFID
 Moving on from MSTAT March 2000 The University of Reading Statistical Services Centre Biometrics Advisory and Support Service to DFID Contents 1. Introduction 3 2. Moving from MSTAT to Genstat 4 2.1 Analysis
SECTION I. THE MODEL. Discriminant Analysis Presentation~ REVISION Marcy Saxton and Jenn Stoneking DF1 DF2 DF3
 Discriminant Analysis Presentation~ REVISION Marcy Saxton and Jenn Stoneking COM 631/731--Multivariate Statistical Methods Instructor: Prof. Kim Neuendorf (k.neuendorf@csuohio.edu) Cleveland State University,
Blueline, Linefree, Accuracy Ratio, & Moving Absolute Mean Ratio Charts
 INTRODUCTION This instruction manual describes for users of the Excel Standard Celeration Template(s) the features of each page or worksheet in the template, allowing the user to set up and generate charts
COMP Test on Psychology 320 Check on Mastery of Prerequisites
 COMP Test on Psychology 320 Check on Mastery of Prerequisites This test is designed to provide you and your instructor with information on your mastery of the basic content of Psychology 320. The results
I. Model. Q29a. I love the options at my fingertips today, watching videos on my phone, texting, and streaming films. Main Effect X1: Gender
 1 Hopewell, Sonoyta & Walker, Krista COM 631/731 Multivariate Statistical Methods Dr. Kim Neuendorf Film & TV National Survey dataset (2014) by Jeffres & Neuendorf MANOVA Class Presentation I. Model INDEPENDENT
Dot Plots and Distributions
 EXTENSION Dot Plots and Distributions A dot plot is a data representation that uses a number line and x s, dots, or other symbols to show frequency. Dot plots are sometimes called line plots. E X A M P
Digital Video User s Guide
 Digital Video User s Guide THE Future now showing www.ntscom.com Welcome the new way to watch Digital TV is TV different than anything you have seen before. It isn t cable it s better. Digital TV offers
Resampling Statistics. Conventional Statistics. Resampling Statistics
 Resampling Statistics Introduction to Resampling Probability Modeling Resample add-in Bootstrapping values, vectors, matrices R boot package Conclusions Conventional Statistics Assumptions of conventional
DV: Liking Cartoon Comedy
 1 Stepwise Multiple Regression Model Rikki Price Com 631/731 March 24, 2016 I. MODEL Block 1 Block 2 DV: Liking Cartoon Comedy 2 Block Stepwise Block 1 = Demographics: Item: Age (G2) Item: Political Philosophy
What is Statistics? 13.1 What is Statistics? Statistics
 13.1 What is Statistics? What is Statistics? The collection of all outcomes, responses, measurements, or counts that are of interest. A portion or subset of the population. Statistics Is the science of
1) Open EndNote. When asked, choose an existing library or Create a New Library.
 Open EndNote. When asked, choose an existing library or Create a New Library.") What is EndNote? EndNote is a program that lets you collect and organize a database of bibliographic references. You can use EndNote to connect to the UVM library catalog or to other online databases and
What is EndNote? EndNote is a program that lets you collect and organize a database of bibliographic references. You can use EndNote to connect to the UVM library catalog or to other online databases and
Vision Call Statistics User Guide
 The Vision Call Reporting package is a web based near real time statistical tool that enables users to understand the call flow of inbound traffic both in terms of where calls have come from and also how
TV User s Guide THE FUTURE NOW SHOWING. New and Improved Movies On Demand Screen!
 TV User s Guide THE FUTURE NOW SHOWING New and Improved Movies On Demand Screen! Welcome The NEW WAY to WATCH Endeavor Digital TV is different than anything you have seen before. It isn t cable it s better!
APA Research Paper Chapter 2 Supplement
 Microsoft Office Word 00 Appendix D APA Research Paper Chapter Supplement Project Research Paper Based on APA Documentation Style As described in Chapter, two popular documentation styles for research
More About Regression
 Regression Line for the Sample Chapter 14 More About Regression is spoken as y-hat, and it is also referred to either as predicted y or estimated y. b 0 is the intercept of the straight line. The intercept
UNIVERSITY OF MASSACHUSETTS Department of Biostatistics and Epidemiology BioEpi 540W - Introduction to Biostatistics Fall 2002
 1 UNIVERSITY OF MASSACHUSETTS Department of Biostatistics and Epidemiology BioEpi 540W - Introduction to Biostatistics Fall 2002 Exercises Unit 2 Descriptive Statistics Tables and Graphs Due: Monday September
Exercise #1: Create and Revise a Smart Group
 EndNote X7 Advanced: Hands-On for CDPH Sheldon Margen Public Health Library, UC Berkeley Exercise #1: Create and Revise a Smart Group Objective: Learn how to create and revise Smart Groups to automate
Digital Video User s Guide THE FUTURE NOW SHOWING
 Digital Video User s Guide THE FUTURE NOW SHOWING Welcome The NEW WAY to WATCH Digital TV is different than anything you have seen before. It isn t cable it s better! Digital TV offers great channels,
Initially, you can access the Schedule Xpress Scheduler from any repair order screen.
 Chapter 4 Schedule Xpress Scheduler Schedule Xpress Scheduler The Schedule Xpress scheduler is a quick scheduler that allows you to schedule appointments from the Repair Order screens. At the time of scheduling,
7 DVR. The far right box indicates the current time.
 Introducing DVR DVR allows you to record programs digitally without the need for tapes or discs, as well as pause live TV. Note: If your set top box does not support Recording, please contact customer
02 MLA Manuscript Format: The Humanities Standard
 02 MLA Manuscript Format: The Humanities Standard Writing in the Humanities in disciplines such as English, literary studies, philosophy, cultural studies, foreign language studies, and other related subjects
LAB 1: Plotting a GM Plateau and Introduction to Statistical Distribution. A. Plotting a GM Plateau. This lab will have two sections, A and B.
 LAB 1: Plotting a GM Plateau and Introduction to Statistical Distribution This lab will have two sections, A and B. Students are supposed to write separate lab reports on section A and B, and submit the
Wilkes Repair: wilkes.net River Street, Wilkesboro, NC COMMUNICATIONS
 1 Wilkes COMMUNICATIONS 336.973.3103 877.973.3104 Repair: 336.973.4000 Email: wilkesinfo@wilkes.net wilkes.net 1400 River Street, Wilkesboro, NC 28697 2 Table of Contents REMOTE CONTROL DIAGRAM 4 PLAYBACK
Frequency Response and Standard background Overview of BAL-003-1
 Industry Webinar BAL-003-1 Draft Frequency Response Standard and Supporting Process July 18, 2011 Agenda Frequency Response and Standard background Overview of BAL-003-1 What s changing Field Trial Frequency
Table of Contents Introduction
 Page 1/9 Waveforms 2015 tutorial 3-Jan-18 Table of Contents Introduction Introduction to DAD/NAD and Waveforms 2015... 2 Digital Functions Static I/O... 2 LEDs... 2 Buttons... 2 Switches... 2 Pattern Generator...
Digital Video User s Guide THE FUTURE NOW SHOWING
 Digital Video User s Guide THE FUTURE NOW SHOWING Welcome THE NEW WAY TO WATCH Digital TV is different than anything you have seen before. It isn t cable it s better. Digital TV offers great channels,
1. Model. Discriminant Analysis COM 631. Spring Devin Kelly. Dataset: Film and TV Usage National Survey 2015 (Jeffres & Neuendorf) Q23a. Q23b.
 Q23a. Q23b.") 1 Discriminant Analysis COM 631 Spring 2016 Devin Kelly 1. Model Dataset: Film and TV Usage National Survey 2015 (Jeffres & Neuendorf) Q23a. Q23b. Q23c. DF1 Q23d. Q23e. Q23f. Q23g. Q23h. DF2 DF3 CultClass
1 Discriminant Analysis COM 631 Spring 2016 Devin Kelly 1. Model Dataset: Film and TV Usage National Survey 2015 (Jeffres & Neuendorf) Q23a. Q23b. Q23c. DF1 Q23d. Q23e. Q23f. Q23g. Q23h. DF2 DF3 CultClass
TL-2900 AMMONIA & NITRATE ANALYZER DUAL CHANNEL
 TL-2900 AMMONIA & NITRATE ANALYZER DUAL CHANNEL DATA ACQUISITION SYSTEM V.15.4 INSTRUCTION MANUAL Timberline Instruments, LLC 1880 S. Flatiron Ct., Unit I Boulder, Colorado 80301 Ph: (303) 440-8779 Fx:
Chapter 1 Midterm Review
 Name: Class: Date: Chapter 1 Midterm Review Multiple Choice Identify the choice that best completes the statement or answers the question. 1. A survey typically records many variables of interest to the
Digital Video User s Guide THE FUTURE NOW SHOWING
 Digital Video User s Guide THE FUTURE NOW SHOWING TV Welcome The NEW WAY to WATCH Digital TV is different than anything you have seen before. It isn t cable it s better! Digital TV offers great channels,
Comparing Distributions of Univariate Data
 . Chapter 3 Comparing Distributions of Univariate Data Topic 9 covers comparing data and constructing multiple univariate plots. Topic 9 Multiple Univariate Plots Example: Building heights in Philadelphia,
Celect Communications. Complete TV Users Guide
 Celect Communications Complete TV Users Guide 1 Contents Setting up your Remote... 4 Remote Guide... 5 Using the Guide Button... 8 Searching...10 Reminders...12 DVR Guide...13 Important Note...26 TV Main
HD Guide. User Manual
 HD Guide. User Manual You ve decided you want better TV. Here s how to enjoy it. Welcome to Shaw HD TV. To get the most out of your experience, it s best to know absolutely everything the service offers.
Complete TV Users Guide
 Celect Communications Complete TV Users Guide Connected Your pathway to the world 1 2 Contents Setting up your Remote... 4 Remote Guide... 5 Using the Guide Button... 8 Searching...10 Reminders...12 DVR
Chapter 27. Inferences for Regression. Remembering Regression. An Example: Body Fat and Waist Size. Remembering Regression (cont.)
") Chapter 27 Inferences for Regression Copyright 2007 Pearson Education, Inc. Publishing as Pearson Addison-Wesley Slide 27-1 Copyright 2007 Pearson Education, Inc. Publishing as Pearson Addison-Wesley An
Chapter 27 Inferences for Regression Copyright 2007 Pearson Education, Inc. Publishing as Pearson Addison-Wesley Slide 27-1 Copyright 2007 Pearson Education, Inc. Publishing as Pearson Addison-Wesley An
USER GUIDE. Get the most out of your DTC TV service!
 TV USER GUIDE Get the most out of your DTC TV service! 1 800-367-4274 www.dtccom.net TV Customer Care Technical Support 615-529-2955 615-273-8288 Carthage Area Carthage Area 615-588-1277 615-588-1282 www.dtccom.net
ToshibaEdit. Contents:
 ToshibaEdit Contents: 1 General 2 Installation 3 Step by step a Load and back up a settings file b Arrange settings c Provider d The favourite lists e Channel parameters f Write settings into the receiver
Calculated Percentage = Number of color specific M&M s x 100% Total Number of M&M s (from the same row)
") Name: Date: Period: The M&M (not the rapper) Lab Who would have guessed that the idea for M&M s Plain Chocolate Candies was hatched against the backdrop of the Spanish Civil War? Legend has it that, while
Name: Date: Period: The M&M (not the rapper) Lab Who would have guessed that the idea for M&M s Plain Chocolate Candies was hatched against the backdrop of the Spanish Civil War? Legend has it that, while
Formatting Dissertations or Theses for UMass Amherst with MacWord 2008
 January 2015 Formatting Dissertations or Theses for UMass Amherst with MacWord 2008 Getting started make your life easy (or easier at least) 1. Read the Graduate School s Guidelines and follow their rules.
Relationships Between Quantitative Variables
 Chapter 5 Relationships Between Quantitative Variables Three Tools we will use Scatterplot, a two-dimensional graph of data values Correlation, a statistic that measures the strength and direction of a
Getting Started. Connect green audio output of SpikerBox/SpikerShield using green cable to your headphones input on iphone/ipad.
 Getting Started First thing you should do is to connect your iphone or ipad to SpikerBox with a green smartphone cable. Green cable comes with designators on each end of the cable ( Smartphone and SpikerBox
Remote Control Operation
 Remote Control Operation When you first switch the TV on, you will be presented with either the preview screen which shows the current program along with a brief summary of future programs or the full
Digital Video User s Guide. the Future. now showing
 Digital Video User s Guide the Future now showing Welcome the new way to watch Digital TV is TV different than anything you have seen before. It isn t cable it s better. Digital TV offers great channels,
Introduction to EndNote
 Library Services Introduction to EndNote Part 2: Creating an EndNote Library Table of Contents: Part 2 2. CREATING AN ENDNOTE LIBRARY - 3-2.1. CREATING A NEW LIBRARY - 3-2.2. ENTERING NEW REFERENCES MANUALLY
Footnotes and Endnotes
 Footnotes and Endnotes Sometimes when writing a paper it is necessary to insert text at the bottom of a page in a document to reference something on that page. You do this by placing a footnote at the
MIS 0855 Data Science (Section 005) Fall 2016 In-Class Exercise (Week 6) Advanced Data Visualization with Tableau
 Fall 2016 In-Class Exercise (Week 6) Advanced Data Visualization with Tableau") MIS 0855 Data Science (Section 005) Fall 2016 In-Class Exercise (Week 6) Advanced Data Visualization with Tableau Objective: Learn how to use Tableau s advanced data visualization tools Learning Outcomes:
MIS 0855 Data Science (Section 005) Fall 2016 In-Class Exercise (Week 6) Advanced Data Visualization with Tableau Objective: Learn how to use Tableau s advanced data visualization tools Learning Outcomes:
Relationships. Between Quantitative Variables. Chapter 5. Copyright 2006 Brooks/Cole, a division of Thomson Learning, Inc.
 Relationships Chapter 5 Between Quantitative Variables Copyright 2006 Brooks/Cole, a division of Thomson Learning, Inc. Three Tools we will use Scatterplot, a two-dimensional graph of data values Correlation,
MANOVA COM 631/731 Spring 2017 M. DANIELS. From Jeffres & Neuendorf (2015) Film and TV Usage National Survey
 Film and TV Usage National Survey") 1 MANOVA COM 631/731 Spring 2017 M. DANIELS I. MODEL From Jeffres & Neuendorf (2015) Film and TV Usage National Survey INDEPENDENT VARIABLES DEPENDENT VARIABLES X1: GENDER Q23a. I often watch a favorite
1 MANOVA COM 631/731 Spring 2017 M. DANIELS I. MODEL From Jeffres & Neuendorf (2015) Film and TV Usage National Survey INDEPENDENT VARIABLES DEPENDENT VARIABLES X1: GENDER Q23a. I often watch a favorite
Digital Video User s Guide THE FUTURE NOW SHOWING
 Digital Video User s Guide THE FUTURE NOW SHOWING Welcome The NEW WAY To WATCH Digital TV is different than anything you have seen before. It isn t cable it s better! Digital TV offers great channels,
STAT 113: Statistics and Society Ellen Gundlach, Purdue University. (Chapters refer to Moore and Notz, Statistics: Concepts and Controversies, 8e)
") STAT 113: Statistics and Society Ellen Gundlach, Purdue University (Chapters refer to Moore and Notz, Statistics: Concepts and Controversies, 8e) Learning Objectives for Exam 1: Unit 1, Part 1: Population
STAT 113: Statistics and Society Ellen Gundlach, Purdue University (Chapters refer to Moore and Notz, Statistics: Concepts and Controversies, 8e) Learning Objectives for Exam 1: Unit 1, Part 1: Population
Tech Essentials Final Part A (Use the Scantron to record your answers) 1. What are the margins for an MLA report? a. All margins are 1 b. Top 2.
 1. What are the margins for an MLA report? a. All margins are 1 b. Top 2.") Tech Essentials Final Part A (Use the Scantron to record your answers) 1. What are the margins for an MLA report? a. All margins are 1 b. Top 2.5, left, right and bottom 1 c. Top 2, left and right 1.25
Tech Essentials Final Part A (Use the Scantron to record your answers) 1. What are the margins for an MLA report? a. All margins are 1 b. Top 2.5, left, right and bottom 1 c. Top 2, left and right 1.25
Using DICTION. Some Basics. Importing Files. Analyzing Texts
 Some Basics 1. DICTION organizes its work units by Projects. Each Project contains three folders: Project Dictionaries, Input, and Output. 2. DICTION has three distinct windows: the Project Explorer window
Introduction to capella 8
 Introduction to capella 8 p Dear user, in eleven steps the following course makes you familiar with the basic functions of capella 8. This introduction addresses users who now start to work with capella
User s Manual. Log Scale (/LG) GX10/GX20/GP10/GP20/GM10 IM 04L51B01-06EN. 2nd Edition
 GX10/GX20/GP10/GP20/GM10 IM 04L51B01-06EN. 2nd Edition") User s Manual Model GX10/GX20/GP10/GP20/GM10 Log Scale (/LG) User s Manual 2nd Edition Introduction Notes Trademarks Thank you for purchasing the SMARTDAC+ Series GX10/GX20/GP10/GP20/GM10 (hereafter referred
User s Manual Model GX10/GX20/GP10/GP20/GM10 Log Scale (/LG) User s Manual 2nd Edition Introduction Notes Trademarks Thank you for purchasing the SMARTDAC+ Series GX10/GX20/GP10/GP20/GM10 (hereafter referred
Ebook Purchasing Instructions for School Devices
 Ebook Purchasing Instructions for School Devices Revised 8/25/2015 Ebook Lookup: When looking up Ebooks on the Barnes & Noble website to get pricing and ISBN information, be sure to type in ebook in the
IPTV Users Guide THE FUTURE NOW SHOWING
 IPTV Users Guide THE FUTURE NOW SHOWING THE FUTURE NOW SHOWING exclusively on IPTV IPTV is TV different than anything you have seen before. It isn t cable it s better. IPTV offers more channels, more features
Import and quantification of a micro titer plate image
 BioNumerics Tutorial: Import and quantification of a micro titer plate image 1 Aims BioNumerics can import character type data from TIFF images. This happens by quantification of the color intensity and/or
MATH 214 (NOTES) Math 214 Al Nosedal. Department of Mathematics Indiana University of Pennsylvania. MATH 214 (NOTES) p. 1/3
 Math 214 Al Nosedal. Department of Mathematics Indiana University of Pennsylvania. MATH 214 (NOTES) p. 1/3") MATH 214 (NOTES) Math 214 Al Nosedal Department of Mathematics Indiana University of Pennsylvania MATH 214 (NOTES) p. 1/3 CHAPTER 1 DATA AND STATISTICS MATH 214 (NOTES) p. 2/3 Definitions. Statistics is
MATH 214 (NOTES) Math 214 Al Nosedal Department of Mathematics Indiana University of Pennsylvania MATH 214 (NOTES) p. 1/3 CHAPTER 1 DATA AND STATISTICS MATH 214 (NOTES) p. 2/3 Definitions. Statistics is
Frequently Asked Questions
 Frequently Asked Questions General Information 1. Does DICTION run on a Mac? A Mac version is in our plans but is not yet available. Currently, DICTION runs on Windows on a PC. 2. Can DICTION run on a
Western Statistics Teachers Conference 2000
 Teaching Using Ratios 13 Mar, 2000 Teaching Using Ratios 1 Western Statistics Teachers Conference 2000 March 13, 2000 MILO SCHIELD Augsburg College www.augsburg.edu/ppages/schield schield@augsburg.edu
EDL8 Race Dash Manual Engine Management Systems
 Engine Management Systems EDL8 Race Dash Manual Engine Management Systems Page 1 EDL8 Race Dash Page 2 EMS Computers Pty Ltd Unit 9 / 171 Power St Glendenning NSW, 2761 Australia Phone.: +612 9675 1414
What is EndNote? Exercise 1: Entering References
 What is EndNote? EndNote is a program that helps you collect, organize, and use bibliographic references. Use EndNote to connect to the UVM library catalog or to other online databases and download references
MultiSpec Tutorial: Visualizing Growing Degree Day (GDD) Images. In this tutorial, the MultiSpec image processing software will be used to:
 Images. In this tutorial, the MultiSpec image processing software will be used to:") MultiSpec Tutorial: Background: This tutorial illustrates how MultiSpec can me used for handling and analysis of general geospatial images. The image data used in this example is not multispectral data
MultiSpec Tutorial: Background: This tutorial illustrates how MultiSpec can me used for handling and analysis of general geospatial images. The image data used in this example is not multispectral data
Should you have any questions that aren t answered here, simply call us at Live Connected.
 Interactive TV User Guide This is your video operations manual. It provides simple, straightforward instructions for your TV service. From how to use your Remote Control to Video On Demand, this guide
Remote Control/Cloud DVR Guide. Special Instructions INPUT:
 Special Instructions Remote Control/Cloud DVR Guide INPUT: Programming your remote: Turn TV on Press TV Button Press & hold the Setup button until TV button flashes 3 times (1 flash & 2 quick flashes)
Gustavus Adolphus College. Some Scientific Software of Interest
 CHE 372 Gustavus Adolphus College Some Scientific Software of Interest A. Literature Databases There are several literature databases commonly used to conduct scientific literature reviews. The two most
2G Video Wall Guide Just Add Power HD over IP Page1 2G VIDEO WALL GUIDE. Revised
 2G Video Wall Guide Just Add Power HD over IP Page1 2G VIDEO WALL GUIDE Revised 2016-05-09 2G Video Wall Guide Just Add Power HD over IP Page2 Table of Contents Specifications... 4 Requirements for Setup...
User s Manual. Log Scale (/LG) GX10/GX20/GP10/GP20/GM10 IM 04L51B01-06EN. 3rd Edition
 GX10/GX20/GP10/GP20/GM10 IM 04L51B01-06EN. 3rd Edition") User s Manual Model GX10/GX20/GP10/GP20/GM10 Log Scale (/LG) 3rd Edition Introduction Thank you for purchasing the SMARTDAC+ Series GX10/GX20/GP10/GP20/GM10 (hereafter referred to as the recorder, GX,
User s Manual Model GX10/GX20/GP10/GP20/GM10 Log Scale (/LG) 3rd Edition Introduction Thank you for purchasing the SMARTDAC+ Series GX10/GX20/GP10/GP20/GM10 (hereafter referred to as the recorder, GX,
On Your Own. Applications. Unit 2. ii. The following are the pairs of mutual friends: A-C, A-E, B-D, C-D, and D-E.
 Applications 1 a. i. No, students A and D are not mutual friends because D does not consider A a friend. ii. The following are the pairs of mutual friends: A-C, A-E, B-D, C-D, and D-E. iii. Each person
Index. - Registration assistant of momit Home 1 - Start of session/registration 2 - Registration of devices. - momit Home App 1.
 Index - Registration assistant of momit Home 1 - Start of session/registration 2 - Registration of devices - momit Home App 1. Start 2. Device 2.1 Control panel a. State of operation b. Temperature b1.
Technical Specifications
 1 Contents INTRODUCTION...3 ABOUT THIS LAB...3 IMPORTANCE OF THE MODULE...3 APPLYING IMAGE ENHANCEMENTS...4 Adjusting Toolbar Enhancement...4 EDITING A LOOKUP TABLE...5 Trace-editing the LUT...6 Comparing
Digital Video User s Guide THE FUTURE NOW SHOWING
 Digital Video User s Guide THE FUTURE NOW SHOWING Welcome The NEW WAY to WATCH Digital TV is different than anything you have seen before. It isn t cable it s better! Digital TV offers great channels,
MATH& 146 Lesson 11. Section 1.6 Categorical Data
 MATH& 146 Lesson 11 Section 1.6 Categorical Data 1 Frequency The first step to organizing categorical data is to count the number of data values there are in each category of interest. We can organize
Lesson 10. Here are the first two worked out.
 Lesson 10 This page is on word problems. They will be using multiplication, division, addition, and subtraction. They will need to take multiple steps to find the answer to the question. They could use
Measuring Variability for Skewed Distributions
 Measuring Variability for Skewed Distributions Skewed Data and its Measure of Center Consider the following scenario. A television game show, Fact or Fiction, was canceled after nine shows. Many people
Lesson 7: Measuring Variability for Skewed Distributions (Interquartile Range)
") : Measuring Variability for Skewed Distributions (Interquartile Range) Exploratory Challenge 1: Skewed Data and its Measure of Center Consider the following scenario. A television game show, Fact or Fiction,
: Measuring Variability for Skewed Distributions (Interquartile Range) Exploratory Challenge 1: Skewed Data and its Measure of Center Consider the following scenario. A television game show, Fact or Fiction,
The mio TV On Demand. User. Contents
 The mio TV On Demand User Guide Contents 1 Introduction 2 Highlights of mio TV On Demand 3 Navigating the On Demand Interface 3.1 Video On Demand Movies 3.1.1 Rent a Movie 3.1.2 Watch or Resume Playback
Tutorial 3 Normalize step-cycles, average waveform amplitude and the Layout program
 Tutorial 3 Normalize step-cycles, average waveform amplitude and the Layout program Step cycles are defined usually by choosing a recorded ENG waveform that shows long lasting, continuos, consistently
Box Plots. So that I can: look at large amount of data in condensed form.
 LESSON 5 Box Plots LEARNING OBJECTIVES Today I am: creating box plots. So that I can: look at large amount of data in condensed form. I ll know I have it when I can: make observations about the data based
Tutor Led Manual v1.7. Table of Contents PREFACE I.T. Skills Required Before Attempting this Course... 1 Copyright... 2 GETTING STARTED...
 EndNote X7 Tutor Led Manual v1.7 Table of Contents PREFACE... 1 I.T. Skills Required Before Attempting this Course... 1 Copyright... 2 GETTING STARTED... 1 EndNote Explained... 1 Opening the EndNote Program...
Finding Influential journals:
 Finding Influential journals: Journal Citation Reports (powered by Web of Science) Journal Citation Reports uses citation data from Web of Science to help users compare academic journals. You can use it
GBA 327: Module 7D AVP Transcript Title: The Monte Carlo Simulation Using Risk Solver. Title Slide
 GBA 327: Module 7D AVP Transcript Title: The Monte Carlo Simulation Using Risk Solver Title Slide Narrator: Although the use of a data table illustrates how we can apply Monte Carlo simulation to a decision
Linkage 3.6. User s Guide
 Linkage 3.6 User s Guide David Rector Friday, December 01, 2017 Table of Contents Table of Contents... 2 Release Notes (Recently New and Changed Stuff)... 3 Installation... 3 Running the Linkage Program...
Activity P27: Speed of Sound in Air (Sound Sensor)
") Activity P27: Speed of Sound in Air (Sound Sensor) Concept DataStudio ScienceWorkshop (Mac) ScienceWorkshop (Win) Speed of sound P27 Speed of Sound 1.DS (See end of activity) (See end of activity) Equipment
Activity P27: Speed of Sound in Air (Sound Sensor) Concept DataStudio ScienceWorkshop (Mac) ScienceWorkshop (Win) Speed of sound P27 Speed of Sound 1.DS (See end of activity) (See end of activity) Equipment
FOR WWW TEACUPSOFTWARE COM User Guide
 User Guide Table of Contents Quick Start Guide...1 More Information...1 What It Does 1 Pattern Possibilities An Example 2 How It Works 2 PatternMaker and PatternPack 2 Pattern Presets 3 Using PatternMaker...3
Chapter 5 Printing with Calc
 Calc Guide Chapter 5 Printing with Calc OpenOffice.org Copyright This document is Copyright 2005 by its contributors as listed in the section titled Authors. You can distribute it and/or modify it under
Health Sciences Library System University of Pittsburgh. Instructors Andrea Ketchum, MS, MLIS / Patricia Weiss, MLIS /
 E n d N o t e X 7 B a s i c s Health Sciences Library System University of Pittsburgh Instructors Andrea Ketchum, MS, MLIS / ketchum@pitt.edu Patricia Weiss, MLIS / pwf@pitt.edu Health Sciences Library
Using EndNote X7 to Manage Bibliographies on a Mac!
 1 Using EndNote X7 to Manage Bibliographies on a Mac! A Guide to EndNote by Information Services Staff of UTS Library University of Technology, Sydney University Library (May 2014 version) 2 Section Table
Draft last edited May 13, 2013 by Belinda Robertson
 Draft last edited May 13, 2013 by Belinda Robertson 97 98 Appendix A: Prolem Handouts Problem Title Location or Page number 1 CCA Interpreting Algebraic Expressions Map.mathshell.org high school concept
Synergy SIS Attendance Administrator Guide
 Synergy SIS Attendance Administrator Guide Edupoint Educational Systems, LLC 1955 South Val Vista Road, Ste 210 Mesa, AZ 85204 Phone (877) 899-9111 Fax (800) 338-7646 Volume 01, Edition 01, Revision 04