Audience Insight 2015
|
|
|
- Alexander Welch
- 6 years ago
- Views:
Transcription

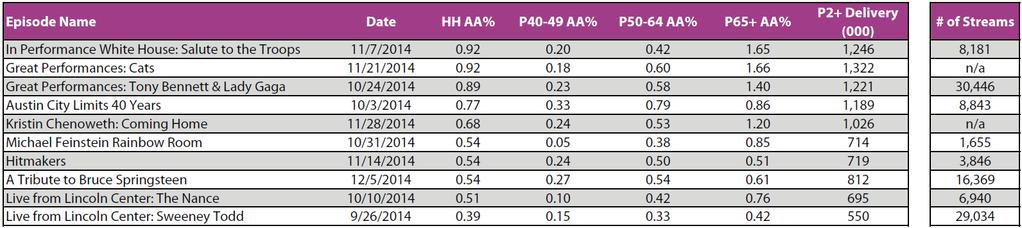
1 Audience Insight 2015 PBS Research publishes this annual audience review for the most recent complete TV season. Public television professionals from programmers and general managers to marketing and development staff will find useful information about the composition of our audiences, the performance of our national programming service, and the competitive landscape. This year, for the first time, we ve folded in valuable information on how PBS content is being consumed on platforms beyond traditional television, data on PBS KIDS content, and trends in the US population and media usage. This book is the most visible expression of a broader strand of work we refer to as Audience Insight. We also produce sessions for the PBS Annual Meeting, providing information on how PBS content is performing during the current season and other topics of interest to meeting attendees. The session is also made available as a webinar for stations, and we offer a number of research-based seminars throughout the year, including quarterly audience reviews, Ratings 101, and mining Nielsen s custom reports. In addition, the Research section of mypbs offers a large selection of downloadable reports including: Past Audience Insight books and webinars Post-Broadcast Analyses on most limited series Quarterly National Audience reports Monthly PBS KIDS reports with TV ratings and digital data Audience profiles by genre to aid in securing underwriting PBS local station lists by DMA and DMA maps Nielsen news, including local and national industry reports published by Nielsen [For local Nielsen clients] Station Audience Reports and County Coverage Reports For more information contact: Beth Walsh, bwalsh@pbs.org For additional copies contact: Gail Malloy, gmalloy@pbs.org Designed and produced by City Square Associates, Inc., May 4, 2016, Version 1.0 Audience Insight 2015 Annual Report Primetime Profile September 22, September 20, 2015 With Comparisons to the and Seasons


2 REFERENCE TOOLS TABLE OF CONTENTS 1 ABOUT THIS BOOK 2 GLOSSARY PART I: PRIMETIME SEASON OVERVIEW 4 PRIMETIME RATINGS BY WEEK; STREAMS AND PRIMETIME RATINGS BY WEEK 5 PRIMETIME RATINGS BY NIGHT; PRIMETIME AUDIENCE COMPOSITION 6 PRIMETIME HH RATINGS FOR TOP 30 NETWORKS 7 PBS VIEWER INDICES: BROADCAST AND CABLE PART II: PRIMETIME SERIES BY GENRE 10 PRIMETIME SERIES RANKER 11 PRIMETIME RATINGS BY GENRE 12 GREAT PERFORMANCES 13 AMERICAN MASTERS 14 PBS FESTIVAL 15 LIVE FROM LINCOLN CENTER/ THE GREAT BRITISH BAKING SHOW 16 ONE-OFFS & LIMITED SERIES 17 MASTERPIECE 18 CALL THE MIDWIFE/ LAST TANGO IN HALIFAX 19 DRAMA ONE-OFFS & LIMITED SERIES 20 NATURE 21 NOVA 22 SCIENCE/NATURE ONE-OFFS & LIMITED SERIES 23 ANTIQUES ROADSHOW 24 AMERICAN EXPERIENCE 25 FINDING YOUR ROOTS/ GENEALOGY ROADSHOW 26 HISTORY/PERSONAL HISTORY ONE-OFFS & LIMITED SERIES 27 INDEPENDENT LENS 28 POV/ INDIE FILM ONE-OFFS & LIMITED SERIES 29 FRONTLINE 30 NEWSHOUR /NEWSHOUR WEEKEND 31 CHARLIE ROSE-THE WEEK 32 WASHINGTON WEEK/ NEWS/PUBLIC AFFAIRS ONE-OFFS & LIMITED SERIES 33 PROGRAM AUDIENCE AFFINITIES 34 PRIMETIME AUDIENCE COMPOSITION BY SERIES 36 INDICES OF CONTRIBUTOR STATUS AND CONSUMER BEHAVIORS PUBLIC INDIE PERSONAL SCIENCE/ AFFAIRS FILM HISTORY NATURE DRAMA PART III: DAYTIME/ KIDS SEASON OVERVIEW 40 KIDS 2-8 RATINGS: PBS AND OTHER NETWORKS; KIDS AUDIENCE COMPOSITION 41 KIDS SHARE OF VIEWING;KIDS STREAMING BY PLATFORM 42 KIDS AUDIENCE COMPOSITION BY PROGRAM REFERENCE TOOLS 44 U.S. POPULATION TRENDS; CHANNELS RECEIVED VS. TUNED 45 TECHNOLOGY TRENDS; DAILY TIME SPENT USING MEDIA TECHNOLOGY TRENDS PERCENT OF TV HOUSEHOLDS When the U.S. economy plummeted in 2008 there were bold predictions of how Americans were going to cut the cord, dropping their pay TV (cable/satellite) subscriptions. However, that has been slow to happen. The percentage of homes which rely on over-the-air reception edged up to 11% in 2015 and Nielsen added a new category of homes that can only watch video through the internet on a TV or monitor. There are about 3 million of these Broadband-only homes today. DVR penetration is poised to reach the 50% mark soon, but has leveled off. Nielsen has begun to monitor the presence of additional services and devices in US TV households: Subscription videoon-demand services (for example, Netflix and Amazon Prime) were available in 40% of all U.S. homes. And multimedia devices (for example, Roku, Apple TV, Google Chromecast, Amazon Fire) are now in 19% of homes. These devices and services account for some of the erosion in Live TV usage seen in the chart below. * Not measured in this year DAILY TIME SPENT USING MEDIA PERSONS 18+ Live TV Time- Shifted TV AM/FM Radio All Computer Use All Smartphone Use Gaming Console DVD/Bluray Device Multi-media Device 4:55 0:35 2:42 1:07 1:27 5:10 0:34 2:46 1:07 1:12 5:11 0:29 2:48 1:03 0:58 Although live TV remains the single largest component of daily media consumption, the amount of time spent watching live TV has declined by 16 minutes since 2013, as adults 18+ acquire more time- and place-shifting devices on which to consume video. Thanks to DVRs, video game consoles and new multimedia devices like Roku and Apple TV boxes, the audience fragmentation brought about through time-shifting continues to increase. As smartphone penetration increases, so too does time spent consuming video and using the internet on smartphones. Meanwhile, listening to AM/FM radio continues to be second only to live television as a share of consumers daily media usage. 45
 has grown steadily to 116.4 million in 2015, an increase of fifteen percent.")


3 U.S. POPULATION TRENDS UNIVERSE ESTIMATES IN MILLIONS Since 2000, the face of the American population has been changing. The total number of television households (as defined by The Nielsen Company) has grown steadily to million in 2015, an increase of fifteen percent. But the number of African American, Hispanic and Asian homes has grown by over forty percent over the past fifteen years, comprising thirty percent of all US TV households. And while the American population continues to grow by 14% since 2000 it is aging at the same time. The number of children 2-11 has remained steady over the past fifteen years while the number of adults over the age of 50 has grown by 44% since * Not measured in this year CHANNELS RECEIVED VS. TUNED HOUSEHOLD Having access to more channels and platforms in the household does not mean that consumers will view more of them. Despite receiving more channels in 2015 (about 200), households are actually tuning to fewer of them (15.9) compared with the previous two years. As noted on the facing page, consumers are increasingly using other devices and platforms to consume content. Channels Tuned Channels Received 44 ABOUT THIS BOOK FROM PBS RESEARCH Welcome to the 2015 edition of the Audience Insight Annual Report. In response to your feedback we have added new content and features this year, creating our most complete season review ever. MORE PROGRAM INFORMATION In addition to metrics for ongoing series, this year s edition also includes data for limited series and one-off specials in every genre. While we ve included information about how programs receiving the highest level of promotion (that is, Epic Pop-outs ) performed, we ve also provided total reach and new viewer stats for programs that received any level of promotion last season, Pop-outs and Vision Events. CROSS-PLATFORM DATA This year s edition for the first time includes streaming data for all the ongoing series. These data are shown in two ways: First, for each episode of most programs, we show the total number of times the episode was streamed. Secondly, for ongoing series, we show the: monthly total streams of that series across all platforms (browser, mobile, and over-the-top devices) compared to the monthly streaming average for all measured series reported in the book. PBS KIDS For the first time, the Audience Insight Annual Report includes information about PBS KIDS. Since the Kids service is such an important part of the National Program Service, and since content consumed during daytime contributes greatly to the PBS cumulative audience every week, we re reporting on how each series performed last season online as well as on air and what kind of kids and households make up our audience during this daypart. OTHER ENHANCEMENTS Population and TV Usage Trends, Video Technology Adoption We ve added a new section this year that provides important context for understanding the data in the rest of the book. This new spread shows trends in the number of TV households and persons, including diverse homes, the average time spent across media sources, and the penetration of devices such as tablets. Member Indices and Consumer Behavior All In One Place Building on last year s introduction of behavioral and attitudinal data for each program s audience, we ve gathered all of this information in a brand new dashboard making it easy to see at a glance how the audiences of the ongoing series compare with each other on attributes like PBS station contributor status and interest in the arts. On individual pages, we ve provided more information on how to interpret the graphics and how to apply the data to your own work. We hope that you ll find this enhanced report a useful tool for your daily work. 1 REFERENCE TOOLS


4 GLOSSARY Rating or AA (Average Audience) -- Percent of all TV households (or persons) watching during an average minute of a program or time period. Each 1.0 household rating point translates into 1,164,000 households watching in an average minute. The primetime rating includes tuning to all PBS stations, including multi-cast, during an average minute from Monday - Sunday, 8-11pm, plus all DVR playback within seven days. Stream Any time a video starts playing. If the video includes a pre-roll, a stream is counted only after the pre-roll finishes. Live+7 Includes all playback on a DVR within 7 days of the program feed or original time period. Non-Recent Viewers Viewers 18+ of a program who had not watched any PBS station in the prior (non-pledge) month. Heavy Viewers Viewers 18+ are divided into five equal groups according to their time spent viewing PBS. The top 20%, who watch the most PBS, are called Heavy Viewers. Levels of Program Promotion Epic Pop-Out -- An Epic Pop Out receives PBS s highest level of promotional support with the goal of elevating the entire PBS system and attracting the largest audiences possible. Pop-Out -- A Pop Out is a major focus for the PBS system with strong potential to draw in large audiences. Vision Event -- A Vision Event is one that highlights the role PBS plays in sharing compelling stories and content in a way no other media provider can. MRI CONTRIBUTOR AND BEHAVIOR ICONS Arts - those who attend classical music or opera performances. Civic Engagement - a segment classified by MRI through pyschographic statements as Civic Advocates. Members of this segment are likely to have written something that was published, written an article for a magazine or newspaper, contacted media or similar behaviors. Tech Enthusiasts - a segment which includes enthusiastic adopters and regular users of technology. In comparison to Tech-phobes, Tech-Splorers and Tech-Gamers. Financial Investments - those who have any type of financial investments totalling over $250,000. Foreign Travel - those who participate in any kind of foreign travel, whether for business or vacation. Contributor - An adult 18+ who self-reported through the MRI survey as having made a contribution to PBS during the past 12 months. The Nielsen Company SOURCES All Nielsen data come from Nielsen s national PeopleMeter sample for Live+7. Broadcast season dates: 9/22/14-9/20/15, 9/23/13-9/21/14, and 9/24/12-9/22/13. For PBS Kids analysis (pages 40-41), time period data are based on 7AM to 6PM, Monday-Friday viewing. For population and technology trends (pages 44-45), data are taken from Total Audience Report/Q and from the Television Audience 2015 Series Universe Estimate Report (March 2015) and report of Average Channels Tuned (December 2015). Nielsen/MRI Fusion (pages 36-37) Data rely on the fused datasets from Nielsen s national PeopleMeter sample (PBS Heavy Viewers) and MRI s persons 18+ sample of respondents. Nielsen broadcast season dates plus MRI waves for October 14-March 15 and April-September 15. Google Analytics (all program pages, plus page 41 bottom) Includes streams from browser, mobile, and OTT platforms. October 2014 September On program pages, each program s monthly total streams are shown relative to the average across all 17 series included in this book. COMPOSITION BY PROGRAM 43 2

 and increasing competition not just from other networks but from devices and streaming services.")
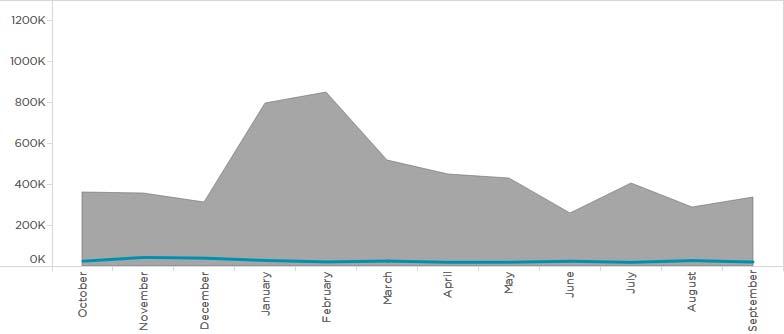
5 PBS KIDS AUDIENCE HOW TO READ Among Kids 2-8, 43% of the viewing to PBS KIDS programming is done by children in homes where the annual household income is less than $40, PART I PRIMETIME SEASON OVERVIEW The season was remarkably stable: The huge success of The Roosevelts at the end of drove up that season s average and made it appear that there was a year-over-year decline for PBS during the season. In reality, though, the two seasons were virtually identical for 51 of the 52 weeks. This is particularly impressive given the 3% decline in HUT (households using television) and increasing competition not just from other networks but from devices and streaming services. Further, PBS s total digital streams across all platforms closely mirrored those TV viewing levels each week, following the same peaks during Downton Abbey and valleys during national Pledge periods. (page 4) Sunday continued to be the highest-rated night of the week, followed by Mondays, with both nights trending down ever so slightly. Tuesday and Wednesday nights were solid year-over-year and continue to be strong performers. Thursday nights showed the greatest year-over-year declines. (page 5) The primetime audience profile continued to skew toward older females and highly-educated homes, with even greater representation of those groups among heavy viewers and contributors. Heavy viewers were the most likely to be in broadcast-only homes. Contributors were older and less diverse, but with higher median incomes and greater likelihood of having a DVR than our heavy viewers, though still low relative to the US population generally. (page 5) PBS maintained its #5 ranking among all networks, behind only the four major broadcasters and ahead of every single cable network in terms of primetime household ratings. Most of the top-rated broadcast and cable networks struggled to keep pace with their levels from the previous year. There were double-digit declines for USA, Bravo, TNT, TV Land, FX, Syfy, TLC, Travel and TBS. (page 6) When viewing the broadcast networks, PBS viewers flocked to CBS crime procedurals and enjoyed performance competition programs. On cable, our viewers looked to TNT s crime dramas and several HGTV programs, revealing interest in a genre we typically serve up only on the weekends. (page 7) 3 3


6 PBS KIDS SHARE OF M-F DAYTIME VIEWING Viewing to kids competitive set shrinking; PBS KIDS share stable at 7%; internet connected devices grew to 4% PBS KIDS STREAMING BY PLATFORM TOTAL STREAMS 80% 10% 11% 553,622, ,812,461 82% 14% 5% 382,346,093 71% 23% 6% 381,953,669 74% 18% 8% 337,804,535 80% 11% 9% 262,865,135 PBS PRIMETIME HH RATINGS BY WEEK Average audience remains stable with dips during pledge PLEDGE PERIOD PBS STREAMS & PRIMETIME HH RATINGS BY WEEK Winter spike in ratings and streams driven by Masterpiece Ratings Streams 4 The bar for each year represents 100% of weekday television usage for kids 2-8. For example, in the season, PBS accounted for 7% of kids television usage. DEVICES OTHER TV PBS & COMPETITIVE SET Mobile usage accounts for approximately 80% of all digital streams to series 89% 6% 4% 199,996,135 85% 12% 3% 191,256,992 78% 16% 7% 185,875,086 82% 9% 8% MOBILE DESKTOP OTT 169,282,337 81% 10%9% 166,360,002 78% 14% 8% 162,668,132 85% 10% 5% 152,058,198 92% 6%2% 107,465,042 87% 9%4% 41 PBS & COMPETITIVE SET OTHER TV DEVICES


7 KIDS 2-8 RATINGS: PBS AND OTHER NETWORKS PBS KIDS up by 7%; most rivals down, some by as much as 26% TO CHANGE -30% +30% Color bars indicate percent change over the previous season s Kids 2-8 average audience rating. M-F 7a-6p time period ratings for all competitive networks that are available in at least 50% of US households. PBS KIDS AUDIENCE COMPOSITION DVR penetration low, broadcast-only and education level high in PBS KIDS households ALL TV VIEWERS 7A - 6P ALL TV VIEWERS 7A - 6P, 2-8 YEARS PBS VIEWERS 7A - 6P, 2-8 YEARS MEDIAN AGE: 52 MEDIAN INCOME: $45,200 MEDIAN AGE: 22 MEDIAN INCOME: $40,700 MEDIAN AGE: 6 MEDIAN INCOME: $48, Note: Education refers to the head of household, and income refers to total household income. PBS PRIMETIME HH RATINGS BY NIGHT Sundays and Mondays continue to be strong PBS PRIMETIME AUDIENCE COMPOSITION Heavy viewers and contributors skew 65+, broadcast-only and college-educated TOTAL PRIMETIME TV VIEWERS PBS PRIMETIME HEAVY PBS VIEWERS CONTRIBUTOR MEDIAN AGE: 50 MEDIAN INCOME: $51,300 MEDIAN AGE: 65 MEDIAN INCOME: $51,300 MEDIAN AGE: 66 MEDIAN INCOME: $51,000 MEDIAN AGE: 69 MEDIAN INCOME: $59,200 5 Note: Education refers to the head of household, and income refers to total household income.
8 PRIMETIME HH RATINGS FOR TOP 30 NETWORKS PBS #5 among all broadcast and cable networks; remains stable while most of top 30 down year over year HORIZONTAL BAR, ALL NETS OVER.10, DESCENDING ORDER TO CHANGE -28% +12% Color bars indicate percent change over the previous season s household average audience rating. DASHBOARD PLUS OTA AND DVR ARE WE KEEPING THIS??? PART III DAYTIME/ KIDS SEASON OVERVIEW During the season, the PBS KIDS team was able to offset the decline in kids live TV viewing by launching Odd Squad, implementing an effective scheduling strategy of double stacking the most popular series, and, accompanied by promotional support, succeeded in increasing PBS KIDS ratings. As a result, PBS ranked third among the competitive kids cable networks, based on Kids 2-8 ratings, behind Nickelodeon and Disney Channel, gaining 7% from the prior year. (page 40, top) PBS KIDS is uniquely positioned to reach kids throughout the US; it is available in nearly all TV homes and reaches three-quarters of all children 2-8 annually. Of the PBS weekday audience, nearly one-third of the children watching PBS weekdays are Hispanic, and another third receive their television via an overthe-air signal. (page 40, bottom) With many sources of kids programming available on TV, PBS garners a 7% share of the Kids 2-8 audience weekdays. Altogether PBS and the kids cable networks account for 42% of TV viewing, down from 49% just two years ago. The shifting media landscape is evident as tuning to devices, including DVRs, DVD players, video game consoles, and Internet connected devices now account for 37% of weekday TV time. (page 41, top) With more technologies, devices, and content available than ever before, children are watching their favorite programs on TV, but also online, overthe-top, and on-the-go, with tablets and cell phones available in most homes today. Looking to digital platforms, PBS KIDS series were streamed more than 100 million times each during the season, led by Daniel Tiger s Neighborhood, which topped the charts at nearly 554 million streams. Mobile usage is growing and currently accounts for approximately 80% of all digital streams to each of the PBS KIDS series. (page 41, bottom.) 39 6
 relative to the rating among total US TV households.")


9 TOP 30 BROADCAST SERIES PBS VIEWER INDICES HOW TO READ The PBS Viewer Index is a calculation of the rating among PBS-viewing households for the top 30 broadcast and cable programs with at least five primetime telecasts (with the obvious exception of one-off events like the Super Bowl and Oscars) relative to the rating among total US TV households. An index above 100 means that PBS viewers are more likely to watch the program than the average TV household. The colorcoding reflects the PBS Viewer Index, where dark green means PBS viewers are more likely to view and dark pink means they are less likely to view than the average US TV household. The size of the bubbles in these charts reflects the size of the audience. TOP 30 CABLE SERIES AVG. PBS INDEX TO HH HOW TO USE The PBS Viewer Index reveals whether PBS viewers are more or less likely to watch a program than the average TV viewer. The index also helps us identify areas of interest to our viewers, which can help with seeding program development and acquisition ideas. Because PBS viewers are more likely to reside in broadcast-only homes, the broadcast chart contains more titles that over-index for PBS viewers (green). In fact almost all of the top-rated broadcast programs have high PBS viewer indices, with the exception of Empire. The highest-indexing programs for PBS viewers are on CBS, with ABC s Dancing with the Stars, Castle and Modern Family, and NBC s America s Got Talent being the rare exceptions to this affinity for CBS. On cable, many of these top-rated series did NOT appeal to PBS viewers (pink), in particular breakout hits like American Horror Story and Walking Dead. PBS viewers were drawn to AMC s Mad Men, History s Texas Rising, and multiple offerings from TNT. 38 7
 156 184 84 1.")
10 STATUS & CONSUMER BEHAVIORS Contributor 180 Arts Civic Engagement x x 224 Tech Enthusiasts x Financial Investments (over $250K) x Foreign Travel HOW TO USE Among other things, the selected attributes help to illustrate the qualitative differences between PBS viewers and viewers of other programming, helping to make a case, beyond the ratings, for sponsoring PBS shows. For example, if a travel-related business were interested in local sponsorship around a national series, shows like Masterpiece, Call the Midwife, Last Tango in Halifax, and Independent Lens might be good options, since their viewers index the highest for foreign travel. The largest indices for people who attend classical music or opera performances are found with Live from Lincoln Center, suggesting that this might be a good choice for a prospective sponsor in the arts sector. On the other hand, an investment company looking for viewers with high net worth could conceivably consider just about any PBS primetime series, since all over-index for viewers with investments in excess of $250K. What opportunities do you see when you study this chart? 8 37
11 INDICES OF CONTRIBUTOR x x 2.0x x x x x HOW TO READ This chart is based on the fusion of Nielsen audience information for PBS viewers 18+ and MRI data for adults 18+. The indices show how the heaviest viewers of each PBS series compare to all heavy primetime TV viewers age 18+ on a variety of attributes including (on a self-reported basis) having made a contribution to PBS within the last twelve months. To be read across, starting in the upper left of the chart: Great Performances has a Contributor Index of 318, meaning that heavy viewers of Great Performances are about three times more likely than all US heavy primetime viewers to say that they had made a contribution to PBS in the last twelve months. 36 PART II PRIMETIME SERIES BY GENRE Long-running series, for the most part, trended well, especially Masterpiece; and newer recurring series were strong, in particular Call the Midwife. (page 10) Drama dominated the season, easily the highest-rated genre with the most successful program strands. History/Personal History was also a strong genre, but experienced some decline attributable to Antiques Roadshow. (page 11) Smaller audiences came to Independent Film than to the other genres, but those audiences tended be younger than average and more ethnically and racially diverse. (pages 34-35) Programs with promotional support successfully reached new or non-recent viewers - viewers who hadn t watched PBS in the prior (non-pledge) month - versus our normal audience. The Downton Abbey Season 5 premiere was the Epic Pop-out of the year, and reached 13.7 million viewers just for the premiere. (page 19) The audiences for Sunday night programs showed the greatest affinity with each other viewers of Masterpiece were often also watching Call the Midwife or Last Tango in Halifax, while viewers of Great British Baking Show often watched Masterpiece. The NOVA and Nature audiences also overlapped significantly as did the audiences for American Experience, Finding Your Roots, and Genealogy Roadshow. (page 33) In terms of streaming behavior, drama programs were consumed on digital platforms more frequently than any other genre. (pages 17-18). But certain specific titles in other genres also showed above average streaming behavior: NOVA and Frontline were both significantly above the average for all primetime programs. (pages 21 and 29) Great British Baking Show, POV and Frontline had the youngest audiences among PBS s ongoing primetime series, with a median age of 60. The highest median income, by far, was for Masterpiece, and these homes were also the most likely to have a DVR. Broadcast-only homes made up one quarter of the audience for Friday public affairs, both independent film strands, and NOVA. (pages 34-35) The fusion of MRI data with Nielsen ratings reveals that heavier viewers of all PBS series are more likely to be contributing to their local PBS stations. Live from Lincoln Center, Independent Lens, and Washington Week were especially rich with members. Nielsen-MRI fusion also shows that viewers of the independent film strands were likely to include tech enthusiasts, while individuals with high net worth were more likely to be found in the audiences for American Masters and Last Tango in Halifax. Viewers of American Experience, Independent Lens, and Live from Lincoln Center also had the highest index for foreign travel. (pages 36-37) 9

. Those plays have been grouped into a separate average on this chart, ranking second.")
12 PBS PRIMETIME* SERIES RANKER Masterpiece continues to grow; Antiques Roadshow slipping Masterpiece was well ahead of all other series this season, and saw continued growth for the episodes fed at 9PM. The series also expanded its footprint to include even more episodes at 8PM and 10PM (including Arthur & George, The Paradise, Grantchester, and Wolf Hall, compared to only three episodes of Sherlock and one Downton Pledge event in prior years). Those plays have been grouped into a separate average on this chart, ranking second. Antiques Roadshow continues to be a top-rated PBS show, but it is also trending down, in part because fewer stations are scheduling same-week repeats in prime timeslots. NOVA was a strong performer with solid rating trends. Both American Experience and American Masters slipped a little, but these anthologies are completely topic-driven and based on few episodes. Within independent film, news and public affairs, lower-rated genres generally, the core series trended well, either showing some growth or maintaining audience. * PRIMETIME SERIES WITH AT LEAST FOUR NEW EPISODES THIS SEASON, PLUS NEWSHOUR. AVERAGES IN- CLUDE ALL ORIGINAL BROADCAST AND REPEAT EPISODES. SERIES WITH NO TRENDABLE DATA EXCLUDED. 10 COMPOSITION BY SERIES 35


13 34 PBS PRIMETIME AUDIENCE PBS PRIMETIME* DELIVERY P2+ (000) BY GENRE Drama and history continue to drive PBS delivery *NEWS/PUBLIC AFFAIRS AVERAGE INCLUDES PBS NEWSHOUR. DIY GENRE INCLUDES BOTH WEEK- END DAYTIME AND THE GREAT BRITISH BAKING SHOW THIS YEAR. 11


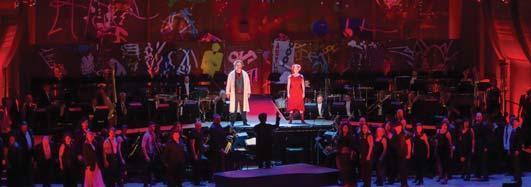
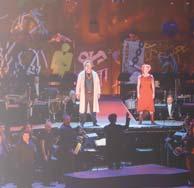
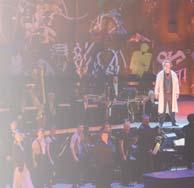
14 +CONTRUBUTOR INDEX BADGE GREAT PERFORMANCES 12 PROGRAM AUDIENCE AFFINITIES HOW TO USE Marketing professionals have used this information to help guide program cross-promotion, and development staff have found it valuable for crafting direct mail copy or pledge scripts. This program affinity chart is also helpful for understanding whether programs scheduled for flow have indeed achieved the intended audience overlap. It can also help identify two programs, not currently scheduled together, that have affinity and might make a good pairing in the future or once a past title has become available for local acquisition. HOW TO READ To be read across, starting in the upper left of the chart: Of all the households that watched American Experience, 5% of those households also watched American Masters during weeks when both programs aired. So, for example, of all the households that watched Call the Midwife, 46% of them also watched Masterpiece at 9PM, and of all the homes watching Last Tango in Halifax, fully 60% had watched Masterpiece (the highest affinity on the chart). Forty-one percent of Nature viewers watched NOVA, and 39% of NOVA viewers watched Nature. Homes that watched Finding Your Roots and Genealogy Roadshow were most likely to have also watched American Experience. These program affinities reveal the success of scheduling like genres on the same night to achieve audience flow. Similarly, Washington Week viewers were the most likely of any audience to have watched NewsHour. 0-10% 10-20% 20+% When two programs never aired within the same week, a gray box is shown. 33 PUBLIC DRAMA WORLD AFFAIRS INDIE FILM PERSONAL EXPLORE HISTORY HISTORY SCIENCE/NATURE WORLD EXPLORE INDIE DRAMA FILM HISTORY/IDENTITY


15 HISTORY/IDENTITY INDIE DRAMA FILM SCIENCE/NATURE EXPLORE WORLD PERSONAL EXPLORE HISTORY HISTORY INDIE FILM PUBLIC DRAMA WORLD AFFAIRS WASHINGTON WEEK ONE-OFFS & LIMITED SERIES TOP-RATED ORIGINAL BROADCAST: MULTI-PART EVENTS TOP-RATED ORIGINAL BROADCAST: ONE-OFFS EVENTS AMERICA AFTER FERGUSON - 9/26/14 POP-OUT VISION EVENT 32 +CONTRUBUTOR INDEX BADGE AMERICAN MASTERS 13 PUBLIC DRAMA AFFAIRS INDIE FILM PERSONAL SCIENCE & HISTORY NATURE NEWS/PUBLIC SCIENCE/NATURE AFFAIRS INDIE DRAMA FILM HISTORY/IDENTITY


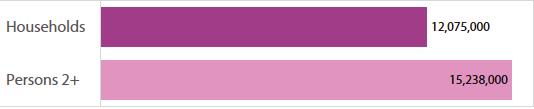
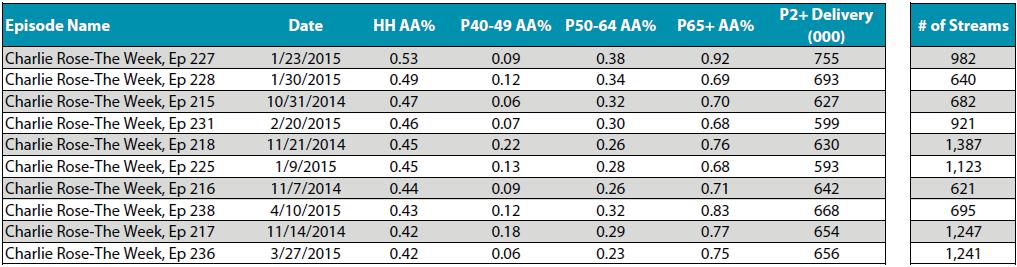
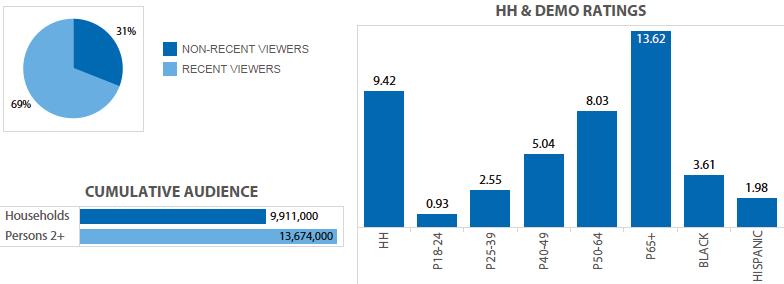
16 HISTORY/IDENTITY INDIE DRAMA FILM NEWS/PUBLIC SCIENCE/NATURE EXPLORE AFFAIRS PERSONAL SCIENCE HISTORY & HISTORY NATURE INDIE FILM PUBLIC DRAMA WORLD AFFAIRS Summer 2012 Fall 2013 Fall CONTRUBUTOR INDEX BADGE CUMULATIVE AUDIENCE FOR PBS FALL 2014 FESTIVAL 14 +CONTRUBUTOR INDEX BADGE MRI FUSION DATA CHARLIE ROSE - THE WEEK 31 PUBLIC WORLD AFFAIRS INDIE FILM PERSONAL HISTORY HISTORY SCIENCE/NATURE EXPLORE DRAMA


17 DRAMA SCIENCE/NATURE EXPLORE PERSONAL HISTORY HISTORY INDIE FILM PUBLIC WORLD AFFAIRS PBS NEWSHOUR PBS NEWSHOUR WEEKEND 30 TABLE OB DATE EPISODE TITLE DESCENDING ORDER HH AND DEMOS * *Though Great British Baking Show is included in the Arts genre in this book, it is more appropriate to include it in the DIY genre. 15 PUBLIC DRAMA WORLD AFFAIRS INDIE FILM PERSONAL SCIENCE HISTORY & HISTORY NATURE NEWS/PUBLIC SCIENCE/NATURE EXPLORE AFFAIRS INDIE DRAMA FILM HISTORY/IDENTITY


18 HISTORY/IDENTITY INDIE DRAMA FILM NEWS/PUBLIC SCIENCE/NATURE EXPLORE AFFAIRS PERSONAL HISTORY EXPLORE HISTORY INDIE FILM PUBLIC WORLD DRAMA AFFAIRS POP-OUT VISION EVENT 16 ONE-OFFS & LIMITED SERIES TOP-RATED ORIGINAL BROADCAST: ANNUAL EVENTS TOP-RATED ORIGINAL BROADCAST: MULTI-PART EVENTS TOP-RATED ORIGINAL BROADCAST: ONE-OFF EVENTS PLEDGE EVENTS TABLE OB DATE EPISODE TITLE DESCENDING ORDER HH AND DEMOS ONE-OFF EVENTS TABLE OB DATE EPISODE TITLE DESCENDING ORDER HH AND DEMOS HISPANIC HERITAGE AWARDS - 9/29/14 +CONTRUBUTOR INDEX BADGE FRONTLINE 29 PUBLIC WORLD DRAMA AFFAIRS INDIE FILM PERSONAL SCIENCE HISTORY & HISTORY NATURE NEWS/PUBLIC SCIENCE/NATURE EXPLOREAFFAIRS INDIE DRAMA FILM HISTORY/IDENTITY


19 HISTORY/IDENTITY INDIE DRAMA FILM NEWS/PUBLIC SCIENCE/NATURE EXPLORE AFFAIRS PERSONAL SCIENCE HISTORY & HISTORY NATURE INDIE FILM PUBLIC DRAMA WORLD AFFAIRS +CONTRUBUTOR INDEX BADGE POV TOP-RATED ORIGINAL BROADCAST: MULTI-PART EVENTS P65+ AA% +CONTRUBUTOR INDEX BADGE MASTERPIECE Note: Axis differs from all other digital delivery axes in this book to accommodate Masterpiece s much larger audience. 17 PUBLIC DRAMA WORLD AFFAIRS INDIE FILM PERSONAL EXPLORE HISTORY HISTORY NEWS/PUBLIC SCIENCE/NATURE EXPLORE AFFAIRS INDIE DRAMA FILM HISTORY/IDENTITY


20 HISTORY/IDENTITY INDIE DRAMA FILM NEWS/PUBLIC SCIENCE/NATURE EXPLORE AFFAIRS PERSONAL SCIENCE HISTORY & HISTORY NATURE INDIE FILM PUBLIC WORLD DRAMA AFFAIRS CALL THE MIDWIFE LAST TANGO IN HALIFAX 18 +CONTRUBUTOR INDEX BADGE INDEPENDENT LENS 27 PUBLIC DRAMA AFFAIRS INDIE FILM PERSONAL SCIENCE & HISTORY NATURE NEWS/PUBLIC SCIENCE/NATURE AFFAIRS INDIE DRAMA FILM HISTORY/IDENTITY


21 HISTORY/IDENTITY DRAMA DRAMA INDIE FILM EXPLORE SCIENCE/NATURE NEWS/PUBLIC AFFAIRS T ENT P ON SPI I V 26 U -EOV T UUT O O -- P OP PPO T UUT O O -- OPP PO P ON SPI I V T UENT V O -E 19 INDIE FILM POP OUT DASHBOARD NON-RECENT VIEWERS, CUME, DEMO RATINGS P POLDARK - 6/21/15 PERSONAL SCIENCE &HISTORY NATURE AMERICAN EXPERIENCE LAST DAYS IN VIETNAM- 4/28/15 WOLF HALL- 4/5/15 DOWNTON ABBEY SEASON 5 PREMIERE - 1/4/15 MULTI-PART EVENTS TABLE OB DATE EPISODE TITLE DESCENDING ORDERORIGINAL BROADCAST: ONE-OFF EVENTS TOP-RATED HH AND DEMOS TOP-RATED ORIGINAL BROADCAST: MULTI-PART EVENTS ONE-OFFS & LIMITED SERIES T CANCER: EMPEROR OF ALL MALADIES - 3/30/15 MULTI-PART EVENTS TABLE OB DATEEVENT EPISODE TITLE VISION DASHBOARD DESCENDING ORDER NON-RECENT VIEWERS, CUME, DEMO RATINGS HH AND DEMOS MAKERS: WOMEN WHO MAKE AMERICA (S2) - 9/30/14 MULTI-PART EVENTS TABLE OB DATE EPISODE TITLE TOP-RATED DESCENDING ORDERORIGINAL BROADCAST: ONE-OFF EVENTS HH AND DEMOS TOP-RATED ORIGINAL BROADCAST: MULTI-PART EVENTS ONE-OFFS & LIMITED SERIES PO U -O HISTORY PERSONAL HISTORY EXPLORE NEWS/PUBLIC SCIENCE/NATURE AFFAIRS INDIE FILM INDIE FILM INDIE DRAMA FILM WORLD PUBLIC AFFAIRS DRAMA HISTORY/IDENTITY PUBLIC DRAMA AFFAIRS -OO PPO PO T UUT


22 HISTORY/IDENTITY INDIE DRAMA FILM NEWS/PUBLIC SCIENCE/NATURE EXPLORE AFFAIRS PERSONAL SCIENCE HISTORY & HISTORY NATURE INDIE FILM PUBLIC DRAMA WORLD AFFAIRS +CONTRUBUTOR INDEX BADGE NATURE 20 TABLE OB DATE EPISODE TITLE DESCENDING ORDER HH AND DEMOS; # OF STREAMS GENEALOGY ROADSHOW 25 PUBLIC DRAMA WORLD AFFAIRS INDIE FILM PERSONAL SCIENCE HISTORY & HISTORY NATURE NEWS/PUBLIC SCIENCE/NATURE EXPLORE AFFAIRS INDIE DRAMA FILM HISTORY/IDENTITY


23 DRAMA SCIENCE/NATURE PERSONAL HISTORY INDIE FILM PUBLIC AFFAIRS +CONTRUBUTOR INDEX BADGE *Streaming data for Walt Disney episodes 1 and 2 represent the total number of streams for the full 4-hour program. AMERICAN EXPERIENCE 24 +CONTRUBUTOR INDEX BADGE NOVA PUBLIC WORLD DRAMA AFFAIRS INDIE FILM PERSONAL SCIENCE HISTORY & HISTORY NATURE NEWS/PUBLIC SCIENCE/NATURE EXPLOREAFFAIRS INDIE DRAMA FILM HISTORY/IDENTITY


 - 10/15/14 7.12 6.21 5.")

24 HISTORY/IDENTITY INDIE DRAMA FILM NEWS/PUBLIC SCIENCE/NATURE EXPLORE AFFAIRS PERSONAL SCIENCE HISTORY & HISTORY NATURE INDIE FILM PUBLIC WORLD DRAMA AFFAIRS POP-OUT POP-OUT POP-OUT POP-OUT 22 ONE-OFFS & LIMITED SERIES TOP-RATED ORIGINAL BROADCAST: MULTI-PART EVENTS MULTI-PART EVENTS TABLE OB DATE EPISODE TITLE DESCENDING ORDER HH AND DEMOS TOP-RATED ORIGINAL BROADCAST: ONE-OFF EVENTS EARTH: A NEW WILD (2 P) - 2/4/15 HOW WE GOT TO NOW (2 P) - 10/15/ P65+ AA% +CONTRUBUTOR INDEX BADGE ANTIQUES ROADSHOW DRAMA WORLD INDIE FILM PERSONAL SCIENCE & HISTORY NATURE NEWS/PUBLIC SCIENCE/NATURE AFFAIRS INDIE DRAMA FILM HISTORY/IDENTITY
Audience Insight 2016 Annual Report
 Audience Insight 2016 Annual Report Profile September 21, 2015 - September 18, 2016 With Comparisons to the 2013-2014 and 2014-2015 Seasons TABLE OF CONTENTS 1 ABOUT THIS BOOK 2 GLOSSARY PART I: PRIMETIME
Audience Insight 2014 Annual Report
 Audience Insight 2014 Annual Report Profile September 23, 2013 - September 21, 2014 With Comparisons to the 2011-2012 and 2012-2013 Seasons A WORD FROM PBS RESEARCH PBS Research is pleased to present you
ThinkNow Media How Streaming Services & Gaming Are Disrupting Traditional Media Consumption Habits Report
 ThinkNow Media How Streaming Services & Gaming Are Disrupting Traditional Media Consumption Habits 2018 Report 1 ThinkNow Media What is it? ThinkNow Media is a nationwide survey that looks at Americans
AUSTRALIAN MULTI-SCREEN REPORT QUARTER
 AUSTRALIAN MULTI-SCREEN REPORT QUARTER 02 Australian viewing trends across multiple screens Since its introduction in Q4 2011, The Australian Multi- Screen Report has tracked the impact of digital technologies,
AUSTRALIAN MULTI-SCREEN REPORT QUARTER
 AUSTRALIAN MULTI-SCREEN REPORT QUARTER 02 Australian viewing trends across multiple screens The edition of the Australian Multi-Screen Report provides the latest estimates of technologies present in Australian
Television Audience 2010 & 2011
 Television Audience 2010 & 2011 Overview The 51 st edition of Television Audience continues your collection of TV Audience reports. This report continues to include annual trends of population and television
Audience Insight 2013 Season-to-Date
 Look inside... Audience Insight 2013 The latest on s primetime ratings and rank among other popular networks An up-to-date profile of our audience, overall, series-by-series, segment-by-segment Audience
THE CROSSPLATFORM REPORT
 STTE OF THE MEDI THE CROSSPLTFORM REPORT QURTER, 0 UNDERSTNDING THE VIDEO CONSUMER The average merican today has more ways to watch video whenever, however and wherever they choose. While certain segments
Television, Internet and Mobile Usage in the U.S. A2/M2 Three Screen Report
 Television, Internet and Mobile Usage in the U.S. A2/M2 Three Screen Report VOLUME 5 2nd Quarter 2009 Viewership on the Rise as More Video Content Spans All Three Screens 57% of Internet Consumers Use
TV EVERYWHERE /OTT CTVE
 TV EVERYWHERE /OTT CTVE CTV Media, Inc 2017 THE WAY YOU WATCH TV IS CHANGING Live Linear TV Set Top Box VOD (in your living room) TV Everywhere Mobile Laptop Tablet OTT : Roku Amazon Fire TV Chromecast,
AUSTRALIAN MULTI-SCREEN REPORT QUARTER
 AUSTRALIAN MULTI-SCREEN REPORT QUARTER 03 Australian viewing trends across multiple screens The Australian Multi-Screen Report shows Australian homes have more screens, channel and platform choices and
CABLE NATION: Power of Branded TV Content v. Other Major Media
 TIME: V TV CABLE NATION: Power of Branded TV Content v. Other Major Media Power Of Branded TV Content v. Other Media Digital video has grown but represents only a nominal share of total video time TV dominants
REACHING THE UN-REACHABLE
 UNITED STATES REACHING THE UN-REACHABLE 5 MYTHS ABOUT THOSE WHO WATCH LITTLE TO NO TV SHIFT HAPPENS. IT S WELL DOCUMENTED. U.S. HOMES IN MILLIONS Cable Telco Satellite We Project MVPDs Will Lose About
Nielsen Examines TV Viewers to the Political Conventions. September 2008
 Nielsen Examines TV Viewers to the Political Conventions September 8 Nielsen Examines TV Viewers to the Political Conventions, September 8 The 8 presidential race has already proven itself an historic
Consumers Continue to Carve Out More Time for Media
 For Immediate Release MEDIA MAVEN A SNAPSHOT OF VIDEO VIEWING TRENDS April 2015 Volume 18 We achieved several major milestones in : surpassing 40 million members in the US; 20 million internationally;
TV + Google YouTube. Complementary in a Cross Media Campaign Strategy
 TV + Google YouTube Complementary in a Cross Media Campaign Strategy Executive Summary 1 Light TV viewers are not reached effectively on TV but they are watching online 2 3 4 Light TV viewers are valuable
Cool Off With Premium Video Content: How Viewers are Beating The Heat During Summer Months
 Cool Off With Premium Video Content: How Viewers are Beating The Heat During Summer Months Contents Summer Video Viewing 4 Reach 5-7 Days tuned-in 8 Summer Streaming 9-11 Summer Binging 12 Time spent by
Cable Television Advertising. A Guide for the Radio Marketer
 Cable Television Advertising A Guide for the Radio Marketer Overview Cable Television has seen tremendous advertising revenue growth in recent years. This growth is believed to have impacted radio s revenue
australian multi-screen report QUARTER 2, 2012 trends in video viewership beyond conventional television sets
 australian multi-screen report QUARTER 2, trends in video viewership beyond conventional television sets VIDEO CONTENT ACROSS MULTIPLE SCREENS Australians watched more than 104 hours of video per month
TV Today. Lose Small, Win Smaller. Rating Change Distribution Percent of TV Shows vs , Broadcast Upfronts 1
 Rating Change Distribution Percent of TV Shows 27-28 vs. -, Broadcast Upfronts 1 TV Today Figure 1 27-28 18% 18% 29% 24% 11% Lose Small, Win Smaller 3 out of 4 weekly broadcast shows lost up to 1% of their
AUSTRALIAN MULTI-SCREEN REPORT QUARTER
 AUSTRALIAN MULTI-SCREEN REPORT QUARTER 04 Australian viewing trends across multiple screens Over its history, the Australian Multi-Screen Report has documented take-up of new consumer technologies and
BSAC Business Briefing. TV Consumption Trends in the Multi-Screen Era. October 2012
 BSAC Business Briefing TV Consumption Trends in the Multi-Screen Era October 2012 Traditional TV Viewing Is Holding Up Well Despite all the hype about social networking, over-the-top video services, smartphones,
 Local TV remains leading source of news even as online grows Television remains the most popular choice for national and international news, despite the growth of online news sources. There has been continued
ThinkTV FACT PACK NEW ZEALAND JAN TO DEC 2017
 ThinkTV FACT PACK NEW ZEALAND JAN TO DEC 2017 TV Has Changed NEW ZEALAND Today s TV is a sensory experience enjoyed by over 3 million viewers every week. Powered by new technologies to make TV available
AUSTRALIAN MULTI-SCREEN REPORT QUARTER
 AUSTRALIAN MULTI-SCREEN REPORT QUARTER 0 AUSTRALIAN VIEWING TRENDS ACROSS MULTIPLE SCREENS The 0 edition of the Australian Multi- Screen Report updates household take-up of new technologies and the trends
TV Data Report: Time Shifting. alphonso.tv
 TV Data Report: Time Shifting alphonso.tv Introduction Digital Video Recorders (DVRs) are as common as coffee makers in today's home. Mobile devices and the web have made TV content ultraaccessible for
First-Time Electronic Data on Out-of-Home and Time-Shifted Television Viewing New Insights About Who, What and When
 First-Time Electronic Data on Out-of-Home and Time-Shifted Television Viewing New Insights About Who, What and When Bob Patchen, vice president, Research Standards and Practices Beth Webb, manager, PPM
NETWORK PRIMETIME & OTT PROGRAMMING Flash #5-15 November 2017
 NETWORK PRIMETIME & OTT PROGRAMMING Flash #5-15 November 2017 The 2017-18 primetime season has reached a point where the networks have solidified their winning nights, where the strongest established programs
The Communications Market: Digital Progress Report
 The Communications Market: Digital Progress Report Digital TV, 2009 This is Ofcom s twenty-third Digital Progress Report covering developments in multichannel television. The data are the latest available
AUSTRALIAN MULTI-SCREEN REPORT QUARTER
 AUSTRALIAN MULTISCREEN REPORT QUARTER 4 TV AND OTHER VIDEO CONTENT ACROSS MULTIPLE SCREENS The latest edition of the Australian MultiScreen Report ( ) shows robust viewing of broadcast television on inhome
Digital Day 2016 Overview of findings
 Digital Day 2016 Overview of findings Research Document Publication date: 5 th August 2016 About this document This document provides an overview of the core results from our 2016 Digital Day study, drawing
Promo Mojo: TLC Tops Rankings With 'This Is Life Live'
 Promo Mojo: TLC Tops Rankings With 'This Is Life Live' 05.16.2018 For the fourth week in a row, cable networks sweep the Promo Mojo top-five ranker. The new number one: TLC, which racked up 222.8 million
WAYS YOU CAN BENEFIT FROM LOTAME TV VIEWERSHIP DATA
 WAYS YOU CAN BENEFIT FROM LOTAME TV VIEWERSHIP DATA 1 TV AD EXPOSURE AUDIENCES Reach viewers who saw your brand message on TV by following up with a personalized digital ad. With Lotame, you can be sure
Promo Mojo: Fox Takes First and Second Place with NFL, '9-1-1'
 Promo Mojo: Fox Takes First and Second Place with NFL, '9-1-1' 10.10.2018 On the strength of 318 million TV ad impressions, a spot for Thursday Night Football tops this week's chart. An announcer notes
2016 Cord Cutter & Cord Never Study
 16 Cord Cutter & Cord Never Study Welcome to the Our builds on our 14 Cord Cutter Study by providing a focused look at both US consumers who opted out of subscription-based paid-tv service in the last
Australian. video viewing report
 Australian video viewing report QUARTER 4 2 Introduction W elcome to the Australian Video Viewing Report spanning the year through. This issue builds on the continuing story of how Australians are embracing
TREND INSIGHTS FIRST QUARTER 2017: CABLE NEWS NETWORKS HAVE THEIR BEST QUARTER EVER
 TREND INSIGHTS FIRST QUARTER 2017: CABLE NEWS NETWORKS HAVE THEIR BEST QUARTER EVER FIRST QUARTER 2017: CABLE NEWS NETWORKS HAVE THEIR BEST QUARTER EVER Presidential campaigns and elections are topics
DRAFT Changing TV Landscape
 DRAFT Changing TV Landscape June 2013 Sony Group Corporation Strategy Division 2010 MRP 1 Changing Television Landscape TV distribution and consumption are changing all over the world In the U.S. and other
A quarterly review of population trends and changes in how people can watch television
 1 A quarterly review of population trends and changes in how people can watch television 217 Analysis by 2 CONTENTS 3 THE PRIMARY ROLE OF SECONDARY TV SETS Secondary TV sets are becoming increasingly important
THE SVOD REPORT CHARTING THE GROWTH IN SVOD SERVICES ACROSS THE UK 1 TOTAL TV: AVERAGE DAILY MINUTES
 1 THE SVOD REPORT CHARTING THE GROWTH IN SVOD SERVICES ACROSS THE UK January 219 A lot can change in a year. In 218, England had a football team that the public actually enjoyed watching and the Beast
THE SVOD REPORT: CHARTING THE GROWTH IN SVOD SERVICES ACROSS THE UK 1 DAILY CONSOLIDATED TV VIEWING 2 UNMATCHED VIEWING
 1 THE REPORT: CHARTING THE GROWTH IN SERVICES ACROSS THE UK January 218 In the UK, television is still king. We are investing in ever larger sets; more than half of all UK households have a at least 4
AUSTRALIAN MULTI-SCREEN REPORT
 AUSTRALIAN MULTISCREEN REPORT TRENDS IN VIDEO VIEWERSHIP BEYOND CONVENTIONAL TELEVISION SETS QUARTER 2 VIDEO CONTENT ACROSS MULTIPLE SCREENS The latest edition of the Australian MultiScreen Report ( )
What Impact Will Over-the-Top Video Have on My Bottom Line
 What Impact Will Over-the-Top Video Have on My Bottom Line March 27, 2018 Doug Eidahl, VP Legal & Regulatory 2211 N. Minnesota St. Mitchell, SD 57301 The Changing CATV-Video Market 2 Recent Losses - Largest
The Communications Market: Digital Progress Report
 The Communications Market: Digital Progress Report Digital TV, Q2 2007 This is the fifteenth Ofcom Digital Progress Report covering developments in digital television take-up. The data are the latest available
Promo Mojo: NBC's 'Billboard Music Awards' Puts Broadcast Back on Top
 Promo Mojo: NBC's 'Billboard Music Awards' Puts Broadcast Back on Top 05.23.2018 Following four weeks in a row during which cable networks swept the Promo Mojo top five, a traditional broadcaster, NBC,
Contents. DVR Penetration Ethnic Penetration...4. DVR v. Non-DVR Time Spent With DVR Time Spent By Demo...9
 DVR Penetration... 3 Ethnic Penetration...4 DVR v. Non-DVR... 5-6 Contents Time Spent With DVR... 8 Time Spent By Demo...9 Time Spent By Ethnicity...10-11 Playback by Hour... 13 Playback by Genre... 14
Promo Mojo: Season Eight of 'The Walking Dead' Debuts
 Promo Mojo: Season Eight of 'The Walking Dead' Debuts 10.25.2017 In the week ending Oct. 22, the eighth-season return of AMC's The Walking Dead clambered to the top of the Promo Mojo chart, racking up
Promo Mojo: CBS' 'Instinct' Takes Top Spot
 Promo Mojo: CBS' 'Instinct' Takes Top Spot 03.21.2018 CBS takes the top spot in this week's Promo Mojo ranking with promos for its new police procedural drama Instinct, which racked up just over 270 million
TV Demand. MIPTV 2017 Special: Trends for LATIN AMERICA. Kayla Hegedus, Industry Data Scientist
 MIPTV 2017 Special: Trends for LATIN AMERICA Kayla Hegedus, Industry Data Scientist Introduction The year 2016 was good for television. In the United States alone, over 400 scripted series aired, in addition
Grabbing the spotlight Awards show trends and the rise of digital studios
 Grabbing the spotlight Awards show trends and the rise of digital studios A changing landscape for television The television industry is undergoing significant change, with new digital distribution platforms
NPR Weekend Programs
 NPR Weekend Programs Spring 2011 Reality has a way of eventually getting your attention In This Report Weekend programming is critical to NPR stations. In fact, the level of radio listening on Saturday
5INSIGHTS TO KNOW CONTENT MATTERS IDEAS IMPACTING THE CONTENT COMMUNITY 2016 Q3 ISSUE #1
 Culled from the headlines of the TV Industry s Trade Press, is a Bi-Monthly Newsletter curated and contextualized by KATZ Content Strategy s Bill Carroll. 1. Viewers Still Prefer Traditional TV Content
Mobile Viewing Trends Emerging Entertainment Technology
 Mobile Viewing Trends Emerging Entertainment Technology New Entertainment Technology (NET) Tracker (October, November, December) Copyright Screen Engine/ASI 2017. Any duplication, reproduction or usage
The Future of Flow TV
 The Future of Flow TV Colin Dixon, Founder & Chief Analyst, nscreenmedia colin@nscreenmedia.com twitter: @nscreenmedia Agenda TV Viewing Trends Pay TV Trends vmvpds (Skinny Bundles) What is TV industry
The Council for Research Excellence
 The Council for Research Excellence Consists of 35+ senior-level research professionals Represents advertisers, agencies, networks, cable companies, and station groups Seeks to advance the knowledge and
AMERICA S MOTORCYCLE NEWS SOURCE 2017 MEDIA KIT. Sean Finley O (949)
") AMERICA S MOTORCYCLE NEWS SOURCE 2017 MEDIA KIT Sean Finley sean.finley@digitalthrottle.com O (949) 207-3209 OVERVIEW Cycle News is one of the most respected media outlets in the motorcycle market. The
AMERICA S MOTORCYCLE NEWS SOURCE 2017 MEDIA KIT Sean Finley sean.finley@digitalthrottle.com O (949) 207-3209 OVERVIEW Cycle News is one of the most respected media outlets in the motorcycle market. The
Promo Mojo: Fox's 'The Gifted' Takes Its Turn at Top
 Promo Mojo: Fox's 'The Gifted' Takes Its Turn at Top 10.04.2017 On the strength of 395.3 million TV ad impressions for promos leading up to its Oct. 2 premiere, Fox's The Gifted, another spin-off from
Welcome from Mickey. It s no secret that video is a go-to strategy for consumer marketers.
 TV Buying Basics Welcome from Mickey It s no secret that video is a go-to strategy for consumer marketers. It s obvious why. Sight, sound, and motion create a powerful brand experience, while digital targeting
Netflix: Amazing Growth But At A High Price
 Netflix: Amazing Growth But At A High Price Mar. 17, 2018 5:27 AM ET8 comments by: Jonathan Cooper Summary Amazing user growth, projected to accelerate into Q1'18. Contribution profit per subscriber continues
Promo Mojo: NBC Closes Out Olympics by Leading for 5th Straight Week
 Promo Mojo: NBC Closes Out Olympics by Leading for 5th Straight Week 02.28.2018 For a record fifth week in a row, NBC grabs the top spot on the Promo Mojo chart with its promos for the 2018 PyeongChang
Online community dialogue conducted in March Summary: evolving TV distribution models
 The Speed of Life* 2009 Consumer Intelligence Series TV viewership and on-demand programming Online community dialogue conducted in March 2009 Series overview Through PricewaterhouseCoopers ongoing consumer
FILM ON DIGITAL VIDEO
 FILM ON DIGITAL VIDEO BFI RESEARCH AND STATISTICS PUBLISHED OCTOBER 2017 Digital video enables audiences to access films through a range of devices, anytime, anywhere. Revenues for on-demand services in
Video Consumer Mapping Study
 Video Consumer Mapping Study Appendix 1. Additional Findings & Presentation Materials Note: Each section below is hyperlinked to corresponding slides, available in full screen only. The text box on bottom
Architecting the new TV. Daniel Knapp, Director Advertising Research
 Architecting the new TV Daniel Knapp, Director Advertising Research Media trends have always sparked speculations and visions sometimes remarkably accurate How we will live in the year 2000 (German artist
TV Untethered. Following The Mobile Path Of TV Content July 24, 2013
 TV Untethered Following The Mobile Path Of TV Content July 24, 2013 Agenda Opening Welcome Richard Zackon CRE Facilitator Ceril Shagrin CRE Chairperson, Univision Presenters Commentary Q&A Joanne Burns
CABLE NATION: Video Advertising Update
 RATINGS CABLE NATION: Video Advertising Update INTERNET INTERNET GENRES welcome Your ask was simple In recent meetings with agencies and advertisers the request of Cable was to Give me a simple, comprehensive
Media Comparisons 2012 Persons
 Media Comparisons 2012 Persons Television Reaches More People Each Day than Any Other Medium Television 88,3 Internet 73,1 Radio Newspaper Mobile Phone Magazines 27,8 24,8 36,1 58,8 % Reached Yesterday
NIELSEN MUSIC HIGHLIGHTS 1 NIELSEN MUSIC HIGHLIGHTS REPORT
 NIELSEN MUSIC 360 2016 HIGHLIGHTS 1 NIELSEN MUSIC 360-2016 HIGHLIGHTS REPORT NIELSEN MUSIC 360 2016 A LOT HAS HAPPENED IN MUSIC IN THE LAST YEAR. New streaming services debuted, record-breaking albums
Northern Ireland: setting the scene
 Northern Ireland: setting the scene Key facts about Northern Ireland Figure Nation UK Population 1,779m (mid-2009 estimate); population is estimated to have risen by 5.6%, or 94,000 people, since 2001
An informational presentation about cutting the ties from traditional cable television.
 An informational presentation about cutting the ties from traditional cable television. What is cord cutting? Cord cutting is the decision to forgo a cable or satellite subscription in lieu of streaming
POV: Making Sense of Current Local TV Market Measurement
 March 7, 2012 # 7379 To media agency executives, media directors and all media committees. POV: Making Sense of Current Local TV Market Measurement This document is intended to raise awareness around the
Shifting Focus In a Multiplatform Age
 2015 Shifting Focus In a Multiplatform Age 2015 s Challenge: Adjusting to Changing Viewer Habits By GEORGE WINSLOW Cord-cutting has proven to be much less of an issue than many people were predicting just
MULTIPLE- SCREEN VIEWING: SPORT: THE WORLD CUP AND SPORTS VIEWING 1 ENGLAND V CROATIA (ITV) - WEDNESDAY JULY 11TH 2018
 - WEDNESDAY JULY 11TH 2018") 1 MULTIPLE- SCREEN VIEWING: AN INTRODUCTION TO HOW PEOPLE WATCH TELEVISION ACROSS FOUR SCREENS September 2018 UNDER EMBARGO UNTIL 00.01, SEPTEMBER 25TH 2018 A train journey across the UK is enough to hint
1 MULTIPLE- SCREEN VIEWING: AN INTRODUCTION TO HOW PEOPLE WATCH TELEVISION ACROSS FOUR SCREENS September 2018 UNDER EMBARGO UNTIL 00.01, SEPTEMBER 25TH 2018 A train journey across the UK is enough to hint
Tech Talk Live: Things Every Programmer Should Know. PTPA/Miami David Liroff, VP&CTO - WGBH Boston November 10, 2004 PTPA/MIAMI 11/10/04 1
 Tech Talk Live: Things Every Programmer Should Know PTPA/Miami David Liroff, VP&CTO - WGBH Boston November 10, 2004 PTPA/MIAMI 11/10/04 1 What we re going to talk about Nielsen Encoder issue News/trends
HOW AUSTRALIANS WATCH TV
 HOW AUSTRALIANS WATCH TV WATCHING TV ON ANY DEVICE IS OUR PREFERRED ENTERTAINMENT ACTIVITY Source: Deloitte Media Consumer Survey 2016. TECHNOLOGY MAKES TV AVAILABLE EVERYWHERE AND AT ANY TIME Australians
TV RESEARCH, FANSHIP AND VIEWING
 The Role of Digital in TV RESEARCH, FANSHIP AND VIEWING THE RUNDOWN Digital platforms such as YouTube and Google Search are changing the way people experience television. With 90% of TV viewers visiting
STOCK MARKET DOWN, NEW MEDIA UP
 FOR RELEASE: SUNDAY, NOVEMBER 9, 1997, 4:00 P.M. STOCK MARKET DOWN, NEW MEDIA UP FOR FURTHER INFORMATION CONTACT: Andrew Kohut, Director Beth Donovan, Editor Greg Flemming, Survey Director Pew Research
Promo Mojo: Discovery's 'Gold Rush' Strikes It Rich
 Promo Mojo: Discovery's 'Gold Rush' Strikes It Rich 10.18.2017 With most fall broadcast premieres behind us, cable returned to the top of the Promo Mojo chart, led by the eighth-season debut of Discovery's
Australian. video viewing report
 Australian video viewing report QUARTER 2 2 Introduction W elcome to the Australian Video Viewing Report covering the second quarter of calendar. Its findings confirm the ongoing trend whereby people increasingly
WHAT'S HOT: LINEAR POPULARITY PREDICTION FROM TV AND SOCIAL USAGE DATA Jan Neumann, Xiaodong Yu, and Mohamad Ali Torkamani Comcast Labs
 WHAT'S HOT: LINEAR POPULARITY PREDICTION FROM TV AND SOCIAL USAGE DATA Jan Neumann, Xiaodong Yu, and Mohamad Ali Torkamani Comcast Labs Abstract Large numbers of TV channels are available to TV consumers
FILM, TV & GAMES CONFERENCE 2015
 FILM, TV & GAMES CONFERENCE 2015 Sponsored by April 2015 at The Royal Institution Session 5: Movie Market Update Ben Keen, Chief Analyst & VP, Media, IHS This report summarises a session that took place
Description of Methodology
 Description of Methodology February 12 th, 2018 Description of Methodology Contents CHAPTER 1 OVERVIEW... 1 METHODOLOGY OUTLINE... 1 HOUSEHOLD MEASUREMENTS... 3 DEMOGRAPHIC MEASUREMENTS... 6 VIDEO ON DEMAND
Overview of Television landscape in New LC1* Markets. *Guj LC1, MP LC1, PHCHP LC1, Raj LC1, UP LC1
 Overview of Television landscape in New LC1* Markets *Guj LC1, MP LC1, PHCHP LC1, Raj LC1, UP LC1 Television Universe New LC1 Vs Existing Markets Content Demographic Composition of the Market TV viewing
Reebok Reaches Light TV Viewers with Google and YouTube
 Reebok Reaches Light TV Viewers with Google and YouTube Online is Complementary to TV in a Cross Media Campaign March 2012 Executive Summary 1 2 3 4 Light TV viewers are not reached effectively on TV but
THE CONTINUING GROWTH OF ANYTIME, ALL-THE-TIME VIDEO ENTERTAINMENT
 QURTER 2, 2011 THE CONTINUING GROWTH OF NYTIME, LL-THE-TIME VIDEO ENTERTINMENT Timeshifted TV ushered in a new era of consumer control of media, with emerging technologies driving an explosion of content
Local Programs by Design
 Local Programs by Design By Judith and David LeRoy Every week, TRAC reviews program performance in the 56 metered markets. Through the years, we noted that many stations most popular programs were local
French Canada s Media Landscape Prepared For IAB. French Canada Executive Summary Prepared by PHD Canada, Rob Young January
 French Canada s Media Landscape Prepared For IAB French Canada Executive Summary Prepared by PHD Canada, Rob Young January 21 2015 WHAT S CMUST? Since its inception in 2004, IAB Canada s Canadian Media
The Connected Consumer
 The Connected Consumer The target market exceeds 100 M U.S. adults Connected Mainstreamers, 29% Connected Early Adopters, 9% Resistors, 40% Connection Prospects, 8% Non- Committals, 14% PROJECTED MILLIONS
WBNS 10TV Media Kit. Columbus, OH Market
 WBNS 10TV Media Kit Columbus, OH Market About WBNS-TV From its founding in 1949, WBNS-TV has strived to bring to central Ohio the highest quality news and entertainment programming, while utilizing the
NEWSLETTER. i xãxüá. Watching Habit Grows 25% while Fasting. Data Highlight. NEWSLETTER p.1. This Edition: Data Highlight.
 NEWSLETTER 14th Edition, October 2007 This Edition: Data Highlight Watching Habit Grows 25% while Fasting Looking at 5-year trend: As TV Population Grows, Total Rating Goes Down, Number of Spot Goes Up
2 Television and audio-visual content Recent developments in Scotland
 2 Television and audio-visual content 2 2.1 Recent developments in Scottish Government In October 2011 the Scottish Government published its final progress report on the Scottish Broadcasting Commission
TV Subscriptions and Licence Fees
 TV Subscriptions and Licence Fees The revision of the Federal Law on Radio and Television (RTVA) will direct more license fees to local radio and TV stations. Swiss TV providers are expanding their Replay-Functions.
Promo Mojo: Food Network's 'Wedding Cake Championship' Edges Out World Cup
 Promo Mojo: Food Network's 'Wedding Cake Championship' Edges Out World Cup 06.20.2018 On the strength of 243 million TV ad impressions, a promo for Food Network's Wedding Cake Championship tops our chart.
Lyrics Take Centre Stage In Streaming Music
 Lyrics Take Centre Stage A MIDiA Research White Paper Prepared For LyricFind Lyrics Take Centre Stage The 20,000 Foot View Streaming has driven many fundamental changes in music consumption and music fan
Syndication April 2006
 1 Syndication 2006 April 2006 Syndicated Network Television Association 2 Syndication 2006 Strong Growth Clutter Advantage Improving Brand ROI Year-long Consistency Delivering Younger Viewers 3 Syndication
Where Are They Now? A Follow-up To Our Breaking News Story. August 2015
 Where Are They Now? A Follow-up To Our Breaking News Story August 2015 Where Are They Now? Two years ago we developed an analysis that revealed the older-skewing, overly-cluttered, hyper-competitive environment
Redefining Audience Measurement : Loud, Confused and Incredibly Hollow 吳炯一
 Redefining Audience Measurement : Loud, Confused and Incredibly Hollow 吳炯一 1. TV WORLD IS CHANGING MEDIA CONSUPTION IS GROWING TV is still Popular device but Mobile user Dramatically increase Average time
Description of Methodology
 Description of Methodology November 10 th, 2017 Contents CHAPTER 1 OVERVIEW... 1 METHODOLOGY OUTLINE... 1 HOUSEHOLD MEASUREMENTS... 4 DEMOGRAPHIC MEASUREMENTS... 6 CHAPTER 2 IMPORTING DATA... 9 TUNE INFORMATION...
Cutting the Cord. Presenter. Watch Video Programs on Your Terms
 Cutting the Cord Watch Video Programs on Your Terms Presenter Eric Hayes Network & Systems Administrator Orion Township Public Library ehayes@orionlibrary.org 248.287.8019 I m Here to Help I m repeating
ThinkTV FACT PACK NEW ZEALAND JAN TO DEC 2017
 ThinkTV FACT PACK NEW ZEALAND JAN TO DEC 2017 TV Has Changed NEW ZEALAND Today s TV is a sensory experience enjoyed by over 3 million viewers every week. Powered by new technologies to make TV available