Source/Receiver (SR) Setup
|
|
|
- Marybeth Shepherd
- 6 years ago
- Views:
Transcription
 Setup For")

1 PS User Guide Series 2015 Source/Receiver (SR) Setup For 1-D and 2-D Vs Profiling Prepared By Choon B. Park, Ph.D. January 2015
2 Table of Contents Page 1. Overview 2 2. Source/Receiver (SR) Setup Main Menu Run Wizard Start with a Common Example Import a Previous Setting 9 3. Setup for a 1-D Vs Profile (Working with Sample Data "Vs1DMASW.dat") Pre-Setup SR Specification Specification of Input Records and Running Setup Repeating Setup for Different Records Setup for a 2-D Vs Cross Section (Working with Sample Data "DippingBedrock.dat") Pre-Setup SR Specification Specification of Input Records and Running Setup Setup for a Passive Survey Passive Survey with 1-D Receiver Array (RA) Specification of Surface Location Run and Check Passive Survey with 2-D Receiver Array (RA) Setting Up 2-D Receiver Arrays (RA's) (Circle, Cross, L-Shape, and Random Arrays) Specification of Surface Location Run and Check Setup for (Active/Passive) Combined Survey Combined Survey with 1-D Receiver Array (RA) Combined Survey with 2-D Receiver Array (RA) 54 1
3 1. Overview The main purpose of running source/receiver (SR) setup is to encode the proper distance and location information into the header of each channel's data in the recorded field files (records). This setup is usually encoded into original field records during the field operation by the acquisition software if the operator arranges necessary parameters properly at the beginning of data acquisition. This can be checked at the early stage of SR setup when importing field records of SEG-2 format (and, if they are confirmed to have the correct setup encoded, then they can be saved as a single file in the PS-format [*(SR).dat] ready for the regular MASW analysis and this separate setup procedure will be skipped). If the SR setup was ignored during data acquisition or the original setup is in error, then the correct setup can be encoded by running this "Source/Receiver (SR) Setup" module from the main menu. The overall procedure of SR setup consists of following three (3) steps: Step 1. Pre-Setup Prerequisite information is gathered or confirmed at this step such as the unit of distance (feet or meters), number of channels detected from input, survey type [active, passive, and combined (active + passive) surveys], and receiver array (RA) type (1-D or 2-D). Step 2. Source/Receiver (SR) Specification Actual settings of relative location (in distance and station numbers) of the seismic source (for active and combined survey cases) and individual receivers are specified either all at once through one systematic sequence to all input records, or through a multiple sequence of different settings applied to different portions of the records. This SR specification is treated differently for 1-D and 2-D receiver array (RA) types, respectively. Step 3. Specification of Files To Apply and Running Setup By default, all setup parameters arranged through the previous two steps will be applied to all input records. Otherwise, the proper range of input records to apply the setup to can be chosen at this step before running the actual setup. In this case, multiple setup sequences can be run for different ranges of input records by repeating all three (3) steps and saving (appending) outputs under the same file name. 2
\" and select the files at the same time as illustrated below. Then, the program will detect if any encoded SR setup is found.")
 as a single file of PS-format ready for the regular MASW data analysis and")
4 To import multiple seismic files of SEG-2 format from the main menu, go to "Setup Source/Receiver (SR)" "From SEG-2 Seismic Field Data (*.dat)" and select the files at the same time as illustrated below. Then, the program will detect if any encoded SR setup is found. If so, then you select to view the entire setup in a chart for visual inspection and confirmation. If the displayed setup is confirmed correct, then you can save input record(s) as a single file of PS-format ready for the regular MASW data analysis and skip the separate setup. Otherwise, you need to run your own setup by following the procedures outlined here. 3
5 The SR setup can also be applied to a previously saved file of PS-format from the main menu. In this case, only one file is selected for input. To import an input seismic data file of PS-format from the main menu, "Setup Source/Receiver (SR)" "From Formatted Seismic Data (*.dat)" and select one file as illustrated below. Once the input data set is imported, then the SR setup main menu will be displayed as shown below. 4
6 2. Source/Receiver (SR) Setup Main Menu Main menu consists of three options; "Run Wizard", "Start with a Common Example", and "Import a Previous Setting", each of which is explained below. 2.1 Run Wizard This will enable you to follow a sequence of graphical displays to specify all necessary source/receiver (SR) configuration parameters such as receiver spacing (dx), source offset (X1), source location, how the survey proceeded, etc. This option of "Run Wizard" is further explained in the last two sections of "Source/Receiver (SR) Setup for 1-D Vs Profile" and "Source/Receiver (SR) Setup for 2-D Vs Cross Section." 2.2 Start with a Common Example This will enable you to choose one of the typical settings commonly used in MASW surveys (1-D and 2-D). 5
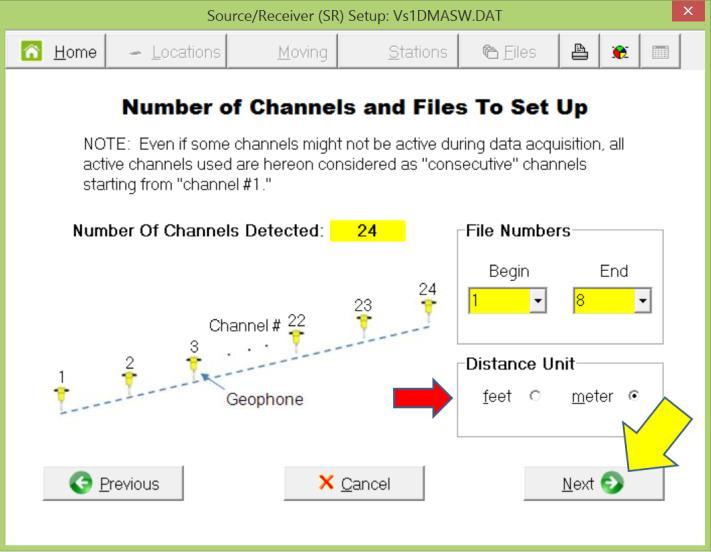
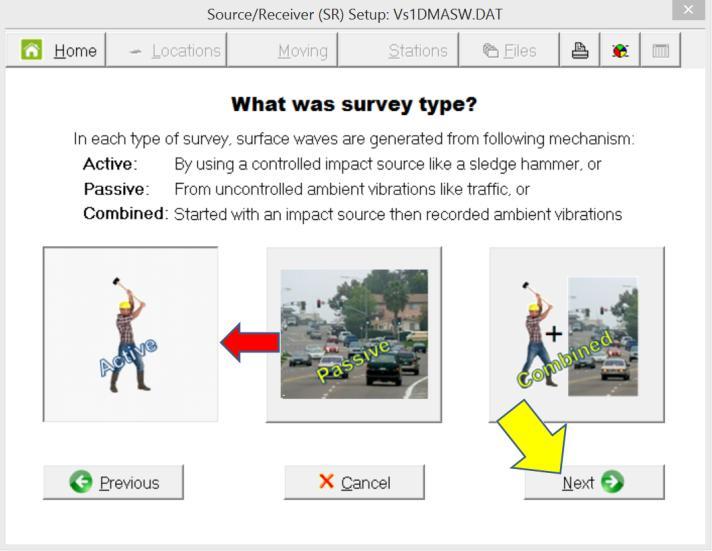
7 It will first draw attention to a few key parameters related to the specific input data set imported for the setup: total number of channels in each of the input records, range of input file numbers, and distance unit used during data acquisition. Be sure to select the appropriate distance unit before proceeding to the next step. The default unit is the one detected from the input data. Then, you are to choose one of the three survey types; active, passive, and (active+passive) combined survey. Each of these options is explained. First, select the "Active" button as shown below. 6
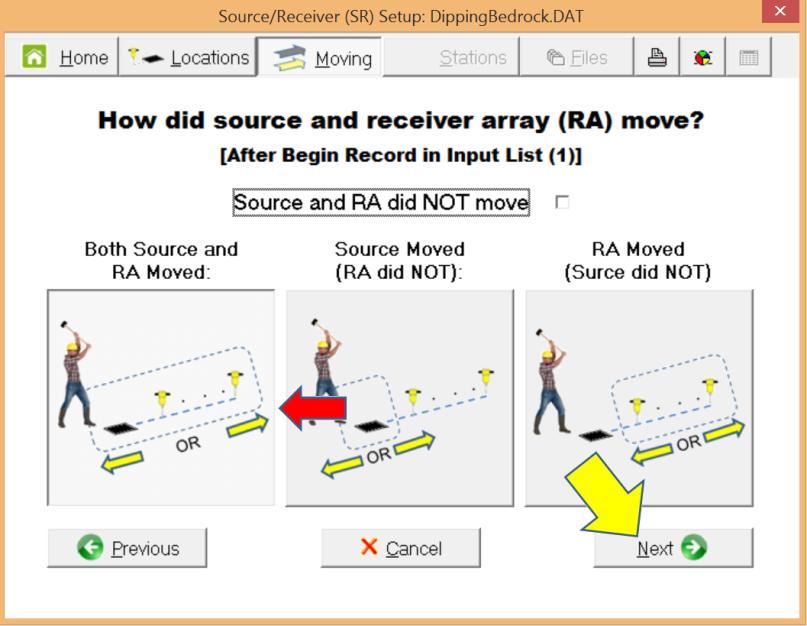
 moved toward source\", \"only source moved away from receivers\", \"source was located off the end of receiver array")
 is to be entered, from which all remaining procedures will be identical (or similar) to the one")
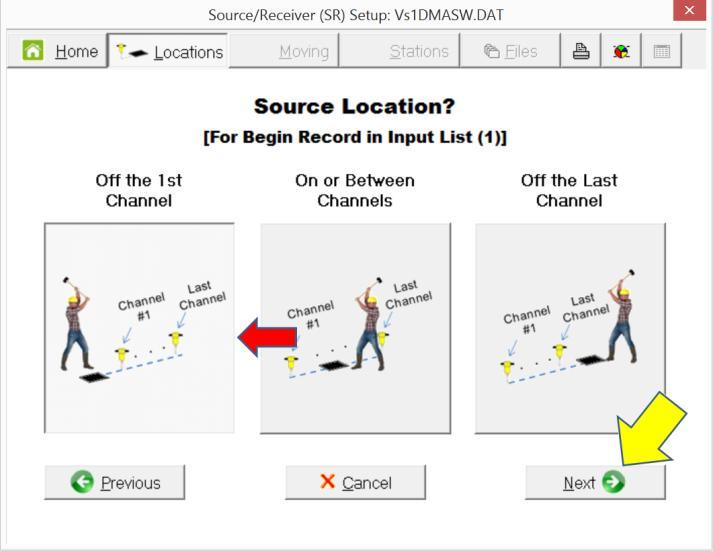
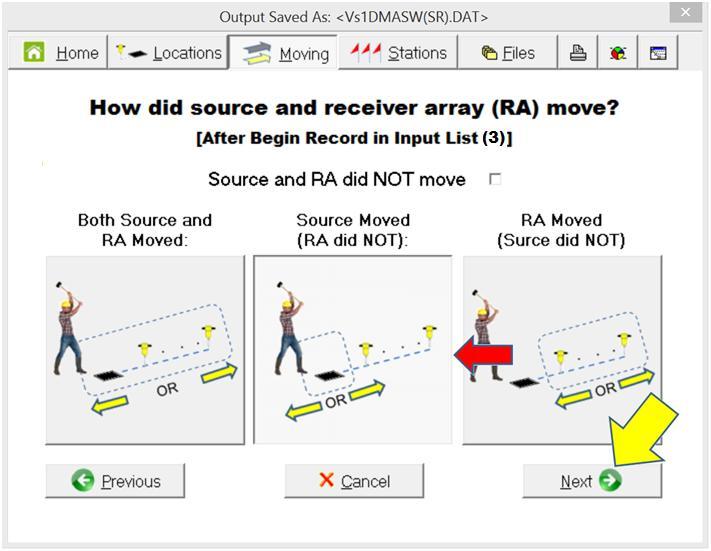
8 The following six (6) cases are then displayed based on the relative move of source and receivers during the survey, from which you can choose the closest case to the input data. Each case is explained clockwise from the top left case: "both (source and receivers) moved toward source", "only source moved away from receivers", "source was located off the end of receiver array (RA)", "both moved toward receivers", "only source moved toward receivers", and "source was located inside the receiver array (RA)." Depending on the case you choose, the next step will be at the place where the receiver spacing (dx) is to be entered, from which all remaining procedures will be identical (or similar) to the one explained in the corresponding steps in the last two sections for 1-D and 2-D setup. If you selected "Passive" as your survey type in the earlier dialog, the procedure is as follows. 7


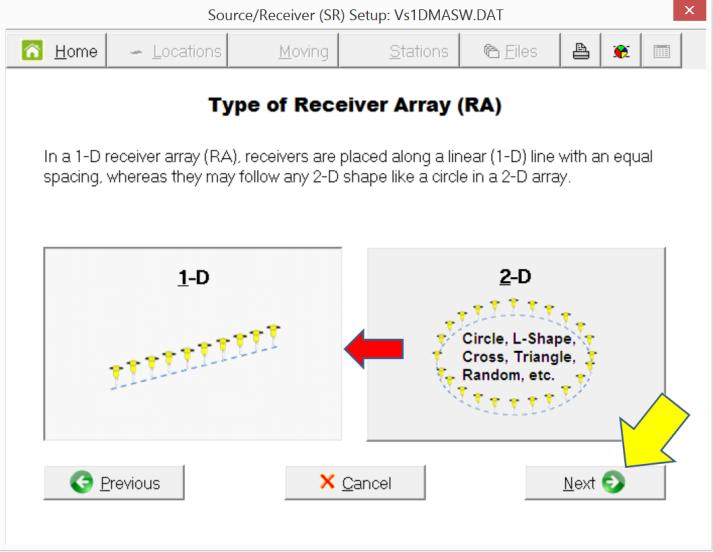
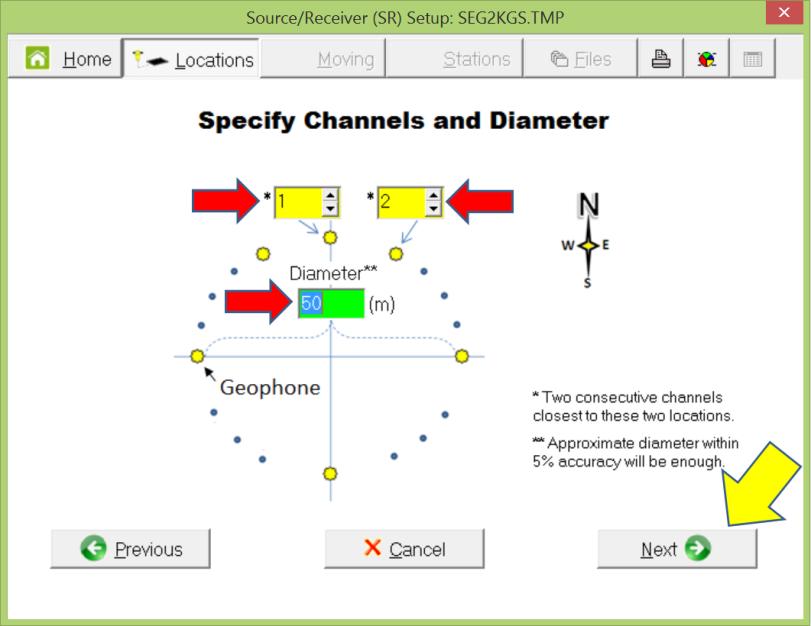
9 For Passive surveys the following dialog for 2-D receiver array (RA) setup will be displayed. (If the 1-D linear RA was used during the passive survey, then you can choose the "Combined" survey type in the previous dialog by inventing a fictitious source point, which does not affect the processing scheme at all). Once you select a specific type of 2-D RA, then the next step will follow the corresponding procedure outlined in the section "Setting Up a 2-D Receiver Array." If you selected "Combined" as your survey type in the earlier dialog, the procedure is as follows. 8

10 For Combined surveys the following dialog allows you to choose the type of receiver array (1-D or 2-D). If the "1-D" case is chosen, then the remaining procedure will be identical to the case of "Active" survey type, whereas the "2-D" case will be identical to the "Passive" case, with only a couple additional steps such as specification of the source location, and the move of source and/or receiver array after recording at each location. 2.3 Import a Previous Setting This procedure enables you to import either the settings last used or those previously saved. After completing the setup each time, two types of parameters will be saved in two separate files as shown in the information dialog displayed after the main dialog below; one file (*.VA_) contains all the variables set during the entire procedure [e.g., survey type, receiver spacing (dx), source offset (X1), etc.], and another file (*.DB_) contains surface coordinate information (i.e., distance and station numbers) of source and receivers associated with an individual file (record) number in the input data set. 9
 will import only those variables last used; the second option [\"Variables from a saved file (*.")
11 Once you choose to "Import a Previous Setting" on the main menu, the following dialog will be displayed asking you to choose what type(s) of saved data you want to import. The first option ("Last variables used") will import only those variables last used; the second option ["Variables from a saved file (*.VA_)"] will allow you to choose a saved file from which to import the variables. The third option ["Total configuration last used (active only)"] will import the complete surface coordinates of source and receivers last used; the last option ["Total configuration from a saved file (active only)(*.db_)"] will let you choose a saved file for this purpose. Depending on which option you choose, the next step will be different. The dialog and figure below are shown after the default option ("Last variables used") has been chosen. 10
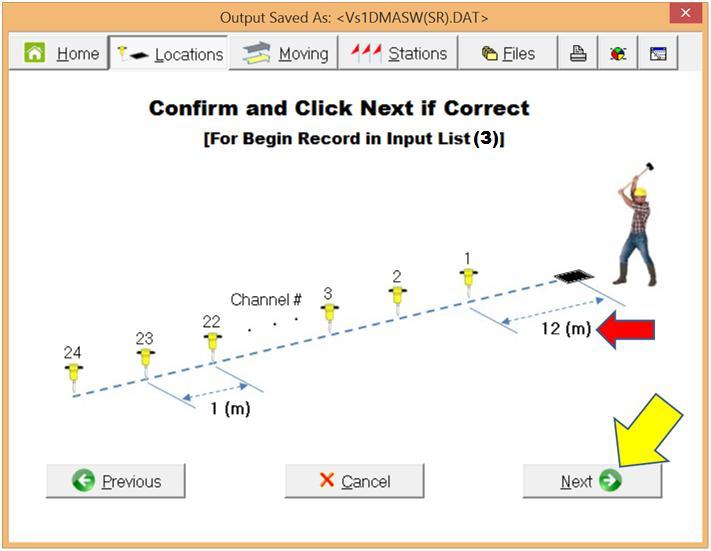
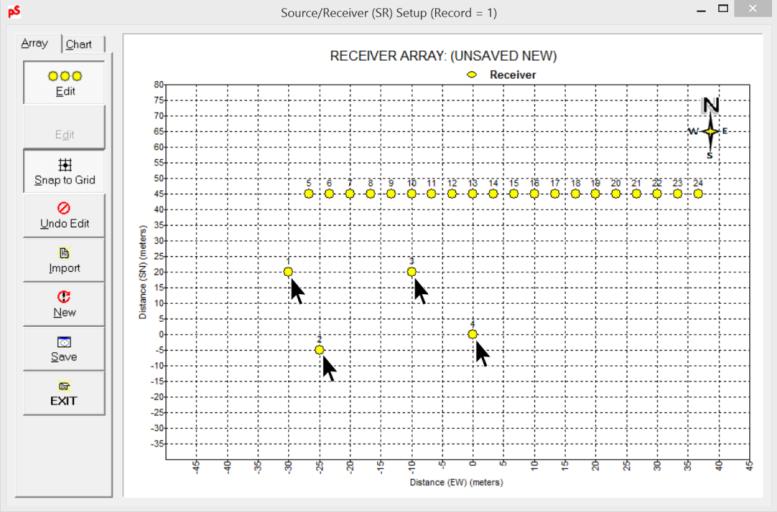
12 3. Setup for a 1-D Vs Profile (Working with Sample Data "Vs1DMASW.dat") This sample data set simulates a set of data from an MASW survey to produce a 1-D shear-wave velocity (Vs) profile commonly used to dictate depth variation of stiffness at a fairly confined area. Typical application would be the MASW survey for geotechnical investigation of wind-turbine sites. The data set is an output from a seismic modeling based on the reflectivity method that is also part of the PS software (available under "Modeling" main menu). This data set consists of eight (8) field records of 24- channel acquisition all bundled in one single file of PS-format, i.e., not in SEG-2 format. Two different source orientations (i.e., forward and reverse shots) and four different source offsets (X1's) are used to produce eight (8) unique records. This is a common practice to maximize the robustness of data analysis. For example, use of different X1's minimizes any adverse influence from the near-field effects, whereas acquiring data from both ends of the receiver array tends to average out any lateral variation in the subsurface velocity model (e.g., dipping or uneven bedrock surface) so that the analysis can achieve the highest resolution in vertical variation. The source/receiver (SR) configuration chart displayed below (Figure 1) shows relative SR location for each record. It shows the receiver array stayed at the same surface location for all eight (8) records, with only the source moving to change offsets (X1's) and orientations. Forward shots refer to those impacts made off the first channel, and reverse shots refer to those made off the last (24th) channel. The table in Figure 2 summarizes locations of source and receivers for each record in the sample data set. The entire procedure to encode the proper SR configuration with this sample data set is demonstrated below. A yellow arrow in the figure indicates a mouse click on the selected place, and a red arrow indicates places and items that need attention. 11
13 Figure 2. Source and receiver (SR) configuration used to generate model data set "Vs1DMASW.dat." 12
14 From main menu, "Setup Source/Receiver (SR)" "From Formatted Seismic Data (*.dat)" Open " Vs1DMASW.DAT." If original field files of SEG-2 format are to be imported instead of a data set already in the PS format, then choose "From SEG-2 Seismic Field Data" as shown below. In this case, import all multiple field files ("records") at the same time as illustrated below. 13

15 3.1 Pre-Setup 14
16 3.2 SR Specification 15
17 16
18 Enter "0.0" for "Ref. Distance" and then "1.0" for next distance. "Ref. Distance" is an arbitrary surface distance coordinate used as a reference point. Therefore, it can be any number. But, the distance for the next channel should be offset (+ or -) by one receiver spacing (dx). Enter "1001" and "1002" for the station numbers for the first two channel positions. Then, click "Next" button. These are arbitrary "station" numbers that must be consecutive. The general convention for station numbering is "1001, 1002, etc." for line 1, and "2001, 2002, etc." for line 2, and so on. They can also decrease instead of increase. 17
19 Review and click "Next" button. 3.3 Specification of Input Records and Running Setup Make sure to specify begin and end record numbers correctly here. The previous specification of moving 5 meters (5dx) is valid only for next record (2), and therefore the end record number should be '2'. The other records will be handled separately (two records at a time) after completion of these two records. Click "Run" to launch the SR setup process. 18
 configuration chart will be displayed that shows the relative location of source and receivers for the first two records (1 and 2).")
20 It will ask for output file name first. Default output file name is "Vs1DMASW(SR).DAT." The source/receiver (SR) configuration chart will be displayed that shows the relative location of source and receivers for the first two records (1 and 2). The configuration can also be displayed in "Stations" by clicking the button on top menu. Close the chart. It is now time to set up SR for next two records (3 and 4). The box shown below reminds you of this. 19


21 3.4 Repeating Setup for Different Records Select '3' and '4' for the begin and end records, respectively. Then, click 'Locations' button at the top. 20
22 21
23 Make sure you use the same convention previously used for distance and station numbering; x = 0.0 m (station number = 1001) at 24th channel, and x = 1.0 m (station number = 1002) at 23rd channel, etc. 22
24 It is now time to set up SR for next two records (5 and 6). The box shown below reminds you of this. Select '5' and '6' for the begin and end records, respectively. Then, click 'Locations' button at the top. 23
.")
25 Now, make sure "Off the Last Channel" button is selected because the two records were acquired with the source on the opposite side of receiver array (i.e., "reverse shots"). Click "Next" button. 24
 at 24th channel, and x = 1.0 m (station number = 1002) at 23rd channel, etc.")
 and \"22\" (\"1023\") for distance (station number) of the first two channels,")
26 Make sure you use the same convention previously used for distance and station numbering; x = 0.0 m (station number = 1001) at 24th channel, and x = 1.0 m (station number = 1002) at 23rd channel, etc. Now, displayed configuration requires this information to be set for the first two channels (1st and 2nd). Therefore, enter "23" ("1024") and "22" ("1023") for distance (station number) of the first two channels, respectively. 25
 configuration chart will be displayed that shows relative location of source")
 have source located at a negative distance because they are")
27 Make sure begin and end records are set to '5' and '6,' respectively. Then, click 'Run' button. The source/receiver (SR) configuration chart will be displayed that shows relative location of source and receivers for all records saved in the output file (1, 2, 3, 4, 5, and 6). Make sure the last two records (5 and 6) have source located at a negative distance because they are "reverse" shots. Close the chart. 26


28 Now, it is time to set up SR for the last two records (7 and 8). The box shown below reminds you of this. 27
. Click \"Next\" button.")
29 Confirm source location and enter "12" for the source offset (X1). Click "Next" button. 28

 at 23rd channel, etc.")
30 Make sure you use the same convention previously used for distance and station numbering; x = 23 m (station number = 1024) at 24th channel, and x = 22 m (station number = 1023) at 23rd channel, etc. 29
31 Make sure begin and end records are set to '7' and '8,' respectively. Then, click 'Run' button. The source/receiver (SR) configuration chart will be displayed that shows relative location of source and receivers for all the records saved in the output file (1-8). Close the chart. 30
32 Now, SR setup is complete. Click "Next" button. All variables (*.VA_) and configuration (*.DB_) information will be saved for future use. 31
 is an output from a seismic modeling using the reflectivity method that is also part of the PS (available under \"Modeling\" main menu).")
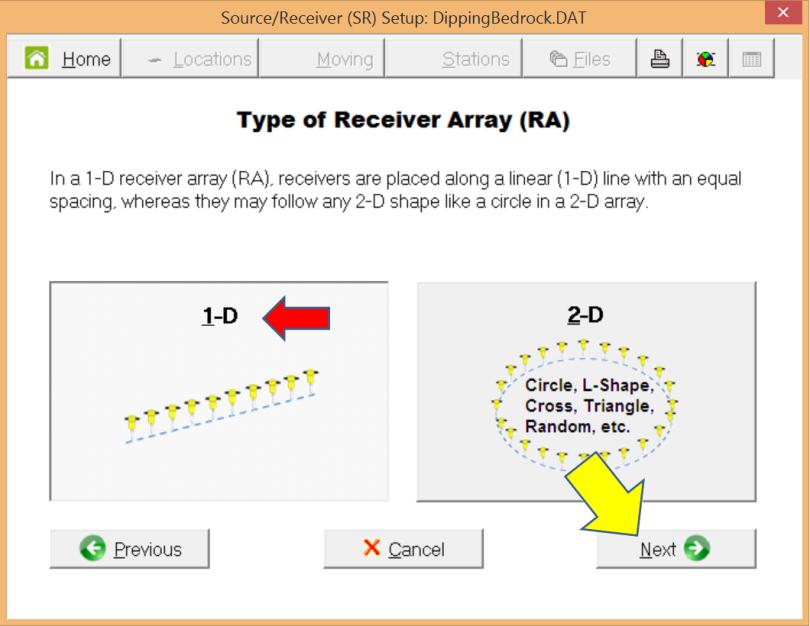
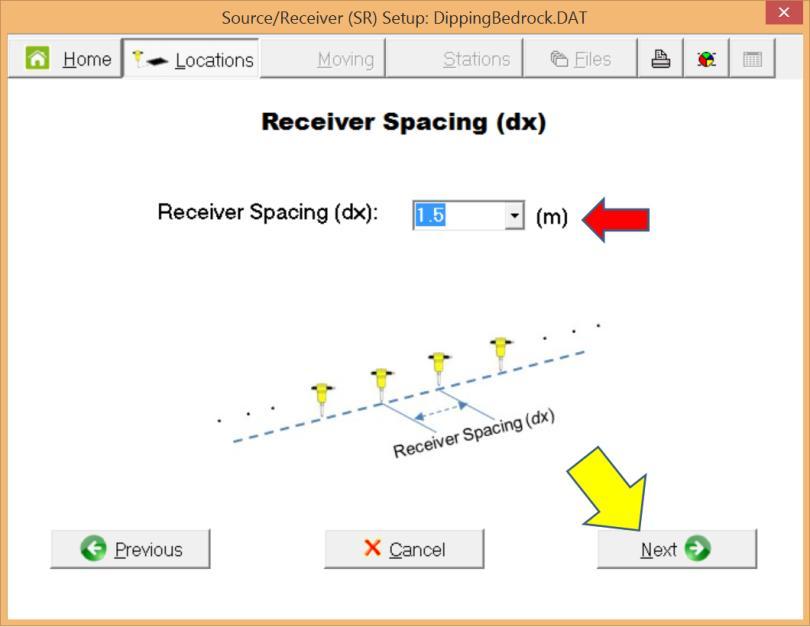
33 4. Setup for a 2-D Vs Cross Section (Working with Sample Data "DippingBedrock.dat") The sample data set for 2-D Vs cross section generation ("DippingBedrock.dat") is an output from a seismic modeling using the reflectivity method that is also part of the PS (available under "Modeling" main menu). It consists of twenty (20) field records of 24-channel acquisition all bundled in one single file of PS-format, i.e., not in SEG-2 format. The source/receiver (SR) configuration chart displayed below (Figure 1) shows relative SR location for each record included the sample data set within the surveyed (i.e., modeled) surface distance. It shows the receiver spacing (dx) of 1.5-m was used with the source offset (X1) of 9-m (6dx). It also shows the entire SR configuration moved by 9 meters (6dx) each time after acquiring a record at one location. The entire procedure to encode the proper SR configuration with this sample data set is demonstrated below. A yellow arrow in the figure indicates a mouse click on the selected place, and a red arrow indicates places and items that need attention. Figure 1. Velocity (Vs) model used produce the sample data set ("DippingBedrock.dat") and the source/receiver (SR) configuration used during the modeling. 32
\" Open \"DippingBedrock.DAT.")

34 From the main menu, "Setup Source/Receiver (SR)" "From Formatted Seismic Data (*.dat)" Open "DippingBedrock.DAT." If original field files of SEG-2 format are to be imported instead of a data set already in the PS format, then choose "From SEG-2 Seismic Field Data" as shown below. In this case, import all multiple field files ("records") at the same time as illustrated below. 33
35 4.1 Pre-Setup 34
36 4.2 SR Specification 35
37 36
 by one receiver spacing (dx).")

38 Enter "0.0" for "Ref. Distance" and then "1.5" for next distance. "Ref. Distance" is an arbitrary surface distance coordinate used as a reference point. Therefore, it can be any number. But, the distance for the next channel should be offset (+ or -) by one receiver spacing (dx). Enter "1001" and "1002" for the station numbers for the first two channel positions. Then, click "Next" button. These are arbitrary "station" numbers that must be consecutive. The general convention for station numbering is "1001, 1002, etc." for line 1, and "2001, 2002, etc." for line 2, and so on. They can also decrease instead of increase. 37
.DAT.")
39 4.3 Specification of Input Records and Running Setup Click "Run" to launch the SR setup process. It will ask for the output file name first. Default output file name is "DippingBedrock(SR).DAT." 38

40 At the end of the process, the SR configuration chart will be displayed that shows relative locations of source and receivers within the entire distance of survey. The configuration can also be displayed in "Stations" by clicking the button on top menu. Close the chart. Click "Exit" button. It will show the file name where all the setup parameters will be saved so that you can import them by opening the file at the beginning of the next SR setup process. All variables (*.VA_) and configuration (*.DB_) information will be saved for future use. 39

41 5. Setup for a Passive Survey 5.1 Passive Survey with 1-D Receiver Array (RA) 40


42 If the receiver array moved regularly like an active survey, then you can treat the input as a data set from a "combined" survey that will make the entire setup procedure more intuitive. Otherwise, you can proceed with the current "passive survey" option. 41
43 5.1.1 Specification of Surface Location Record numbers are associated with surface distance and station numbers as shown below. If more than one record was acquired at a given location, then it can be specified so in the "Records/Location" edit box. The "Use Below" buttons under "Distance" and "Station #" will enable the automatic listing of values in the corresponding combo boxes by calculating distances and station numbers based on the values specified in the "Begin" and "Interval" edit boxes. The "Link distance with receiver station number" check box will force (if checked) the station numbers to change by the distance interval. The dialog with all three combo boxes expanded shows item values set by clicking the "Use Below" buttons. 42
![5.1.2 Run and Check Click "Run" and output will be saved as a single file of PS-format [*(SR).dat].](/docs-images/77/76474403/images/44-1.jpg "The saved file can be opened for display by going to \"Display\" \"Seismic Data\" Once the file is displayed, its encoded SR setup can be")
44 5.1.2 Run and Check Click "Run" and output will be saved as a single file of PS-format [*(SR).dat]. The saved file can be opened for display by going to "Display" "Seismic Data" Once the file is displayed, its encoded SR setup can be displayed by clicking "SR setup" button. 43
45 SR Setup Chart Configuration of the receiver array (RA) can also be displayed by clicking "Receiver Array" button. Receiver Array (RA) Chart 44
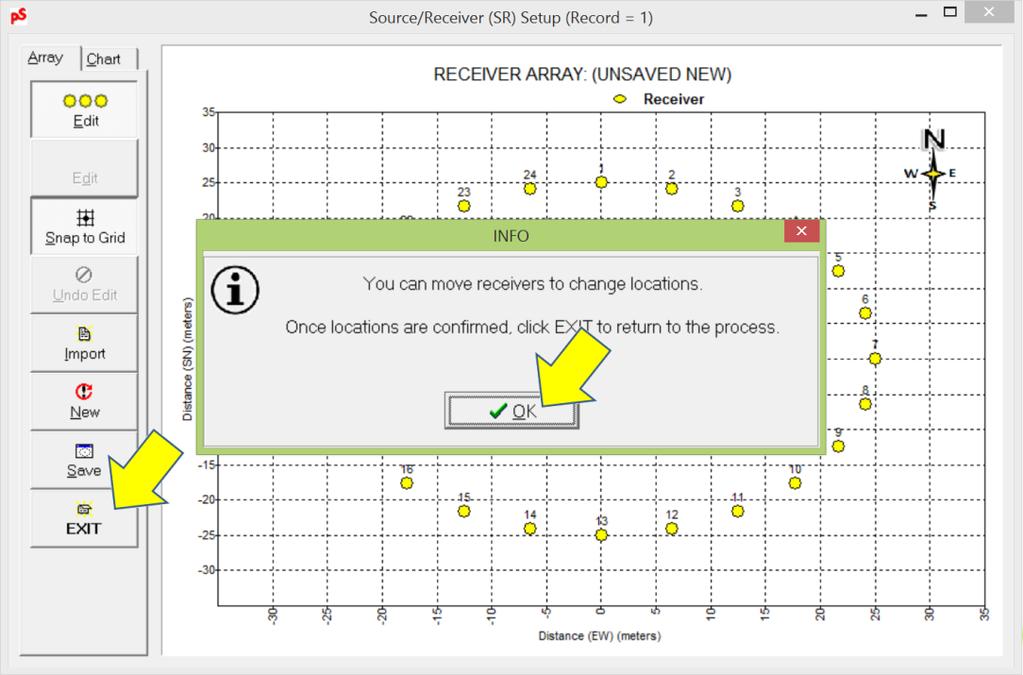
46 5.2 Passive Survey with 2-D Receiver Array (RA) Setting Up 2-D Receiver Arrays (RA's) (Circle, Cross, L-Shape, and Random Arrays) Example of Circular RA 45
47 46

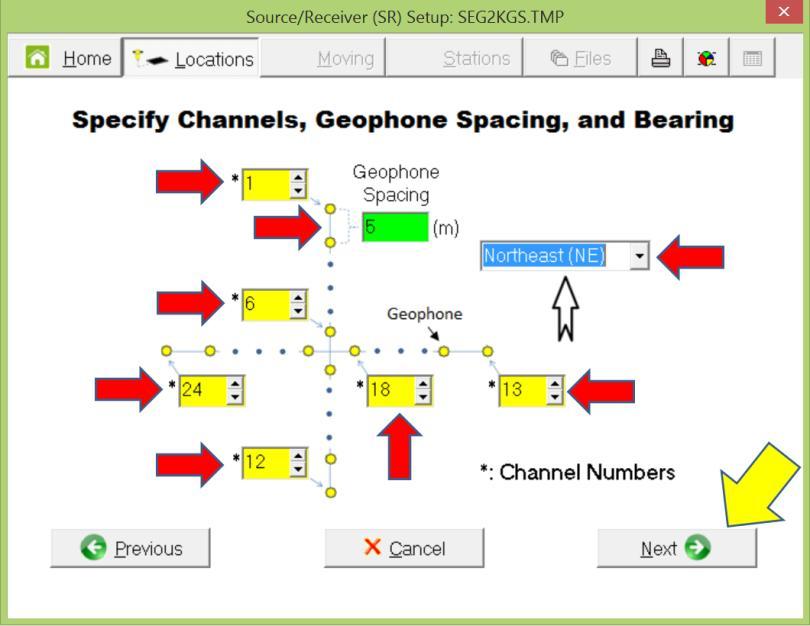
48 Example of Cross RA 47

49 Example of L-shaped RA 48

50 Example of Random RA 49


51 5.2.2 Specification of Surface Location Record numbers are associated with surface distance and station numbers as shown below. If more than one record was acquired at a given location, then it can be specified so in the "Records/Location" edit box. The "Use Below" buttons under "Distance" and "Station #" will enable the automatic listing of values in the corresponding combo boxes by calculating distances and station numbers based on the values specified in the "Begin" and "Interval" edit boxes. The "Link distance with receiver station number" check box will force (if checked) the station numbers to change by the distance interval. The dialog with all three combo boxes expanded shows item values set by clicking the "Use Below" buttons. 50
52 5.2.3 Run and Check Illustrated below is for the case of "Circular" receiver array (RA) The saved file can be opened for display by going to "Display" "Seismic Data" Once the file is displayed, its encoded SR setup can be displayed by clicking the "SR setup" button. 51

53 SR Setup Chart Configuration of the receiver array (RA) can also be displayed by clicking the "Receiver Array" button. Receiver Array (RA) Chart 52
 This case will be identical to the active")
54 6. Setup for (Active/Passive) Combined Survey 6.1 Combined Survey with 1-D Receiver Array (RA) This case will be identical to the active survey with 1-D RA described in sections 3 and 4. 53
55 6.2 Combined Survey with 2-D Receiver Array (RA) Receiver array (RA) types will be identical to those described in section 5.2 ["Passive Survey with 2-D Receiver Array (RA)"] and the remaining procedure will be identical to that described in the same section. The only difference is specification of the source location in the array chart as illustrated below. 54


56 Select (depress) the "source edit" button in the tool panel so you can click and drag the source to a proper location. First, it may be necessary to have a larger scale for the chart display. To change the scale of the chart display, select the "Chart" tab and click the "Controls" button in the tool panel of the chart form. Then, select one of the sample scale presets. 55
\" described in")
57 After setting the source at the proper location, click "Exit" to return to the setup dialog. From here the remaining procedure is identical to that of the "Passive Survey with 2-D Receiver Array (RA)" described in sections and
PS User Guide Series Seismic-Data Display
 PS User Guide Series 2015 Seismic-Data Display Prepared By Choon B. Park, Ph.D. January 2015 Table of Contents Page 1. File 2 2. Data 2 2.1 Resample 3 3. Edit 4 3.1 Export Data 4 3.2 Cut/Append Records
Please feel free to download the Demo application software from analogarts.com to help you follow this seminar.
 Hello, welcome to Analog Arts spectrum analyzer tutorial. Please feel free to download the Demo application software from analogarts.com to help you follow this seminar. For this presentation, we use a
Getting Started with the LabVIEW Sound and Vibration Toolkit
 1 Getting Started with the LabVIEW Sound and Vibration Toolkit This tutorial is designed to introduce you to some of the sound and vibration analysis capabilities in the industry-leading software tool
SR-D8-M, SR-D8-S. (Ver ) SOFTWARE INSTRUCTIONS
 SOFTWARE INSTRUCTIONS") SOFTWARE INSTRUCTIONS active l ine array speak er SYStems SR-D8-M, SR-D8-S (Ver. 1.1.1) Thank you for purchasing TOA's Active Line Array Speaker Systems. Please carefully follow the instructions in this
SOFTWARE INSTRUCTIONS active l ine array speak er SYStems SR-D8-M, SR-D8-S (Ver. 1.1.1) Thank you for purchasing TOA's Active Line Array Speaker Systems. Please carefully follow the instructions in this
Import and quantification of a micro titer plate image
 BioNumerics Tutorial: Import and quantification of a micro titer plate image 1 Aims BioNumerics can import character type data from TIFF images. This happens by quantification of the color intensity and/or
Pre-processing of revolution speed data in ArtemiS SUITE 1
 03/18 in ArtemiS SUITE 1 Introduction 1 TTL logic 2 Sources of error in pulse data acquisition 3 Processing of trigger signals 5 Revolution speed acquisition with complex pulse patterns 7 Introduction
B2 Spice A/D Tutorial Author: B. Mealy revised: July 27, 2006
 B2 Spice A/D Tutorial Author: B. Mealy revised: July 27, 2006 The B 2 Spice A/D software allows for the simulation of digital, analog, and hybrid circuits. CPE 169, however, is only concerned with the
VISSIM Tutorial. Starting VISSIM and Opening a File CE 474 8/31/06
 VISSIM Tutorial Starting VISSIM and Opening a File Click on the Windows START button, go to the All Programs menu and find the PTV_Vision directory. Start VISSIM by selecting the executable file. The following
A few quick notes about the use of Spectran V2
 A few quick notes about the use of Spectran V2 The full fledged help file of Spectran is not ready yet, but many have asked for some sort of help. This document tries to explain in a quick-and-dirty way
SigPlay User s Guide
 SigPlay User s Guide . . SigPlay32 User's Guide? Version 3.4 Copyright? 2001 TDT. All rights reserved. No part of this manual may be reproduced or transmitted in any form or by any means, electronic or
Table of content. Table of content Introduction Concepts Hardware setup...4
 Table of content Table of content... 1 Introduction... 2 1. Concepts...3 2. Hardware setup...4 2.1. ArtNet, Nodes and Switches...4 2.2. e:cue butlers...5 2.3. Computer...5 3. Installation...6 4. LED Mapper
D-901 PC SOFTWARE Version 3
 INSTRUCTION MANUAL D-901 PC SOFTWARE Version 3 Please follow the instructions in this manual to obtain the optimum results from this unit. We also recommend that you keep this manual handy for future reference.
DIGITAL PERSONAL STUDIO Version 1.30 Addendum
 DIGITAL PERSONAL STUDIO Version 1.30 Addendum Contents V1.30 FEATURES...1 AK.SYS TRACKVIEW...2 INSTALLING AK.SYS TRACKVIEW...2 USING AK.SYS TRACKVIEW...3 METERS...4 IN / OUT TIMES...5 TIMECODE DISPLAY...5
APM CALIBRATION PROCEDURE Rev. A June 3, 2015
 APM CALIBRATION PROCEDURE Rev. A June 3, 2015 Calibration of the APM allows system parameters such as coupler coupling values, interconnecting cable losses and system feeder losses to be programmed into
Agilent Parallel Bit Error Ratio Tester. System Setup Examples
 Agilent 81250 Parallel Bit Error Ratio Tester System Setup Examples S1 Important Notice This document contains propriety information that is protected by copyright. All rights are reserved. Neither the
VISSIM TUTORIALS This document includes tutorials that provide help in using VISSIM to accomplish the six tasks listed in the table below.
 VISSIM TUTORIALS This document includes tutorials that provide help in using VISSIM to accomplish the six tasks listed in the table below. Number Title Page Number 1 Adding actuated signal control to an
Blueline, Linefree, Accuracy Ratio, & Moving Absolute Mean Ratio Charts
 INTRODUCTION This instruction manual describes for users of the Excel Standard Celeration Template(s) the features of each page or worksheet in the template, allowing the user to set up and generate charts
Using different reference quantities in ArtemiS SUITE
 06/17 in ArtemiS SUITE ArtemiS SUITE allows you to perform sound analyses versus a number of different reference quantities. Many analyses are calculated and displayed versus time, such as Level vs. Time,
1 OVERVIEW 2 WHAT IS THE CORRECT TIME ANYWAY? Application Note 3 Transmitting Time of Day using XDS Packets 2.1 UTC AND TIMEZONES
 1 OVERVIEW This application note describes how to properly encode Time of Day information using EIA-608-B Extended Data Services (XDS) packets. In the United States, the Public Broadcasting System (PBS)
Software Quick Manual
 XX113-30-00 Workstation and NVR Quick Manual Vicon Industries Inc. does not warrant that the functions contained in this equipment will meet your requirements or that the operation will be entirely error
Transmitter Interface Program
 Transmitter Interface Program Operational Manual Version 3.0.4 1 Overview The transmitter interface software allows you to adjust configuration settings of your Max solid state transmitters. The following
Cablecast SX. Setup Guide. c Tightrope Media Systems For Cablecast version Build 206
 Cablecast SX Setup Guide c Tightrope Media Systems For Cablecast version 5.2.11 Build 206 Printed June 5, 2015 1 Cablecast SX Setup 1.1 Prerequisites 1.2 Overview of Setup Thank you for purchasing a Cablecast
Yellow Frog. Manual Version 1.1
 Yellow Frog Manual Version 1.1 1 YellowFrog Contents PC Requirements...... 2 YellowFrog Power Meter Measurement.... 3 YellowFrog PC Software..... 3 Main Screen....... 4 Input Overload....... 5 Battery
GLog Users Manual.
 GLog Users Manual GLog is copyright 2000 Scott Technical Instruments It may be copied freely provided that it remains unmodified, and this manual is distributed with it. www.scottech.net Introduction GLog
More Skills 14 Watch TV in Windows Media Center
 M05_TOWN5764_01_SE_SM5.QXD 11/24/10 1:08 PM Page 1 Chapter 5 Windows 7 More Skills 14 Watch TV in Windows Media Center You can watch and record broadcast TV in Windows Media Center. To watch and record
WAVES Cobalt Saphira. User Guide
 WAVES Cobalt Saphira TABLE OF CONTENTS Chapter 1 Introduction... 3 1.1 Welcome... 3 1.2 Product Overview... 3 1.3 Components... 5 Chapter 2 Quick Start Guide... 6 Chapter 3 Interface and Controls... 7
v. 8.0 GMS 8.0 Tutorial MODFLOW Grid Approach Build a MODFLOW model on a 3D grid Prerequisite Tutorials None Time minutes
 v. 8.0 GMS 8.0 Tutorial Build a MODFLOW model on a 3D grid Objectives The grid approach to MODFLOW pre-processing is described in this tutorial. In most cases, the conceptual model approach is more powerful
A Matlab toolbox for. Characterisation Of Recorded Underwater Sound (CHORUS) USER S GUIDE
 USER S GUIDE") Centre for Marine Science and Technology A Matlab toolbox for Characterisation Of Recorded Underwater Sound (CHORUS) USER S GUIDE Version 5.0b Prepared for: Centre for Marine Science and Technology Prepared
Centre for Marine Science and Technology A Matlab toolbox for Characterisation Of Recorded Underwater Sound (CHORUS) USER S GUIDE Version 5.0b Prepared for: Centre for Marine Science and Technology Prepared
Cablecast Server. Setup Guide. c Tightrope Media Systems For Cablecast version Build 74
 Cablecast Server Setup Guide c Tightrope Media Systems For Cablecast version 6.1.2 Build 74 Printed July 22, 2016 1 Cablecast Server Setup 1.1 Prerequisites 1.2 Overview of Setup Thank you for purchasing
Exercise 5. Troubleshooting a QAM/DQAM Modem EXERCISE OBJECTIVE DISCUSSION OUTLINE DISCUSSION. Signal flow tracing
 Exercise 5 Troubleshooting a QAM/DQAM Modem EXERCISE OBJECTIVE When you have completed this exercise, you will have acquired an efficient procedure for troubleshooting instructor-inserted faults in the
JAMAR TRAX RD Detector Package Power Requirements Installation Setting Up The Unit
 JAMAR TRAX RD The TRAX RD is an automatic traffic recorder designed and built by JAMAR Technologies, Inc. Since the unit is a Raw Data unit, it records a time stamp of every sensor hit that occurs during
Software Quick Manual
 XX113-30-01 Workstation and NVR Quick Manual Vicon Industries Inc. does not warrant that the functions contained in this equipment will meet your requirements or that the operation will be entirely error
DDA-UG-E Rev E ISSUED: December 1999 ²
 7LPHEDVH0RGHVDQG6HWXS 7LPHEDVH6DPSOLQJ0RGHV Depending on the timebase, you may choose from three sampling modes: Single-Shot, RIS (Random Interleaved Sampling), or Roll mode. Furthermore, for timebases
VIDEO GRABBER. DisplayPort. User Manual
 VIDEO GRABBER DisplayPort User Manual Version Date Description Author 1.0 2016.03.02 New document MM 1.1 2016.11.02 Revised to match 1.5 device firmware version MM 1.2 2019.11.28 Drawings changes MM 2
KRAMER ELECTRONICS LTD. USER MANUAL
 KRAMER ELECTRONICS LTD. USER MANUAL MODEL: Projection Curved Screen Blend Guide How to blend projection images on a curved screen using the Warp Generator version K-1.4 Introduction The guide describes
Using SignalTap II in the Quartus II Software
 White Paper Using SignalTap II in the Quartus II Software Introduction The SignalTap II embedded logic analyzer, available exclusively in the Altera Quartus II software version 2.1, helps reduce verification
Eventide Inc. One Alsan Way Little Ferry, NJ
 Copyright 2015, Eventide Inc. P/N: 141257, Rev 2 Eventide is a registered trademark of Eventide Inc. AAX and Pro Tools are trademarks of Avid Technology. Names and logos are used with permission. Audio
Quick Reference Manual
 Quick Reference Manual V1.0 1 Contents 1.0 PRODUCT INTRODUCTION...3 2.0 SYSTEM REQUIREMENTS...5 3.0 INSTALLING PDF-D FLEXRAY PROTOCOL ANALYSIS SOFTWARE...5 4.0 CONNECTING TO AN OSCILLOSCOPE...6 5.0 CONFIGURE
TechNote: MuraTool CA: 1 2/9/00. Figure 1: High contrast fringe ring mura on a microdisplay
 Mura: The Japanese word for blemish has been widely adopted by the display industry to describe almost all irregular luminosity variation defects in liquid crystal displays. Mura defects are caused by
With Export all setting information (preferences, user setttings) can be exported into a text file.
 can be exported into a text file.") Release Notes 1 Release Notes What s new in release 1.6 Version 1.6 contains many new functions that make it easier to work with the program and more powerful for users. 1. Preferences Export Menu: Info
Release Notes 1 Release Notes What s new in release 1.6 Version 1.6 contains many new functions that make it easier to work with the program and more powerful for users. 1. Preferences Export Menu: Info
User Manual OVP Raman
 Version 6 User Manual OVP Raman 2006 BRUKER OPTIK GmbH, Rudolf-Plank-Straße 27, D-76275 Ettlingen, www.brukeroptics.com All rights reserved. No part of this manual may be reproduced or transmitted in any
Cisco Spectrum Expert Software Overview
 CHAPTER 5 If your computer has an 802.11 interface, it should be enabled in order to detect Wi-Fi devices. If you are connected to an AP or ad-hoc network through the 802.11 interface, you will occasionally
E X P E R I M E N T 1
 E X P E R I M E N T 1 Getting to Know Data Studio Produced by the Physics Staff at Collin College Copyright Collin College Physics Department. All Rights Reserved. University Physics, Exp 1: Getting to
Table of Contents. 2 Select camera-lens configuration Select camera and lens type Listbox: Select source image... 8
 Table of Contents 1 Starting the program 3 1.1 Installation of the program.......................... 3 1.2 Starting the program.............................. 3 1.3 Control button: Load source image......................
Lab Determining the Screen Resolution of a Computer
 Lab 1.3.3 Determining the Screen Resolution of a Computer Objectives Determine the current screen resolution of a PC monitor. Determine the maximum resolution for the highest color quality. Calculate the
SNG-2150C User s Guide
 SNG-2150C User s Guide Avcom of Virginia SNG-2150C User s Guide 7730 Whitepine Road Revision 001 Richmond, VA 23237 USA GENERAL SAFETY If one or more components of your earth station are connected to 120
Topic: Instructional David G. Thomas December 23, 2015
 Procedure to Setup a 3ɸ Linear Motor This is a guide to configure a 3ɸ linear motor using either analog or digital encoder feedback with an Elmo Gold Line drive. Topic: Instructional David G. Thomas December
iii Table of Contents
 i iii Table of Contents Display Setup Tutorial....................... 1 Launching Catalyst Control Center 1 The Catalyst Control Center Wizard 2 Enabling a second display 3 Enabling A Standard TV 7 Setting
Lab experience 1: Introduction to LabView
 Lab experience 1: Introduction to LabView LabView is software for the real-time acquisition, processing and visualization of measured data. A LabView program is called a Virtual Instrument (VI) because
TL-2900 AMMONIA & NITRATE ANALYZER DUAL CHANNEL
 TL-2900 AMMONIA & NITRATE ANALYZER DUAL CHANNEL DATA ACQUISITION SYSTEM V.15.4 INSTRUCTION MANUAL Timberline Instruments, LLC 1880 S. Flatiron Ct., Unit I Boulder, Colorado 80301 Ph: (303) 440-8779 Fx:
(Skip to step 11 if you are already familiar with connecting to the Tribot)
") LEGO MINDSTORMS NXT Lab 5 Remember back in Lab 2 when the Tribot was commanded to drive in a specific pattern that had the shape of a bow tie? Specific commands were passed to the motors to command how
LEGO MINDSTORMS NXT Lab 5 Remember back in Lab 2 when the Tribot was commanded to drive in a specific pattern that had the shape of a bow tie? Specific commands were passed to the motors to command how
MODFLOW - Grid Approach
 GMS 7.0 TUTORIALS MODFLOW - Grid Approach 1 Introduction Two approaches can be used to construct a MODFLOW simulation in GMS: the grid approach and the conceptual model approach. The grid approach involves
Standard Operating Procedure of nanoir2-s
 Standard Operating Procedure of nanoir2-s The Anasys nanoir2 system is the AFM-based nanoscale infrared (IR) spectrometer, which has a patented technique based on photothermal induced resonance (PTIR),
The Measurement Tools and What They Do
 2 The Measurement Tools The Measurement Tools and What They Do JITTERWIZARD The JitterWizard is a unique capability of the JitterPro package that performs the requisite scope setup chores while simplifying
GS122-2L. About the speakers:
 Dan Leighton DL Consulting Andrea Bell GS122-2L A growing number of utilities are adapting Autodesk Utility Design (AUD) as their primary design tool for electrical utilities. You will learn the basics
What s New in Raven May 2006 This document briefly summarizes the new features that have been added to Raven since the release of Raven
 What s New in Raven 1.3 16 May 2006 This document briefly summarizes the new features that have been added to Raven since the release of Raven 1.2.1. Extensible multi-channel audio input device support
MICROSOFT WORD FEATURES FOR ARTS POSTGRADUATES
 MICROSOFT WORD FEATURES FOR ARTS POSTGRADUATES...2 Page Setup...3 Styles...4 Using Inbuilt Styles...4 Modifying a Style...5 Creating a Style...5 Section Breaks...6 Insert a section break...6 Delete a section
How to Optimize Ad-Detective
 How to Optimize Ad-Detective Ad-Detective technology is based upon black level detection. There are several important criteria to consider: 1. Does the video have black frames to detect? Are there any
Creating and fully utilizing the retention time standard processing method for a more automated IC workflow
 TECHNICAL NOTE Creating and fully utilizing the retention time standard processing method for a more automated IC workflow No. 178 Jay Lorch, Thermo Fisher Scientific, Sunnyvale, CA Keywords Retention
Reference. TDS7000 Series Digital Phosphor Oscilloscopes
 Reference TDS7000 Series Digital Phosphor Oscilloscopes 07-070-00 0707000 To Use the Front Panel You can use the dedicated, front-panel knobs and buttons to do the most common operations. Turn INTENSITY
Session 1 Introduction to Data Acquisition and Real-Time Control
 EE-371 CONTROL SYSTEMS LABORATORY Session 1 Introduction to Data Acquisition and Real-Time Control Purpose The objectives of this session are To gain familiarity with the MultiQ3 board and WinCon software.
My XDS Receiver- Affiliate Scheduler
 My XDS Receiver- Affiliate Scheduler The XDS distribution system represents a marked departure from the architecture and feature set of previous generations of satellite receivers. Unlike its predecessors,
Be a Digital Professional! Set-Up of TrainController 8.0 Gold for the TurnTable- Decoder TT-DEC-R with Roco H0 Turntable 42615
 LDT Digital-Compendium (TT-DEC-R-TC-001_12_EN) Littfinski DatenTechnik (LDT) Be a Digital Professional! Set-Up of TrainController 8.0 Gold for the TurnTable- Decoder TT-DEC-R with Roco H0 Turntable 42615
Exercise 5-1. Troubleshooting Techniques EXERCISE OBJECTIVE DISCUSSION OUTLINE DISCUSSION. Signal flow tracing
 Exercise 5-1 Troubleshooting Techniques EXERCISE OBJECTIVE When you have completed this exercise, you will be able to apply a systematic technique of signal flow tracing to diagnose instructor-inserted
For the SIA. Applications of Propagation Delay & Skew tool. Introduction. Theory of Operation. Propagation Delay & Skew Tool
 For the SIA Applications of Propagation Delay & Skew tool Determine signal propagation delay time Detect skewing between channels on rising or falling edges Create histograms of different edge relationships
Word Tutorial 2: Editing and Formatting a Document
 Word Tutorial 2: Editing and Formatting a Document Microsoft Office 2010 Objectives Create bulleted and numbered lists Move text within a document Find and replace text Check spelling and grammar Format
#PS168 - Analysis of Intraventricular Pressure Wave Data (LVP Analysis)
") BIOPAC Systems, Inc. 42 Aero Camino Goleta, Ca 93117 Ph (805)685-0066 Fax (805)685-0067 www.biopac.com info@biopac.com #PS168 - Analysis of Intraventricular Pressure Wave Data (LVP Analysis) The Biopac
BIOPAC Systems, Inc. 42 Aero Camino Goleta, Ca 93117 Ph (805)685-0066 Fax (805)685-0067 www.biopac.com info@biopac.com #PS168 - Analysis of Intraventricular Pressure Wave Data (LVP Analysis) The Biopac
LedSet User s Manual V Official website: 1 /
 LedSet User s Manual V2.6.1 1 / 42 20171123 Contents 1. Interface... 3 1.1. Option Menu... 4 1.1.1. Screen Configuration... 4 1.1.1.1. Instruction to Sender/ Receiver/ Display Connection... 4 1.1.1.2.
LAB 1: Plotting a GM Plateau and Introduction to Statistical Distribution. A. Plotting a GM Plateau. This lab will have two sections, A and B.
 LAB 1: Plotting a GM Plateau and Introduction to Statistical Distribution This lab will have two sections, A and B. Students are supposed to write separate lab reports on section A and B, and submit the
ExtIO Plugin User Guide
 Overview The SDRplay Radio combines together the Mirics flexible tuner front-end and USB Bridge to produce a SDR platform capable of being used for a wide range of worldwide radio and TV standards. This
Cover Page for Lab Report Group Portion. Boundary Layer Measurements
 Cover Page for Lab Report Group Portion Boundary Layer Measurements Prepared by Professor J. M. Cimbala, Penn State University Latest revision: 23 February 2017 Name 1: Name 2: Name 3: [Name 4: ] Date:
SIDRA INTERSECTION 8.0 UPDATE HISTORY
 Akcelik & Associates Pty Ltd PO Box 1075G, Greythorn, Vic 3104 AUSTRALIA ABN 79 088 889 687 For all technical support, sales support and general enquiries: support.sidrasolutions.com SIDRA INTERSECTION
RedRat Control User Guide
 RedRat Control User Guide Chris Dodge RedRat Ltd April 2014 For RedRat Control V3.16 1 Contents 1. Introduction 3 2. Prerequisites and Installation 3 3. The First Step Capture of Remote Control Signals
Diogen 24/24 two-regime seismograph
 Diogen 24/24 two-regime seismograph Moscow 2011 Diogen Diogen 24/24 Two-regime seismograph "Diogen-24/24" delivers high-quality seismic data to accurately assess geological conditions within engineering
WindData Explorer User Manual
 WindData Explorer User Manual Revision History Revision Date Status 1 April 2014 First Edition Contents I Framework 4 1 Introduction 5 2 System Requirements 5 3 System Architecture 5 4 Graphical User Interface
Full deghosting of OBC data with over/under source acquisition Mark Egan*, Khadir George El-Kasseh and Nick Moldoveanu, Schlumberger WesternGeco
 with over/under source acquisition Mark Egan*, Khadir George El-Kasseh and Nick Moldoveanu, Schlumberger WesternGeco Summary The resolution of marine seismic data is affected by ghost and reverberations
Table of Contents. iii
 Rental Table of Contents Introduction... 1 Technical Support... 1 Overview... 2 Getting Started... 3 Inventory Folders for Rental Items... 3 Rental Service Folders... 3 Equipment Inventory Folders...
Printed Documentation
 Printed Documentation Table of Contents INTRODUCTION... 1 Technical Support... 1 Overview... 2 GETTING STARTED... 3 Inventory Folders for Rental Items... 3 Rental Service Folders... 4 Equipment Inventory
Analyze Frequency Response (Bode Plots) with R&S Oscilloscopes Application Note
 with R&S Oscilloscopes Application Note") Analyze Frequency Response (Bode Plots) with R&S Oscilloscopes Application Note Products: R&S RTO2002 R&S RTO2004 R&S RTO2012 R&S RTO2014 R&S RTO2022 R&S RTO2024 R&S RTO2044 R&S RTO2064 This application
Analyze Frequency Response (Bode Plots) with R&S Oscilloscopes Application Note Products: R&S RTO2002 R&S RTO2004 R&S RTO2012 R&S RTO2014 R&S RTO2022 R&S RTO2024 R&S RTO2044 R&S RTO2064 This application
Application Note 11 - Totalization
 Application Note 11 - Totalization Using the TrendView Recorders for Totalization The totalization function is normally associated with flow monitoring applications, where the input to the recorder would
OPERATIVE GUIDE P.I.T. PILE INTEGRITY TEST
 OPERATIVE GUIDE P.I.T. PILE INTEGRITY TEST 1 Echotest procedure / PIT Pile Integrity test with MAE ETBT instrument Generals Theory notes Pile Integrity Test (PIT) is a simple non destructive test which
Eagle Business Software
 Rental Table of Contents Introduction... 1 Technical Support... 1 Overview... 2 Getting Started... 5 Inventory Folders for Rental Items... 5 Rental Service Folders... 5 Equipment Inventory Folders...
Software Quick Manual
 XX112-17-01 Kollector Hybrid Network Digital Video Recorder Quick Manual Vicon Industries Inc. does not warrant that the functions contained in this equipment will meet your requirements or that the operation
dbtechnologies QUICK REFERENCE
 dbtechnologies QUICK REFERENCE 1 DVA Composer Ver3.1 dbtechnologies What s new in version 3.1 COMPOSER WINDOW - DVA T8 line array module now available in the System Models window. - Adding modules in the
NanoTrack Cell and Particle Tracking Primer
 NanoTrack Cell and Particle Tracking Primer The NanoTrack Pnode allows the user to track single cells and particles with nanometer precision at very fast tracking speeds. The speed of the tracking is dependent
Universal Mode. Survey Settings. The Universal Toolbar. First Run - Initial Configuration via the Setup Button
 Universal Mode The Universal Toolbar The Universal Toolbar is the unified (and preferred) method of operating Revolution. From within the Universal Toobar, all functionality of the other 3 modes of Revolution
Boonton 4540 Remote Operation Modes
 Application Note Boonton 4540 Remote Operation Modes Mazumder Alam Product Marketing Manager, Boonton Electronics Abstract Boonton 4540 series power meters are among the leading edge instruments for most
SQTR-2M ADS-B Squitter Generator
 SQTR-2M ADS-B Squitter Generator Operators Manual REVISION A B C D E F G H J K L M N P R S T U V W X Y Z December 2011 KLJ Instruments 15385 S. 169 Highway Olathe, KS 66062 www.kljinstruments.com NOTICE:
CARLO GAVAZZI Automation Components
 CARLO GAVAZZI Automation Components UDM 35/40 Digital Panel Meter Programming Guide Index Description 2 Programming Fundamentals 3 Access to Programming Mode/Password Protection 4 Programming 5-18 Inputs
BitWise (V2.1 and later) includes features for determining AP240 settings and measuring the Single Ion Area.
 includes features for determining AP240 settings and measuring the Single Ion Area.") BitWise. Instructions for New Features in ToF-AMS DAQ V2.1 Prepared by Joel Kimmel University of Colorado at Boulder & Aerodyne Research Inc. Last Revised 15-Jun-07 BitWise (V2.1 and later) includes features
BitWise. Instructions for New Features in ToF-AMS DAQ V2.1 Prepared by Joel Kimmel University of Colorado at Boulder & Aerodyne Research Inc. Last Revised 15-Jun-07 BitWise (V2.1 and later) includes features
Footnotes and Endnotes
 Footnotes and Endnotes Sometimes when writing a paper it is necessary to insert text at the bottom of a page in a document to reference something on that page. You do this by placing a footnote at the
All the functions you need in your hand
 All the functions you need in your hand Rely on H30FLEX for installation and troubleshooting. Robust, light-weight and extremely easy to use. Carry out installation, maintenance and troubleshooting tasks
CESR BPM System Calibration
 CESR BPM System Calibration Joseph Burrell Mechanical Engineering, WSU, Detroit, MI, 48202 (Dated: August 11, 2006) The Cornell Electron Storage Ring(CESR) uses beam position monitors (BPM) to determine
Mobile DTV Viewer. User Manual. Mobile DTV ATSC-M/H DVB-H 1Seg. Digital TV ATSC DVB-T, DVB-T2 ISDB-T V 4. decontis GmbH Sachsenstr.
 Mobile DTV ATSC-M/H DVB-H 1Seg Digital TV ATSC DVB-T, DVB-T2 ISDB-T V 4 decontis GmbH Sachsenstr. 8 02708 Löbau Germany +49 3585 862915 +49 3585 415629 www.com dvbsam@com 1 Introduction... 5 2 System Requirements...
QUICK START GUIDE. A4410 Virtual Unit. How to use it in Demo mode
 QUICK START GUIDE How to use it in Demo mode Version 2.57 March 28, 2017 Content:... 3 Installation...3 Update...3 Operation...3 Live vs. Record... 4 Live...4 Record...4 How to post process (analyze) the
HyperMedia User Manual
 HyperMedia User Manual Contents V3.5 Chapter 1 : HyperMedia Software Functions... 3 1.1 HyperMedia Introduction... 3 1.2 Main Panel... 3 1.2.2 Information Window... 4 1.2.3 Keypad... 4 1.2.4 Channel Index...
Linrad On-Screen Controls K1JT
 Linrad On-Screen Controls K1JT Main (Startup) Menu A = Weak signal CW B = Normal CW C = Meteor scatter CW D = SSB E = FM F = AM G = QRSS CW H = TX test I = Soundcard test mode J = Analog hardware tune
Defining and Labeling Circuits and Electrical Phasing in PLS-CADD
 610 N. Whitney Way, Suite 160 Madison, WI 53705 Phone: 608.238.2171 Fax: 608.238.9241 Email:info@powline.com URL: http://www.powline.com Defining and Labeling Circuits and Electrical Phasing in PLS-CADD
StepSequencer64 J74 Page 1. J74 StepSequencer64. A tool for creative sequence programming in Ableton Live. User Manual
 StepSequencer64 J74 Page 1 J74 StepSequencer64 A tool for creative sequence programming in Ableton Live User Manual StepSequencer64 J74 Page 2 How to Install the J74 StepSequencer64 devices J74 StepSequencer64
PulseCounter Neutron & Gamma Spectrometry Software Manual
 PulseCounter Neutron & Gamma Spectrometry Software Manual MAXIMUS ENERGY CORPORATION Written by Dr. Max I. Fomitchev-Zamilov Web: maximus.energy TABLE OF CONTENTS 0. GENERAL INFORMATION 1. DEFAULT SCREEN