Real-Time Spectrogramtm
|
|
|
- Jocelyn Clark
- 6 years ago
- Views:
Transcription
1 Real-Time Spectrogramtm User Guide Version 5 July, 2014 Engineering Design
2 This document is provided for the sole purpose of operating the SIGNAL system. No part of this document may be reproduced, transmitted, or stored by any means, electronic or mechanical. It is prohibited to alter, modify, or adapt the software or documentation, including, but not limited to, translating, decompiling, disassembling, or creating derivative works. This document contains proprietary information which is protected by copyright. All rights are reserved. ENGINEERING DESIGN MAKES NO WARRANTY OF ANY KIND WITH REGARD TO THE MATERIAL CONTAINED HEREIN, INCLUDING, BUT NOT LIMITED TO, IMPLIED WARRANTIES OF MERCHANTABILITY AND FITNESS FOR A PARTICULAR PURPOSE. Engineering Design shall not under any conditions be liable for errors contained herein or for incidental or consequential damages arising from the furnishing, performance, or use of this material. The information in this document is subject to change without notice Engineering Design, Berkeley, CA. All rights reserved. Printed in the United States of America. SIGNAL, Real-Time Spectrogram, RTS, Event Detector, Event Analyzer, Experiment Maker, CBDisk, DartDisk, DTDisk, NIDisk, WaveDisk are trademarks of Engineering Design. The following are service marks, trademarks, and/or registered trademarks of the respective companies: Communication Automation: Dart Creative Technology: Audigy, Extigy Data Translation: Open Layers Hewlett-Packard: HP, LaserJet, and DeskJet Measurement Computing Corp: Computer Boards Microsoft: Windows, Windows 95, Windows 98, Windows 2000, Windows XP National Instruments: NI-DAQ Engineering Design 262 Grizzly Peak Blvd Berkeley, CA USA Tel/fax info@engdes.com
3 LICENSE AGREEMENT THIS IS A LEGAL AGREEMENT BETWEEN ENGINEERING DESIGN AND THE BUYER. BY OPERATING THIS SOFTWARE, THE BUYER ACCEPTS THE TERMS OF THIS AGREEMENT. 1. Engineering Design (the "Vendor") grants to the Buyer a non-exclusive license to operate the provided software (the "Software") on ONE computer system at a time. The Software may NOT reside simultaneously on more than one computing machine. 2. The Software is the exclusive property of the Vendor. The Software and all documentation are copyright Engineering Design, all rights reserved. The Software may be duplicated ONLY for archival back-up. 3. The Software is warranted to perform substantially in accordance with the operating literature for a period of 30 days from the date of shipment. 4. EXCEPT AS SET FORTH IN THE EXPRESS WARRANTY ABOVE, THE SOFTWARE IS PROVIDED WITH NO OTHER WARRANTIES, EXPRESS OR IMPLIED. THE VENDOR EXCLUDES ALL IMPLIED WARRANTIES, INCLUDING, BUT NOT LIMITED TO, IMPLIED WARRANTIES OF MERCHANTIBILITY AND FITNESS FOR A PARTICULAR PURPOSE. 5. The Vendor's entire liability and the Buyer's exclusive remedy shall be, at the Vendor's SOLE DISCRETION, either (1) return of the Software and refund of purchase price or (2) repair or replacement of the Software. 6. THE VENDOR WILL NOT BE LIABLE FOR ANY SPECIAL, INDIRECT, OR CONSEQUENTIAL DAMAGES HEREUNDER, INCLUDING, BUT NOT LIMITED TO, LOSS OF PROFITS, LOSS OF USE, OR LOSS OF DATA OR INFORMATION OF ANY KIND, ARISING OUT OF THE USE OF OR INABILITY TO USE THE SOFTWARE. IN NO EVENT SHALL THE VENDOR BE LIABLE FOR ANY AMOUNT IN EXCESS OF THE PURCHASE PRICE. 7. This agreement is the complete and exclusive agreement between the Vendor and the Buyer concerning the Software.
4
5 Table of Contents 1. Introduction Installing the RTS Launching the RTS RTS Commands Data Input RTS Display Navigating the Screen Forward and Backward Scroll Crosshair Cursor Drag-Selecting a Signal Segment Bookmarks Selecting a Signal Segment Zooming the Screen Playing a Signal Segment Storing Sound Files and Sound Parameters Settings Using the RTS with SIGNAL Operating Hints... 36
6
7 1. Introduction The Real-Time Spectrogram tm (RTS tm ) displays the time-aligned spectrogram and waveform of a continuous sound file. The RTS can efficiently review large amounts of acoustic data, while measuring, extracting, and storing sound parameters and signal segments directly from the screen. RTS is designed to view, measure, and edit digital sound files. While the earlier RTS for DOS required continuous access to the source tape and repeated playing and pausing, RTS for Windows can digitize an entire data tape unattended (see "Data Input"), then scroll rapidly through the sound file at between 10 and 100 times real-time (depending on event density). A 45-minute sound tape can be reviewed in less than 5 minutes! RTS runs within SIGNAL tm, so signal segments can be transferred directly to SIGNAL buffers for immediate analysis, or saved to disk as SIGNAL, Wave or AIFF format sound files. Measured sound parameters can be stored in the SIGNAL logfile. Note: RTS 4 does not have built-in analog I/O, unlike the earlier RTS for DOS. You cannot play a sound tape directly into RTS 4 and watch it scroll by. Instead, you digitize the tape, then scroll the digitized sound file. However, you can play sounds on the display (limited to audio frequencies) through the system card. Real-time scrolling acquisition and playback of "live" audio will be available in a future version of RTS. 2. Installing the RTS The RTS is part of SIGNAL and is automatically installed when you install SIGNAL. To confirm the installation, verify that the RTS menu item (I/O Real-Time Spectrogram on the
8 SIGNAL menu) and toolbar button ( button on the SIGNAL toolbar) are enabled. If these items are grayed out, select Tools License Info on the SIGNAL menu and confirm that RTS is listed under Licensed Modules. If not, contact Engineering Design to upgrade your license. 3. Launching the RTS To launch the RTS, start SIGNAL, then do any of the following: Select I/O Real-Time Spectrogram on the SIGNAL menu Click the button on the SIGNAL toolbar Enter the RTS command in the SIGNAL console window Select "Display in RTS window" in the SIGNAL graph dialog (Graphics Graph on the menu) The RTS opens in its own window on top of SIGNAL, which can be resized and dragged anywhere on the screen. RTS saves its window position between sessions and will automatically open to its previous position. 4. RTS Help The SIGNAL/RTS help system includes a chapter on the RTS. To open this, click the Help button on either the SIGNAL or RTS toolbar. Open the SIGNAL/RTS help system. 5. RTS Commands RTS commands are presented on the RTS toolbar and/or the RTS context menu. These are described here. RTS Toolbar The RTS toolbar presents a set of command buttons at the top of the RTS window. These are summarized here, and explained in detail in other sections of this guide. Some toolbar buttons (such as Zoom and Play) refer to the selected signal segment, while others (such as Open Sound File, Change Settings, or Scroll Forward) refer to the RTS program or screen. 2
9 Close sound file Open sound file Save current selection to a sound file Change RTS program settings Start recording [Future] Stop recording [Future] Play current selection Stop playback Scroll screen backward in time Stop scrolling Scroll screen forward in time Activate crosshair cursor Activate drag highlight Zoom to the current selection Zoom current screen by 2X (magnify) Zoom current screen by 1/2X (un-magnify) Restore global screen width (from Settings) Display entire source signal Display previous screen 3
10 Display next screen Display specified time range in source file Refresh display Open Help system RTS Context Menus RTS commands are also presented in context menus, which are displayed by R-clicking when the crosshair cursor or drag highlight is active. There is some overlap between toolbar and menu commands. Menu commands are summarized here, and explained in detail in other sections of this guide. Most menu commands (such as Zoom, Play, or Save to Sound File) refer to the currently selected signal segment, or the entire screen if no segment is selected. "Selecting a Signal Segment" summarizes the techniques and rules for selecting signals. Crosshair cursor menu Set FROM time limit Set TO time limit Reset FROM/TO time limits Open Bookmark menu Display (zoom) signal within current FROM/TO limits Redraw previous zoom display Redraw next zoom display Play selected segment Save selected segment to buffer Save selected segment to sound file Save current x,y value to log file Save current x,y value to UVARs 4

11 Drag highlight menu Display (zoom) highlighted signal segment Redraw previous zoom display Redraw next zoom display Remove signal highlight Play selected segment Save selected segment to buffer Save selected segment to sound file Save current x,y value to log file 6. Data Input Viewing Sound Data in the RTS RTS 4 is designed for viewing digital sound files. It does not have built-in analog I/O, unlike earlier RTS versions. You cannot play a sound tape directly into RTS 4 and watch it scroll by. Instead, you digitize the entire tape unattended, then scroll through the digitized sound file much faster than real time, which is much more efficient. Mechanical tape playing and pausing is replaced by navigating on-screen through the sound file. Real-time scrolling acquisition and playback of "live" audio will be available in a future version of RTS. To review a sound data tape in the RTS, follow these steps: 1. Digitize the entire tape unattended into a sound file using one of the Engineering Design direct-to-disk analog I/O programs. These programs support all the major analog I/O hardware manufacturers, and are called CBDisk tm, DartDisk tm, DTDisk tm, NIDisk tm, and WaveDisk tm, after their respective manufacturers. 2. Open the sound file in the RTS for review, measurement, and editing. Note that a simpler approach, particularly in lab environments, is to bypass the tape recorder entirely and record the original data directly to a sound file using one of the above programs, i.e., use the computer as a digital tape recorder. Then the sound file is immediately ready for review and analysis in the RTS. 5
12 Opening a Sound File To open a sound file, click the Open File button on the RTS toolbar. If no path is specified, Open File will search the DATAIN path in SIGNAL. The filename is displayed in the title bar of the RTS window. Closing a Sound File To close a sound file, click the Close File button on the RTS toolbar. Sound File Display Conventions The RTS will accept files in the SIGNAL, Wave, AIFF, and BLB sound file formats. SIGNAL sound files may be floating point or integer, and may have a non-0 time origin. The displayed voltage amplitude of SIGNAL integer time files is determined by their stored conversion factor, which by default is bits / 10 Volts. This matches the default A/D converter range ( , ) Volts to the 16-bit integer range (-32768, ). For example, a data value of 3277 will be displayed as 1.0 Volts. Floating point SIGNAL files are stored as voltages, so no conversion is necessary. Wave and AIFF files contain no internal conversion factor, and are displayed with an assumed conversion factor of bits / 3 Volts. This matches the nominal range of the PC sound card (±3 Volts) to the 16-bit integer range. For example, a data value of will be displayed as 1.0 Volts. The displayed voltage amplitude of BLB files is determined by their stored conversion factor, which by default is bits / 10 Volts. 7. RTS Display The RTS display consists of a time-aligned waveform and spectrogram. RTS 4 supports one data channel. Display settings such as screen width, frequency range, dynamic range, and spectral resolution can all be varied see "Settings" below. 6
13 Screen Width Screen width can be set to between 2 and 3600 seconds (= 1 hour). Large screen widths are useful for efficiently viewing long sound files, particular those with sparse events. Maximum practical screen width is limited by the pixel width of the RTS window and the time duration of the events of interest. Pixel width can be increased by a wider RTS window and higher resolution screen. Max practical screen width occurs when the gap between successive FFT's exceeds the shortest events of interest, causing these events to "fall between the transforms" on the spectrogram display. See "Spectrogram properties" for detailed discussion. The waveform display is not subject to this limitation because it represents the value of every data point within the screen range, i.e., it has no mathematical gaps at any screen width. When the sound file is shorter than the screen width setting, the RTS draws the signal to the scale of the requested screen width, then blacks out the remainder. For example, in the following figure, signal duration is 2.5 secs and screen width is 3.0 secs. Note that in this case, a signal segment can be selected using the highlight tool (see "Drag-Selecting a Signal Segment") but not with the crosshair cursor ( see "Crosshair Cursor"). 7
 or calculated from the bit-width of the sample values (e.g., 16 bits) and an assumed converter range of 10 Volts.")
14 Waveform Properties The waveform display is calibrated in Volts, based on the known or assumed voltage conversion ratio (bits/volt) of the digitizer. This ratio is either read from the file header (SIGNAL and BLB files) or calculated from the bit-width of the sample values (e.g., 16 bits) and an assumed converter range of 10 Volts. The user can adjust the voltage range of the display to accommodate different signal levels. At very high time zoom (the figure shows a 1-msec time segment), the waveform display becomes blocky or "stair-step" in appearance. Each step represents one sample point in the input signal. This display differs from SIGNAL, which at high time zoom "connects the dots" by drawing straight lines between each sample point for a smoother display. The RTS can't look forward in time to do this, but both displays provide the same information. 8

15 Spectrogram Properties The RTS spectrogram display consists of successive Fourier transforms (FFT's), one FFT per pixel column. Thus if the RTS window is 1000 pixels wide, the spectrogram will contain 1000 FFT's. The spectrogram is recalculated every time the screen is redrawn, so FFT overlap (see below) is always maximal for the current screen width. The appearance of the spectrogram display is controlled by a number of mathematical relationships. These are described here. Frequency and time resolution The frequency resolution and time resolution of a spectrogram characterize its degree of spectral and temporal definition. Digital spectrogram resolution is determined by the time duration of the sliding Fourier transform window. If T is the duration of this window in seconds, then and Time resolution = T [ sec ] Frequency resolution = 1 / T [ Hz ] Tres = FFT-length / (sample rate) [ sec ] Fres = (sample rate) / FFT-length [ Hz ] Fine frequency resolution (small Fres) reveals spectral detail while blurring the exact location of these features in time. Conversely, fine time resolution (small Tres) reveals temporal detail while blurring spectral features. The figure shows two spectrograms of a human speech signal at narrowband (24 Hz) and wideband (195 Hz) resolutions. Optimal resolution depends on the temporal-spectral character of the signal and the relative importance of temporal and spectral features in the analysis. F-res = 24 Hz, T-res = 41.0 msec F-res = 195 Hz, T-res = 5.1 msec The Display settings page provides three controls for resolution. When the user adjusts Transform length, the RTS automatically calculates and displays the new frequency and time resolution. 9
16 Transform length is the FFT length in points. Together with the signal's sample rate, it determines the frequency and time resolution. It is restricted to powers of 2. Frequency resolution in Hz = (sample rate) / (transform length). Smaller values reveal finer frequency detail and coarser time features. Time resolution in seconds = (transform length) / (sample rate) = 1 / (frequency resolution). Smaller values reveal finer time detail and coarser frequency features. Update from file header: The frequency and time resolution calculation is based on the current sound file's sample rate. To use some other rate in the calculation, click the "Update from file header" button to read the sample rate from another sound file. Time Granularity and Transform Overlap In a digital spectrogram, the finite number of time steps (FFT's) can produce a time granularity in the computed spectrogram. This granularity can be characterized either by the interval between the start of successive transforms or by the percentage overlap of successive transforms. When screen width is small, successive FFT's may overlap significantly, but when screen width is large, there may be significant gaps between successive FFT's (negative overlap). When these gaps exceed the duration of events of interest, events can fall between FFT's and be omitted from the display entirely. The user cannot directly adjust the number of transforms. That is determined by the pixel width of the RTS window, since the RTS always computes one FFT per pixel column. Widening the RTS window increases the number of FFT's, which increases transform overlap and produces a more time-detailed spectrogram. The Display settings page reports Transform overlap, which is the percentage overlap between succesive FFT s. Overlap = 100 * [1 (transform interval) / (transform duration)], where transform duration in seconds = (sample rate in Hz) / (transform length in points). Negative overlap indicates that successive FFT's are non-time-contiguous, which is common with large screen-widths. For example, an overlap of 50% indicates that each FFT begins one half FFT length after its predecessor, while an overlap of -100% means there is a gap of one FFT length between successive FFT windows. Greater overlap produces a more timedetailed spectrogram, although overlap > 50% provides little improvement. The tolerable amount of negative overlap depends on the level of time detail in the signal, and the amount of detail required in the spectrogram. Spectrogram Gain and Range Spectrogram gain and range are adjusted in the Display settings page. These two parameters should be adjusted jointly to display the desired signal features. Following are guidelines and examples. Spectrogram range is the intensity range (in db) represented between the lightest and darkest grey levels. The calculated spectrogram is mapped to this range such that for a greylevel display, all levels above this range are drawn black (saturated) and levels below this range are drawn white (omitted). Increasing spectrogram range displays low-level and high-level detail simultaneously, but may also display low-level noise, obscuring the spectrogram. A small range produces clean 10

17 spectrograms, but can saturate high-level sound features (drive them to black) and omit lowlevel ones. In the following example, the first figure was drawn with a low Range value and produces a "silhouette" spectrogram with few amplitude features, while the second was drawn with a high Range value and reveals a wide range of amplitude detail, but also more noise. Range = 10 db, Gain = 0 db Range = 50 db, Gain = -20 db Spectrogram gain is the gain applied to the calculated spectrogram before mapping it to the requested range. Increasing gain increases the darkness of the display. This reveals lowlevel sound features, but can also display low-level noise, obscuring the spectrogram, and can saturate high-level features. Reducing gain eliminates low-level noise but may also omit low-level sound features. By RTS convention, increasing the Range parameter lowers the lower cutoff of the displayed intensity range, i.e., reveals more low-level detail without changing the upper cutoff. This ensures that changing Range will not saturate the display, because the upper cutoff is not changed. To maintain the same lower cutoff (amount of low-level detail), reduce gain by the amount of the range increase. See the following example. Conversely, after decreasing Range (which raises the range cutoff), increase gain by the same amount to maintain a constant level of low-level detail. In the following example, the first figure is the reference. In the second, range is increased, revealing more detail but increasing background noise. In the third, gain is reduced by the amount that range was increased, returning background noise to its original level. The third spectrogram is not as dark overall because its energy is spread over a wider range of greys. 11
 / 2.")
18 Range = 25 db, Gain = -10 db Range = 35 db, Gain = -10 db Range = 35 db, Gain = -20 db Frequency Range The lower and upper frequency limits of the spectrogram display can be adjusted on the Display settings page. Min frequency sets the lower frequency limit of the spectrogram display. Max frequency sets the upper frequency limit of the spectrogram display. It is limited to (sample rate) / 2. Spectrogram Palette Spectrograms can be displayed in grey-scale or color. Note that intensity is mapped logarithmically to grey or color shades. I.e., the intensity range in db is divided equally among the number of shades, so that each grey or color represents an intensity band of Range / (no. shades) [db] Grey-scale draws the spectrogram in 256 shades of grey, ranging from white (lowest intensity) to black (highest intensity). 12

19 Rainbow draws the spectrogram in 256 colors, ranging from black (lowest intensity) through blue, green, yellow, to red (highest intensity). The figure shows a human speech sound in grey-scale and rainbow displays. Refreshing the Display The Refresh Screen button recalculates and redraws the RTS display, in case the the display is unexpectedly corrupted. 8. Navigating the Screen The RTS uses a viewer model similar to word processors: the screen is a viewport on a larger document, which is navigated in a variety of ways: paging through successive pages, scrolling by single columns, dragging the scrollbar thumb button, jumping to the beginning or end of document, or going to a numerically specified location. The RTS screen can also be scrolled continuously forward and backward. As with word processors, many of these actions are provided through both a scrollbar and keyboard shortcuts. 13

20 Scrollbar The RTS scrollbar contains a thumb button, left and right column scroll buttons, and buttons to jump to the beginning and end of the source file: The scrollbar supports these actions: Left scroll and right scroll buttons scroll the screen one column either direction. Clicking in the page left or page right areas between scroll button and thumb button jumps the screen backward (earlier in time) or forward, respectively, by the current screen width. Dragging the thumb button jumps to any location within the file. The numerical location of the thumb is continuously updated during the drag, but the screen display is not redrawn (because the spectrogram can't be redrawn that fast). Goto begin and goto end buttons jump to the beginning and end of the source file, respectively. Keyboard shortcuts The following keystrokes provide shortcuts for the specified scrollbar buttons: Ctrl+Home and Ctrl+End mirror the goto begin and goto end buttons. PageUp and PageDown mirror the page left and page right buttons, moving the screen backward (earlier in time) or forward by the current screen width. Left arrow and right arrow mirror the left scroll and right scroll buttons, moving the screen one column earlier or later. Note that page-wise operations (page-up and page-down) move the screen by the current screen width. This allows the user to browse the source file at the current magnification. Goto The Goto button displays a numerically specified time range in the source file: 14

21 This range can be specified in one of two ways: 1. If both start and end are specified, the RTS will display that range. 2. If only start is specified, the display segment will begin at the start value and extend for the global screen width setting. The target signal range is added to the zoom stack (see "Zooming the Screen"), so the user can return to it, like a zoomed segment. 9. Forward and Backward Scroll The RTS screen can be scrolled rapidly forward and backward. The model is a tape player transport. The RTS provides Scroll Forward, Scroll Backward, and Stop Scroll buttons, and the user can click between them to jockey the screen. Scrolling provides an efficient way to review long and/or sparse source files. If screen width is the duration of data displayed on the screen and scroll time is the physical time required to scroll one screen width, then the ratio of these two (screen width / scroll time) represents the review rate relative to real-time. For example, on one sparse data set, a screen width of 300 seconds was scrolled in 3 seconds, for a review rate of 100 times real-time! Scroll time is adjusted in the I/O settings page. For a given processor and video speed, and selected FFT length, screen width, and screen size, there is a minimum scroll time, beyond which the RTS cannot scroll any faster. If you request a scroll time shorter than this, the RTS will scroll at its maximum speed. No warning is issued. To always scroll as quickly as possible, set Scroll time to 0. 15
22 10. Crosshair Cursor The RTS provides a full screen cross-hair cursor spanning the spectrogram and waveform display. To display the cursor, click the Cursor button on the toolbar. The cursor is used to 1) obtain on-screen x,y measurements of sound features and 2) delimit signal segments for magnification, playback, and editing via commands on the cursor menu. Cursor movement The cursor can be moved via the mouse or keyboard. Keyboard shortcuts are: Left arrow and right arrow provide fine movement. Shift+left arrow and shift+right arrow provide accelerated movement. Home and End jump to the screen left and right, respectively. Cursor x,y readout The RTS reports the current x,y cursor location in either the spectrogram or waveform via two boxes labeled "X" and "Y" next to the scrollbar. Readout units for the X coordinate are in seconds, and units for the Y coordinate are in Volts (waveform display) or Hz (spectrogram display). The readout is updated continuously as the cursor moves. Readout numerical resolution scales automatically with graph range, becoming finer as that range decreases and coarser as it increases. Technically, a 1-pixel cursor movement will always register in the least significant decimal place. This ensures that the readout will not be cluttered with excess decimal places, nor will it fail to respond to cursor movement, no matter how great or small the zoom. Selecting a signal segment using From X and To X The cursor is used to delimit signal segments for magnification, playback, and editing, via commands on the cursor menu. To delimit a segment: 1. Move the cursor to the beginning of the desired segment, R-click for the cursor menu, and select From X. Or just position the cursor and hit F. 2. Move the cursor to the end beginning of the desired segment, R-click for the cursor menu, and select To X. Or just position the cursor and hit T. 3. To clear From and To markers, select Clear From/To from the cursor menu or just hit C. Note: RTS sometimes fails to recognize keyboard shortcuts. The cause has not been determined. 16
23 From and To locations are indicated by dashed vertical red lines with inward pointing arrowheads to distinguish From and To. The figure shows From and To markers at and seconds, respectively. From/To limits can be retained depending on user preference. See "Selecting a Signal Segment" for details. From-X / To-X readout The RTS reports the current From-X and To-X values in two boxes labeled "F" and "T" next to the scrollbar. Readout is in seconds. As with the cursor X,Y readout, resolution scales automatically with graph range, becoming finer as that range decreases and coarser as it increases. Cursor context menu When the cursor is active, you can R-click for a menu of commands, many of which refer to the current From-X / To-X interval. These commands are discussed in detail elsewhere in this guide. 17
24 Set FROM time limit Set TO time limit Reset FROM/TO time limits Open Bookmark menu Display (zoom) signal within current FROM/TO limits Redraw previous zoom display Redraw next zoom display Play selected segment Stop playback Save selected segment to buffer Save selected segment to sound file Save current x,y value to log file Save current x,y value to UVARs 11. Drag-Selecting a Signal Segment Many RTS operations such as Zoom, Play, and Save to Sound File are performed on a selected signal segment. A segment can be selected in several ways (see "Selecting a Signal Segment"). RTS allows you to drag-select a signal. To do this, click the draghighlight button, then L-click and drag in either direction across the segment of interest. The RTS will highlight the selected segment in light blue while you are dragging. The selection can then be used in commands such as Zoom, Play, and Save. The figure shows a signal selection between and seconds, as indicated in the F/T readout (see "Drag selection readout" below). 18
25 The signal selection is retained, whether or not the highlight is visible, until explicitly cleared by the user (via the drag highlight context menu) or until a new sound file is opened. The drag highlight tool may be activated and removed without altering the selection. Signal selection bounds are saved and restored with each screen on the zoom stack. See the example in "Zooming the Screen". Mouse location readout While drag-selecting, the RTS reports the current x location of the mouse in the box labeled "X" next to the scrollbar. After drag-selecting (see the above figure), the RTS reports the current x,y location of the mouse in the boxes labeled "X" and "Y" next to the scrollbar. Readout units for the X coordinate are in seconds, and units for the Y coordinate are in Volts (waveform display) or Hz (spectrogram display). The readout is updated continuously as the mouse moves. Readout numerical resolution scales automatically with graph range, becoming finer as that range decreases and coarser as it increases. Technically, a 1-pixel mouse movement will always register in the least significant decimal place. This ensures that the readout will not be cluttered with excess decimal places, nor will it fail to respond to cursor movement, no matter how great or small the zoom. Drag selection readout After drag-selecting a signal segment, the RTS reports the segment's begin and end times in the boxes labeled "F" and "T" (From and To) next to the scrollbar. Readout is in seconds. As with the X,Y readout, resolution scales automatically with graph range, becoming finer as that range decreases and coarser as it increases. Drag highlight context menu When the drag highlight is active, you can R-click for a menu of commands, many of which refer to the currently highlighted signal segment. These commands are discussed in detail elsewhere in this guide. 19


26 Display (zoom) highlighted signal segment Redraw previous zoom display Redraw next zoom display Remove signal highlight Play selected segment Stop playback Save selected segment to buffer Save selected segment to sound file Save current x,y value to log file 12. Bookmarks Bookmarks allow the user to delimit a segment of any length for display and later file storage. They are used to locate widely spaced start and end points with maximum accuracy. The current RTS supports one set of bookmark start/end limits, but a future RTS may support an unlimited number of bookmarks, to allow the user to index the events in an entire sound file see below. Bookmark operations are available from the Bookmark menu, which is accessed from the Cursor menu. Keyboard shortcuts are as shown in the menu. Set bookmark start time Set bookmark end time Clear bookmark time limits Display bookmarked signal Setting a bookmark The cursor is used to delimit signal segments for magnification, playback, and editing, via commands on the cursor menu. To delimit a segment: 1. Move the cursor to the start point of the desired segment, R-click for the cursor menu, select Bookmark to open the Bookmark menu, then select Start. Or just position the cursor and hit ctrl+f. 2. Move the cursor to the desired end point of the desired segment and select End from the Bookmark menu. Or just position the cursor and hit ctrl+t. 3. To clear both bookmarks, select Clear from the bookmark menu, or just hit ctrl+c. Note: RTS sometimes fails to recognize keyboard shortcuts. The cause has not been determined. Bookmark locations are indicated by dashed vertical blue lines with inward pointing arrowheads to distinguish Start and End. Bookmark values are retained until altered or 20
27 cleared by the user or until a new sound file is opened. The cursor may be activated and removed without altering bookmarks. Using bookmarks Bookmarks are similar to From/To limits, but they are independent of them. Thus From/To can be used to zoom to the desired start and end points with great accuracy and set those locations as a bookmark. This cannot be done with From/To alone. Following are typical steps in bookmarking a signal: 1. Use From/To to zoom around the desired start point. Locate the cursor at the desired start point and set a Start bookmark (top). 2. Similarly, use From/To to zoom around the desired end point and set an End bookmark (upper middle). 3. If desired, click the Unzoom button to view the previous screen (lower middle). 4. Select Display from the Bookmark menu to view the bookmarked segment (bottom). 21
28 After the boookmarked signal is displayed, it can be played, saved to a buffer or sound file, etc., using the commands in the cursor menu. Bookmarks in the Future A future RTS may support an unlimited number of bookmarks, allowing the user to catalog and index an entire sound file. Individual bookmsarks can be annotated with ID or demographic info, and the bookmark ensemble can be collected in a bookmark file. This file can be exported to a spreadsheet or statistical program for statistical analysis. Or it can be imported into SIGNAL to perform automated data analysis on the entire sound file simply by stepping through the bookmarks. 22
29 13. Selecting a Signal Segment Many RTS operations including Zoom, Play, and Save to Sound File are performed on the currently selected signal segment. This segment can be specified in two ways: Activate the crosshair cursor, then delimit the desired segment with From and/or To markers, as described in "Crosshair Cursor". Activate the drag highlight, then drag the mouse across the desired segment to select it, as described in "Drag-Selecting a Signal Segment". With the crosshair cursor, if either From or To is not set, that limit defaults to the corresponding edge of the visible screen. If neither limit is set (cursor or drag highlight), the selection defaults to the visible screen. In the following figure, no From limit it set, so the selection extends from the left screen edge (t = secs) to the To marker at t = secs. Retaining From/To Limits From/To limits can be retained depending on user preference. If Retain From/To on the General-I/O settings page is selected, From/To limits are retained until altered or cleared by the user, even when scrolled or paged offscreen or when the cursor or highlight is deactivated. If Retain From/To is not selected, From/To limits are cleared when From/To limits are scrolled or paged offscreen and when the cursor or highlight is deactivated. From/To limits are always cleared when a new sound file is opened. From/To limits are always saved and restored with each screen on the zoom stack. See the example in "Zooming the Screen". 23
30 14. Zooming the Screen Any segment on the RTS screen can be magnified or "zoomed" in the horizontal direction for closer examination. Delimit the desired time segment as described in "Selecting a Signal Segment". Then click the Zoom button, or select Zoom on the cursor menu, or hit the Enter key. Note: the current RTS has no cursor-based vertical zoom. To zoom the vertical axis, adjust the frequency range from the Settings screen. Alternately, you can zoom the RTS screen by 2 times (2X) about its horizontal midpoint by clicking the "magnifier +" button. To unzoom by 2 times (1/2X), click the "magnifier " button. The Restore Screen Width button clears the zoom stack and restores the global screen width (from the Settings screen). This command also appears on the cursor menu and has keyboard shortcut Ctrl+Enter. The Full Signal button clears the zoom stack and displays the entire source signal. Long sound files (30 minutes or more) may take some time before drawing starts. The RTS remembers successive screens as you zoom into a signal segment. You can navigate up and down this "zoom stack" using the Previous and Next buttons, like a browser. This allows the user, for example, to zoom to a feature of interest, then return to the original screen display. Previous and Next also appear on the cursor menu and have keyboard shortcuts Bksp and Ctrl+Bksp, respectively. Using the Zoom Stack In the following example, the user delimits the event between 3.24 and 6.47 (top) and clicks to display that interval (middle). He then delimits the subsegment between and and clicks to zoom again (bottom). There are now three displays on the zoom stack, and can be used to navigate up and down the stack. From/To limits are saved with each screen on the stack and restored when that screen is displayed, so the user can navigate back and forth between an event and subsegments without re-entering From/To limits, as shown in the figures below. 24
31 25

 parameter to WIN (Windows sound chip) or SIGIO, respectively.")
32 15. Playing a Signal Segment Play The RTS can play a screen selection of any length. To perform a playback, delimit the desired segment as described in "Selecting a Signal Segment", then click the Play button on the toolbar, or R-click and select Play from the cursor menu, or hit the P key. The RTS can play the selection through either the system sound chip (the default) or an installed SIGNAL I/O device. This is determined by setting the SIGNAL PLAYDEV (Playback Device) parameter to WIN (Windows sound chip) or SIGIO, respectively. When playing through the system sound chip, RTS resamples the signal to 44.1 khz before playback. This places some limits on playback. Signals are limited to approximately 20 khz bandwidth and due to resampling space constraints, playback length is limited to a few million sample points. When playing through an installed SIGNAL I/O device, you can select the device via I/O Configure Output on the SIGNAL menu. Select the desired device, then click Set As Default. In this case, the signal will not be resampled; the RTS will select the device's closest available sample rate. Since long signals can take some time to prepare for playback, the RTS may display the following screen before playback: 26
33 Stop Play To stop playback, click the Stop Play button. Playback Wiper Playback is accompanied by a playback wiper (blue vertical line) that moves continuously across the screen in synchronization with the sound, to help relate the displayed waveform or spectrogram to the auditory signal. 16. Storing Sound Files and Sound Parameters The RTS can store data in several forms: Signal segments can be transferred to SIGNAL buffers for detailed analysis. Signal segments can be stored as sound files in SIGNAL, Wave or AIFF format. x,y screen measurements can be stored in the SIGNAL logfile. Transferring a Signal Segment to a SIGNAL Buffer To transfer a signal segment to a SIGNAL buffer, delimit the desired segment as described in "Selecting a Signal Segment", then R-click for the cursor menu and select Save to Buffer, or hit the B key. The RTS will request the destination buffer number, then transfer the buffer and display it in the SIGNAL graph window. 27


34 The user can switch freely between RTS and SIGNAL, selecting segments in the RTS, exporting them to SIGNAL buffers, and analyzing them in SIGNAL. See the screenshot in "RTS Screen" for an example. Saving a Screen Segment as a Sound File To save a segment as a sound file, delimit the desired segment as described in "Selecting a Signal Segment", then R-click for the cursor menu and select Save to Sound File, or hit the S key. Provide the filename, sound file format, and data format. Sound files can be saved in SIGNAL, Wave, or AIFF format. 28

35 Time origin When signal segments are exported from the RTS as SIGNAL buffers or SIGNAL-format sound files, the stored segment can optionally retain its time location in the original source file. Thus a segment located at seconds in the source file will be stored with a time origin of rather than 0. This facilitates analysis of inter-event intervals and other temporal sequence characteristics. Note: this option only exists with SIGNAL-format sound files because Wave and AIFF sound files do not store time origin. Time origin is set in the I/O settings page. The default sets the time origin of all exported segments to 0. Storing x,y Measurements in the SIGNAL Logfile The RTS cursor allows the user to make x,y measurements anywhere on the spectrogram or waveform. This can be used to measure minimum and maximum frequencies, start and end times, etc. RTS does not provide differential cursor measurements, but differential quantities such as frequency range or event duration or inter-event intervals can be derived by exporting x,y coordinates to a spreadsheet and performing spreadsheet calculations. x,y measurements can be stored in the SIGNAL logfile. To do this, position the cursor at the desired location, R-click for the cursor menu, and select Save x,y to Logfile. Or position the cursor and hit the L key. The logfile must be created and opened in SIGNAL before saving data from the RTS. The SIGNAL Reference Guide describes the setup, editing, and management of logfiles. For a demo, select Help Demos on the SIGNAL menu and run the two logfile demos. 29

36 17. Settings RTS settings are displayed and adjusted in two pages Display settings and General I/O settings. These are accessed via the Settings button on the RTS toolbar. RTS settings are saved between sessions in the Windows registry, as well as the screen position of the RTS window. These settings are defined and discussed throughout this guide. Display settings Display settings include screen width, waveform amplitude, spectrogram gain and intensity range, frequency range, color palette, and time and frequency resolution. These properties are discussed in the "RTS Display" chapter. The RTS screen is redrawn after clicking OK or Apply to reflect screen changes. For example, to observe the effect of different frequency resolutions, position the RTS window and settings page separately on the screen, then try different resolutions and click Apply to immediately see the effect. 30

37 General and I/O Settings General setings include miscellaneous program settings, such as retaining From/To limits. I/O settings control how sound data are entered into and saved by the RTS, and how that data is displayed dynamically by scrolling. Settings include data source, stored time origin, and scroll time (scroll rate). See "Storing Sound Files and Sound Parameters" for a discussion of time origin, and "Forward and Backward Scroll" for a discussion of scroll time. 18. Using the RTS with SIGNAL SIGNAL and the RTS can exchange signals and share screen windows in multiple ways. This section describes how the programs can exchange data and how they can be used together on the screen. Transferring Data from RTS to SIGNAL Data can be transferred from RTS to SIGNAL in several ways. Signal segments can be transferred in order to perform detailed and even automated sound analyis in SIGNAL. This is done by saving them to SIGNAL buffers. Select the segment of 31
38 interest in the RTS (see "Selecting a Signal Segment"), then select "Save to Buffer" from the context menu (see "Storing Sound Files and Sound Parameters"). The figures in "Coordinating SIGNAL and RTS Windows" below illustrate this process. x,y coordinates can be transferred, typically for use in SIGNAL programs. To do this, select "Save x,y to UVARs" from the RTS crosshair cursor context menu. Displaying SIGNAL Data in RTS Windows SIGNAL vs. RTS Signal Display The SIGNAL graph window is designed for detailed examination, measurement, and labeling, but not for viewing long signals, because 1) the entire signal must be read into a buffer in order to view it and 2) the window cannot be scrolled to conveniently view a short segment in detail. The RTS window fills this need by providing a scrolling view of signals of any length. RTS Command The RTS command in SIGNAL allows the user to display any number of SIGNAL buffers in RTS windows. Each buffer launches a new RTS window. For example, the user can display short signal segments in SIGNAL windows for detailed analysis and long signals (buffers or files) in an RTS window with scrolling. See the SIGNAL Reference Guide for details on the RTS command. RTS windows can be displayed as floating windows, anywhere on the screen, or in place of the SIGNAL graph window. RTS window location can be specified by RTS command flags, by the RTSLOC parameter or set in Tools Preferences. Again, see the SIGNAL Reference Guide for details. In the following, SIGNAL displays a 180-sec signal in the SIGNAL graph window. Because SIGNAL displays the entire buffer, time resolution is poor. 32


39 Here SIGNAL displays the same signal in a floating RTS window at the bottom. Time resolution is improved because the RTS displays the first 20 seconds with the rest available through scrolling. 33

40 Alternately, SIGNAL buffers can be displayed in an RTS window located in the SIGNAL graph window. This leaves the SIGNAL console window open for command entry. Coordinating RTS and SIGNAL Windows The RTS window can be located at various places on the screen relative to SIGNAL, to facilitate different tasks. For example, you can size the RTS window, SIGNAL graph window and SIGNAL logfile so that all three are visible at once, to simultaneously view the source file in the RTS, transfer edited signal segments from RTS to SIGNAL, and store measured parameters from RTS to the SIGNAL logfile. In the following figure, the signal segment between 1233 and 1238 seconds has been delimited and saved to SIGNAL buffer 2 (top red arrow) and on-screen frequency-time measurements (Start T, Start F, etc.) have been stored in a log file (bottom red arrow). 34

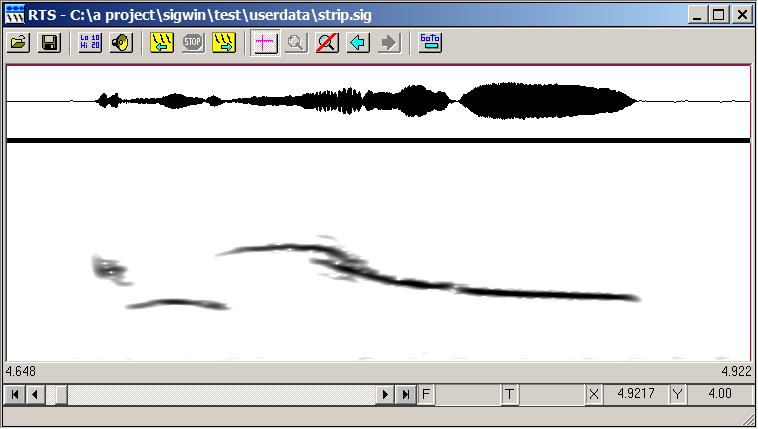
41 As another example, you can stretch the RTS window to moderate height and full screen width and locate it at the bottom of the screen, then use it as a "strip" file viewer to extract segments into SIGNAL for detailed measurement and analysis. In the following figure, the signal segment between 7.10 and seconds has been delimited and saved to SIGNAL buffer 1, then displayed as a spectrogram with zoom windows in order to make detailed power spectrum measurements. 35


42 19. Operating Hints Following are operating hints for the RTS. 1. To increase the scroll rate for the single-column left or right scroll buttons on the scrollbar (see "Navigating the Screen"), go to Control Panel Mouse Activities in Windows 95/98x or Control Panel Mouse Activities in Windows 2000/XP and set Double-Click Speed as high as possible. This sets the repetition rate when a mouse button is held down. 36
Real-Time Spectrogram (RTS tm )
") Real-Time Spectrogram (RTS tm ) View, edit and measure digital sound files The Real-Time Spectrogram (RTS tm ) displays the time-aligned spectrogram and waveform of a continuous sound file. The RTS can
Real-Time Spectrogram (RTS tm ) View, edit and measure digital sound files The Real-Time Spectrogram (RTS tm ) displays the time-aligned spectrogram and waveform of a continuous sound file. The RTS can
Please feel free to download the Demo application software from analogarts.com to help you follow this seminar.
 Hello, welcome to Analog Arts spectrum analyzer tutorial. Please feel free to download the Demo application software from analogarts.com to help you follow this seminar. For this presentation, we use a
MIE 402: WORKSHOP ON DATA ACQUISITION AND SIGNAL PROCESSING Spring 2003
 MIE 402: WORKSHOP ON DATA ACQUISITION AND SIGNAL PROCESSING Spring 2003 OBJECTIVE To become familiar with state-of-the-art digital data acquisition hardware and software. To explore common data acquisition
SEM- EDS Instruction Manual
 SEM- EDS Instruction Manual Double-click on the Spirit icon ( ) on the desktop to start the software program. I. X-ray Functions Access the basic X-ray acquisition, display and analysis functions through
SIGNALtm Timer System
 SIGNALtm Timer System User Guide Version 1.0 September, 2007 Revised March, 2016 Engineering Design This document is provided for the sole purpose of operating the SIGNAL Timer System. No part of this
imso-104 Manual Revised August 5, 2011
 imso-104 Manual Revised August 5, 2011 Section 1 Getting Started SAFETY 1.10 Quickstart Guide 1.20 SAFETY 1.30 Compatibility 1.31 Hardware 1.32 Software Section 2 How it works 2.10 Menus 2.20 Analog Channel
NanoGiant Oscilloscope/Function-Generator Program. Getting Started
 Getting Started Page 1 of 17 NanoGiant Oscilloscope/Function-Generator Program Getting Started This NanoGiant Oscilloscope program gives you a small impression of the capabilities of the NanoGiant multi-purpose
Getting Started with the LabVIEW Sound and Vibration Toolkit
 1 Getting Started with the LabVIEW Sound and Vibration Toolkit This tutorial is designed to introduce you to some of the sound and vibration analysis capabilities in the industry-leading software tool
BrainMaster tm System Type 2E Module & BMT Software for Windows tm. Display Screens for Master.exe
 BrainMaster tm System Type 2E Module & BMT Software for Windows tm Display Screens for Master.exe 1995-2004 BrainMaster Technologies, Inc., All Rights Reserved BrainMaster and From the Decade of the Brain
USB Mini Spectrum Analyzer User s Guide TSA5G35
 USB Mini Spectrum Analyzer User s Guide TSA5G35 Triarchy Technologies, Corp. Page 1 of 21 USB Mini Spectrum Analyzer User s Guide Copyright Notice Copyright 2011 Triarchy Technologies, Corp. All rights
Standard Operating Procedure of nanoir2-s
 Standard Operating Procedure of nanoir2-s The Anasys nanoir2 system is the AFM-based nanoscale infrared (IR) spectrometer, which has a patented technique based on photothermal induced resonance (PTIR),
MaxView Cinema Kit Quick Install Guide
 SYSTEM SETUP The MaxView will work at any of the following display settings: INSTALLATION MaxView Cinema Kit Quick Install Guide Step 1 - Turn off your computer. Disconnect your monitor s VGA cable from
imso-104 Manual Revised July 19, 2012
 imso-104 Manual Section 1 Getting Started SAFETY 1.10 Quickstart Guide 1.20 SAFETY 1.30 Compatibility 1.31 Hardware 1.32 Software Section 2 How it works 2.10 Menus 2.20 Analog Channel 2.21 On / Off 2.22
E X P E R I M E N T 1
 E X P E R I M E N T 1 Getting to Know Data Studio Produced by the Physics Staff at Collin College Copyright Collin College Physics Department. All Rights Reserved. University Physics, Exp 1: Getting to
PulseCounter Neutron & Gamma Spectrometry Software Manual
 PulseCounter Neutron & Gamma Spectrometry Software Manual MAXIMUS ENERGY CORPORATION Written by Dr. Max I. Fomitchev-Zamilov Web: maximus.energy TABLE OF CONTENTS 0. GENERAL INFORMATION 1. DEFAULT SCREEN
System Requirements SA0314 Spectrum analyzer:
 System Requirements SA0314 Spectrum analyzer: System requirements Windows XP, 7, Vista or 8: 1 GHz or faster 32-bit or 64-bit processor 1 GB RAM 10 MB hard disk space \ 1. Getting Started Insert DVD into
Dave Jones Design Phone: (607) Lake St., Owego, NY USA
 Lake St., Owego, NY USA") Manual v1.00a June 1, 2016 for firmware vers. 2.00 Dave Jones Design Phone: (607) 687-5740 34 Lake St., Owego, NY 13827 USA www.jonesvideo.com O Tool Plus - User Manual Main mode NOTE: New modules are
Manual v1.00a June 1, 2016 for firmware vers. 2.00 Dave Jones Design Phone: (607) 687-5740 34 Lake St., Owego, NY 13827 USA www.jonesvideo.com O Tool Plus - User Manual Main mode NOTE: New modules are
The BAT WAVE ANALYZER project
 The BAT WAVE ANALYZER project Conditions of Use The Bat Wave Analyzer program is free for personal use and can be redistributed provided it is not changed in any way, and no fee is requested. The Bat Wave
Software Quick Manual
 XX177-24-00 Virtual Matrix Display Controller Quick Manual Vicon Industries Inc. does not warrant that the functions contained in this equipment will meet your requirements or that the operation will be
Warranty and Registration. Warranty: One Year. Registration: Please register your product at Port, or. or Windows.
 7 7 Port, or or Windows Port Warranty and Registration Warranty: One Year Registration: Please register your product at www.aitech.com 2007 AITech International. All rights reserved. WEB CABLE PLUS PC-TO-TV
Reference. TDS7000 Series Digital Phosphor Oscilloscopes
 Reference TDS7000 Series Digital Phosphor Oscilloscopes 07-070-00 0707000 To Use the Front Panel You can use the dedicated, front-panel knobs and buttons to do the most common operations. Turn INTENSITY
Field Test 2. Installation and operation manual OPDAQ Installation and operation manual
 Field Test 2 Installation and operation manual OPDAQ 17.08.25 Installation and operation manual January 2016 How to get copies of OpDAQ technical publications: 53, St-Germain Ouest Rimouski, Québec Canada
User s Manual. Log Scale (/LG) GX10/GX20/GP10/GP20/GM10 IM 04L51B01-06EN. 2nd Edition
 GX10/GX20/GP10/GP20/GM10 IM 04L51B01-06EN. 2nd Edition") User s Manual Model GX10/GX20/GP10/GP20/GM10 Log Scale (/LG) User s Manual 2nd Edition Introduction Notes Trademarks Thank you for purchasing the SMARTDAC+ Series GX10/GX20/GP10/GP20/GM10 (hereafter referred
User s Manual Model GX10/GX20/GP10/GP20/GM10 Log Scale (/LG) User s Manual 2nd Edition Introduction Notes Trademarks Thank you for purchasing the SMARTDAC+ Series GX10/GX20/GP10/GP20/GM10 (hereafter referred
HP Indigo Press at a Glance. User Guide
 HP Indigo Press at a Glance User Guide HP Indigo Press at a Glance User Guide Copyright information 2008 Copyright Hewlett-Packard Development Company, L.P. Reproduction, adaptation or translation without
SIGVIEW v2.6 User Manual
 SIGVIEW v2.6 User Manual Copyright 1998-2012 SignalLab SIGVIEW v2.6 User Manual 3 Table of Contents Part I Introduction... 6 1 General... 7 2 Basic... concepts 8 Part II Basic... signal operations 10 1
USB-TG124A Tracking Generator User Manual
 USB-TG124A Tracking Generator User Manual Signal Hound USB-TG124A User Manual 2017, Signal Hound, Inc. 35707 NE 86th Ave La Center, WA 98629 USA Phone 360.263.5006 Fax 360.263.5007 This information is
FOUR CHANNEL USB RECORDER PCRU01. User manual. Table of Contents
 FOUR CHANNEL USB RECORDER PCRU01 User manual Table of Contents Features 2 Specifications 2 hardware 2 software: 2 system requirements 2 Software installation 2 SAFETY and WARNINGS 3 Warranty 3 Connections
The Measurement Tools and What They Do
 2 The Measurement Tools The Measurement Tools and What They Do JITTERWIZARD The JitterWizard is a unique capability of the JitterPro package that performs the requisite scope setup chores while simplifying
Spectrum Analyser Basics
 Hands-On Learning Spectrum Analyser Basics Peter D. Hiscocks Syscomp Electronic Design Limited Email: phiscock@ee.ryerson.ca June 28, 2014 Introduction Figure 1: GUI Startup Screen In a previous exercise,
User s Manual. Log Scale (/LG) GX10/GX20/GP10/GP20/GM10 IM 04L51B01-06EN. 3rd Edition
 GX10/GX20/GP10/GP20/GM10 IM 04L51B01-06EN. 3rd Edition") User s Manual Model GX10/GX20/GP10/GP20/GM10 Log Scale (/LG) 3rd Edition Introduction Thank you for purchasing the SMARTDAC+ Series GX10/GX20/GP10/GP20/GM10 (hereafter referred to as the recorder, GX,
User s Manual Model GX10/GX20/GP10/GP20/GM10 Log Scale (/LG) 3rd Edition Introduction Thank you for purchasing the SMARTDAC+ Series GX10/GX20/GP10/GP20/GM10 (hereafter referred to as the recorder, GX,
PS User Guide Series Seismic-Data Display
 PS User Guide Series 2015 Seismic-Data Display Prepared By Choon B. Park, Ph.D. January 2015 Table of Contents Page 1. File 2 2. Data 2 2.1 Resample 3 3. Edit 4 3.1 Export Data 4 3.2 Cut/Append Records
PicoScope. User guide. Copyright 2005 Pico Technology Limited. All rights reserved. PSW044 v1.5
 PicoScope User guide I PicoScope User Guide Table of Contents 1 Introduction...3...3 1 What is PicoScope?...3 2 Why use PicoScope?...4 3 Screen layout...4 4 Display area...5 5 Customisation...5 6 Exporting
Linkage 3.6. User s Guide
 Linkage 3.6 User s Guide David Rector Friday, December 01, 2017 Table of Contents Table of Contents... 2 Release Notes (Recently New and Changed Stuff)... 3 Installation... 3 Running the Linkage Program...
Precision DeEsser Users Guide
 Precision DeEsser Users Guide Metric Halo $Revision: 1670 $ Publication date $Date: 2012-05-01 13:50:00-0400 (Tue, 01 May 2012) $ Copyright 2012 Metric Halo. MH Production Bundle, ChannelStrip 3, Character,
A Matlab toolbox for. Characterisation Of Recorded Underwater Sound (CHORUS) USER S GUIDE
 USER S GUIDE") Centre for Marine Science and Technology A Matlab toolbox for Characterisation Of Recorded Underwater Sound (CHORUS) USER S GUIDE Version 5.0b Prepared for: Centre for Marine Science and Technology Prepared
Centre for Marine Science and Technology A Matlab toolbox for Characterisation Of Recorded Underwater Sound (CHORUS) USER S GUIDE Version 5.0b Prepared for: Centre for Marine Science and Technology Prepared
MINI PC SCOPE PCSU01. User manual. test leads software download USB cable design enclosure
 MINI PC SCOPE PCSU01 User manual Features test leads software download USB cable design enclosure Specifications oscilloscope: o bandwidth: DC to 200 khz ± 3 db o input impedance: 100 ko / 20 pf o maximum
A-ATF (1) PictureGear Pocket. Operating Instructions Version 2.0
 PictureGear Pocket. Operating Instructions Version 2.0") A-ATF-200-11(1) PictureGear Pocket Operating Instructions Version 2.0 Introduction PictureGear Pocket What is PictureGear Pocket? What is PictureGear Pocket? PictureGear Pocket is a picture album application
A-ATF-200-11(1) PictureGear Pocket Operating Instructions Version 2.0 Introduction PictureGear Pocket What is PictureGear Pocket? What is PictureGear Pocket? PictureGear Pocket is a picture album application
SNG-2150C User s Guide
 SNG-2150C User s Guide Avcom of Virginia SNG-2150C User s Guide 7730 Whitepine Road Revision 001 Richmond, VA 23237 USA GENERAL SAFETY If one or more components of your earth station are connected to 120
D-Lab & D-Lab Control Plan. Measure. Analyse. User Manual
 D-Lab & D-Lab Control Plan. Measure. Analyse User Manual Valid for D-Lab Versions 2.0 and 2.1 September 2011 Contents Contents 1 Initial Steps... 6 1.1 Scope of Supply... 6 1.1.1 Optional Upgrades... 6
Agilent PN Time-Capture Capabilities of the Agilent Series Vector Signal Analyzers Product Note
 Agilent PN 89400-10 Time-Capture Capabilities of the Agilent 89400 Series Vector Signal Analyzers Product Note Figure 1. Simplified block diagram showing basic signal flow in the Agilent 89400 Series VSAs
Lab experience 1: Introduction to LabView
 Lab experience 1: Introduction to LabView LabView is software for the real-time acquisition, processing and visualization of measured data. A LabView program is called a Virtual Instrument (VI) because
User's Guide SISII. Sound Editor STC-S521. User s Guide
 User's Guide SISII Sound Editor STC-S521 User s Guide ABSTRACT Thank you for purchasing SIS II Sound Editor! We hope that our software will improve the quality of your tasks accomplishment. IKARLab. Before
Pre-processing of revolution speed data in ArtemiS SUITE 1
 03/18 in ArtemiS SUITE 1 Introduction 1 TTL logic 2 Sources of error in pulse data acquisition 3 Processing of trigger signals 5 Revolution speed acquisition with complex pulse patterns 7 Introduction
What s New in Raven May 2006 This document briefly summarizes the new features that have been added to Raven since the release of Raven
 What s New in Raven 1.3 16 May 2006 This document briefly summarizes the new features that have been added to Raven since the release of Raven 1.2.1. Extensible multi-channel audio input device support
1 Ver.mob Brief guide
 1 Ver.mob 14.02.2017 Brief guide 2 Contents Introduction... 3 Main features... 3 Hardware and software requirements... 3 The installation of the program... 3 Description of the main Windows of the program...
PRELIMINARY INFORMATION. Professional Signal Generation and Monitoring Options for RIFEforLIFE Research Equipment
 Integrated Component Options Professional Signal Generation and Monitoring Options for RIFEforLIFE Research Equipment PRELIMINARY INFORMATION SquareGENpro is the latest and most versatile of the frequency
SNR Playback Viewer SNR Version 1.9.7
 User Manual SNR Playback Viewer SNR Version 1.9.7 Modular Network Video Recorder Note: To ensure proper operation, please read this manual thoroughly before using the product and retain the information
Operating Instructions
 Operating Instructions HAEFELY TEST AG KIT Measurement Software Version 1.0 KIT / En Date Version Responsable Changes / Reasons February 2015 1.0 Initial version WARNING Introduction i Before operating
Introduction To LabVIEW and the DSP Board
 EE-289, DIGITAL SIGNAL PROCESSING LAB November 2005 Introduction To LabVIEW and the DSP Board 1 Overview The purpose of this lab is to familiarize you with the DSP development system by looking at sampling,
Using the new psychoacoustic tonality analyses Tonality (Hearing Model) 1
 1") 02/18 Using the new psychoacoustic tonality analyses 1 As of ArtemiS SUITE 9.2, a very important new fully psychoacoustic approach to the measurement of tonalities is now available., based on the Hearing
02/18 Using the new psychoacoustic tonality analyses 1 As of ArtemiS SUITE 9.2, a very important new fully psychoacoustic approach to the measurement of tonalities is now available., based on the Hearing
Film-Tech. The information contained in this Adobe Acrobat pdf file is provided at your own risk and good judgment.
 Film-Tech The information contained in this Adobe Acrobat pdf file is provided at your own risk and good judgment. These manuals are designed to facilitate the exchange of information related to cinema
SPP-100 Module for use with the FSSP Operator Manual
 ` Particle Analysis and Display System (PADS): SPP-100 Module for use with the FSSP Operator Manual DOC-0199 A; PADS 2.8.2 SPP-100 Module 2.8.2 2545 Central Avenue Boulder, CO 80301 USA C O P Y R I G H
TL-2900 AMMONIA & NITRATE ANALYZER DUAL CHANNEL
 TL-2900 AMMONIA & NITRATE ANALYZER DUAL CHANNEL DATA ACQUISITION SYSTEM V.15.4 INSTRUCTION MANUAL Timberline Instruments, LLC 1880 S. Flatiron Ct., Unit I Boulder, Colorado 80301 Ph: (303) 440-8779 Fx:
Motion Amplification
 Motion Amplification User s Manual Version 2.0 Revised 06/9/2017 RDI Technologies 10325 Technology Dr Knoxville, TN 37932 www.rdi-technologies.com All Rights Reserved Contents 1 Using the camera... 4 1.1
MTL Software. Overview
 MTL Software Overview MTL Windows Control software requires a 2350 controller and together - offer a highly integrated solution to the needs of mechanical tensile, compression and fatigue testing. MTL
SigPlay User s Guide
 SigPlay User s Guide . . SigPlay32 User's Guide? Version 3.4 Copyright? 2001 TDT. All rights reserved. No part of this manual may be reproduced or transmitted in any form or by any means, electronic or
Transmitter Interface Program
 Transmitter Interface Program Operational Manual Version 3.0.4 1 Overview The transmitter interface software allows you to adjust configuration settings of your Max solid state transmitters. The following
SISII User Guide SISII. Sound Editor STC-S521. User Guide
 SISII SISII Sound Editor STC-S521 Note to Customer NOTE TO CUSTOMER Thank you for choosing our product. We hope you will find STC software useful as it will help you to resolve your tasks. Before getting
USB Mini Spectrum Analyzer User Manual PC program TSA For TSA5G35 TSA4G1 TSA6G1 TSA12G5
 USB Mini Spectrum Analyzer User Manual PC program TSA For TSA5G35 TSA4G1 TSA6G1 TSA12G5 Triarchy Technologies, Corp. Page 1 of 17 USB Mini Spectrum Analyzer User Manual Copyright Notice Copyright 2013
ME EN 363 ELEMENTARY INSTRUMENTATION Lab: Basic Lab Instruments and Data Acquisition
 ME EN 363 ELEMENTARY INSTRUMENTATION Lab: Basic Lab Instruments and Data Acquisition INTRODUCTION Many sensors produce continuous voltage signals. In this lab, you will learn about some common methods
BitWise (V2.1 and later) includes features for determining AP240 settings and measuring the Single Ion Area.
 includes features for determining AP240 settings and measuring the Single Ion Area.") BitWise. Instructions for New Features in ToF-AMS DAQ V2.1 Prepared by Joel Kimmel University of Colorado at Boulder & Aerodyne Research Inc. Last Revised 15-Jun-07 BitWise (V2.1 and later) includes features
BitWise. Instructions for New Features in ToF-AMS DAQ V2.1 Prepared by Joel Kimmel University of Colorado at Boulder & Aerodyne Research Inc. Last Revised 15-Jun-07 BitWise (V2.1 and later) includes features
CLIPSTER. 3D LUT File Generation with the Kodak Display Manager. Supplement
 Supplement: CLIPSTER 3D LUT File Generation with the Kodak Display Manager (Version 1.0) CLIPSTER 3D LUT File Generation with the Kodak Display Manager Supplement Supplement for the CLIPSTER Documentation:
BEAMAGE 3.0 KEY FEATURES BEAM DIAGNOSTICS PRELIMINARY AVAILABLE MODEL MAIN FUNCTIONS. CMOS Beam Profiling Camera
 PRELIMINARY POWER DETECTORS ENERGY DETECTORS MONITORS SPECIAL PRODUCTS OEM DETECTORS THZ DETECTORS PHOTO DETECTORS HIGH POWER DETECTORS CMOS Beam Profiling Camera AVAILABLE MODEL Beamage 3.0 (⅔ in CMOS
USB Mini Spectrum Analyzer User Manual TSA Program for PC TSA4G1 TSA6G1 TSA8G1
 USB Mini Spectrum Analyzer User Manual TSA Program for PC TSA4G1 TSA6G1 TSA8G1 Triarchy Technologies Corp. Page 1 of 17 USB Mini Spectrum Analyzer User Manual Copyright Notice Copyright 2013 Triarchy Technologies,
User s Guide W-E
 Presto! PVR ISDB User s Guide 518100-02-01-W-E-112307-02 Copyright 2007, NewSoft Technology Corp. All Rights Reserved. No portion of this document may be copied or reproduced in any manner without prior
Agilent Technologies. N5106A PXB MIMO Receiver Tester. Error Messages. Agilent Technologies
 Agilent Technologies N5106A PXB MIMO Receiver Tester Messages Agilent Technologies Notices Agilent Technologies, Inc. 2008 2009 No part of this manual may be reproduced in any form or by any means (including
Getting Started. Connect green audio output of SpikerBox/SpikerShield using green cable to your headphones input on iphone/ipad.
 Getting Started First thing you should do is to connect your iphone or ipad to SpikerBox with a green smartphone cable. Green cable comes with designators on each end of the cable ( Smartphone and SpikerBox
ST-4000 SIGNAL LEVEL METER
 ST-4000 SIGNAL LEVEL METER Table of Contents Features / Specifications.... 1 Keypad Illustration....... 2 Keypad Controls.... 2 Getting Started: Powering the Meter.... 3 Quick Use Instructions.. 3 Main
TV Character Generator
 TV Character Generator TV CHARACTER GENERATOR There are many ways to show the results of a microcontroller process in a visual manner, ranging from very simple and cheap, such as lighting an LED, to much
Xpedition Layout for Package Design. Student Workbook
 Student Workbook 2017 Mentor Graphics Corporation All rights reserved. This document contains information that is trade secret and proprietary to Mentor Graphics Corporation or its licensors and is subject
Software Quick Manual
 XX113-30-00 Workstation and NVR Quick Manual Vicon Industries Inc. does not warrant that the functions contained in this equipment will meet your requirements or that the operation will be entirely error
User s Manual. Log Scale (/LG) GX10/GP10/GX20/GP20 IM 04L51B01-06EN. 1st Edition
 GX10/GP10/GX20/GP20 IM 04L51B01-06EN. 1st Edition") User s Manual Model GX10/GP10/GX20/GP20 Log Scale (/LG) User s Manual 1st Edition Introduction Notes Trademarks Thank you for purchasing the SMARTDAC+ Series GX10/GX20/GP10/GP20 (hereafter referred to
User s Manual Model GX10/GP10/GX20/GP20 Log Scale (/LG) User s Manual 1st Edition Introduction Notes Trademarks Thank you for purchasing the SMARTDAC+ Series GX10/GX20/GP10/GP20 (hereafter referred to
Analyzing and Saving a Signal
 Analyzing and Saving a Signal Approximate Time You can complete this exercise in approximately 45 minutes. Background LabVIEW includes a set of Express VIs that help you analyze signals. This chapter teaches
Application Note AN-708 Vibration Measurements with the Vibration Synchronization Module
 Application Note AN-708 Vibration Measurements with the Vibration Synchronization Module Introduction The vibration module allows complete analysis of cyclical events using low-speed cameras. This is accomplished
KRAMER ELECTRONICS LTD. USER MANUAL
 KRAMER ELECTRONICS LTD. USER MANUAL MODEL: Projection Curved Screen Blend Guide How to blend projection images on a curved screen using the Warp Generator version K-1.4 Introduction The guide describes
ECE 4220 Real Time Embedded Systems Final Project Spectrum Analyzer
 ECE 4220 Real Time Embedded Systems Final Project Spectrum Analyzer by: Matt Mazzola 12222670 Abstract The design of a spectrum analyzer on an embedded device is presented. The device achieves minimum
Manual Version Ver 1.0
 The BG-3 & The BG-7 Multiple Test Pattern Generator with Field Programmable ID Option Manual Version Ver 1.0 BURST ELECTRONICS INC CORRALES, NM 87048 USA (505) 898-1455 VOICE (505) 890-8926 Tech Support
Quick Start manual for Nova
 Quick Start manual for Nova 1. Overview The Nova PlugIn for the Pyramix rendering interface allows easy modification of audio data in the frequency domain. These modifications include interpolation of
Manual for the sound card oscilloscope V1.41 C. Zeitnitz english translation by P. van Gemmeren, K. Grady and C. Zeitnitz
 Manual for the sound card oscilloscope V1.41 C. Zeitnitz english translation by P. van Gemmeren, K. Grady and C. Zeitnitz C. Zeitnitz 12/2012 This Software and all previous versions are NO Freeware! The
Supplementary Course Notes: Continuous vs. Discrete (Analog vs. Digital) Representation of Information
 Representation of Information") Supplementary Course Notes: Continuous vs. Discrete (Analog vs. Digital) Representation of Information Introduction to Engineering in Medicine and Biology ECEN 1001 Richard Mihran In the first supplementary
Supplementary Course Notes: Continuous vs. Discrete (Analog vs. Digital) Representation of Information Introduction to Engineering in Medicine and Biology ECEN 1001 Richard Mihran In the first supplementary
Oscilloscopes, logic analyzers ScopeLogicDAQ
 Oscilloscopes, logic analyzers ScopeLogicDAQ ScopeLogicDAQ 2.0 is a comprehensive measurement system used for data acquisition. The device includes a twochannel digital oscilloscope and a logic analyser
HyperMedia User Manual
 HyperMedia User Manual Contents V3.5 Chapter 1 : HyperMedia Software Functions... 3 1.1 HyperMedia Introduction... 3 1.2 Main Panel... 3 1.2.2 Information Window... 4 1.2.3 Keypad... 4 1.2.4 Channel Index...
Linrad On-Screen Controls K1JT
 Linrad On-Screen Controls K1JT Main (Startup) Menu A = Weak signal CW B = Normal CW C = Meteor scatter CW D = SSB E = FM F = AM G = QRSS CW H = TX test I = Soundcard test mode J = Analog hardware tune
ELSA WINNER Series M a n u a l
 Manual Series 2002 Neue ELSA GmbH, Aachen (Germany) While the information in this manual has been compiled with great care, it may not be deemed an assurance of product characteristics. Neue ELSA GmbH
The Kaffeine Handbook. Jürgen Kofler Christophe Thommeret Mauro Carvalho Chehab
 Jürgen Kofler Christophe Thommeret Mauro Carvalho Chehab 2 Contents 1 Kaffeine Player 5 1.1 The Start Window...................................... 5 1.2 Play a File..........................................
Using Spectrum Laboratory (Spec Lab) for Precise Audio Frequency Measurements
 for Precise Audio Frequency Measurements") Using Spectrum Laboratory (Spec Lab) for Precise Audio Frequency Measurements Ver 1.15 Nov 2009 Jacques Audet VE2AZX ve2azx@amsat.org WEB: ve2azx.net NOTE: SpecLab version V2.7 b18 has some problems with
Using Spectrum Laboratory (Spec Lab) for Precise Audio Frequency Measurements Ver 1.15 Nov 2009 Jacques Audet VE2AZX ve2azx@amsat.org WEB: ve2azx.net NOTE: SpecLab version V2.7 b18 has some problems with
2-/4-Channel Cam Viewer E- series for Automatic License Plate Recognition CV7-LP
 2-/4-Channel Cam Viewer E- series for Automatic License Plate Recognition Copyright 2-/4-Channel Cam Viewer E-series for Automatic License Plate Recognition Copyright 2018 by PLANET Technology Corp. All
Table of content. Table of content Introduction Concepts Hardware setup...4
 Table of content Table of content... 1 Introduction... 2 1. Concepts...3 2. Hardware setup...4 2.1. ArtNet, Nodes and Switches...4 2.2. e:cue butlers...5 2.3. Computer...5 3. Installation...6 4. LED Mapper
Heart Rate Variability Preparing Data for Analysis Using AcqKnowledge
 APPLICATION NOTE 42 Aero Camino, Goleta, CA 93117 Tel (805) 685-0066 Fax (805) 685-0067 info@biopac.com www.biopac.com 01.06.2016 Application Note 233 Heart Rate Variability Preparing Data for Analysis
Bogart SE 3. Addition to the manual
 Bogart SE 3 Addition to the manual Bogart SE 3 Addition to the manual 3 Table of contents General information... 4 Overview of new functions and improvements... 4 Audio.... 4 Recording, HDV... 4 Editing...
Guide to Analysing Full Spectrum/Frequency Division Bat Calls with Audacity (v.2.0.5) by Thomas Foxley
 by Thomas Foxley") Guide to Analysing Full Spectrum/Frequency Division Bat Calls with Audacity (v.2.0.5) by Thomas Foxley Contents Getting Started Setting Up the Sound File Noise Removal Finding All the Bat Calls Call Analysis
Guide to Analysing Full Spectrum/Frequency Division Bat Calls with Audacity (v.2.0.5) by Thomas Foxley Contents Getting Started Setting Up the Sound File Noise Removal Finding All the Bat Calls Call Analysis
Data Acquisition Using LabVIEW
 Experiment-0 Data Acquisition Using LabVIEW Introduction The objectives of this experiment are to become acquainted with using computer-conrolled instrumentation for data acquisition. LabVIEW, a program
Troubleshooting Your Design with Tektronix MSO and DPO Series Oscilloscopes
 Troubleshooting Your Design with Tektronix MSO and DPO Series Oscilloscopes Our thanks to Tektronix for allowing us to reprint the following article. Today s engineers and technicians face increasingly
ST-4000D SIGNAL LEVEL METER
 ST-4000D SIGNAL LEVEL METER Rev 100606 Table of Contents Features / Specifications.... 1 Keypad Illustration....... 2 Keypad Controls.... 2 Getting Started: Powering the Meter...... 3 Quick Use Instructions.....
PicoScope for Windows user guide Chapter 1: Overview Chapter 2: Views Chapter 3: How To.. Chapter 4: Menus Chapter 5: Dialogs
 PicoScope for Windows user guide This user guide contains over a hundred pages of information about the PicoScope for Windows program. Please take a few minutes to read chapters 1 and 2, as this will quickly
User Manual. English. Sequencer Control Option BE3200. I en HBM: public
 User Manual English Sequencer Control Option BE3200 I2702-1.2 en HBM: public Document version 1.2 - July 2016 References made to the Perception software are for version 7.00 or higher For HBM's Terms and
Using the BHM binaural head microphone
 11/17 Using the binaural head microphone Introduction 1 Recording with a binaural head microphone 2 Equalization of a recording 2 Individual equalization curves 5 Using the equalization curves 5 Post-processing
7thSense Design Delta Media Server
 7thSense Design Delta Media Server Channel Alignment Guide: Warping and Blending Original by Andy B Adapted by Helen W (November 2015) 1 Trademark Information Delta, Delta Media Server, Delta Nano, Delta
MICROSOFT WORD FEATURES FOR ARTS POSTGRADUATES
 MICROSOFT WORD FEATURES FOR ARTS POSTGRADUATES...2 Page Setup...3 Styles...4 Using Inbuilt Styles...4 Modifying a Style...5 Creating a Style...5 Section Breaks...6 Insert a section break...6 Delete a section
MAutoPitch. Presets button. Left arrow button. Right arrow button. Randomize button. Save button. Panic button. Settings button
 MAutoPitch Presets button Presets button shows a window with all available presets. A preset can be loaded from the preset window by double-clicking on it, using the arrow buttons or by using a combination