Escaping RGBland: Selecting Colors for Statistical Graphics
|
|
|
- Julie Harper
- 5 years ago
- Views:
Transcription
1 Escaping RGBland: Selecting Colors for Statistical Graphics Achim Zeileis Kurt Hornik Paul Murrell
2 Overview Motivation Statistical graphics and color Color vision and color spaces Palettes (in HCL space) Qualitative Sequential Diverging Color blindness Software
3 Motivation: Statistical graphics Information in statistical graphics is typically coded by: length easy to decode for humans best for aligned common scales area, volume more difficult to decode dependence on shape: long/thin is seen larger than compact/convex dependence on color: lighter areas seen larger angle, slope problematic for humans dependence on orientation color omni-present in statistical graphics
4 Motivation: Statistical graphics particularly important for shading areas (e.g., bar plots, pie charts, mosaic displays, heatmaps,... ) avoid large areas of saturated colors powerful for encoding categorical information care needed for coding quantitative information More often than not: Only little guidance about how to choose a suitable palette for a certain visualization task. Question: What are useful color palettes for coding qualitative and quantitative information? Currently: Many palettes are constructed based on HSV space, especially by varying hue.
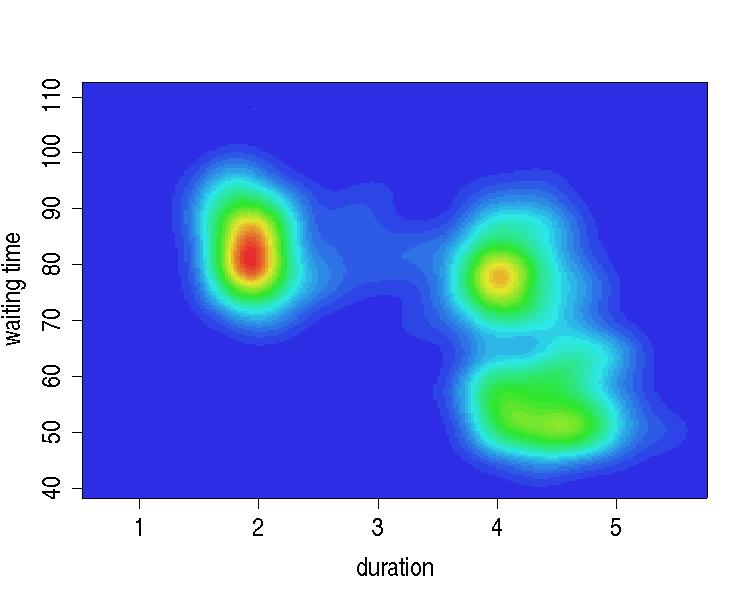
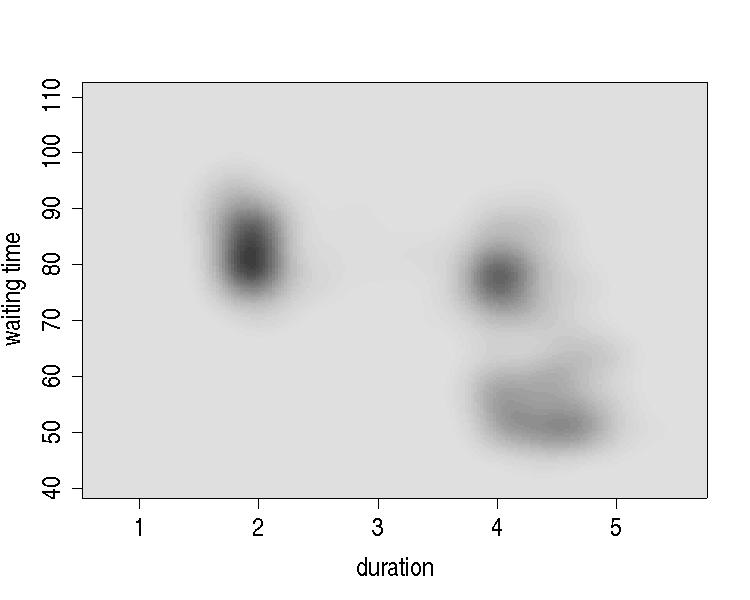
5 Motivation: Statistical graphics Examples: heatmap of bivariate kernel density estimate for Old Faithful geyser eruptions data, map of Nigeria shaded by posterior mode estimates for childhood mortality, pie chart of seats in the German parliament Bundestag, mosaic display of votes for the German Bundestag, model-based mosaic display for treatment of arthritis, scatter plot with three clusters (and many points).
6 Motivation: Statistical graphics
7 Motivation: Statistical graphics
8 Motivation: Statistical graphics SPD CDU/CSU Grüne Linke FDP
9 Motivation: Statistical graphics Schleswig Holstein Hamburg Niedersachsen Bremen CDU/CSU FDP SPD Gr Li Nordrhein Westfalen Hessen Rheinland Pfalz Bayern Baden Württemberg Saarland Mecklenburg Vorpommern Brandenburg Sachsen Anhalt Berlin Sachsen Thüringen
10 Motivation: Statistical graphics Placebo Treatment Treated Pearson residuals: Improvement Marked Some None p value =
11 Motivation: Statistical graphics
12 Motivation: Statistical graphics Problems: Flashy colors: good for drawing attention to a plot but hard to look at for a longer time. Large areas of saturated colors: after-image effects. can produce distracting Unbalanced colors: light and dark colors are mixed; or positive and negative colors are difficult to compare. Quantitative variables are often difficult to decode.
13 Motivation: Statistical graphics Solutions: Use pre-fabricated color palettes (with fixed number of colors) designed for specific visualization tasks: Color- Brewer.org (see Brewer, 1999). Problem: little flexiblity. Selecting colors along axes in a color space whose axes can be matched with perceptual axes of the human visual system. Leads to similar palettes compared to ColorBrewer.org but offers more flexibility via a general principle for choosing palettes.
14 Color vision and color spaces Human color vision is hypothesized to have evolved in three distinct stages: 1. light/dark (monochrome only) 2. yellow/blue (associated with warm/cold colors) 3. green/red (associated with ripeness of fruit) Yellow Green Red Blue
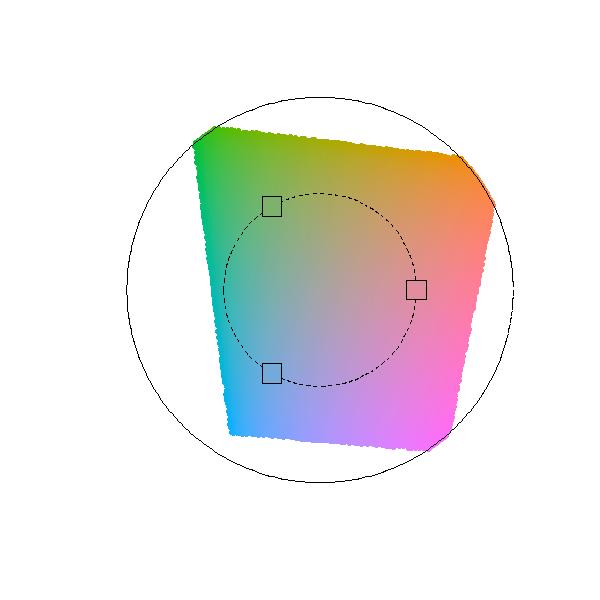
15 Color vision and color spaces Due to these three color axes, colors are typically described as locations in a 3-dimensional space, often by mixing three primary colors, e.g., RGB or CIEXYZ. Physiological axes do not correspond to natural perception of color but rather to polar coordinates in the color plane: hue (dominant wavelength) chroma (colorfulness, intensity of color as compared to gray) luminance (brightness, amount of gray) Perceptually based color spaces try to capture these three axes of the human perceptual system, e.g., HSV or HCL.
16 Color vision and color spaces HSV space is a standard transformation of RGB space implemented in most computer packages. Specification: triplet (H, S, V ) with H = 0,..., 360 and S, V = 0,..., 100, often all transformed to unit interval (e.g., in R). Shape: cone (or transformed to cylinder). Problem: dimensions are confounded, hence not really perceptually based.

17 Color vision and color spaces
18 Color vision and color spaces
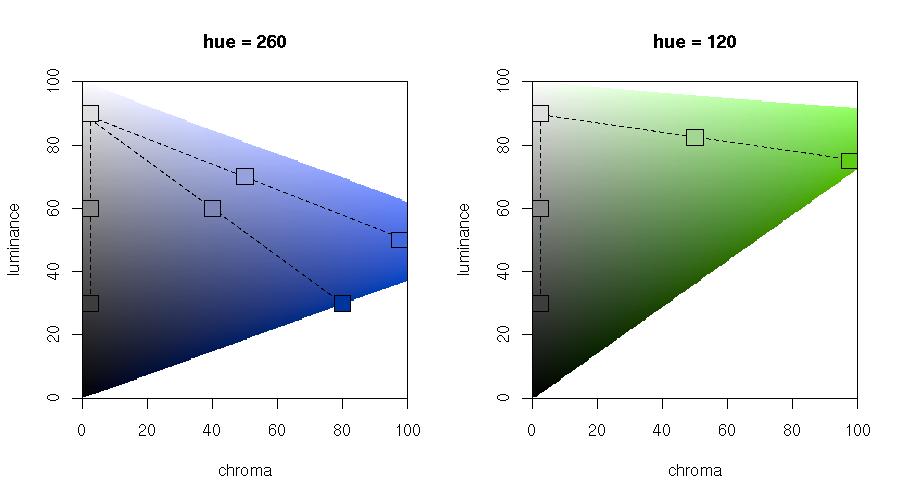
19 Color vision and color spaces HCL space is a perceptually based color space, polar coordinates in CIELUV space. Specification: triplet (H, C, L) with H = 0,..., 360 and C, L = 0,..., 100. Shape: distorted double cone. Problem: Care is needed when traversing along the axes due to distorted shape.
20 Color vision and color spaces

21 Color vision and color spaces
22 Palettes: Qualitative Goal: Code qualitative information. Solution: Use different hues for different categories. Keep chroma and luminance fixed, e.g., (H, 50, 70) Remark: The admissible hues (within HCL space) depend on the values of chroma and luminance chosen. Hues can be chosen from different subsets of [0, 360] to create different moods or as metaphors for the categories they code (see Ihaka, 2003).
23 Palettes: Qualitative
24 Palettes: Qualitative
25 Palettes: Qualitative dynamic [30, 300] harmonic [60, 240] cold [270, 150] warm [90, 30]
26 Palettes: Qualitative SPD CDU/CSU Grüne Linke FDP
27 Palettes: Qualitative SPD CDU/CSU Grüne Linke FDP
28 Palettes: Qualitative Schleswig Holstein Hamburg Niedersachsen Bremen CDU/CSU FDP SPD Gr Li Nordrhein Westfalen Hessen Rheinland Pfalz Bayern Baden Württemberg Saarland Mecklenburg Vorpommern Brandenburg Sachsen Anhalt Berlin Sachsen Thüringen
29 Palettes: Qualitative Schleswig Holstein Hamburg Niedersachsen Bremen CDU/CSU FDP SPD Gr Li Nordrhein Westfalen Hessen Rheinland Pfalz Bayern Baden Württemberg Saarland Mecklenburg Vorpommern Brandenburg Sachsen Anhalt Berlin Sachsen Thüringen
30 Palettes: Qualitative
31 Palettes: Qualitative
32 Palettes: Sequential Goal: Code quantitative information. Intensity/interestingness i ranges in [0, 1], where 0 is uninteresting, 1 is interesting. Solution: Code i by increasing amount of gray (luminance), no color used, e.g., (H, 0, 90 i 60) The hue H does not matter, chroma is set to 0 (no color), luminance ranges in [30, 90], avoiding the extreme colors black and white. Modification: In addition, code i by colorfulness (chroma). Thus, more formally: for a fixed hue H. (H, 0 + i C max, L max i (L max L min )
33 Palettes: Sequential
34 Palettes: Sequential Modification: To increase the contrast within the palette even further, simultaneously vary the hue as well: (H 2 i (H 1 H 2 ), C max i p1 (C max C min ), L max i p2 (L max L min )). To make the change in hue visible, the chroma needs to increase rather quickly for low values of i and then only slowly for higher values of i. A convenient transformation for achieving this is to use i p instead of i with different powers for chroma and luminance.
35 Palettes: Sequential
36 Palettes: Sequential
37 Palettes: Sequential
38 Palettes: Sequential
39 Palettes: Diverging Goal: Code quantitative information. Intensity/interestingness i ranges in [ 1, 1], where 0 is uninteresting, ±1 is interesting. Solution: Combine sequential palettes with different hues. Remark: To achieve both large chroma and/or large luminance contrasts, use hues with similar chroma/luminance plane, e.g., H = 0 (red) and H = 260 (blue).

40 Palettes: Diverging
41 Palettes: Diverging
42 Palettes: Diverging
43 Palettes: Diverging
44 Palettes: Diverging Placebo Treatment Treated Pearson residuals: Improvement Marked Some None p value =
45 Palettes: Diverging Placebo Treatment Treated Pearson residuals: Improvement Marked Some None p value =
46 Color blindness A few percent of humans (particularly males) have deficiencies in their color vision, typically referred to as color blindness. The most common forms of color blindness are different types of red-green color blindness: deuteranopia (lack of green-sensitive pigment), protanopia (lack of red-sensitive pigment). Construct suitable HCL colors: use large large luminance contrasts (visible even for monochromats), use chroma contrasts on the yellow-blue axis (visible for dichromats), check colors by emulating dichromatic vision, e.g., utilizing dichromat (Lumley 2006)
47 Color blindness
48 Color blindness
49 Color blindness
50 Color blindness
51 Color blindness
52 Color blindness

53 Color blindness
54 Color blindness
55 Color blindness
56 Software Implementing HCL-based palettes is not difficult: If HCL colors are available, our formulas are straightforward to implement. If not, HCL coordinates typically need to be converted to RGB coordinates for display. Formulas are available, e.g., in Wikipedia (2007ab). R has an implementation of various color spaces (including HCL) in Ross Ihaka s colorspace package. Based on this, our vcd package provides rainbow_hcl(), sequential_hcl(), heat_hcl(), and diverge_hcl(). For documentation and further examples, see?rainbow_hcl and vignette("hcl-colors", package = "vcd").
57 References Brewer CA (1999). Color Use Guidelines for Data Representation. In Proceedings of the Section on Statistical Graphics, American Statistical Association, Alexandria, VA, Ihaka R (2003). Colour for Presentation Graphics. In K Hornik, F Leisch, A Zeileis (eds.), Proceedings of the 3rd International Workshop on Distributed Statistical Computing, Vienna, Austria, ISSN X, URL Proceedings/. Lumley T (2006). Color Coding and Color Blindness in Statistical Graphics. ASA Statistical Computing & Graphics Newsletter, 17(2), 4-7. URL sections/graphics/newsletter/volumes/v172.pdf. Wikipedia (2007a). CIELUV Color Space Wikipedia, The Free Encyclopedia. URL http: //en.wikipedia.org/wiki/cieluv_color_space. accessed Wikipedia (2007b). HSV Color Space Wikipedia, The Free Encyclopedia. URL http: //en.wikipedia.org/wiki/hsv_color_space. accessed Zeileis A, Hornik K, Murrell P (2007). Escaping RGBland: Selecting Colors for Statistical Graphics. Report 61, Department of Statistics and Mathematics, Wirtschaftsuniversität Wien, Research Report Series. URL Zeileis A, Meyer D, Hornik K (2007). Residual-based Shadings for Visualizing (Conditional) Independence. Journal of Computational and Graphical Statistics, 16(3), doi: / x
Somewhere over the Rainbow How to Make Effective Use of Colors in Statistical Graphics
 Somewhere over the Rainbow How to Make Effective Use of Colors in Statistical Graphics Achim Zeileis https://eeecon.uibk.ac.at/~zeileis/ Introduction Zeileis A, Hornik K, Murrell P (2009). Escaping RGBland:
HCL-Based Color Palettes in R
 HCL-Based Color Palettes in R Achim Zeileis Universität Innsbruck Kurt Hornik WU Wirtschaftsuniversität Wien Paul Murrell The University of Auckland Abstract The package colorspace provides various functions
A Toolbox for Manipulating and Assessing Color Palettes for Statistical Graphics
 A Toolbox for Manipulating and Assessing Color Palettes for Statistical Graphics Achim Zeileis, Jason C. Fisher, Kurt Hornik, Ross Ihaka, Claire D. McWhite, Paul Murrell, Reto Stauffer, Claus O. Wilke
Murdoch redux. Colorimetry as Linear Algebra. Math of additive mixing. Approaching color mathematically. RGB colors add as vectors
 Murdoch redux Colorimetry as Linear Algebra CS 465 Lecture 23 RGB colors add as vectors so do primary spectra in additive display (CRT, LCD, etc.) Chromaticity: color ratios (r = R/(R+G+B), etc.) color
CSE Data Visualization. Color. Jeffrey Heer University of Washington
 CSE 512 - Data Visualization Color Jeffrey Heer University of Washington Color in Visualization Identify, Group, Layer, Highlight Colin Ware Purpose of Color To label To measure To represent and imitate
Understanding Human Color Vision
 Understanding Human Color Vision CinemaSource, 18 Denbow Rd., Durham, NH 03824 cinemasource.com 800-483-9778 CinemaSource Technical Bulletins. Copyright 2002 by CinemaSource, Inc. All rights reserved.
Get to Know Germany COLORING & ACTIVIT Y BOOK
 Get to Know Germany COLORING & ACTIVIT Y BOOK Bakery Bäckerei Germany s states Deutschlands Bundesländer Schleswig- Holstein Mecklenburg-Vorpommern Bremen Hamburg Niedersachsen Brandenburg Berlin Bäckerei
A Handbook of Statistical Analyses Using R. Brian S. Everitt and Torsten Hothorn
 A Handbook of Statistical Analyses Using R Brian S. Everitt and Torsten Hothorn Preface ThisbookisintendedasaguidetodataanalysiswiththeRsystemforstatistical computing. R is an environment incorporating
Why visualize data? Advanced GDA and Software: Multivariate approaches, Interactive Graphics, Mondrian, iplots and R. German Bundestagswahl 2005
 Advanced GDA and Software: Multivariate approaches, Interactive Graphics, Mondrian, iplots and R Why visualize data? Looking for global trends overall structure Looking for local features data quality
The theory of data visualisation
 The theory of data visualisation V2017-10 Simon Andrews, Phil Ewels simon.andrews@babraham.ac.uk phil.ewels@scilifelab.se Data Visualisation A scientific discipline involving the creation and study of
Visual Encoding Design
 CSE 442 - Data Visualization Visual Encoding Design Jeffrey Heer University of Washington A Design Space of Visual Encodings Mapping Data to Visual Variables Assign data fields (e.g., with N, O, Q types)
Using the NTSC color space to double the quantity of information in an image
 Stanford Exploration Project, Report 110, September 18, 2001, pages 1 181 Short Note Using the NTSC color space to double the quantity of information in an image Ioan Vlad 1 INTRODUCTION Geophysical images
Principles of Data Visualization. Jeffrey University of Washington
 Principles of Data Visualization Jeffrey Heer @jeffrey_heer University of Washington Data Analysis & Statistics, Tukey & Wilk 1966 Four major influences act on data analysis today: 1. The formal theories
Mapping: Methods & Tips
 61 Mapping: Methods & Tips Color Design for the Color Vision Impaired Bernhard Jenny Institute of Cartography ETH Zurich, Switzerland jenny@karto.baug.ethz.ch Nathaniel Vaughn Kelso The Washington Post
[source unknown] Cornell CS465 Fall 2004 Lecture Steve Marschner 1
![[source unknown] Cornell CS465 Fall 2004 Lecture Steve Marschner 1](/thumbs/80/81460800.jpg "[source unknown] Cornell CS465 Fall 2004 Lecture Steve Marschner 1") [source unknown] 2004 Steve Marschner 1 What light is Light is electromagnetic radiation exists as oscillations of different frequency (or, wavelength) [Lawrence Berkeley Lab / MicroWorlds] 2004 Steve
[source unknown] 2004 Steve Marschner 1 What light is Light is electromagnetic radiation exists as oscillations of different frequency (or, wavelength) [Lawrence Berkeley Lab / MicroWorlds] 2004 Steve
The Art and Science of Depiction. Color. Fredo Durand MIT- Lab for Computer Science
 The Art and Science of Depiction Color Fredo Durand MIT- Lab for Computer Science Color Color Vision 2 Talks Abstract Issues Color Vision 3 Plan Color blindness Color Opponents, Hue-Saturation Value Perceptual
Supplemental Material: Color Compatibility From Large Datasets
 Supplemental Material: Color Compatibility From Large Datasets Peter O Donovan, Aseem Agarwala, and Aaron Hertzmann Project URL: www.dgp.toronto.edu/ donovan/color/ 1 Unmixing color preferences In the
Circular Statistics Applied to Colour Images
 Circular Statistics pplied to Colour Images llan Hanbury PRIP, TU Wien, Favoritenstraße 9/183, -1040 Vienna, ustria hanbury@prip.tuwien.ac.at bstract Three methods for summarising the characteristics of
Automatic Testing of Color Blindness
 Automatic Testing of Color Blindness S. Dey 1, S. Roy 2 and K. Roy 3 1 Dept. of IT, Camellia Institute of Technology 2 Dept. of Biotech & Medical Engg., NIT Rourkella 3 Dept. of Comp. Sc., West Bengal
Chapter 5. Describing Distributions Numerically. Finding the Center: The Median. Spread: Home on the Range. Finding the Center: The Median (cont.
 Chapter 5 Describing Distributions Numerically Copyright 2007 Pearson Education, Inc. Publishing as Pearson Addison-Wesley Copyright 2007 Pearson Education, Inc. Publishing as Pearson Addison-Wesley Slide
Graphical User Interface for Modifying Structables and their Mosaic Plots
 Graphical User Interface for Modifying Structables and their Mosaic Plots UseR 2011 Heiberger and Neuwirth 1 Graphical User Interface for Modifying Structables and their Mosaic Plots Richard M. Heiberger
Television History. Date / Place E. Nemer - 1
 Television History Television to see from a distance Earlier Selenium photosensitive cells were used for converting light from pictures into electrical signals Real breakthrough invention of CRT AT&T Bell
Color in Information Visualization
 Color in Information Visualization James Bernhard April 2012 Color serves different purposes in art and in information visualization: In art, color is used for creative and expressive purposes In information
Recap of Last (Last) Week
 Week") Recap of Last (Last) Week 1 The Beauty of Information Visualization Napoléon s Historical Retreat 2 Course Design Homepage: have you visited and registered? 3 The Value of Information Visualization Have
Recap of Last (Last) Week 1 The Beauty of Information Visualization Napoléon s Historical Retreat 2 Course Design Homepage: have you visited and registered? 3 The Value of Information Visualization Have
Statistics for Engineers
 Statistics for Engineers ChE 4C3 and 6C3 Kevin Dunn, 2013 kevin.dunn@mcmaster.ca http://learnche.mcmaster.ca/4c3 Overall revision number: 19 (January 2013) 1 Copyright, sharing, and attribution notice
Visual Imaging and the Electronic Age Color Science
 Visual Imaging and the Electronic Age Color Science Color Gamuts & Color Spaces for User Interaction Lecture #7 September 13, 2016 Donald P. Greenberg Describing Color in XYZ Luminance Y Chromaticity x
Introduction & Colour
 Introduction & Colour Eric C. McCreath School of Computer Science The Australian National University ACT 0200 Australia ericm@cs.anu.edu.au Overview Computer Graphics Uses Basic Hardware and Software Colour
Analysis and Improvement of the Open- StreetMap Street Color Scheme for Users with Color Vision Deficiencies
 Analysis and Improvement of the Open- StreetMap Street Color Scheme for Users with Color Vision Deficiencies Johannes Kröger, Jochen Schiewe, Beate Weninger HafenCity Universität Hamburg Abstract. In this
Visual Imaging and the Electronic Age Color Science
 Visual Imaging and the Electronic Age Color Science Color Gamuts & Color Spaces for User Interaction Lecture #7 September 15, 2015 Donald P. Greenberg Chromaticity Diagram The luminance or lightness axis,
Essence of Image and Video
 1 Essence of Image and Video Wei-Ta Chu 2009/9/24 Outline 2 Image Digital Image Fundamentals Representation of Images Video Representation of Videos 3 Essence of Image Wei-Ta Chu 2009/9/24 Chapters 2 and
Frequencies. Chapter 2. Descriptive statistics and charts
 An analyst usually does not concentrate on each individual data values but would like to have a whole picture of how the variables distributed. In this chapter, we will introduce some tools to tabulate
Ch. 1: Audio/Image/Video Fundamentals Multimedia Systems. School of Electrical Engineering and Computer Science Oregon State University
 Ch. 1: Audio/Image/Video Fundamentals Multimedia Systems Prof. Ben Lee School of Electrical Engineering and Computer Science Oregon State University Outline Computer Representation of Audio Quantization
STAT 113: Statistics and Society Ellen Gundlach, Purdue University. (Chapters refer to Moore and Notz, Statistics: Concepts and Controversies, 8e)
") STAT 113: Statistics and Society Ellen Gundlach, Purdue University (Chapters refer to Moore and Notz, Statistics: Concepts and Controversies, 8e) Learning Objectives for Exam 1: Unit 1, Part 1: Population
STAT 113: Statistics and Society Ellen Gundlach, Purdue University (Chapters refer to Moore and Notz, Statistics: Concepts and Controversies, 8e) Learning Objectives for Exam 1: Unit 1, Part 1: Population
Computer Graphics. Raster Scan Display System, Rasterization, Refresh Rate, Video Basics and Scan Conversion
 Computer Graphics Raster Scan Display System, Rasterization, Refresh Rate, Video Basics and Scan Conversion 2 Refresh and Raster Scan Display System Used in Television Screens. Refresh CRT is point plotting
MATH 214 (NOTES) Math 214 Al Nosedal. Department of Mathematics Indiana University of Pennsylvania. MATH 214 (NOTES) p. 1/3
 Math 214 Al Nosedal. Department of Mathematics Indiana University of Pennsylvania. MATH 214 (NOTES) p. 1/3") MATH 214 (NOTES) Math 214 Al Nosedal Department of Mathematics Indiana University of Pennsylvania MATH 214 (NOTES) p. 1/3 CHAPTER 1 DATA AND STATISTICS MATH 214 (NOTES) p. 2/3 Definitions. Statistics is
MATH 214 (NOTES) Math 214 Al Nosedal Department of Mathematics Indiana University of Pennsylvania MATH 214 (NOTES) p. 1/3 CHAPTER 1 DATA AND STATISTICS MATH 214 (NOTES) p. 2/3 Definitions. Statistics is
Improving Color Text Sharpness in Images with Reduced Chromatic Bandwidth
 Improving Color Text Sharpness in Images with Reduced Chromatic Bandwidth Scott Daly, Jack Van Oosterhout, and William Kress Digital Imaging Department, Digital Video Department Sharp aboratories of America
Media Information. Trade fairs and conferences supra-regional regional. Frankfurt/Main, Heimtextil. Essen,
 Publication Schedule 1 st Semester Actual circulation calculated on the annual average (1 st July 2016 30 th June ) 19,259 copies, 14,907 of them subscribed copies! Important information for painters and
Man-Machine-Interface (Video) Nataliya Nadtoka coach: Jens Bialkowski
 Nataliya Nadtoka coach: Jens Bialkowski") Seminar Digitale Signalverarbeitung in Multimedia-Geräten SS 2003 Man-Machine-Interface (Video) Computation Engineering Student Nataliya Nadtoka coach: Jens Bialkowski Outline 1. Processing Scheme 2. Human
Seminar Digitale Signalverarbeitung in Multimedia-Geräten SS 2003 Man-Machine-Interface (Video) Computation Engineering Student Nataliya Nadtoka coach: Jens Bialkowski Outline 1. Processing Scheme 2. Human
Computer and Machine Vision
 Computer and Machine Vision Introduction to Continuous Camera Capture, Sampling, Encoding, Decoding and Transport January 22, 2014 Sam Siewert Video Camera Fundamentals Overview Introduction to Codecs
Inventions on color selections in Graphical User Interfaces
 From the SelectedWorks of Umakant Mishra November, 2005 Inventions on color selections in Graphical User Interfaces Umakant Mishra Available at: https://works.bepress.com/umakant_mishra/31/ Inventions
Wide Color Gamut SET EXPO 2016
 Wide Color Gamut SET EXPO 2016 31 AUGUST 2016 Eliésio Silva Júnior Reseller Account Manager E/ esilvaj@tek.com T/ +55 11 3530-8940 M/ +55 21 9 7242-4211 tek.com Anatomy Human Vision CIE Chart Color Gamuts
Colour Features in Adobe Creative Suite
 Colour Features in Adobe Creative Suite HSB Based on the human perception of color, the HSB model describes three fundamental characteristics of color: Hue, Saturation, Brightness Hue Color reflected from
DRAFT. Proposal to modify International Standard IEC
 Imaging & Color Science Research & Product Development 2528 Waunona Way, Madison, WI 53713 (608) 222-0378 www.lumita.com Proposal to modify International Standard IEC 61947-1 Electronic projection Measurement
Edge-Aware Color Appearance. Supplemental Material
 Edge-Aware Color Appearance Supplemental Material Min H. Kim 1,2 Tobias Ritschel 3,4 Jan Kautz 2 1 Yale University 2 University College London 3 Télécom ParisTech 4 MPI Informatik 1 Color Appearance Data
Processing. Electrical Engineering, Department. IIT Kanpur. NPTEL Online - IIT Kanpur
 NPTEL Online - IIT Kanpur Course Name Department Instructor : Digital Video Signal Processing Electrical Engineering, : IIT Kanpur : Prof. Sumana Gupta file:///d /...e%20(ganesh%20rana)/my%20course_ganesh%20rana/prof.%20sumana%20gupta/final%20dvsp/lecture1/main.htm[12/31/2015
Colour Reproduction Performance of JPEG and JPEG2000 Codecs
 Colour Reproduction Performance of JPEG and JPEG000 Codecs A. Punchihewa, D. G. Bailey, and R. M. Hodgson Institute of Information Sciences & Technology, Massey University, Palmerston North, New Zealand
Fundamentals of Multimedia. Lecture 3 Color in Image & Video
 Fundamentals of Multimedia Lecture 3 Color in Image & Video Mahmoud El-Gayyar elgayyar@ci.suez.edu.eg Mahmoud El-Gayyar / Fundamentals of Multimedia 1 Black & white imags Outcomes of Lecture 2 1 bit images,
High-Definition, Standard-Definition Compatible Color Bar Signal
 Page 1 of 16 pages. January 21, 2002 PROPOSED RP 219 SMPTE RECOMMENDED PRACTICE For Television High-Definition, Standard-Definition Compatible Color Bar Signal 1. Scope This document specifies a color
Vannevar Bush: As We May Think
 Vannevar Bush: As We May Think 1. What is the context in which As We May Think was written? 2. What is the Memex? 3. In basic terms, how was the Memex intended to work? 4. In what ways does personal computing
Research on Color Reproduction Characteristics of Mobile Terminals
 Applied Mechanics and Materials Submitted: 2014-09-14 ISSN: 1662-7482, Vol. 731, pp 80-86 Accepted: 2014-11-19 doi:10.4028/www.scientific.net/amm.731.80 Online: 2015-01-29 2015 Trans Tech Publications,
Minimizing the Perception of Chromatic Noise in Digital Images
 Minimizing the Perception of Chromatic Noise in Digital Images Xiaoyan Song, Garrett M. Johnson, Mark D. Fairchild Munsell Color Science Laboratory Rochester Institute of Technology, Rochester, N, USA
Achieve Accurate Critical Display Performance With Professional and Consumer Level Displays
 Achieve Accurate Critical Display Performance With Professional and Consumer Level Displays Display Accuracy to Industry Standards Reference quality monitors are able to very accurately reproduce video,
4KScope Software Waveform, Vectorscope, Histogram and Monitor
 4KScope - a 4K/2K/HD/SD Video Measurement Tool View your color bars, test patterns, live camera or telecine signal for device or facility installation, setup, commissioning/certification and other operational
Spearhead Display. How To Guide
 Spearhead Display The Tektronix color tool set has always been about allowing the user to marry the Art & Science irrespective of the color space they are working in. How To Guide How To Guide Figure 1.
Color Reproduction Complex
 Color Reproduction Complex 1 Introduction Transparency 1 Topics of the presentation - the basic terminology in colorimetry and color mixing - the potentials of an extended color space with a laser projector
Package Polychrome. R topics documented: November 20, 2017
 Title Qualitative Palettes with Many Colors Version 1.0.0 Date 2017-11-18 Author Kevin R. Coombes, Guy Brock Package Polychrome November 20, 2017 Tools for creating, viewing, and assessing qualitative
Power saving in LCD panels
 Power saving in LCD panels How to save power while watching TV Hans van Mourik - Philips Consumer Lifestyle May I introduce myself Hans van Mourik Display Specialist Philips Consumer Lifestyle Advanced
ICC Color Symposium. Soft Proofing Revisit and Reborn. Chris Bai Senior Color Expert BenQ. 22/10/2018 Hong Kong. Organizers
 ICC Color Symposium 22/10/2018 Hong Kong Soft Proofing Revisit and Reborn Chris Bai Senior Color Expert BenQ Organizers Overview What is Soft Proofing? What is needed for Soft Proofing? Why monitor is
ADDRESSABLE TV. Unterföhring, April 2018
 ADDRESSABLE TV Unterföhring, April 2018 Agenda 1 I 2 I 3 I 4 I Addressable TV: classification Advertising opportunities Facts & Figures Appendix 2 Digital Revolution on TV 12 mio. devices addressable SwitchIn
Video Signals and Circuits Part 2
 Video Signals and Circuits Part 2 Bill Sheets K2MQJ Rudy Graf KA2CWL In the first part of this article the basic signal structure of a TV signal was discussed, and how a color video signal is structured.
Visual Communication at Limited Colour Display Capability
 Visual Communication at Limited Colour Display Capability Yan Lu, Wen Gao and Feng Wu Abstract: A novel scheme for visual communication by means of mobile devices with limited colour display capability
Color Science Fundamentals in Motion Imaging
 Color Science Fundamentals in Motion Imaging Jaclyn Pytlarz Dolby Laboratories Inc. SMPTE Essential Technology Concepts Series of ten 60- to 90-minute online planned for 2019 Designed to present the fundamental
one M2M Logo Brand Guidelines
 one M2M Logo Brand Guidelines July 2012 Logo Design Explanation What does the one M2M logo symbolize? The number 2 in the middle part of the logo symbolizes the connection between the two machines, the
Preventing Illegal Colors
 Test Equipment Depot - 800.517.8431-99 Washington Street Melrose, MA 02176 - TestEquipmentDepot.com Preventing Illegal Colors Application Note Color gamut compliance is important to ensure faithful reproduction
Objectives. Explain perception Analyze color perception Analyze vision Relate perception with color models
 Color Perception Ayse Kalkan-Savoy NSF GK-12 Fellow Vibes and Waves in Action Center for Advanced Computation and Telecommunications University of Massachusetts Lowell Objectives Explain perception Analyze
The software concept. Try yourself and experience how your processes are significantly simplified. You need. weqube.
 You need. weqube. weqube is the smart camera which combines numerous features on a powerful platform. Thanks to the intelligent, modular software concept weqube adjusts to your situation time and time
High-resolution screens have become a mainstay on modern smartphones. Initial. Displays 3.1 LCD
 3 Displays Figure 3.1. The University of Texas at Austin s Stallion Tiled Display, made up of 75 Dell 3007WPF LCDs with a total resolution of 307 megapixels (38400 8000 pixels) High-resolution screens
Chrominance Subsampling in Digital Images
 Chrominance Subsampling in Digital Images Douglas A. Kerr Issue 2 December 3, 2009 ABSTRACT The JPEG and TIFF digital still image formats, along with various digital video formats, have provision for recording
YOUR ONE STOP SHOP FOR SERVICE & FUNDING IN GERMANY
 YOUR ONE STOP SHOP FOR SERVICE & FUNDING IN GERMANY PRODUCTION SERVICES FROM GERMAN S YOUR ONE STOP SHOP FOR SHOOTING IN GERMANY UNIQUE LOCATIONS The German Film Commissions are pleased to introduce you
A Study on the Psychology of Color Perception In Color Palettes & Color Pickers
 A Study on the Psychology of Color Perception In Color Palettes & Color Pickers S. M. Fazlul Hoque Department of Computer and Systems Sciences The Royal Institute of Technology (KTH) Stockholm, Sweden
Color Reproduction Complex
 Color Reproduction Complex -1 - JENOPTIK LDT GmbH Andreas Deter Dr. Wolfram Biehlig IPS Valencia 2004 Expanded Color Space Basic terms in colorimetry and color mixing User benefit of laser projection with
ILDA Image Data Transfer Format
 ILDA Technical Committee Technical Committee International Laser Display Association www.laserist.org Introduction... 4 ILDA Coordinates... 7 ILDA Color Tables... 9 Color Table Notes... 11 Revision 005.1,
ADDRESSABLE TV. Unterföhring, November 2018
 ADDRESSABLE TV Unterföhring, November 2018 Agenda 1 I 2 I 3 I 4 I Addressable TV: classification Advertising opportunities Facts & Figures Appendix 2 Digital Revolution on TV 12 mio. devices addressable
TECHNICAL SUPPLEMENT FOR THE DELIVERY OF PROGRAMMES WITH HIGH DYNAMIC RANGE
 TECHNICAL SUPPLEMENT FOR THE DELIVERY OF PROGRAMMES WITH HIGH DYNAMIC RANGE Please note: This document is a supplement to the Digital Production Partnership's Technical Delivery Specifications, and should
COLOR AND COLOR SPACES ABSTRACT
 COLOR AND COLOR SPACES Douglas A. Kerr, P.E. November 8, 2005 Issue 8 ABSTRACT Color space refers to a specific system of coordinates that allows us to describe a particular color of light. In this article
CSE Data Visualization. Graphical Perception. Jeffrey Heer University of Washington
 CSE 512 - Data Visualization Graphical Perception Jeffrey Heer University of Washington Design Principles [Mackinlay 86] Expressiveness A set of facts is expressible in a visual language if the sentences
Television and video engineering
 Television and video engineering Unit-4a Colour Television Chapter 1 Introduction to Colour TV We all know how pleasing it is to see a picture in natural colours or watch a colour film in comparison with
INTRODUCTION TO GRAPHICS. Color Vision Simulator Examples
 INTRODUCTION TO GRAPHICS Color Perception Information Color Vision Simulator Examples Information Sheet No. XXXX Vischeck s color vision model allows you to simulate how the world looks to people with
LCD and Plasma display technologies are promising solutions for large-format
 Chapter 4 4. LCD and Plasma Display Characterization 4. Overview LCD and Plasma display technologies are promising solutions for large-format color displays. As these devices become more popular, display
DCI Memorandum Regarding Direct View Displays
 1. Introduction DCI Memorandum Regarding Direct View Displays Approved 27 June 2018 Digital Cinema Initiatives, LLC, Member Representatives Committee Direct view displays provide the potential for an improved
Dan Schuster Arusha Technical College March 4, 2010
 Television Theory Of Operation Dan Schuster Arusha Technical College March 4, 2010 My TV Background 34 years in Automation and Image Electronics MS in Electrical and Computer Engineering Designed Television
The software concept. Try yourself and experience how your processes are significantly simplified. You need. weqube.
 You need. weqube. weqube is the smart camera which combines numerous features on a powerful platform. Thanks to the intelligent, modular software concept weqube adjusts to your situation time and time
Video coding standards
 Video coding standards Video signals represent sequences of images or frames which can be transmitted with a rate from 5 to 60 frames per second (fps), that provides the illusion of motion in the displayed
Pivoting Object Tracking System
 Pivoting Object Tracking System [CSEE 4840 Project Design - March 2009] Damian Ancukiewicz Applied Physics and Applied Mathematics Department da2260@columbia.edu Jinglin Shen Electrical Engineering Department
Primary Colors. Color Palette
 Color Palette Clemson University owns the color orange a great asset for building a powerful brand. But as an institution with diverse needs, Clemson requires a palette of colors as comprehensive as its
A Colorimetric Study of Spatial Uniformity in Projection Displays
 A Colorimetric Study of Spatial Uniformity in Projection Displays Jean-Baptiste Thomas 1,2 and Arne Magnus Bakke 1 1 Gjøvik University College, The Norwegian Color Research Laboratory 2 Université de Bourgogne,
ADDRESSABLE TV. Unterföhring, February 2018
 ADDRESSABLE TV Unterföhring, February 2018 Agenda 1 I 2 I 3 I 4 I Addressable TV: classification Advertising opportunities Facts & Figures Appendix 2 Digital Revolution on TV 11.5 mio. devices addressable
Chapter 27. Inferences for Regression. Remembering Regression. An Example: Body Fat and Waist Size. Remembering Regression (cont.)
") Chapter 27 Inferences for Regression Copyright 2007 Pearson Education, Inc. Publishing as Pearson Addison-Wesley Slide 27-1 Copyright 2007 Pearson Education, Inc. Publishing as Pearson Addison-Wesley An
Chapter 27 Inferences for Regression Copyright 2007 Pearson Education, Inc. Publishing as Pearson Addison-Wesley Slide 27-1 Copyright 2007 Pearson Education, Inc. Publishing as Pearson Addison-Wesley An
Congratulations to the Bureau of Labor Statistics for Creating an Excellent Graph By Jeffrey A. Shaffer 12/16/2011
 Congratulations to the Bureau of Labor Statistics for Creating an Excellent Graph By Jeffrey A. Shaffer 12/16/2011 The Bureau of Labor Statistics (BLS) has published some really bad graphs and maps over
How to use the NATIVE format reader Readmsg.exe
 How to use the NATIVE format reader Readmsg.exe This document describes summarily the way to operate the program Readmsg.exe, which has been created to help users with the inspection of Meteosat Second
Color Spaces in Digital Video
 UCRL-JC-127331 PREPRINT Color Spaces in Digital Video R. Gaunt This paper was prepared for submittal to the Association for Computing Machinery Special Interest Group on Computer Graphics (SIGGRAPH) '97
Chapter 4. Displaying Quantitative Data. Copyright 2007 Pearson Education, Inc. Publishing as Pearson Addison-Wesley
 Chapter 4 Displaying Quantitative Data Copyright 2007 Pearson Education, Inc. Publishing as Pearson Addison-Wesley Dealing With a Lot of Numbers Summarizing the data will help us when we look at large
Math 81 Graphing. Cartesian Coordinate System Plotting Ordered Pairs (x, y) (x is horizontal, y is vertical) center is (0,0) Quadrants:
 (x is horizontal, y is vertical) center is (0,0) Quadrants:") Math 81 Graphing Cartesian Coordinate System Plotting Ordered Pairs (x, y) (x is horizontal, y is vertical) center is (0,0) Ex 1. Plot and indicate which quadrant they re in. A (0,2) B (3, 5) C (-2, -4)
Math 81 Graphing Cartesian Coordinate System Plotting Ordered Pairs (x, y) (x is horizontal, y is vertical) center is (0,0) Ex 1. Plot and indicate which quadrant they re in. A (0,2) B (3, 5) C (-2, -4)
Detecting Medicaid Data Anomalies Using Data Mining Techniques Shenjun Zhu, Qiling Shi, Aran Canes, AdvanceMed Corporation, Nashville, TN
 Paper SDA-04 Detecting Medicaid Data Anomalies Using Data Mining Techniques Shenjun Zhu, Qiling Shi, Aran Canes, AdvanceMed Corporation, Nashville, TN ABSTRACT The purpose of this study is to use statistical
W 9-2: A Versatile, Complete and Compact Series
 suitable sensor can be selected from the W 9- series. Overview of the sensors: WT 9-, with adjustable background suppression, max. scanning distance 0 mm, WT 9-, energetic, max. scanning distance 0 mm,
Overview of Information Presentation Technologies for Visually Impaired and Applications in Broadcasting
 Overview of Information Presentation Technologies for Visually Impaired and Applications in Broadcasting It has been over 60 years since television broadcasting began in Japan. Today, digital broadcasts
The Research of Controlling Loudness in the Timbre Subjective Perception Experiment of Sheng
 The Research of Controlling Loudness in the Timbre Subjective Perception Experiment of Sheng S. Zhu, P. Ji, W. Kuang and J. Yang Institute of Acoustics, CAS, O.21, Bei-Si-huan-Xi Road, 100190 Beijing,
DISPLAY WEEK 2015 REVIEW AND METROLOGY ISSUE
 DISPLAY WEEK 2015 REVIEW AND METROLOGY ISSUE Official Publication of the Society for Information Display www.informationdisplay.org Sept./Oct. 2015 Vol. 31, No. 5 frontline technology Advanced Imaging
The APA Style Converter: A Web-based interface for converting articles to APA style for publication
 Behavior Research Methods 2005, 37 (2), 219-223 The APA Style Converter: A Web-based interface for converting articles to APA style for publication PING LI and KRYSTAL CUNNINGHAM University of Richmond,
ROY G BIV COLOR VISION EXPLORED
 1/13/2017 ROY G BIV COLOR VISION EXPLORED * Learning Objectives: 1. State which three color sensitive receptors are present in the human eye 2. Explain the differences between congenital & acquired color