PROCESSING YOUR EEG DATA
|
|
|
- Anabel Lawson
- 5 years ago
- Views:
Transcription
1 PROCESSING YOUR EEG DATA Step 1: Open your CNT file in neuroscan and mark bad segments using the marking tool (little cube) as mentioned in class. Mark any bad channels using hide skip and bad. Save the file. Step 2: Open Matlab. Change default directory to P:\EEG\Matlab. In the Current Folder window, find S1_EEG_Preprocess.m and double click. It will open in the editor window. Step 3: Run each cell in the script. Place your cursor at the top of the editor window, and then press the little button, or press Ctl Shift Enter to run the cell and advance to the next. Follow any instructions that appear in the popup box. Step 4: Open and run script S2_Identify_ICs_to_remove.m. This runs the ADJUST algorithm to remove ocular and other artifacts. a. For more information on this refer to the ADJUST Tutorial (appended to these instructions) b. Once you have determined which ICs to remove make sure to click the Accept button of the IC component so it changes to say Reject. After it changes hit OK and the window will close and the color above the headmap will change to a pinkish color. Step 5: IMPORTANT!!!! Once you finish using ADJUST to mark bad components (all pink on the component number), and close both windows with the head maps (by clicking OK on those windows), you must type the following in the command window: WriteICsToRemove (Case Sensitive). This last step saves your list of independent components that you selected for removal. You ll see a text file has been created named _ICs2Remove.txt (where is your file name) in the folder where the data are stored. Step 6: Your mission is complete for now. You have an epoched file that has removed bad segments, interpolated bad channels, removed crap at the end, and you have selected the independent components that need to be removed. Next, we ll be conducting re referencing, running the FFT using a Hamming window, and getting the average spectral power by site. This script is awaiting a few tweaks so that you get feedback and instruction as you go. I ll update you when it s read. Await further instructions!
2


3

4 What is ICA? ICA is a "blind source separation" technique. ICA separates sources of activity that are mixed together at recording electrodes.
5 What is ICA? For EEG data Channel data (X) can be thought of as a weighted (W) combination of independent component activations (Wx), each of which has a scalp projection (W -1 ). You can think of ICs as putative sources of the scalp-recorded EEG.
6


7 What is ADJUST? ADJUST= Automatic EEG artifact Detection based on the Joint Use of Spatial and Temporal features Automatic ICA-based algorithm that identifies artifact-related IC components Uses both spatial and temporal distributions Combines stereotyped features to efficiently and systematically reject an artifact Mognon, Jovicich, Bruzzone, & Buiatti, 2010
8 How does it work? EEG is decomposed into ICs (done in EEGlab) ICs defined only by statistical relationships. It knows nothing about where electrodes are Detectors are applied for 4 types of artifacts Computes class-specific spatial and temporal features on all ICs Each feature has a threshold dividing artifacts from non-artifacts For each detector, ICs identified as artifacts if features associated with the artifact exceed their respective threshold. Mognon, Jovicich, Bruzzone, & Buiatti, 2010
9 Features Spatial Average Difference (SAD) Temporal Kurtosis (TK) Maximum Epoch Variance (MEV) Spatial Eye Difference (SED) Generic Discontinuities Spatial Feature (GDSF)
 Kurtosis over the IC time course Kurtosis is \"peakedness\" of the distribution (i.e. distribution of timepoints in the epoch) Looks for outliers in amplitude distribution typical of blinks Mognon, Jovicich, Bruzzone, & Buiatti, 2010")
10 Features Spatial Average Difference (SAD) Spatial topography of blink ICs Looks for higher amplitude in frontal vs. posterior areas Temporal Kurtosis (TK) Kurtosis over the IC time course Kurtosis is "peakedness" of the distribution (i.e. distribution of timepoints in the epoch) Looks for outliers in amplitude distribution typical of blinks Mognon, Jovicich, Bruzzone, & Buiatti, 2010

 Looks for local spatial discontinuities Mognon, Jovicich, Bruzzone, &")
11 Features Maximum Epoch Variance (MEV) Is a ratio of variance in epoch with most variance compared to mean variance over all epochs Looks for slower fluctuations typical of vertical eye movement Spatial Eye Difference (SED) Looks for large amplitudes in frontal areas in antiphase typical of horizontal eye movement Generic Discontinuities Spatial Feature (GDSF) Looks for local spatial discontinuities Mognon, Jovicich, Bruzzone, & Buiatti, 2010
12 Where to begin? Pre-processing Clean file for non-stereotyped gross artifacts AKA Muscle activity and other external factors Variable spatial distribution that could take up a lot of ICs Low-Pass filtering, if appropriate for your data, can remove some artifacts and prevent so many ICs from capturing these higherfrequency noise artifacts ICA From EEGlab or, if not performed already, can be called from ADJUST Run ICA d files with ADJUST Import dataset into EEGLab Tools ADJUST Use script and select file OR
13


14 Component Head Maps # of channels in EEG data = # of components Typically more true components than channels Multiple true components combined into a single ICA component We have 64 components because we had 64 channels ADJUST will highlight in red the components it identified as artifacts


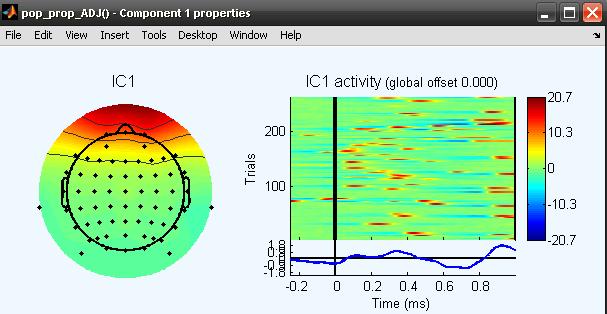
15 Looking at an individual IC Head map IC activity plotted against trial Activity power spectrum Features and thresholds Press to Reject IC


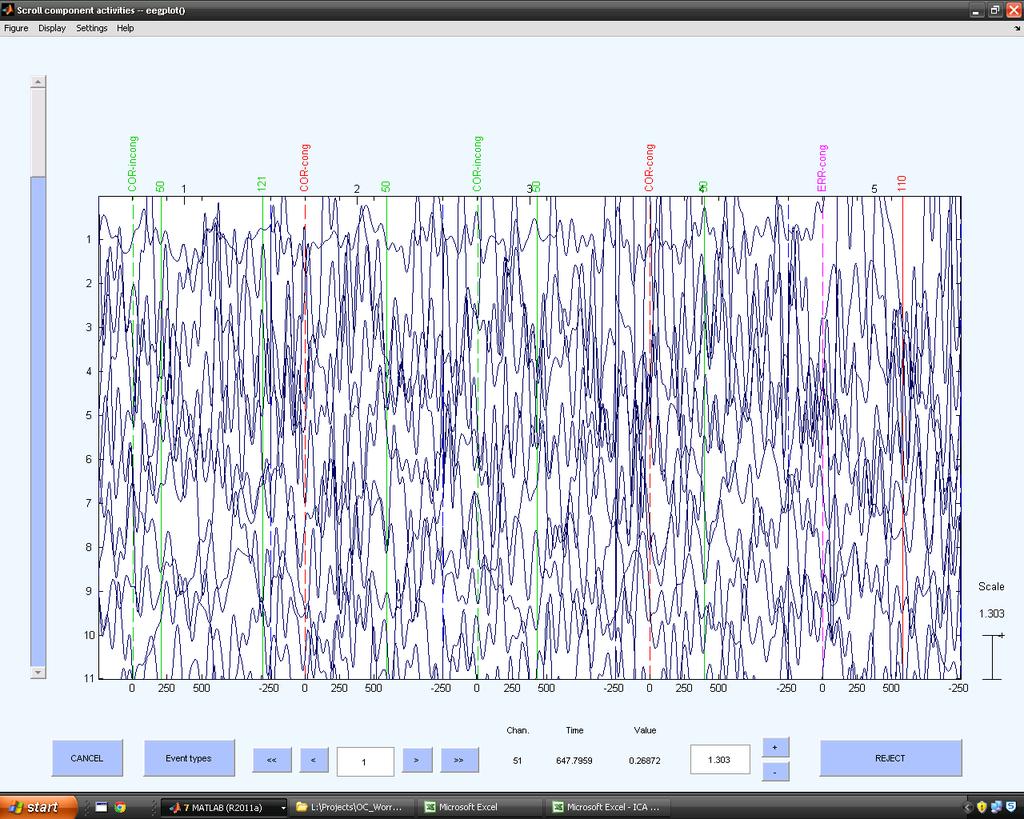
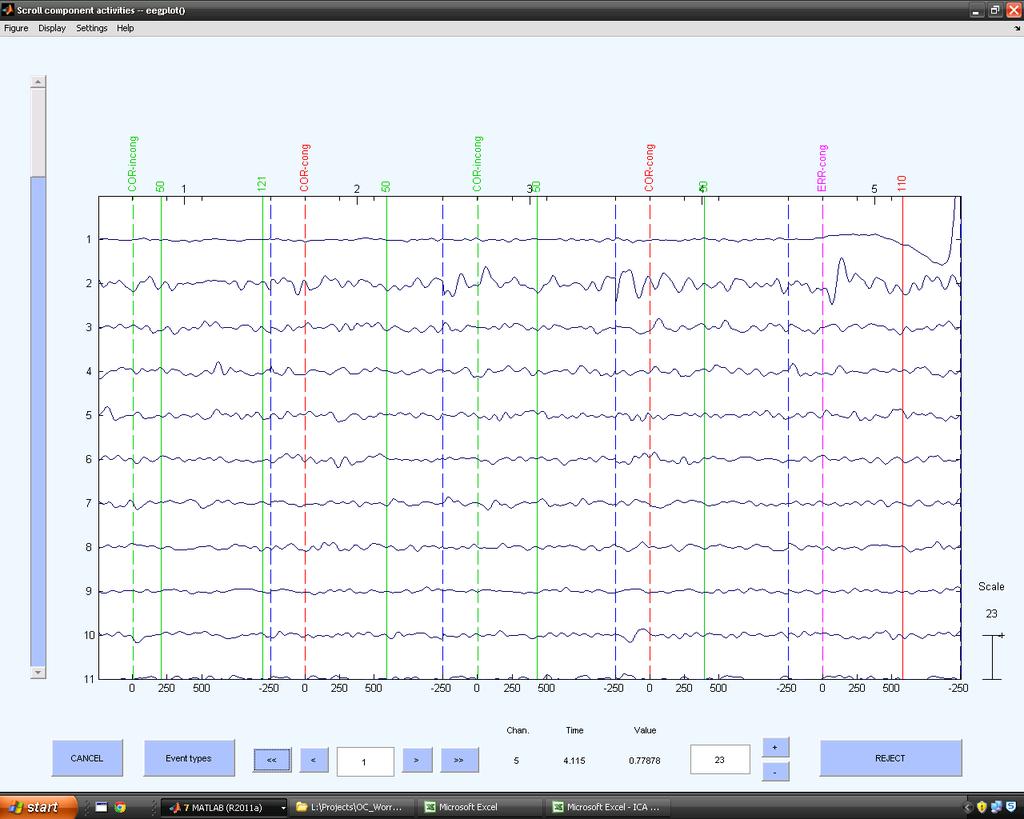
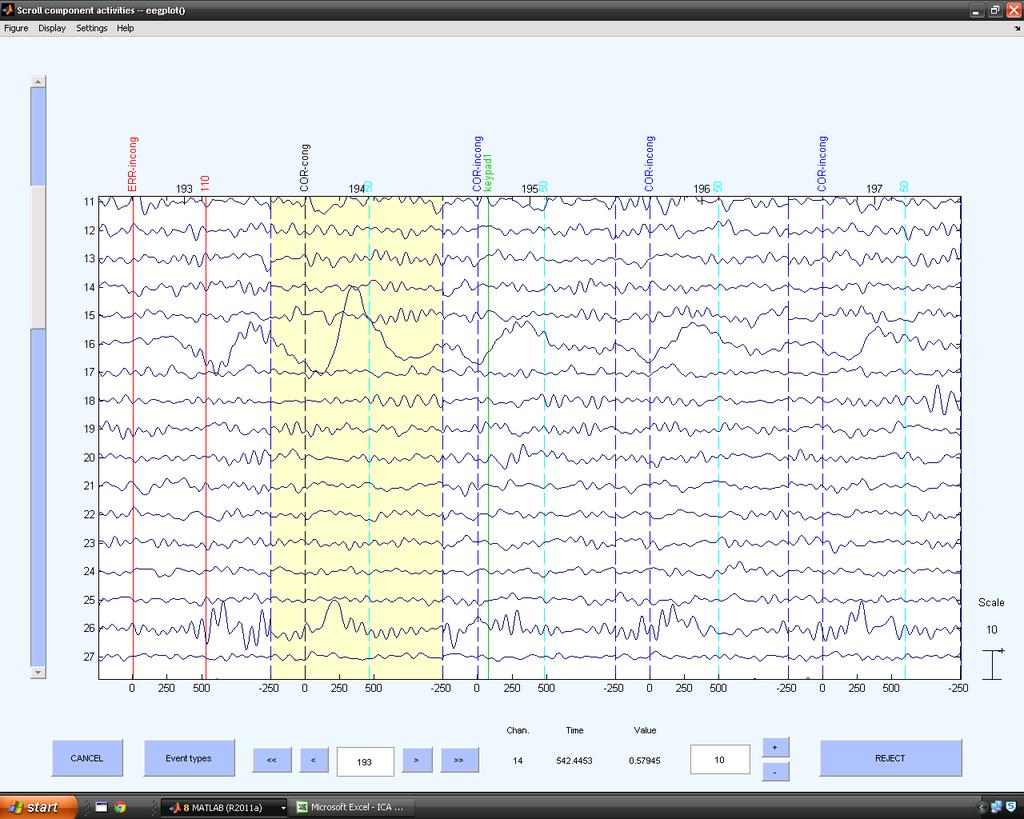
16 Component Data Scroll Shows the activity of 64 components across epochs 10
17
18
 can be")
19 Eye blinks Features used Spatial Average Difference (SAD) Temporal Kurtosis (TK) Frontal distribution High power in delta frequency band In component data scroll high potentials with morphology of eye blink (like in EEG) can be observed


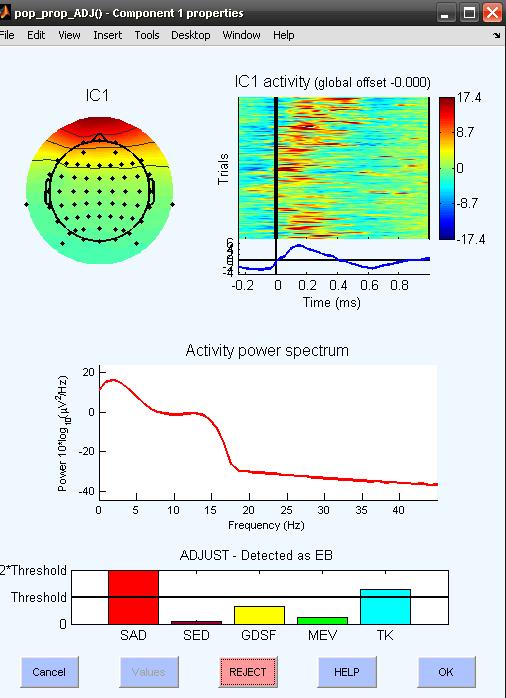

20 All have SAD and TK features over threshold All have a frontal distribution All have higher power in delta band

21 Look at Component Scroll for what IC 1 looks like High potentials with these morphology further suggest the IC component is in fact eye blink related
 Frontal distribution similar to that of an")
22 Vertical Eye Movement Features used Spatial Average Difference (SAD) Maximum Epoch Variance (MEV) Frontal distribution similar to that of an eye blink

23 Frontal distribution It appears that the artifact is mostly driven by what is happening around trial 200 SAD and MEV features are over threshold
24
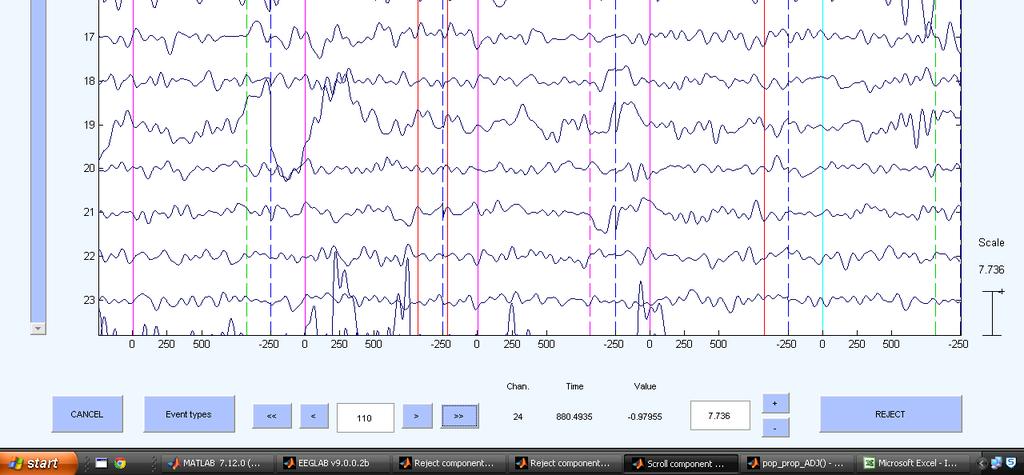
25 Horizontal Eye Movement Features used Spatial Eye Difference (SED) Maximum Epoch Variance (MEV) Frontal distribution in anti-phase (one positive and one negative)

26 Anti-phase, primarily frontal distribution In the IC Activity by trial, three sections stand out SED and MEV features are over threshold


27 Trial Trials

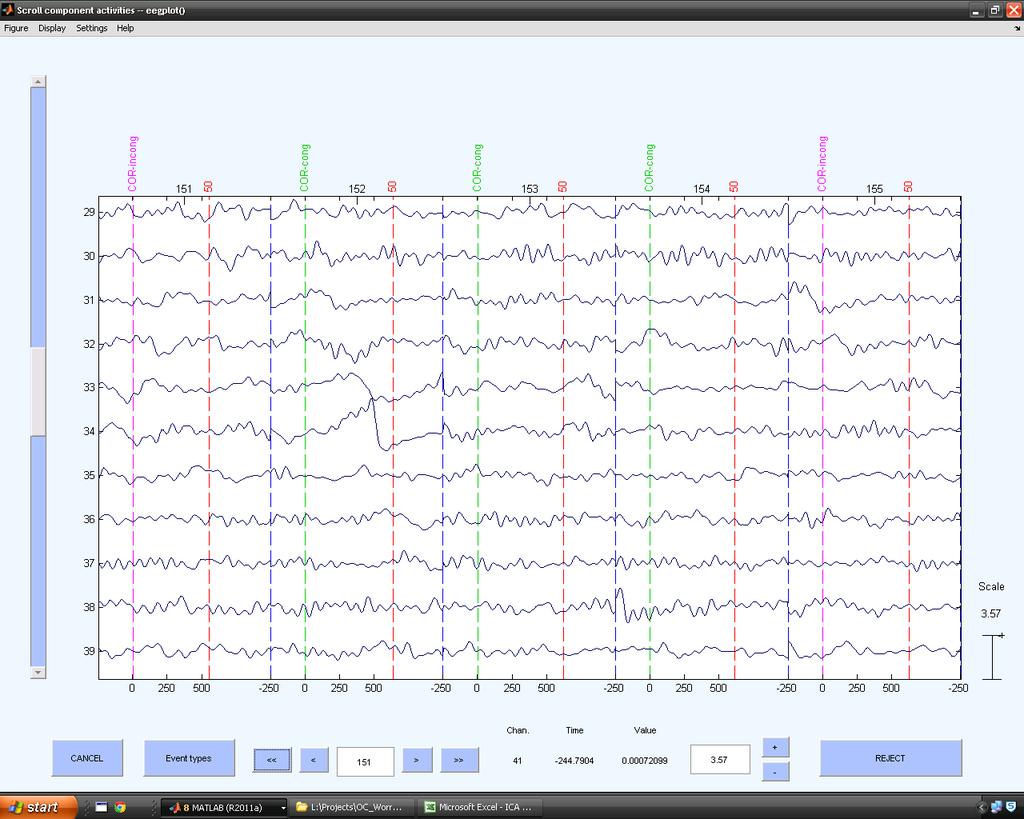
28 Generic Discontinuities Features used Generic Discontinuities Spatial Feature (GDSF) Maximum Epoch Variance (MEV) Variable distribution Sudden amplitude fluctuations with no spatial preference Could be present in as little as one or 2 trials, and limited to 1 channel In component data scroll weird activity in the trial plotted on the IC activity

29 GDSF and MEV features over threshold Variable distribution even at a single channel IC activity shows a lot of variability across epochs and doesn t show one as responsible
30

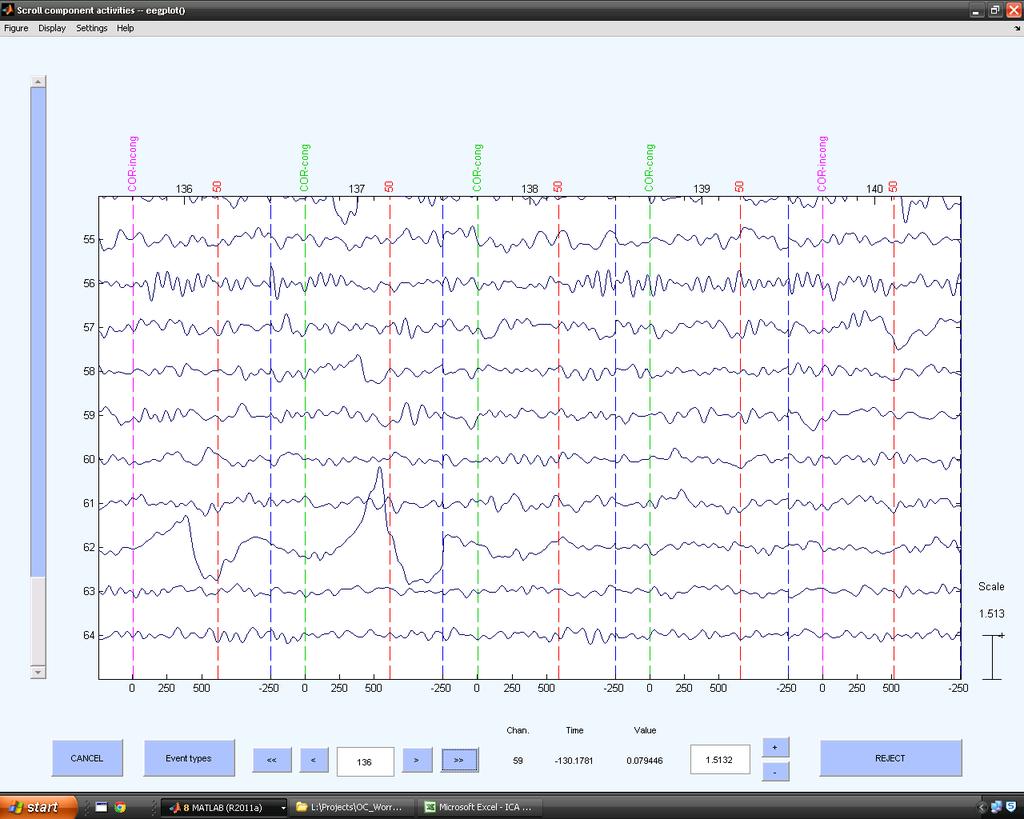
31 GDSF and MEV features over threshold Variable distribution. In this case, present at a single channel In the IC Activity by trial, one section stands out
32
33 So do we reject all of the ICs ADJUST tells us too? If ADJUST has identified a component as bad, we mark it as bad UNLESS there is clear evidence that over-rules that verdict. Additionally, we need to be looking for cases where ADJUST will miss artifacts Specially, lateral eye movements seem to be missed with some frequency in ERP tasks since folks don't make large movements.
Artifact rejection and running ICA
 Artifact rejection and running ICA Task 1 Reject noisy data Task 2 Run ICA Task 3 Plot components Task 4 Remove components (i.e. back-projection) Exercise... Artifact rejection and running ICA Task 1 Reject
DATA! NOW WHAT? Preparing your ERP data for analysis
 DATA! NOW WHAT? Preparing your ERP data for analysis Dennis L. Molfese, Ph.D. Caitlin M. Hudac, B.A. Developmental Brain Lab University of Nebraska-Lincoln 1 Agenda Pre-processing Preparing for analysis
Pre-processing pipeline
 Pre-processing pipeline Collect high-density EEG data (>30 chan) Import into EEGLAB Import event markers and channel locations Re-reference/ down-sample (if necessary) High pass filter (~.5 1 Hz) Examine
Pre-Processing of ERP Data. Peter J. Molfese, Ph.D. Yale University
 Pre-Processing of ERP Data Peter J. Molfese, Ph.D. Yale University Before Statistical Analyses, Pre-Process the ERP data Planning Analyses Waveform Tools Types of Tools Filter Segmentation Visual Review
HBI Database. Version 2 (User Manual)
") HBI Database Version 2 (User Manual) St-Petersburg, Russia 2007 2 1. INTRODUCTION...3 2. RECORDING CONDITIONS...6 2.1. EYE OPENED AND EYE CLOSED CONDITION....6 2.2. VISUAL CONTINUOUS PERFORMANCE TASK...6
HBI Database Version 2 (User Manual) St-Petersburg, Russia 2007 2 1. INTRODUCTION...3 2. RECORDING CONDITIONS...6 2.1. EYE OPENED AND EYE CLOSED CONDITION....6 2.2. VISUAL CONTINUOUS PERFORMANCE TASK...6
THE BERGEN EEG-fMRI TOOLBOX. Gradient fmri Artifatcs Remover Plugin for EEGLAB 1- INTRODUCTION
 THE BERGEN EEG-fMRI TOOLBOX Gradient fmri Artifatcs Remover Plugin for EEGLAB 1- INTRODUCTION This EEG toolbox is developed by researchers from the Bergen fmri Group (Department of Biological and Medical
OSL Preprocessing Henry Luckhoo. Wednesday, 23 October 13
 OSL Preprocessing OHBA s So7ware Library OSL SPM FMRIB fastica Neuromag Netlab Custom Fieldtrip OSL can be used for task and rest analyses preprocessing sensor space analysis source reconstrucaon staasacs
Common Spatial Patterns 3 class BCI V Copyright 2012 g.tec medical engineering GmbH
 g.tec medical engineering GmbH Sierningstrasse 14, A-4521 Schiedlberg Austria - Europe Tel.: (43)-7251-22240-0 Fax: (43)-7251-22240-39 office@gtec.at, http://www.gtec.at Common Spatial Patterns 3 class
BrainMaster tm System Type 2E Module & BMT Software for Windows tm. Display Screens for Master.exe
 BrainMaster tm System Type 2E Module & BMT Software for Windows tm Display Screens for Master.exe 1995-2004 BrainMaster Technologies, Inc., All Rights Reserved BrainMaster and From the Decade of the Brain
qeeg-pro Manual André W. Keizer, PhD October 2014 Version 1.2 Copyright 2014, EEGprofessionals BV, All rights reserved
 qeeg-pro Manual André W. Keizer, PhD October 2014 Version 1.2 Copyright 2014, EEGprofessionals BV, All rights reserved TABLE OF CONTENT 1. Standardized Artifact Rejection Algorithm (S.A.R.A) 3 2. Summary
Common Spatial Patterns 2 class BCI V Copyright 2012 g.tec medical engineering GmbH
 g.tec medical engineering GmbH Sierningstrasse 14, A-4521 Schiedlberg Austria - Europe Tel.: (43)-7251-22240-0 Fax: (43)-7251-22240-39 office@gtec.at, http://www.gtec.at Common Spatial Patterns 2 class
Hybrid Wavelet and EMD/ICA Approach for Artifact Suppression in Pervasive EEG
 Hybrid Wavelet and EMD/ICA Approach for Artifact Suppression in Pervasive EEG Valentina Bono, Saptarshi Das, Wasifa Jamal, Koushik Maharatna Emails: vb2a12@ecs.soton.ac.uk (V. Bono*) sd2a11@ecs.soton.ac.uk,
qeeg-pro Manual André W. Keizer, PhD v1.5 Februari 2018 Version 1.5 Copyright 2018 qeeg-pro BV, All rights reserved
 qeeg-pro Manual André W. Keizer, PhD v1.5 Februari 2018 Version 1.5 Copyright 2018 qeeg-pro BV, All rights reserved TABLE OF CONTENT 1. Indications for use 4 2. Potential adverse effects 4 3. Standardized
MAutoPitch. Presets button. Left arrow button. Right arrow button. Randomize button. Save button. Panic button. Settings button
 MAutoPitch Presets button Presets button shows a window with all available presets. A preset can be loaded from the preset window by double-clicking on it, using the arrow buttons or by using a combination
Appendix D. UW DigiScope User s Manual. Willis J. Tompkins and Annie Foong
 Appendix D UW DigiScope User s Manual Willis J. Tompkins and Annie Foong UW DigiScope is a program that gives the user a range of basic functions typical of a digital oscilloscope. Included are such features
Experiment PP-1: Electroencephalogram (EEG) Activity
 Activity") Experiment PP-1: Electroencephalogram (EEG) Activity Exercise 1: Common EEG Artifacts Aim: To learn how to record an EEG and to become familiar with identifying EEG artifacts, especially those related
Experiment PP-1: Electroencephalogram (EEG) Activity Exercise 1: Common EEG Artifacts Aim: To learn how to record an EEG and to become familiar with identifying EEG artifacts, especially those related
A Matlab toolbox for. Characterisation Of Recorded Underwater Sound (CHORUS) USER S GUIDE
 USER S GUIDE") Centre for Marine Science and Technology A Matlab toolbox for Characterisation Of Recorded Underwater Sound (CHORUS) USER S GUIDE Version 5.0b Prepared for: Centre for Marine Science and Technology Prepared
Centre for Marine Science and Technology A Matlab toolbox for Characterisation Of Recorded Underwater Sound (CHORUS) USER S GUIDE Version 5.0b Prepared for: Centre for Marine Science and Technology Prepared
StaMPS Persistent Scatterer Exercise
 StaMPS Persistent Scatterer Exercise ESA Land Training Course, Bucharest, 14-18 th September, 2015 Andy Hooper, University of Leeds a.hooper@leeds.ac.uk This exercise consists of working through an example
Detection and correction of artefacts in EEG for neurofeedback and BCI applications
 Eindhoven University of Technology MASTER Detection and correction of artefacts in EEG for neurofeedback and BCI applications Erkens, I.J.M. Award date: 22 Disclaimer This document contains a student thesis
Heart Rate Variability Preparing Data for Analysis Using AcqKnowledge
 APPLICATION NOTE 42 Aero Camino, Goleta, CA 93117 Tel (805) 685-0066 Fax (805) 685-0067 info@biopac.com www.biopac.com 01.06.2016 Application Note 233 Heart Rate Variability Preparing Data for Analysis
StaMPS Persistent Scatterer Practical
 StaMPS Persistent Scatterer Practical ESA Land Training Course, Leicester, 10-14 th September, 2018 Andy Hooper, University of Leeds a.hooper@leeds.ac.uk This practical exercise consists of working through
User Guide Slow Cortical Potentials (SCP)
") User Guide Slow Cortical Potentials (SCP) This user guide has been created to educate and inform the reader about the SCP neurofeedback training protocol for the NeXus 10 and NeXus-32 systems with the
User Guide Slow Cortical Potentials (SCP) This user guide has been created to educate and inform the reader about the SCP neurofeedback training protocol for the NeXus 10 and NeXus-32 systems with the
Analysis of AP/axon classes and PSP on the basis of AP amplitude
 Analysis of AP/axon classes and PSP on the basis of AP amplitude In this analysis manual, we aim to measure and analyze AP amplitudes recorded with a suction electrode and synaptic potentials recorded
Yuan Zou, Student Member, IEEE,ViswamNathan, Student Member, IEEE, and Roozbeh Jafari, Senior Member, IEEE
 IEEE JOURNAL OF BIOMEDICAL AND HEALTH INFORMATICS, VOL. 20, NO. 1, JANUARY 2016 73 Automatic Identification of Artifact-Related Independent Components for Artifact Removal in EEG Recordings Yuan Zou, Student
Please feel free to download the Demo application software from analogarts.com to help you follow this seminar.
 Hello, welcome to Analog Arts spectrum analyzer tutorial. Please feel free to download the Demo application software from analogarts.com to help you follow this seminar. For this presentation, we use a
PS User Guide Series Seismic-Data Display
 PS User Guide Series 2015 Seismic-Data Display Prepared By Choon B. Park, Ph.D. January 2015 Table of Contents Page 1. File 2 2. Data 2 2.1 Resample 3 3. Edit 4 3.1 Export Data 4 3.2 Cut/Append Records
Brain-Computer Interface (BCI)
") Brain-Computer Interface (BCI) Christoph Guger, Günter Edlinger, g.tec Guger Technologies OEG Herbersteinstr. 60, 8020 Graz, Austria, guger@gtec.at This tutorial shows HOW-TO find and extract proper signal
Brain-Computer Interface (BCI) Christoph Guger, Günter Edlinger, g.tec Guger Technologies OEG Herbersteinstr. 60, 8020 Graz, Austria, guger@gtec.at This tutorial shows HOW-TO find and extract proper signal
Package icaocularcorrection
 Type Package Package icaocularcorrection February 20, 2015 Title Independent Components Analysis (ICA) based artifact correction. Version 3.0.0 Date 2013-07-12 Depends fastica, mgcv Author Antoine Tremblay,
Thought Technology Ltd Belgrave Avenue, Montreal, QC H4A 2L8 Canada
 Thought Technology Ltd. 2180 Belgrave Avenue, Montreal, QC H4A 2L8 Canada Tel: (800) 361-3651 ٠ (514) 489-8251 Fax: (514) 489-8255 E-mail: _Hmail@thoughttechnology.com Webpage: _Hhttp://www.thoughttechnology.com
BioGraph Infiniti Physiology Suite
 Thought Technology Ltd. 2180 Belgrave Avenue, Montreal, QC H4A 2L8 Canada Tel: (800) 361-3651 ٠ (514) 489-8251 Fax: (514) 489-8255 E-mail: mail@thoughttechnology.com Webpage: http://www.thoughttechnology.com
The EEGer 4.3 Tutorial
 The EEGer 4.3 Tutorial How to Conduct A Neurofeedback Session 1 Introduction 3 1.1 How To Use This Tutorial............................................................................ 3 1.2 What You Should
TechNote: MuraTool CA: 1 2/9/00. Figure 1: High contrast fringe ring mura on a microdisplay
 Mura: The Japanese word for blemish has been widely adopted by the display industry to describe almost all irregular luminosity variation defects in liquid crystal displays. Mura defects are caused by
Getting started with Spike Recorder on PC/Mac/Linux
 Getting started with Spike Recorder on PC/Mac/Linux You can connect your SpikerBox to your computer using either the blue laptop cable, or the green smartphone cable. How do I connect SpikerBox to computer
How to Optimize Ad-Detective
 How to Optimize Ad-Detective Ad-Detective technology is based upon black level detection. There are several important criteria to consider: 1. Does the video have black frames to detect? Are there any
Design of effective algorithm for Removal of Ocular Artifact from Multichannel EEG Signal Using ICA and Wavelet Method
 Snehal Ashok Gaikwad et al, / (IJCSIT) International Journal of Computer Science and Information Technologies, Vol. 7 (3), 216, 1531-1535 Design of effective algorithm for Removal of Ocular Artifact from
TECHNICAL SPECIFICATIONS, VALIDATION, AND RESEARCH USE CONTENTS:
 TECHNICAL SPECIFICATIONS, VALIDATION, AND RESEARCH USE CONTENTS: Introduction to Muse... 2 Technical Specifications... 3 Research Validation... 4 Visualizing and Recording EEG... 6 INTRODUCTION TO MUSE
Linrad On-Screen Controls K1JT
 Linrad On-Screen Controls K1JT Main (Startup) Menu A = Weak signal CW B = Normal CW C = Meteor scatter CW D = SSB E = FM F = AM G = QRSS CW H = TX test I = Soundcard test mode J = Analog hardware tune
MestReNova A quick Guide. Adjust signal intensity Use scroll wheel. Zoomen Z
 MestReNova A quick Guide page 1 MNova is a program to analyze 1D- and 2D NMR data. Start of MNova Start All Programs Chemie NMR MNova The MNova Menu 1. 2. Create expanded regions Adjust signal intensity
Digital Image and Fourier Transform
 Lab 5 Numerical Methods TNCG17 Digital Image and Fourier Transform Sasan Gooran (Autumn 2009) Before starting this lab you are supposed to do the preparation assignments of this lab. All functions and
NanoGiant Oscilloscope/Function-Generator Program. Getting Started
 Getting Started Page 1 of 17 NanoGiant Oscilloscope/Function-Generator Program Getting Started This NanoGiant Oscilloscope program gives you a small impression of the capabilities of the NanoGiant multi-purpose
Spectrum Analyser Basics
 Hands-On Learning Spectrum Analyser Basics Peter D. Hiscocks Syscomp Electronic Design Limited Email: phiscock@ee.ryerson.ca June 28, 2014 Introduction Figure 1: GUI Startup Screen In a previous exercise,
Analyzing and Saving a Signal
 Analyzing and Saving a Signal Approximate Time You can complete this exercise in approximately 45 minutes. Background LabVIEW includes a set of Express VIs that help you analyze signals. This chapter teaches
Environmental Controls Laboratory
 (Electro-Oculography Application) Introduction Spinal cord injury, cerebral palsy, and stroke are some examples of clinical problems which can have a large effect on upper extremity motor control for afflicted
Getting Started with the LabVIEW Sound and Vibration Toolkit
 1 Getting Started with the LabVIEW Sound and Vibration Toolkit This tutorial is designed to introduce you to some of the sound and vibration analysis capabilities in the industry-leading software tool
I. INTRODUCTION. Electronic mail:
 Neural activity associated with distinguishing concurrent auditory objects Claude Alain, a) Benjamin M. Schuler, and Kelly L. McDonald Rotman Research Institute, Baycrest Centre for Geriatric Care, 3560
Automatic LP Digitalization Spring Group 6: Michael Sibley, Alexander Su, Daphne Tsatsoulis {msibley, ahs1,
 Automatic LP Digitalization 18-551 Spring 2011 Group 6: Michael Sibley, Alexander Su, Daphne Tsatsoulis {msibley, ahs1, ptsatsou}@andrew.cmu.edu Introduction This project was originated from our interest
Recap: Representation. Subtle Skeletal Differences. How do skeletons differ? Target Poses. Reference Poses
 Animation by Example Lecture 2: Motion Signal Processing Michael Gleicher University of Wisconsin- Madison www.cs.wisc.edu/~gleicher www.cs.wisc.edu/graphics Recap: Representation Represent human as hierarchical
Object selectivity of local field potentials and spikes in the macaque inferior temporal cortex
 Object selectivity of local field potentials and spikes in the macaque inferior temporal cortex Gabriel Kreiman 1,2,3,4*#, Chou P. Hung 1,2,4*, Alexander Kraskov 5, Rodrigo Quian Quiroga 6, Tomaso Poggio
The Influence of Explicit Markers on Slow Cortical Potentials During Figurative Language Processing
 The Influence of Explicit Markers on Slow Cortical Potentials During Figurative Language Processing Christopher A. Schwint (schw6620@wlu.ca) Department of Psychology, Wilfrid Laurier University 75 University
ECE3296 Digital Image and Video Processing Lab experiment 2 Digital Video Processing using MATLAB
 ECE3296 Digital Image and Video Processing Lab experiment 2 Digital Video Processing using MATLAB Objective i. To learn a simple method of video standards conversion. ii. To calculate and show frame difference
Spectral Decomposition in HRS
 Spectral Decomposition in HRS Kevin Gerlitz This PowerPoint presentation illustrates a method of implementing spectral decomposition within HRS by utilizing the Trace Maths utility. What is Spectral Decomposition?
Topic: Instructional David G. Thomas December 23, 2015
 Procedure to Setup a 3ɸ Linear Motor This is a guide to configure a 3ɸ linear motor using either analog or digital encoder feedback with an Elmo Gold Line drive. Topic: Instructional David G. Thomas December
Department of Electrical & Electronic Engineering Imperial College of Science, Technology and Medicine. Project: Real-Time Speech Enhancement
 Department of Electrical & Electronic Engineering Imperial College of Science, Technology and Medicine Project: Real-Time Speech Enhancement Introduction Telephones are increasingly being used in noisy
Neurite-J 1.1. ImageJ plug-in. User manual. October, 2014
 Neurite-J 1.1 ImageJ plug-in User manual October, 2014 Content 1. About Neurite-J 1.1... 2 2. License... 2 3. Neurite-J installation... 2 4. How to use Neurite-J... 3 4.1 User interface... 3 4.2 Before
PulseCounter Neutron & Gamma Spectrometry Software Manual
 PulseCounter Neutron & Gamma Spectrometry Software Manual MAXIMUS ENERGY CORPORATION Written by Dr. Max I. Fomitchev-Zamilov Web: maximus.energy TABLE OF CONTENTS 0. GENERAL INFORMATION 1. DEFAULT SCREEN
MTurboComp. Overview. How to use the compressor. More advanced features. Edit screen. Easy screen vs. Edit screen
 MTurboComp Overview MTurboComp is an extremely powerful dynamics processor. It has been designed to be versatile, so that it can simulate any compressor out there, primarily the vintage ones of course.
SEM- EDS Instruction Manual
 SEM- EDS Instruction Manual Double-click on the Spirit icon ( ) on the desktop to start the software program. I. X-ray Functions Access the basic X-ray acquisition, display and analysis functions through
Table of Contents Introduction
 Page 1/9 Waveforms 2015 tutorial 3-Jan-18 Table of Contents Introduction Introduction to DAD/NAD and Waveforms 2015... 2 Digital Functions Static I/O... 2 LEDs... 2 Buttons... 2 Switches... 2 Pattern Generator...
Quantitative Evaluation of Artifact Removal in Real Magnetoencephalogram Signals with Blind Source Separation
 Quantitative Evaluation of Artifact Removal in Real Magnetoencephalogram Signals with Blind Source Separation JAVIER ESCUDERO, ' ROBERTO HORNERO, DANIEL ABASÓLO, ' and ALBERTO FERNÁNDEZ ' 'Signal Processing
Processing data with Mestrelab Mnova
 Processing data with Mestrelab Mnova This exercise has three parts: a 1D 1 H spectrum to baseline correct, integrate, peak-pick, and plot; a 2D spectrum to plot with a 1 H spectrum as a projection; and
User Guide. qeeg NeXus-32. This user guide has been created to educate and inform the reader about doing qeeg measurements with the NeXus-32
 User Guide qeeg NeXus-32 This user guide has been created to educate and inform the reader about doing qeeg measurements with the NeXus-32 For more information about NeXus, our BioTrace+ software, please
Template Matching for Artifact Detection and Removal
 RADBOUD UNIVERSITY NIJMEGEN Template Matching for Artifact Detection and Removal by R.Barth supervised by prof. dr. ir. P.Desain and drs. R. Vlek A thesis submitted in partial fulfillment for the degree
Lesson 1 EMG 1 Electromyography: Motor Unit Recruitment
 Physiology Lessons for use with the Biopac Science Lab MP40 Lesson 1 EMG 1 Electromyography: Motor Unit Recruitment PC running Windows XP or Mac OS X 10.3-10.4 Lesson Revision 1.20.2006 BIOPAC Systems,
Torsional vibration analysis in ArtemiS SUITE 1
 02/18 in ArtemiS SUITE 1 Introduction 1 Revolution speed information as a separate analog channel 1 Revolution speed information as a digital pulse channel 2 Proceeding and general notes 3 Application
E X P E R I M E N T 1
 E X P E R I M E N T 1 Getting to Know Data Studio Produced by the Physics Staff at Collin College Copyright Collin College Physics Department. All Rights Reserved. University Physics, Exp 1: Getting to
Browsing News and Talk Video on a Consumer Electronics Platform Using Face Detection
 Browsing News and Talk Video on a Consumer Electronics Platform Using Face Detection Kadir A. Peker, Ajay Divakaran, Tom Lanning Mitsubishi Electric Research Laboratories, Cambridge, MA, USA {peker,ajayd,}@merl.com
Activity P32: Variation of Light Intensity (Light Sensor)
") Activity P32: Variation of Light Intensity (Light Sensor) Concept DataStudio ScienceWorkshop (Mac) ScienceWorkshop (Win) Illuminance P32 Vary Light.DS P54 Light Bulb Intensity P54_BULB.SWS Equipment Needed
Activity P32: Variation of Light Intensity (Light Sensor) Concept DataStudio ScienceWorkshop (Mac) ScienceWorkshop (Win) Illuminance P32 Vary Light.DS P54 Light Bulb Intensity P54_BULB.SWS Equipment Needed
Quantitative Evaluation of Artifact Removal in Real. Separation
 Quantitative Evaluation of Artifact Removal in Real Magnetoencephalogram Signals With Blind Source Separation Javier Escudero,1,2, Roberto Hornero 2, Daniel Abásolo 2,3, and Alberto Fernández 4,5 March
Analysis. mapans MAP ANalysis Single; map viewer, opens and modifies a map file saved by iman.
 Analysis Analysis routines (run on LINUX): iman IMage ANalysis; makes maps out of raw data files saved be the acquisition program (ContImage), can make movies, pictures of green, compresses and decompresses
Agilent ESA Series Spectrum Analyzers
 Agilent ESA Series Spectrum Analyzers Demonstration Guide and Application Note This demo guide is a tool to gain familiarity with the basic functions and features of the Agilent Technologies ESA-L series
Automatic removal of eye movement and blink artifacts from EEG data using blind component separation
 Psychophysiology, 41 (2004), 313 325. Blackwell Publishing Inc. Printed in the USA. Copyright r 2003 Society for Psychophysiological Research DOI: 10.1046/j.1469-8986.2003.00141.x Automatic removal of
Preparation of the participant. EOG, ECG, HPI coils : what, why and how
 Preparation of the participant EOG, ECG, HPI coils : what, why and how 1 Introduction In this module you will learn why EEG, ECG and HPI coils are important and how to attach them to the participant. The
Standard Operating Procedure of nanoir2-s
 Standard Operating Procedure of nanoir2-s The Anasys nanoir2 system is the AFM-based nanoscale infrared (IR) spectrometer, which has a patented technique based on photothermal induced resonance (PTIR),
Advanced IC analysis
 Advanced IC analysis Task 1 Search EEG.event structure Task 2 Use newtimef() to compare conditions Task 3 Plot a RT-sorted component ERP image Plot a type-sorted component ERP image Plot a load-sorted
An Introduction to the Spectral Dynamics Rotating Machinery Analysis (RMA) package For PUMA and COUGAR
 package For PUMA and COUGAR") An Introduction to the Spectral Dynamics Rotating Machinery Analysis (RMA) package For PUMA and COUGAR Introduction: The RMA package is a PC-based system which operates with PUMA and COUGAR hardware to
An Introduction to the Spectral Dynamics Rotating Machinery Analysis (RMA) package For PUMA and COUGAR Introduction: The RMA package is a PC-based system which operates with PUMA and COUGAR hardware to
MDynamicsMB. Overview. Easy screen vs. Edit screen
 MDynamicsMB Overview MDynamicsMB is an advanced multiband dynamic processor with clear sound designed for mastering, however its high performance and zero latency, makes it ideal for any task. It features
Meeting Embedded Design Challenges with Mixed Signal Oscilloscopes
 Meeting Embedded Design Challenges with Mixed Signal Oscilloscopes Introduction Embedded design and especially design work utilizing low speed serial signaling is one of the fastest growing areas of digital
#PS168 - Analysis of Intraventricular Pressure Wave Data (LVP Analysis)
") BIOPAC Systems, Inc. 42 Aero Camino Goleta, Ca 93117 Ph (805)685-0066 Fax (805)685-0067 www.biopac.com info@biopac.com #PS168 - Analysis of Intraventricular Pressure Wave Data (LVP Analysis) The Biopac
BIOPAC Systems, Inc. 42 Aero Camino Goleta, Ca 93117 Ph (805)685-0066 Fax (805)685-0067 www.biopac.com info@biopac.com #PS168 - Analysis of Intraventricular Pressure Wave Data (LVP Analysis) The Biopac
EEG Eye-Blinking Artefacts Power Spectrum Analysis
 EEG Eye-Blinking Artefacts Power Spectrum Analysis Plamen Manoilov Abstract: Artefacts are noises introduced to the electroencephalogram s (EEG) signal by not central nervous system (CNS) sources of electric
HX0074 DEMO Kit for METRIX Oscilloscopes
 GB - User s Guide HX0074 DEMO Kit for METRIX Oscilloscopes DIGITAL OSCILLOSCOPES 1 HX0074 Demo Kit for METRIX Oscilloscopes General description The oscilloscope kit features a circuit which generates 15
NENS 230 Assignment #2 Data Import, Manipulation, and Basic Plotting
 NENS 230 Assignment #2 Data Import, Manipulation, and Basic Plotting Compound Action Potential Due: Tuesday, October 6th, 2015 Goals Become comfortable reading data into Matlab from several common formats
Pre-processing of revolution speed data in ArtemiS SUITE 1
 03/18 in ArtemiS SUITE 1 Introduction 1 TTL logic 2 Sources of error in pulse data acquisition 3 Processing of trigger signals 5 Revolution speed acquisition with complex pulse patterns 7 Introduction
Introduction to GRIP. The GRIP user interface consists of 4 parts:
 Introduction to GRIP GRIP is a tool for developing computer vision algorithms interactively rather than through trial and error coding. After developing your algorithm you may run GRIP in headless mode
ME EN 363 ELEMENTARY INSTRUMENTATION Lab: Basic Lab Instruments and Data Acquisition
 ME EN 363 ELEMENTARY INSTRUMENTATION Lab: Basic Lab Instruments and Data Acquisition INTRODUCTION Many sensors produce continuous voltage signals. In this lab, you will learn about some common methods
Getting Started. Connect green audio output of SpikerBox/SpikerShield using green cable to your headphones input on iphone/ipad.
 Getting Started First thing you should do is to connect your iphone or ipad to SpikerBox with a green smartphone cable. Green cable comes with designators on each end of the cable ( Smartphone and SpikerBox
SedLine Sedation Monitor
 SedLine Sedation Monitor Quick Reference Guide Not intended to replace the Operator s Manual. See the SedLine Sedation Monitor Operator s Manual for complete instructions, including warnings, indications
Using DICTION. Some Basics. Importing Files. Analyzing Texts
 Some Basics 1. DICTION organizes its work units by Projects. Each Project contains three folders: Project Dictionaries, Input, and Output. 2. DICTION has three distinct windows: the Project Explorer window
Guide to Analysing Full Spectrum/Frequency Division Bat Calls with Audacity (v.2.0.5) by Thomas Foxley
 by Thomas Foxley") Guide to Analysing Full Spectrum/Frequency Division Bat Calls with Audacity (v.2.0.5) by Thomas Foxley Contents Getting Started Setting Up the Sound File Noise Removal Finding All the Bat Calls Call Analysis
Guide to Analysing Full Spectrum/Frequency Division Bat Calls with Audacity (v.2.0.5) by Thomas Foxley Contents Getting Started Setting Up the Sound File Noise Removal Finding All the Bat Calls Call Analysis
SpectraPlotterMap 12 User Guide
 SpectraPlotterMap 12 User Guide 108.01.1609.UG Sep 14, 2016 SpectraPlotterMap version 12, included in Radial Suite Release 8, displays two and three dimensional plots of power spectra generated by the
Advanced Techniques for Spurious Measurements with R&S FSW-K50 White Paper
 Advanced Techniques for Spurious Measurements with R&S FSW-K50 White Paper Products: ı ı R&S FSW R&S FSW-K50 Spurious emission search with spectrum analyzers is one of the most demanding measurements in
MindMouse. This project is written in C++ and uses the following Libraries: LibSvm, kissfft, BOOST File System, and Emotiv Research Edition SDK.
 Andrew Robbins MindMouse Project Description: MindMouse is an application that interfaces the user s mind with the computer s mouse functionality. The hardware that is required for MindMouse is the Emotiv
Artifact Removal in Magnetoencephalogram Background Activity with Independent Component Analysis
 PAPER IDENTIFICATION NUMBER: TBME-0034-006 1 Artifact Removal in Magnetoencephalogram Background Activity with Independent Component Analysis Javier Escudero*, Student Member, IEEE, Roberto Hornero, Member,
Problem 5 Example Solutions
 Problem 5 Example Solutions This document provides pictures of a working Tynker program for both game options described. Keep in mind that these are example solutions. Problems can be solved computationally
User Manual OVP Raman
 Version 6 User Manual OVP Raman 2006 BRUKER OPTIK GmbH, Rudolf-Plank-Straße 27, D-76275 Ettlingen, www.brukeroptics.com All rights reserved. No part of this manual may be reproduced or transmitted in any
BitWise (V2.1 and later) includes features for determining AP240 settings and measuring the Single Ion Area.
 includes features for determining AP240 settings and measuring the Single Ion Area.") BitWise. Instructions for New Features in ToF-AMS DAQ V2.1 Prepared by Joel Kimmel University of Colorado at Boulder & Aerodyne Research Inc. Last Revised 15-Jun-07 BitWise (V2.1 and later) includes features
BitWise. Instructions for New Features in ToF-AMS DAQ V2.1 Prepared by Joel Kimmel University of Colorado at Boulder & Aerodyne Research Inc. Last Revised 15-Jun-07 BitWise (V2.1 and later) includes features
Channel calculation with a Calculation Project
 03/17 Using channel calculation The Calculation Project allows you to perform not only statistical evaluations, but also channel-related operations, such as automated post-processing of analysis results.
Semantic priming modulates the N400, N300, and N400RP
 Clinical Neurophysiology 118 (2007) 1053 1068 www.elsevier.com/locate/clinph Semantic priming modulates the N400, N300, and N400RP Michael S. Franklin a,b, *, Joseph Dien a,c, James H. Neely d, Elizabeth
The Measurement Tools and What They Do
 2 The Measurement Tools The Measurement Tools and What They Do JITTERWIZARD The JitterWizard is a unique capability of the JitterPro package that performs the requisite scope setup chores while simplifying
MAutoDynamicEq. Now, how is the level measured? Overview. The Band Settings
 MAutoDynamicEq Overview Dynamics processors, such as compressors and expanders, dynamically manipulate the overall level of the audio material. Equalizers change the spectral character of the audio, statically.
Supplemental Material for Gamma-band Synchronization in the Macaque Hippocampus and Memory Formation
 Supplemental Material for Gamma-band Synchronization in the Macaque Hippocampus and Memory Formation Michael J. Jutras, Pascal Fries, Elizabeth A. Buffalo * *To whom correspondence should be addressed.