Extraction Methods of Watermarks from Linearly-Distorted Images to Maximize Signal-to-Noise Ratio. Brandon Migdal. Advisors: Carl Salvaggio
|
|
|
- Gerard Kennedy
- 5 years ago
- Views:
Transcription
1 Extraction Methods of Watermarks from Linearly-Distorted Images to Maximize Signal-to-Noise Ratio By Brandon Migdal Advisors: Carl Salvaggio Chris Honsinger A senior project submitted in partial fulfillment of the requirements for the degree of Bachelor of Science in the Chester F. Carlson Center for Imaging Science of the College of Science at the Rochester Institute of Technology April 29 th 2004
2 1.0 Abstract This project succeeded in evaluating two methods for the extraction of watermarks from linearly distorted images. The evaluation was in terms of the signal-tonoise ratio of the extracted message. The evaluated methods were those of windowing and subsetting. Two windowing methods were evaluated, Hanning and Hamming windows. Two subsetting cases were also evaluated they were 4 subset and 16 subset cases. The project shows that as the linear distortion increases significant gains in the signal-to-noise ratio are made with the windowed extractions. This project shows that the process of subsetting produces only marginal increases in the signal-to-noise ratio. 2.0 Background 2.1 Algorithm Background The Eastman Kodak watermarking algorithm is a method that uses phase dispersion to accomplish the goal of data embedding. The data embedding process is performed and a message containing up to 64-bits can be embedded into the image.(rabbani, 2000). The first item that is needed for the embedding process is a random phase carrier. This random phase carrier is a 128 x 128 pixel array consisting of random Fourier phase values and uniform magnitude in the frequency domain. The transformation of this information back into the spatial domain yields an image with floating point values.
3 Despite the stated randomness of the carrier there are certain considerations that must be made that directly affects the robustness, visual transparency, and the quality of extracted information of the watermark. To increase the visual transparency of the watermark, most of the information in the carrier should be focused at the higher frequencies. Since the human visual system is not as sensitive to these higher frequencies, the watermark will be less visible. To increase the quality of the extracted information, measures must be taken to insure that the carrier will be resistant to attacks. Putting the bulk of the information at high frequency is problematic since the watermark becomes vulnerable to attacks such as low-pass filtering which, if not accounted for, could destroy the watermark. All of these considerations were taken into account by Eastman Kodak when developing the carrier. The phase for the random carrier is created using a pseudo-random number generator with a specified key. The key to the random number generator is specified by the user. The amplitude of the coefficient of frequency is set to zero, and then the amplitude of the coefficient of frequency increased. Scaling the frequency coefficients of the carrier makes the carrier more robust to attacks, the scaling of frequency coefficients then also serves to increase the quality of extracted watermarks. The increase of the amplitude of the coefficient of frequency is continued until the value reaches 20% of Nyquist (Nyquist is defined to be the highest frequency at which a signal can contain energy and remain compatible with the Sampling Theorem.). When the frequencies are greater than 20% of Nyquist those frequencies are generated from the Contrast Sensitivity Functions (CSF). The CSF is a set of functions based on observations made by observers under various conditions that relate how they perceive contrast at a given spatial frequency. The principle of CSF works by allowing a set of viewing conditions to be
4 chosen and then applying statistics to determine the observer s given likeliness to see a frequency. By doing this it allows the message artifacts to be kept just below the perceptible limits of most observers. By properly designing this carrier it allows for the information that is embedded to achieve the goals that were laid out above, to increase robustness, increase visual transparency, and increase the quality of extracted data. Figure 1 shows an example of the carrier in the spatial domain. The image in the frequency domain appears similar to this representation, however the values in the frequency domain span a scale from -1 to +1. As was described above the carrier contains random values. The image of the carrier is a floating point image with digital counts ranging from -400 to +400 (carrier values are directly affected by the key to the random phase generation and as such will change with the key) and the image has merely been scaled for display. Figure 1: Random Phase Carrier (Scaled for Display) The next component to the embedding process is the message template. The message template is a 128 x 128 pixel array that contains 64 locations for embedding
5 binary information. This means that there are 64 places in the array to put a 1 or 0 which will be the message that is later extracted. There are a large number of designs for this message template. Basically any 128 x 128 array consisting of the digital count 0 in every pixel, except for 64 unique locations that are used for embedding. However, there are considerations that must be taken into account when designing the message template. The first consideration in making a message template is that it should maximize the quality of the watermark extracted. To achieve this maximization it is necessary to place the 64 unique locations as far apart from each other as possible. What is gained by increasing this distance is prevention of interference between points during the extraction process. The second consideration that is taken into effect when designing a message template is that the watermark should be robust against attack. The two most common attacks are cropping and rotation, so it would be ideal to have a message template that can be removed from an image after that image has been cropped, rotated, or even both. By selecting a message template with unique and well placed embedding locations these attacks can be negated by cyclically shifting the message template during the extraction process. The data locations are important in the shifting because one wants to make certain that they are correlating the correct point. Figure 2 shows three possible designs for message templates. The template in Figure 2(a) would not be optimal since the data locations are too close together and the information might overlap upon extraction. The point overlap in extraction would be a result of ringing that occurs in the frequency domain when performing the cyclic correlation. Though the template in Figure 2(b) maximizes the distance between points it is not optimal. Since when using this template on a shifted or cropped image it becomes impossible to be certain that the correct point is
, which shows how the cyclic nature of the shifts would cause false positives.")
 for an example of the cyclic shift.) The message template 2(c) was chosen to be the used template even though it contains 74 bits instead of 64.")

6 being extracted (due to overlap). The aforementioned false positives results in extraction that occur when using the template from Figure 2(b) are the result of the cyclic correlation. (See Figure 4(a), which shows how the cyclic nature of the shifts would cause false positives.) The template in Figure 2(c) is the optimal template as it has an increased distance between data locations, and insures that a cyclically shifted version of it will not overlap the wrong points for extraction. (See Figure 4(b) for an example of the cyclic shift.) The message template 2(c) was chosen to be the used template even though it contains 74 bits instead of 64. Figure 2: Three Possible Message Templates for Data Embedding (a) (b) (c) With the carrier and message templates correctly designed the watermark is ready to be embedded in the image. This process is fundamentally simple compared to the above processes of creating the message template and carrier. The embedding process begins with the determination of the message that is to be embedded. That binary message of 1s and 0s is turned into a message of +1s and -1s respectively. This
 The message template with the information embedded in it is then convolved with the carrier signal to produce the watermark that")
7 information is embedded at the locations given in the message template. Once the data is embedded in the message template it will appear as shown in Figure 3. Figure 3: Embedded Message in Message Template (Scaled for Display) The message template with the information embedded in it is then convolved with the carrier signal to produce the watermark that will be embedded in the image. This convolution, however, is different from a typical convolution in that it is a cyclical convolution. The cyclic convolution involves a wrapping the edge information back onto the image for the convolution instead of truncating that edge information when edges are reached. Figure 4 shows three examples of the cyclical shift that is taking place, the same trend that occurs in the vertical sense that is shown in the horizontally below. The cyclic convolution of the carrier and the message template produces another 128 x 128 pixel array with floating point values. This convolution can be done in the spatial domain as a convolution, or the convolution can be done in the frequency domain as a multiplication. The array that is produced is the watermark, and is going to be added to each 128 x 128


8 block of the image in the spatial domain. However, before the watermark can be added to the image the strength of the watermark must be scaled so that the digital count values will not wash out the image information. The factor by which the watermark digital count values are scaled directly controls the visual transparency and the robustness of the watermark. The scaled watermark digital count values can then be added to the image. Figure 5 shows the original image and the same image with the watermark information embedded. Figure 4: Cyclically Shifted Versions of Template 4(b) (a), Template 4(c) (b) and Lena (c) (A) (B) (C)


9 Figure 5: Original (A) and Embedded (B) Images (A) (B) (A) (B) With the embedding process complete, the last step to discuss is the extraction process. The extraction process is a three-level process. The first level of the process involves breaking the image up into 128 x 128 blocks. The second level of the process involves determining the amount of image information in each of the 128 x 128 image blocks. The third level is based on the signal-to-noise ratio of the image blocks. All of the image blocks are added together using the information from level two to weight each block based on the amount of image information in it. The more non-uniform information
10 that is contained in the image block the less weight that that block will hold. The weight of the individual blocks becomes important since there is an average taken of all the blocks. The benefit of computing this average is that it should eliminate the image information (the law of large numbers dictates that each pixel in this 128 x 128 block should have the same average digital count) and keep only the watermark information. This averaging process serves also to strengthen the watermark, this is due to the consistent location of the embedded messages that add during the averaging process. The watermark information can then be extracted via two methods, one in the spatial domain, and the other in the frequency domain. The spatial domain extraction is done by correlating the original carrier with the average block. The correlation that is done is similar to the convolution in that they are both cyclical. The reason for the cyclic correlation is that it will account for cropping and rotation, as well as any possible shifting. The reason that these attacks can be corrected for is that the templates were properly designed to eliminate false positives in the cyclic correlation. The process of cyclically correlating the carrier with the image will return the cropped, shifted or rotated message template. The correlation should leave the message template with noise introduced. The message is then extracted by isolating data locations where information exists. The process for isolating the data locations is done by finding peak values that are greater than some number X standard deviations from the mean. The process for spatially extracting watermark was not used due to its costly nature (computational time). The process used was the frequency domain method. The advantage to extracting in the frequency domain is that the number of calculations that are needed is greatly reduced. In the frequency domain extraction method a cross correlation is preformed between the
11 image block and the carrier in the frequency domain. The cross correlation that is used to produce the correlation image is described in Equation 1. Message i( φi ( u, v) φc ( u, v)) = I( u, v) C( u, v) e (1) In the above equation I is used to represent the image, and C is used to represent the carrier. The resultant image is then back transformed through the fast Fourier transform (FFT) into the spatial domain for processing. The process for back transforming the image is the same as above. Values are isolated that are above a number X standard deviations, and those are message locations. The message locations are then padded by a number of pixels in each direction to make certain that all of the signal information is gathered. The remaining values are all determined to be noise. 3.0 Project Methods 3.1 Goals The initial goal of the research was to determine a method for extracting the embedded watermark information from Stirmark random-bend attacked images. The goal of the research has changed and progressed over time away from the extraction from random bend to extraction methods from linearly distorted images. The focus became to find the optimal method that maximizes the signal-to-noise ratio of the extraction. 3.2 Approach
12 The beginning of the research was done to create an understanding of the Eastman Kodak watermarking algorithm. In order to develop this understanding a significant amount of time was invested into developing code. The code preformed the same functions as the Eastman Kodak algorithm. The code was able to embed a watermark into an image, and extract that message out of the image. The code was written to perform these functions as described above in the spatial domain. There were glitches encountered with the extraction process of the algorithm, which ultimately was due to the fact it only preformed a level 1 extraction. The lack of extraction levels was due to the lack of knowledge as to their existence. This recreation of the algorithm, although taking a significant period of time, resulted in a much deeper understanding of the overall process. One time consuming snag that developed during this process, other than the lack of information about the other levels of extraction, was a lack of information about message location extraction order. Knowing the binary message that should have been extracted from the image, the actual extracted message did not match. Upon closer examination, however, the message templates that were extracted did match. Therefore it became evident that there was a pattern in the order that the binary information was read out from the message template. This piece of information was not defined in the publication describing the Eastman Kodak algorithm. After a period it was determined that the extraction of the binary message was not crucial to the success of the research, and thus was abandoned. From the implementation of the Eastman Kodak algorithm in the spatial domain, it became quickly evident that the process must be implemented in the frequency domain.
13 This need developed due to the long amount of time that the cyclical convolutions and correlations took to run in the spatial domain. With each pixel shift in the spatial domain the carrier array had to be re-calculated. This convolution and correlation that required thousands of calculations in the spatial domain could be calculated with one step in the frequency domain. Therefore using the fast Fourier transform (FFT) the carrier and image information were brought into the frequency domain to perform calculations in a fraction of the time. In the case of simple embedding and extraction that was developed to mimic the Eastman Kodak algorithm the frequency domain calculation were orders of magnitude quicker than those preformed in the spatial domain. The images supplied at the beginning of the research were those of multilayer TIFF images. These images considered of three channels. A problem arose with the determination of whether the extraction would have to be run on each of the three channels and then reassembled, or if one channel would be sufficient. The determination of this process was made by examining the information that was contained in each channel. Upon close investigation it was found that each of the three channels contained the same information and the channels were layered presumably to create the TIFF image. Later in the research these, TIFF images were replaced and interchanged with Bitmap images, and the results held as to the channel information When the project began, the goal of the research was to determine a way to locally extract the embedded watermark information from a random-bend attacked image. The random-bend attacked image is a product of a watermarking algorithm benchmark program called Stirmark. The Stirmark program produces this random-bend
 and Original Grid Image (B) (A) (B) The Stirmark produced images above contain small random distortions.")

14 attack by randomly distorting the locations of pixels in the image. An example of the random-bend attack can be seen below in Figure 6. Figure 6: Stirmark Random Bend Attacked Image (A) and Original Grid Image (B) (A) (B) The Stirmark produced images above contain small random distortions. Problems arose in the research when the Stirmark code used to create additional random-bend attacked images yielded only severe distortions. These distortions made the extraction of the embedded information far too difficult for the scope of this project. The support could not be found to sufficiently understand the Stirmark program to alter the overall distortion to a level that would be conducive to the extraction of valid results. This lead to the change from extraction from random-bend attacked images to linearly-distorted images. When the project began, the goal was to extract an image that contained a 64-bit message. At some point during the course of the research, a carrier image was lost therefore making the initial watermarked image set useless. This initial set was replaced


15 by a new set; however, the new set contained only a 24-bit message. The bit information was not the only thing that changed. By changing the number of the bits in the message it in fact changed the pattern of message locations. This new message also contained the message at a higher frequency so that it would be easier to extract. This change in the message locations required changes to be made to the early algorithm, although message location is no longer important in the code. The decision was made to abandon the extraction from random-bend attacked images. The decision was made to work on linearly-distorted images. The linearlydistorted images were created using a program that was developed by Chris Honsinger. The program allowed the user to input X and Y values that created a vector to perform the linear distortion. An extreme case of a linearly distorted image can be seen below in Figure 7. The extreme case is show to demonstrate the distortion that is used, however, distortions not as severe were used in this study. Figure 7: Linearly Distorted (A) and Original (B) Grids (A) (B)
16 As it can be seen in the above images the distortion originates from the upper left corner (origin) of the image. This distortion then gradually increases as a function of the vector such that the distortion in the middle of the image is fundamentally zero. The distortion then continues to the edge, and reaches its full size. While developing these distorted images, the algorithm had to be tested to determine maximum range of distortion from which a viable message could be extracted. The process that was used to determine this range was merely to find a limiting case. The way to determine this limiting case was to attempt extractions from images of varying linearly distorted images. The way the limiting occurred was to look at the correlation images and determine whether peaks could be isolated from the noise. After running a number of distorted images through the algorithm, the limiting case was determined. The limiting case was determined as the linear distortion vector of 10 units in the X, and 10 units in the Y direction. With the limiting case determined, it set out a range of distortion values over which the windowing and subsetting techniques could be tested. Once the range of the distortion was determined, a task was suggested to determine if the distortion amount could be determined from an extracted message. The method by which this problem was initially approached was to look at the extraction from an average image block. This approach would show the maximum distortion value in the image, however, since the distortion was not constant throughout the entire image the data that was determined became useless. The next approach to this problem, that was suggested, was to create a series of distortion vectors. One vector in each image block would show the localized distortion in each block. At the time this task was initially attempted a solution could not be found that would accurately and effectively estimate
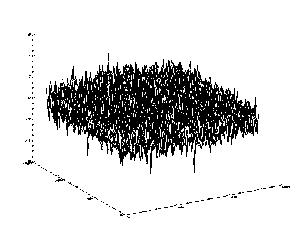
17 the distortion on a localized level. The approach taken was to generate the correlation image for the distorted-image block, and then to correlate the message location template to the correlation image. In order to generate a vector map, this correlation would have to be done in the spatial domain using a cyclical correlation. The cyclical correlation that was used required an enormous amount of computational time to run. The results of the correlation did not provide the desired distortion vectors. Furthermore, even if the distortion vectors had been generated, the result had no apparent application at the time. As discussed below, in the future work area, there may be a way to subset, and estimate the distortion locally that could be of significant benefit to implement. There were two types of windows that were chosen to be used to window the carrier for extraction. The windows that were used were the Hanning and Hamming windows. Below in Figure 8(A) and 8(B) the Hanning and Hamming windows can be seen respectively. Figure 8: Hanning (A) and Hamming (B) Windows (A) (B)


18 The Hanning and Hamming windows are functions that are applied to the carrier image in the frequency domain. The application of these windowing techniques serves to maintain the high frequency information while tailing off the low frequency information. Windows serve to reduce edge effects, increase signal, and decrease noise. Therefore, fundamentally, one would expect the results to show that the extracted messages using windowed carriers would have a higher signal-to-noise ratio, compared to those carriers which had not been windowed. Figure 9 shows the process of windowing. Figure 9: The Windowing Process Fourier Transform Windowing Technique Substitute Into Level 3 Extraction Process
19 The problem of subsetting was approached within the limitations of computational power. The subsets that were extracted involved breaking the 128 x 128 pixel carrier into four 64 x 64 pixel subsets, and into sixteen 32 x 32 pixel subsets. Although there was a desire to increase the number of subsets that were used, doing so and going to sixty-four 16 x 16 pixel subsets would have quadrupled the amount of computational time. This computational time was already pushed to the limit due to the fact that there was 16 individual cross correlations preformed in the case with no subsetting. Therefore, that translates into 64 computations, 256 computations, and 1024 computations in the 4, 16, and 64 subset cases, respectively. The actual process for subsetting involved cross correlating each piece of the subset with the entire image block. After each piece was correlated all of the pieces were added together. The addition of the subsets returned the completed extraction, which was then processed to extract the signal and noise information. This process was repeated for each image block, in the case of the 512 x 512 pixel image that was used in the present case, there were 16 image blocks. Figure 10 shows an illustration demonstrating how the subsetting process works for the case of 4 subsets.


20 Figure 10: The Subsetting Process Subset Level 3 Extraction Process Addition
21 The process that is shown in Figure 10, is the same process that would be used in the 16, and 64 subset cases. The fundamental thought behind subsetting as a method to increase signal-to-noise ratio, is that as the amount of distortion increases, by breaking up the carrier into smaller and smaller pieces that one will have a large likelihood of correlating with at least some portion of the carrier. There is a problem with this, that however, is the subset of the carrier must remain large enough so that it does not return correlations that contain false positives. The computation of the signal-to-noise ratio provided another problem whose solution needed to be determined. There are numerous methods that can be used to evaluate the signal-to-noise of a system. In this study, there were two methods used before the final method was determined. The first method used took the standard deviation of the signal and divide that number by the standard deviation of the noise. While the result of this did give a signal-to-noise ratio, the accuracy was highly questionable based on the deviation of the signal information due to padding. A second method that was used involved taking the variance of the signal divided by the variance of the noise. This method produced similar concerns with the amount of variance being increased due to signal area padding. The final and chosen method for evaluating the signal-to-noise ratio of the extracted data involves taking the highest signal peak, and dividing that value by the standard deviation of the noise information. This method corrects for the problem of padding that is introduced through the other two methods. This method only uses the highest peak in the correlated area to determine the signal-tonoise relationship, therefore, there is a small chance that the signal-to-noise could be skewed. This method for determining signal-to-noise is maintained throughout the entire
22 process. Since it is only necessary to compare the results to each other, by maintaining the same method for calculation it maintains the basis for comparison. At this point tests were run on the algorithm, and data was generated. It became necessary to determine if the results that were acquired were valid. These tests were necessary because, as was stated above, the project would have no basis for comparison. In order to test the results a simple theoretical case was constructed. The case involved an image with random noise added, and the image without noise. The image with random noise was taken to be the carrier, and the other was the image. The carrier and image were cross correlated in the manner with which the message was to be extracted. The theoretical validation pointed out an error that might have gone unnoticed otherwise. It became quickly evident through the theoretical validation that there was a shift occurring in the data that was unaccounted for. This shift was causing the message locations to be moved from the locations where they should be located. The solution to the shift was simple, in that it only required a shift of the points back around the center of the image. The result of the correction changed the results of the entire experiment. The theoretical model benefited the research in two ways, first it corrected the results, and second it validated the unknown answer. 3.3 Process The process that was ultimately used to determine the optimal method to maximize the signal-to-noise ratio combined a number of the above approaches. The method began with a distorted image. That distorted images was 512 x 512 pixels in size.
23 That distorted image was then broken down into sixteen 128 x 128 pixel image blocks. The image blocks were then evaluated on an individual basis, and the signal-to-noise ratio for each of the extractions was determined. To determine the optimal method of extraction, three techniques were implemented. The first technique that was implemented was the extraction in which the carrier image was not windowed. The second techniques was one in which the carrier was windowed using a Hanning window. And the last was a technique in which the carrier was windowed using a Hamming window. In the first case the carrier that had not been windowed was cross correlated with each of the 16 image blocks. The result of this correlation was an image of correlation values. The image was then passed through a thresholding function that isolated areas that were above 3.5 standard deviations from the mean. These isolated areas were then passed through a blurring filter and thresholded again. These enlarged areas then became the map of message locations. The rest of the correlation image then was assigned to be the noise information. This map of message locations (signal) and noise were saved to be used for each of the following techniques. The signal-to-noise ratio was then determined as described by taking the peak signal value and dividing that by the standard deviation of the noise. This yielded the 16 signal-to-noise ratios for the extraction method that used a carrier that had not been windowed. This process was then repeated for the two windowed cases, giving 16 signal-to-noise ratios for the Hanning windowed case, and 16 signal-to-noise ratios for the Hamming windowed case. After extracting the above data, the next test was to determine if subsetting in each of the three cases would increase the signal-to-noise ratio of the extraction. To determine this result first the carriers were subset. This technique involved first breaking
24 the 128 x 128 pixel carrier into the 4 equal subsets. Next each piece of the carrier was cross correlated with the first image block. This produced 4 correlation images for the first image block. These 4 correlation image were then added together to produce a total correlation image for the first image block. This process was repeated for each of the 16 image blocks. The resultant total correlation images were passed through the same functions to determine the signal-to-noise ratios described prior. This subsetting process was then repeated for the Hanning and Hamming windowed cases. Upon completion of the data collecting for subsetting with 4 subsets, the process was repeated exactly, with the only difference being that the carrier images were in this case broken up into 16 equal subsets instead of 4. With the windowing and subsetting techniques implemented, and the signal-tonoise ratios of the extractions determined, the final step was to interpolate the data. 4.0 Results 4.1 Windowing The first set of results to be examined are those that exist in the case of the windowed functions. The signal-to-noise ratios for the non-windowed, Hanning, and Hamming functions were compared as the distortion vector in the image was increased. Figure 11 is the plot of these signal-to-noise ratios.
25 Figure 11: Plot of Signal-to-Noise Ratios for Windowing Techniques SNR Ratios Signal-to-Noise Normal Whole Hamming Whole Hanning Whole Expon. (Normal Whole) Expon. (Hamming Whole) Expon. (Hanning Whole) Distortion As can be seen above in the results of the signal-to-noise ratio plots, the best signal-tonoise ratio is yielded using a Hamming window. The data that is shown above as the result of the windowing process is intuitively correct. The intuitive nature of the above data is contained in the fact that as the amount of distortion increases, the overall signalto-noise decrease. Furthermore, one expects that windowing will increase the signal-tonoise ratio in cases that contain distortion. As was discussed earlier the reason for the increase in the signal-to-noise ratio due to the windowing process comes from the windows ability to maintain signal, and reduce noise (High Frequency Information). One important item to note is that while the Hamming window provides the highest overall signal-to-noise ratio, it is not always higher. The results show that for small distortions,
26 the non-windowed carrier provides a better or equal signal-to-noise ratio, and does so at a fraction of the computational cost. The next piece of the data that was examined was the results of subsetting the carrier, and then performing the cross correlation. To determine the benefits of subsetting the carrier, the subset signal-to-noise ratio for the subsets of 4 and 16 were compared to signal-to-noise ratio achieved when using the entire carrier of extraction. To start the interpretation of the data the results for the non-windowed carrier were first examined; those results can be seen below in Figure 12. Figure 12: Signal-to-Noise Ratio Comparison for Subset Cases Improvement From Substeting Without Windowing Signal-to-Noise SNR - SNR 4 SNR - SNR 16 Log. (SNR - SNR 16 ) Log. (SNR - SNR 4) Distortion The above plot shows the difference between the signal-to-noise ratio of the whole carrier and the subset carriers. Positive values indicate the there was an improvement made through subsetting, while negative values indicate that subsetting lowered the signal-to-
27 noise ratio. The difficulty in these above results is that intuitively one would expect that as distortion increases then larger gains would be made through the subsetting process. The determination was made that the algorithm, as implemented in this case, begins to deteriorate in the case of distortions vectors above a length of approximately 8 units. The other problem that arises with the results of the data is that the gains that are made are marginal at best. All of the increase in signal-to-noise ratio that were made by subsetting in the non-windowed case were below , and those were only in the 16 subset case which requires 240 more calculations than leaving the carrier whole. The problem then is whether to use the extra computational power to produce only a marginal increase in the signal-to-noise ratio, or to apply it to speeding up the extraction process. The next subset that was examined was the Hanning windowed subsets. Similar to the above case, and as defined earlier there was three Hanning windowed carriers. One carrier remained whole, one carrier was broken into 4 subsets, and the final carrier was broken into 16 subsets. Below in Figure 13 is the plot showing improvements made by subsetting the Hanning windowed carrier.
28 Figure 13: Improvements from Subsetting the Hanning Windowed Carrier Improvement From Subsetting With a Hanning Window 4.00E E E E E-05 Signal-to-Noise 1.50E E E-06 SNR - SNR 4 SNR - SNR 16 Log. (SNR - SNR 16 ) Log. (SNR - SNR 4) 0.00E E E E-05 Distortion The above plot shows results similar to the case of the non-windowed carrier. Both sets of results fall off as the distortion vector gets larger. The gains achieved by subsetting in the Hanning windowed case are larger than those in the non-windowed case, however, they are still very marginal gains. These marginal gains most likely are not worth the computational power necessary to subset. There is something slightly unusual about the above plot. The anomaly can be seen in the fact that subsetting down to 4 subsets results in a decrease in the signal-to-noise ratio. The final subsetting that was examined was that of the Hamming windowed carrier. Again like the above two cases the Hamming windowed carrier was split into subset so 4 and 16, and also left whole. The plot of the improvements made from subsetting can be seen below in Figure 14.
29 Figure 12: Improvements from Subsetting the Hamming Windowed Carrier Improvements From Subsetting With a Hamming Window 3.00E E E E-05 Signal-to-Noise 1.00E E-06 SNR - SNR 4 SNR - SNR 16 Log. (SNR - SNR 4) Log. (SNR - SNR 16 ) 0.00E E E-05 Distortion The above results are similar to the previous two cases, they shows the same type of trend in the results. The same principle concern arises in the above data. That principle concern being the cost-benefit relationship associated with spending the computational power and time to subset the carrier and cross correlate each subset piece. Based on the results of the data in all three of the above cases, it can be safely said that there is no significant gain made via subsetting. Therefore it is impossible to offset the amount of computational power that is required to generate the result. Based on these conclusion it would be advisable to skip the subsetting process or investigate more effective ways to perform the subsetting. The problem with abandoning the subsetting process all together is that fundamentally there are strong suggestions that there is an optimal small subset size. At this subset size the distortions would begin to disappear and
30 the correlation would increase. This increase in correlation would yield a much higher signal-to-noise ratio. 5.0 Future Work 5.1 Future Windowing Given an increased timetable, there is more work that could be done to experiment with windowing of the carrier. Based on the success that has already been made in increasing the signal-to-noise ratio by just using two basic windowing methods the Hanning and Hamming methods, it shows this area is worth the effort to continue research. The future of the research in this area could, in the short term, be focused on implementing other existing windowing techniques to determine their effect on the signal-to-noise ratio in the distorted images. While in the long term a method could be investigated that would adapt the method in which the windowing techniques are applied. This adaptive windowing could be a method for determining an estimate for the amount of distortion in an image block, and then determine if it is worth the computational time to window the carrier, or if that computational power could be better used in another image block. This may require more computational power to estimate the amount of distortion in each image block, than it would to just window each carrier. The second case is more likely than the first; however, it is still worth investigation. 5.2 Future Subsetting
31 The future work to be done in the area of subsetting would be in automatic image registration. Through a technique of image registration below it becomes possible to account for rotation, translation, and scale changes in a image. The fundamental basis for subsetting is to isolate a small enough portion of the image that the distortion changes can be in terms of the above three distortion terms. The automatic image registration begins with the idea that if you have two images that vary only by a translation then Equation 2 is true. (Xie, 2003). g x, y) = f ( x x, y ) (2) ( 0 y0 Then by taking the Fourier transform of the above images the resultant image are related by Equation 3. G( u, v) = F( u, v) e i2π ( ux0 + vy0 ) (3) At this point an equation can be used from the Fourier Shift Theorem. This equation says that two Fourier transforms can be related through the ratio of their phase differences. Equation 4 shows how to determine the ratio of phase that is the difference between the two images. F( u, v) G ( u, v) R = (4) F( u, v) G( u, v)
32 In order to account for rotation and scale terms there are further steps that must be taken. The first step is to change the coordinate space that is being used. The change in space should be to one which is rectilinear with angle and phase. The seemingly best coordinate space to convert to would be Log-polar space. The transformation equation from Cartesian space to the Log-polar space can be found in Equation 5. X = e Y = e log( ρ ) log( ρ ) cos( θ ) sin( θ ) (5) Using the converted Log-polar space it allows the relationship between two images that vary by rotation, scale, and translation to be defined. Equation 6 is the demonstration of this relationship. g x, y) = f ( α ( x cosθ + y sinθ ) x, α( xsinθ + y cosθ ) ) (6) ( y0 Where in the above equation θ 0 represents the change in rotation, α represents the change in scale, and x 0, and y 0 represent the translational change. Now by taking the Fourier transform of the above, the two images can be related in magnitude by Equation G ( u, v) = F( ( u cosθ 0 + vsinθ 0 ), ( u sinθ 0 + v cosθ 0 )) (7) 2 α α α
33 The Fourier transform of these images are thus independent of translational differences because all that matters in the Fourier case is the phase. Converting Equation 7 into Logpolar space will yield the final result of the process. The substitution and simplified equations can be seen in Equation 8 and Equation ρ 1 ρ G ( u, v) = F( e cos( θ θ 0 ), e sin( θ θ 0 )) (8) 2 α α α 1 G ( u, v) = F( ρ lnα, θ θ 0 ) (9) 2 α Using the above equation and knowing two important facts allows for the scale and rotation to be determined. The facts are that the scaling that occurs in the image results in a shift α along the log radius. The second fact that must be known is that the rotation results in a translational shift about the θ axis. Using these facts about the scale and rotation is become possible to use Equation 3 to determine the scale and rotational changes. This information would could ultimately make a significant impact on the subset extractions. The way to implement this method towards the goal of subset extraction would be to determine the shift, rotation, and scale changes at each subset location. After determining these changes the subset could then be changed to maximize the correlation values. By minimizing the subset size to isolate the probability that rotation, scale, and translational changes would be the only likely distortion, then using the above method to correct for those distortions the extraction signal-to-noise ratio could be maximized. There is only one foreseeable downfall to the above method, the computational time that would be required to implement the method. To significantly
34 minimize the likelihood that the subset would only be distorted by scale, rotation, and translation the number of calculations would be maximized. Then to apply the above method to each of the subsets would further increase the computational time. In order to determine the cost-benefit relationship of this method there would have to be significant tests run on a number of distortion levels. 6.0 Conclusion Based on the results of this research, it becomes evident the methods that should be used to maximize signal-to-noise ratios of the extracted messages. From the research, and above given data, it can be seen that windowing provides the most notable increase in signal-to-noise ratio. This notable increase could be maximized by using a Hamming window on each of the carriers prior to the cross correlation process. For whatever reason, if the use of a Hamming window was not an available solution, a Hanning window could be used with little loss in signal-to-noise. Moreover, although there is an increase made to the signal-to-noise ratio that is associated with the subsetting of the carrier. The increase is so small that it is not worth the amount of computational time or power that it takes to arrive at the subset results. That is only speaking of the present case; if the algorithm were able to better extract from more heavily distorted images then the subsetting process could be more significant.
35 7.0 Refrences Gonzalez, R., and R. Woods, Digital Image Processing, Second Edition, 2002 Rabbani, M., and C. Honsinger, Data Embedding Using Phase Dispersion, IEEE Confrence Paper on Secure Images, 2000 Xie, H. N. Hicksa, G. Kellera, H. Huangb, and V. Kreinovich, An IDL/ENVI implementation of the FFTbased algorithm for automatic image registration, Computers & Geosciences, 2003, Volume 29, pp Signal-to-Noise Calculations, January 2004,
Investigation of Digital Signal Processing of High-speed DACs Signals for Settling Time Testing
 Universal Journal of Electrical and Electronic Engineering 4(2): 67-72, 2016 DOI: 10.13189/ujeee.2016.040204 http://www.hrpub.org Investigation of Digital Signal Processing of High-speed DACs Signals for
The Effect of Time-Domain Interpolation on Response Spectral Calculations. David M. Boore
 The Effect of Time-Domain Interpolation on Response Spectral Calculations David M. Boore This note confirms Norm Abrahamson s finding that the straight line interpolation between sampled points used in
DELTA MODULATION AND DPCM CODING OF COLOR SIGNALS
 DELTA MODULATION AND DPCM CODING OF COLOR SIGNALS Item Type text; Proceedings Authors Habibi, A. Publisher International Foundation for Telemetering Journal International Telemetering Conference Proceedings
Measurement of overtone frequencies of a toy piano and perception of its pitch
 Measurement of overtone frequencies of a toy piano and perception of its pitch PACS: 43.75.Mn ABSTRACT Akira Nishimura Department of Media and Cultural Studies, Tokyo University of Information Sciences,
The Extron MGP 464 is a powerful, highly effective tool for advanced A/V communications and presentations. It has the
 MGP 464: How to Get the Most from the MGP 464 for Successful Presentations The Extron MGP 464 is a powerful, highly effective tool for advanced A/V communications and presentations. It has the ability
Reconstruction of Ca 2+ dynamics from low frame rate Ca 2+ imaging data CS229 final project. Submitted by: Limor Bursztyn
 Reconstruction of Ca 2+ dynamics from low frame rate Ca 2+ imaging data CS229 final project. Submitted by: Limor Bursztyn Introduction Active neurons communicate by action potential firing (spikes), accompanied
The Measurement Tools and What They Do
 2 The Measurement Tools The Measurement Tools and What They Do JITTERWIZARD The JitterWizard is a unique capability of the JitterPro package that performs the requisite scope setup chores while simplifying
Calibrate, Characterize and Emulate Systems Using RFXpress in AWG Series
 Calibrate, Characterize and Emulate Systems Using RFXpress in AWG Series Introduction System designers and device manufacturers so long have been using one set of instruments for creating digitally modulated
Department of Electrical & Electronic Engineering Imperial College of Science, Technology and Medicine. Project: Real-Time Speech Enhancement
 Department of Electrical & Electronic Engineering Imperial College of Science, Technology and Medicine Project: Real-Time Speech Enhancement Introduction Telephones are increasingly being used in noisy
AN ARTISTIC TECHNIQUE FOR AUDIO-TO-VIDEO TRANSLATION ON A MUSIC PERCEPTION STUDY
 AN ARTISTIC TECHNIQUE FOR AUDIO-TO-VIDEO TRANSLATION ON A MUSIC PERCEPTION STUDY Eugene Mikyung Kim Department of Music Technology, Korea National University of Arts eugene@u.northwestern.edu ABSTRACT
Detection and demodulation of non-cooperative burst signal Feng Yue 1, Wu Guangzhi 1, Tao Min 1
 International Conference on Applied Science and Engineering Innovation (ASEI 2015) Detection and demodulation of non-cooperative burst signal Feng Yue 1, Wu Guangzhi 1, Tao Min 1 1 China Satellite Maritime
REPORT DOCUMENTATION PAGE
 REPORT DOCUMENTATION PAGE Form Approved OMB No. 0704-0188 Public reporting burden for this collection of information is estimated to average 1 hour per response, including the time for reviewing instructions,
ONE SENSOR MICROPHONE ARRAY APPLICATION IN SOURCE LOCALIZATION. Hsin-Chu, Taiwan
 ICSV14 Cairns Australia 9-12 July, 2007 ONE SENSOR MICROPHONE ARRAY APPLICATION IN SOURCE LOCALIZATION Percy F. Wang 1 and Mingsian R. Bai 2 1 Southern Research Institute/University of Alabama at Birmingham
UNIVERSAL SPATIAL UP-SCALER WITH NONLINEAR EDGE ENHANCEMENT
 UNIVERSAL SPATIAL UP-SCALER WITH NONLINEAR EDGE ENHANCEMENT Stefan Schiemenz, Christian Hentschel Brandenburg University of Technology, Cottbus, Germany ABSTRACT Spatial image resizing is an important
Appendix D. UW DigiScope User s Manual. Willis J. Tompkins and Annie Foong
 Appendix D UW DigiScope User s Manual Willis J. Tompkins and Annie Foong UW DigiScope is a program that gives the user a range of basic functions typical of a digital oscilloscope. Included are such features
Lab 5 Linear Predictive Coding
 Lab 5 Linear Predictive Coding 1 of 1 Idea When plain speech audio is recorded and needs to be transmitted over a channel with limited bandwidth it is often necessary to either compress or encode the audio
Video coding standards
 Video coding standards Video signals represent sequences of images or frames which can be transmitted with a rate from 5 to 60 frames per second (fps), that provides the illusion of motion in the displayed
PS User Guide Series Seismic-Data Display
 PS User Guide Series 2015 Seismic-Data Display Prepared By Choon B. Park, Ph.D. January 2015 Table of Contents Page 1. File 2 2. Data 2 2.1 Resample 3 3. Edit 4 3.1 Export Data 4 3.2 Cut/Append Records
CZT vs FFT: Flexibility vs Speed. Abstract
 CZT vs FFT: Flexibility vs Speed Abstract Bluestein s Fast Fourier Transform (FFT), commonly called the Chirp-Z Transform (CZT), is a little-known algorithm that offers engineers a high-resolution FFT
52 IEEE TRANSACTIONS ON MULTIMEDIA, VOL. 7, NO. 1, FEBRUARY 2005
 52 IEEE TRANSACTIONS ON MULTIMEDIA, VOL. 7, NO. 1, FEBRUARY 2005 Spatially Localized Image-Dependent Watermarking for Statistical Invisibility and Collusion Resistance Karen Su, Student Member, IEEE, Deepa
CS229 Project Report Polyphonic Piano Transcription
 CS229 Project Report Polyphonic Piano Transcription Mohammad Sadegh Ebrahimi Stanford University Jean-Baptiste Boin Stanford University sadegh@stanford.edu jbboin@stanford.edu 1. Introduction In this project
Audio-Based Video Editing with Two-Channel Microphone
 Audio-Based Video Editing with Two-Channel Microphone Tetsuya Takiguchi Organization of Advanced Science and Technology Kobe University, Japan takigu@kobe-u.ac.jp Yasuo Ariki Organization of Advanced Science
Pitch correction on the human voice
 University of Arkansas, Fayetteville ScholarWorks@UARK Computer Science and Computer Engineering Undergraduate Honors Theses Computer Science and Computer Engineering 5-2008 Pitch correction on the human
Advanced Techniques for Spurious Measurements with R&S FSW-K50 White Paper
 Advanced Techniques for Spurious Measurements with R&S FSW-K50 White Paper Products: ı ı R&S FSW R&S FSW-K50 Spurious emission search with spectrum analyzers is one of the most demanding measurements in
Behavior Forensics for Scalable Multiuser Collusion: Fairness Versus Effectiveness H. Vicky Zhao, Member, IEEE, and K. J. Ray Liu, Fellow, IEEE
 IEEE TRANSACTIONS ON INFORMATION FORENSICS AND SECURITY, VOL. 1, NO. 3, SEPTEMBER 2006 311 Behavior Forensics for Scalable Multiuser Collusion: Fairness Versus Effectiveness H. Vicky Zhao, Member, IEEE,
6.UAP Project. FunPlayer: A Real-Time Speed-Adjusting Music Accompaniment System. Daryl Neubieser. May 12, 2016
 6.UAP Project FunPlayer: A Real-Time Speed-Adjusting Music Accompaniment System Daryl Neubieser May 12, 2016 Abstract: This paper describes my implementation of a variable-speed accompaniment system that
Adaptive Resampling - Transforming From the Time to the Angle Domain
 Adaptive Resampling - Transforming From the Time to the Angle Domain Jason R. Blough, Ph.D. Assistant Professor Mechanical Engineering-Engineering Mechanics Department Michigan Technological University
Instrument Recognition in Polyphonic Mixtures Using Spectral Envelopes
 Instrument Recognition in Polyphonic Mixtures Using Spectral Envelopes hello Jay Biernat Third author University of Rochester University of Rochester Affiliation3 words jbiernat@ur.rochester.edu author3@ismir.edu
CS2401-COMPUTER GRAPHICS QUESTION BANK
 SRI VENKATESWARA COLLEGE OF ENGINEERING AND TECHNOLOGY THIRUPACHUR. CS2401-COMPUTER GRAPHICS QUESTION BANK UNIT-1-2D PRIMITIVES PART-A 1. Define Persistence Persistence is defined as the time it takes
Restoration of Hyperspectral Push-Broom Scanner Data
 Restoration of Hyperspectral Push-Broom Scanner Data Rasmus Larsen, Allan Aasbjerg Nielsen & Knut Conradsen Department of Mathematical Modelling, Technical University of Denmark ABSTRACT: Several effects
Spectrum Analyser Basics
 Hands-On Learning Spectrum Analyser Basics Peter D. Hiscocks Syscomp Electronic Design Limited Email: phiscock@ee.ryerson.ca June 28, 2014 Introduction Figure 1: GUI Startup Screen In a previous exercise,
A Parametric Autoregressive Model for the Extraction of Electric Network Frequency Fluctuations in Audio Forensic Authentication
 Proceedings of the 3 rd International Conference on Control, Dynamic Systems, and Robotics (CDSR 16) Ottawa, Canada May 9 10, 2016 Paper No. 110 DOI: 10.11159/cdsr16.110 A Parametric Autoregressive Model
Channel models for high-capacity information hiding in images
 Channel models for high-capacity information hiding in images Johann A. Briffa a, Manohar Das b School of Engineering and Computer Science Oakland University, Rochester MI 48309 ABSTRACT We consider the
A Parametric Autoregressive Model for the Extraction of Electric Network Frequency Fluctuations in Audio Forensic Authentication
 Journal of Energy and Power Engineering 10 (2016) 504-512 doi: 10.17265/1934-8975/2016.08.007 D DAVID PUBLISHING A Parametric Autoregressive Model for the Extraction of Electric Network Frequency Fluctuations
Automatic LP Digitalization Spring Group 6: Michael Sibley, Alexander Su, Daphne Tsatsoulis {msibley, ahs1,
 Automatic LP Digitalization 18-551 Spring 2011 Group 6: Michael Sibley, Alexander Su, Daphne Tsatsoulis {msibley, ahs1, ptsatsou}@andrew.cmu.edu Introduction This project was originated from our interest
Benefits of the R&S RTO Oscilloscope's Digital Trigger. <Application Note> Products: R&S RTO Digital Oscilloscope
 Benefits of the R&S RTO Oscilloscope's Digital Trigger Application Note Products: R&S RTO Digital Oscilloscope The trigger is a key element of an oscilloscope. It captures specific signal events for detailed
Design Trade-offs in a Code Division Multiplexing Multiping Multibeam. Echo-Sounder
 Design Trade-offs in a Code Division Multiplexing Multiping Multibeam Echo-Sounder B. O Donnell B. R. Calder Abstract Increasing the ping rate in a Multibeam Echo-Sounder (mbes) nominally increases the
Colour Reproduction Performance of JPEG and JPEG2000 Codecs
 Colour Reproduction Performance of JPEG and JPEG000 Codecs A. Punchihewa, D. G. Bailey, and R. M. Hodgson Institute of Information Sciences & Technology, Massey University, Palmerston North, New Zealand
A Novel Approach towards Video Compression for Mobile Internet using Transform Domain Technique
 A Novel Approach towards Video Compression for Mobile Internet using Transform Domain Technique Dhaval R. Bhojani Research Scholar, Shri JJT University, Jhunjunu, Rajasthan, India Ved Vyas Dwivedi, PhD.
homework solutions for: Homework #4: Signal-to-Noise Ratio Estimation submitted to: Dr. Joseph Picone ECE 8993 Fundamentals of Speech Recognition
 INSTITUTE FOR SIGNAL AND INFORMATION PROCESSING homework solutions for: Homework #4: Signal-to-Noise Ratio Estimation submitted to: Dr. Joseph Picone ECE 8993 Fundamentals of Speech Recognition May 3,
Manuel Richey. Hossein Saiedian*
 Int. J. Signal and Imaging Systems Engineering, Vol. 10, No. 6, 2017 301 Compressed fixed-point data formats with non-standard compression factors Manuel Richey Engineering Services Department, CertTech
Intra-frame JPEG-2000 vs. Inter-frame Compression Comparison: The benefits and trade-offs for very high quality, high resolution sequences
 Intra-frame JPEG-2000 vs. Inter-frame Compression Comparison: The benefits and trade-offs for very high quality, high resolution sequences Michael Smith and John Villasenor For the past several decades,
Digital holographic security system based on multiple biometrics
 Digital holographic security system based on multiple biometrics ALOKA SINHA AND NIRMALA SAINI Department of Physics, Indian Institute of Technology Delhi Indian Institute of Technology Delhi, Hauz Khas,
Please feel free to download the Demo application software from analogarts.com to help you follow this seminar.
 Hello, welcome to Analog Arts spectrum analyzer tutorial. Please feel free to download the Demo application software from analogarts.com to help you follow this seminar. For this presentation, we use a
CM3106 Solutions. Do not turn this page over until instructed to do so by the Senior Invigilator.
 CARDIFF UNIVERSITY EXAMINATION PAPER Academic Year: 2013/2014 Examination Period: Examination Paper Number: Examination Paper Title: Duration: Autumn CM3106 Solutions Multimedia 2 hours Do not turn this
How to Obtain a Good Stereo Sound Stage in Cars
 Page 1 How to Obtain a Good Stereo Sound Stage in Cars Author: Lars-Johan Brännmark, Chief Scientist, Dirac Research First Published: November 2017 Latest Update: November 2017 Designing a sound system
Motion Video Compression
 7 Motion Video Compression 7.1 Motion video Motion video contains massive amounts of redundant information. This is because each image has redundant information and also because there are very few changes
FEASIBILITY STUDY OF USING EFLAWS ON QUALIFICATION OF NUCLEAR SPENT FUEL DISPOSAL CANISTER INSPECTION
 FEASIBILITY STUDY OF USING EFLAWS ON QUALIFICATION OF NUCLEAR SPENT FUEL DISPOSAL CANISTER INSPECTION More info about this article: http://www.ndt.net/?id=22532 Iikka Virkkunen 1, Ulf Ronneteg 2, Göran
Lecture 2 Video Formation and Representation
 2013 Spring Term 1 Lecture 2 Video Formation and Representation Wen-Hsiao Peng ( 彭文孝 ) Multimedia Architecture and Processing Lab (MAPL) Department of Computer Science National Chiao Tung University 1
A NEW LOOK AT FREQUENCY RESOLUTION IN POWER SPECTRAL DENSITY ESTIMATION. Sudeshna Pal, Soosan Beheshti
 A NEW LOOK AT FREQUENCY RESOLUTION IN POWER SPECTRAL DENSITY ESTIMATION Sudeshna Pal, Soosan Beheshti Electrical and Computer Engineering Department, Ryerson University, Toronto, Canada spal@ee.ryerson.ca
EDDY CURRENT IMAGE PROCESSING FOR CRACK SIZE CHARACTERIZATION
 EDDY CURRENT MAGE PROCESSNG FOR CRACK SZE CHARACTERZATON R.O. McCary General Electric Co., Corporate Research and Development P. 0. Box 8 Schenectady, N. Y. 12309 NTRODUCTON Estimation of crack length
Research Article. ISSN (Print) *Corresponding author Shireen Fathima
 *Corresponding author Shireen Fathima") Scholars Journal of Engineering and Technology (SJET) Sch. J. Eng. Tech., 2014; 2(4C):613-620 Scholars Academic and Scientific Publisher (An International Publisher for Academic and Scientific Resources)
Scholars Journal of Engineering and Technology (SJET) Sch. J. Eng. Tech., 2014; 2(4C):613-620 Scholars Academic and Scientific Publisher (An International Publisher for Academic and Scientific Resources)
CHAPTER 8 CONCLUSION AND FUTURE SCOPE
 124 CHAPTER 8 CONCLUSION AND FUTURE SCOPE Data hiding is becoming one of the most rapidly advancing techniques the field of research especially with increase in technological advancements in internet and
EE-217 Final Project The Hunt for Noise (and All Things Audible)
") EE-217 Final Project The Hunt for Noise (and All Things Audible) 5-7-14 Introduction Noise is in everything. All modern communication systems must deal with noise in one way or another. Different types
EE-217 Final Project The Hunt for Noise (and All Things Audible) 5-7-14 Introduction Noise is in everything. All modern communication systems must deal with noise in one way or another. Different types
Precise Digital Integration of Fast Analogue Signals using a 12-bit Oscilloscope
 EUROPEAN ORGANIZATION FOR NUCLEAR RESEARCH CERN BEAMS DEPARTMENT CERN-BE-2014-002 BI Precise Digital Integration of Fast Analogue Signals using a 12-bit Oscilloscope M. Gasior; M. Krupa CERN Geneva/CH
White Paper. Uniform Luminance Technology. What s inside? What is non-uniformity and noise in LCDs? Why is it a problem? How is it solved?
 White Paper Uniform Luminance Technology What s inside? What is non-uniformity and noise in LCDs? Why is it a problem? How is it solved? Tom Kimpe Manager Technology & Innovation Group Barco Medical Imaging
2. AN INTROSPECTION OF THE MORPHING PROCESS
 1. INTRODUCTION Voice morphing means the transition of one speech signal into another. Like image morphing, speech morphing aims to preserve the shared characteristics of the starting and final signals,
White Paper JBL s LSR Principle, RMC (Room Mode Correction) and the Monitoring Environment by John Eargle. Introduction and Background:
 and the Monitoring Environment by John Eargle. Introduction and Background:") White Paper JBL s LSR Principle, RMC (Room Mode Correction) and the Monitoring Environment by John Eargle Introduction and Background: Although a loudspeaker may measure flat on-axis under anechoic conditions,
White Paper JBL s LSR Principle, RMC (Room Mode Correction) and the Monitoring Environment by John Eargle Introduction and Background: Although a loudspeaker may measure flat on-axis under anechoic conditions,
On Figure of Merit in PAM4 Optical Transmitter Evaluation, Particularly TDECQ
 On Figure of Merit in PAM4 Optical Transmitter Evaluation, Particularly TDECQ Pavel Zivny, Tektronix V1.0 On Figure of Merit in PAM4 Optical Transmitter Evaluation, Particularly TDECQ A brief presentation
An Overview of Video Coding Algorithms
 An Overview of Video Coding Algorithms Prof. Ja-Ling Wu Department of Computer Science and Information Engineering National Taiwan University Video coding can be viewed as image compression with a temporal
System Quality Indicators
 Chapter 2 System Quality Indicators The integration of systems on a chip, has led to a revolution in the electronic industry. Large, complex system functions can be integrated in a single IC, paving the
ECE 4220 Real Time Embedded Systems Final Project Spectrum Analyzer
 ECE 4220 Real Time Embedded Systems Final Project Spectrum Analyzer by: Matt Mazzola 12222670 Abstract The design of a spectrum analyzer on an embedded device is presented. The device achieves minimum
Analysis of WFS Measurements from first half of 2004
 Analysis of WFS Measurements from first half of 24 (Report4) Graham Cox August 19, 24 1 Abstract Described in this report is the results of wavefront sensor measurements taken during the first seven months
Signal to noise the key to increased marine seismic bandwidth
 Signal to noise the key to increased marine seismic bandwidth R. Gareth Williams 1* and Jon Pollatos 1 question the conventional wisdom on seismic acquisition suggesting that wider bandwidth can be achieved
Course Web site:
 The University of Texas at Austin Spring 2018 EE 445S Real- Time Digital Signal Processing Laboratory Prof. Evans Solutions for Homework #1 on Sinusoids, Transforms and Transfer Functions 1. Transfer Functions.
The Future of EMC Test Laboratory Capabilities. White Paper
 The Future of EMC Test Laboratory Capabilities White Paper The complexity of modern day electronics is increasing the EMI compliance failure rate. The result is a need for better EMI diagnostic capabilities
UC San Diego UC San Diego Previously Published Works
 UC San Diego UC San Diego Previously Published Works Title Classification of MPEG-2 Transport Stream Packet Loss Visibility Permalink https://escholarship.org/uc/item/9wk791h Authors Shin, J Cosman, P
hit), and assume that longer incidental sounds (forest noise, water, wind noise) resemble a Gaussian noise distribution.
, and assume that longer incidental sounds (forest noise, water, wind noise) resemble a Gaussian noise distribution.") CS 229 FINAL PROJECT A SOUNDHOUND FOR THE SOUNDS OF HOUNDS WEAKLY SUPERVISED MODELING OF ANIMAL SOUNDS ROBERT COLCORD, ETHAN GELLER, MATTHEW HORTON Abstract: We propose a hybrid approach to generating
CS 229 FINAL PROJECT A SOUNDHOUND FOR THE SOUNDS OF HOUNDS WEAKLY SUPERVISED MODELING OF ANIMAL SOUNDS ROBERT COLCORD, ETHAN GELLER, MATTHEW HORTON Abstract: We propose a hybrid approach to generating
Optimization of Multi-Channel BCH Error Decoding for Common Cases. Russell Dill Master's Thesis Defense April 20, 2015
 Optimization of Multi-Channel BCH Error Decoding for Common Cases Russell Dill Master's Thesis Defense April 20, 2015 Bose-Chaudhuri-Hocquenghem (BCH) BCH is an Error Correcting Code (ECC) and is used
USING MATLAB CODE FOR RADAR SIGNAL PROCESSING. EEC 134B Winter 2016 Amanda Williams Team Hertz
 USING MATLAB CODE FOR RADAR SIGNAL PROCESSING EEC 134B Winter 2016 Amanda Williams 997387195 Team Hertz CONTENTS: I. Introduction II. Note Concerning Sources III. Requirements for Correct Functionality
DATA COMPRESSION USING THE FFT
 EEE 407/591 PROJECT DUE: NOVEMBER 21, 2001 DATA COMPRESSION USING THE FFT INSTRUCTOR: DR. ANDREAS SPANIAS TEAM MEMBERS: IMTIAZ NIZAMI - 993 21 6600 HASSAN MANSOOR - 993 69 3137 Contents TECHNICAL BACKGROUND...
Error Resilience for Compressed Sensing with Multiple-Channel Transmission
 Journal of Information Hiding and Multimedia Signal Processing c 2015 ISSN 2073-4212 Ubiquitous International Volume 6, Number 5, September 2015 Error Resilience for Compressed Sensing with Multiple-Channel
ANALYSIS OF COMPUTED ORDER TRACKING
 Mechanical Systems and Signal Processing (1997) 11(2), 187 205 ANALYSIS OF COMPUTED ORDER TRACKING K. R. FYFE AND E. D. S. MUNCK Department of Mechanical Engineering, University of Alberta, Edmonton, Alberta,
Area-Efficient Decimation Filter with 50/60 Hz Power-Line Noise Suppression for ΔΣ A/D Converters
 SICE Journal of Control, Measurement, and System Integration, Vol. 10, No. 3, pp. 165 169, May 2017 Special Issue on SICE Annual Conference 2016 Area-Efficient Decimation Filter with 50/60 Hz Power-Line
CONSTRUCTION OF LOW-DISTORTED MESSAGE-RICH VIDEOS FOR PERVASIVE COMMUNICATION
 2016 International Computer Symposium CONSTRUCTION OF LOW-DISTORTED MESSAGE-RICH VIDEOS FOR PERVASIVE COMMUNICATION 1 Zhen-Yu You ( ), 2 Yu-Shiuan Tsai ( ) and 3 Wen-Hsiang Tsai ( ) 1 Institute of Information
The Effect of Plate Deformable Mirror Actuator Grid Misalignment on the Compensation of Kolmogorov Turbulence
 The Effect of Plate Deformable Mirror Actuator Grid Misalignment on the Compensation of Kolmogorov Turbulence AN027 Author: Justin Mansell Revision: 4/18/11 Abstract Plate-type deformable mirrors (DMs)
DCI Requirements Image - Dynamics
 DCI Requirements Image - Dynamics Matt Cowan Entertainment Technology Consultants www.etconsult.com Gamma 2.6 12 bit Luminance Coding Black level coding Post Production Implications Measurement Processes
MIE 402: WORKSHOP ON DATA ACQUISITION AND SIGNAL PROCESSING Spring 2003
 MIE 402: WORKSHOP ON DATA ACQUISITION AND SIGNAL PROCESSING Spring 2003 OBJECTIVE To become familiar with state-of-the-art digital data acquisition hardware and software. To explore common data acquisition
A New Standardized Method for Objectively Measuring Video Quality
 1 A New Standardized Method for Objectively Measuring Video Quality Margaret H Pinson and Stephen Wolf Abstract The National Telecommunications and Information Administration (NTIA) General Model for estimating
HIGH QUALITY GEOMETRY DISTORTION TOOL FOR USE WITH LCD AND DLP PROJECTORS
 HIGH QUALITY GEOMETRY DISTORTION TOOL FOR USE WITH LCD AND DLP PROJECTORS Ronny Van Belle Electronic Design Engineer & Bart Maximus R&D Manager Barco Projection Systems Simulation Department & Philippe
A review on the design and improvement techniques of comb filters
 A review on the design and improvement techniques of comb filters Naina Kathuria Naina Kathuria, M. Tech Student Electronics &Communication, JMIT, Radaur ABSTRACT Comb filters are basically the decimation
DIGITAL COMMUNICATION
 10EC61 DIGITAL COMMUNICATION UNIT 3 OUTLINE Waveform coding techniques (continued), DPCM, DM, applications. Base-Band Shaping for Data Transmission Discrete PAM signals, power spectra of discrete PAM signals.
Digital Correction for Multibit D/A Converters
 Digital Correction for Multibit D/A Converters José L. Ceballos 1, Jesper Steensgaard 2 and Gabor C. Temes 1 1 Dept. of Electrical Engineering and Computer Science, Oregon State University, Corvallis,
Inverse Filtering by Signal Reconstruction from Phase. Megan M. Fuller
 Inverse Filtering by Signal Reconstruction from Phase by Megan M. Fuller B.S. Electrical Engineering Brigham Young University, 2012 Submitted to the Department of Electrical Engineering and Computer Science
AP Statistics Sec 5.1: An Exercise in Sampling: The Corn Field
 AP Statistics Sec.: An Exercise in Sampling: The Corn Field Name: A farmer has planted a new field for corn. It is a rectangular plot of land with a river that runs along the right side of the field. The
New-Generation Scalable Motion Processing from Mobile to 4K and Beyond
 Mobile to 4K and Beyond White Paper Today s broadcast video content is being viewed on the widest range of display devices ever known, from small phone screens and legacy SD TV sets to enormous 4K and
StaMPS Persistent Scatterer Practical
 StaMPS Persistent Scatterer Practical ESA Land Training Course, Leicester, 10-14 th September, 2018 Andy Hooper, University of Leeds a.hooper@leeds.ac.uk This practical exercise consists of working through
Setting Up the Warp System File: Warp Theater Set-up.doc 25 MAY 04
 Setting Up the Warp System File: Warp Theater Set-up.doc 25 MAY 04 Initial Assumptions: Theater geometry has been calculated and the screens have been marked with fiducial points that represent the limits
Impact of DMD-SLMs errors on reconstructed Fourier holograms quality
 Journal of Physics: Conference Series PAPER OPEN ACCESS Impact of DMD-SLMs errors on reconstructed Fourier holograms quality To cite this article: D Yu Molodtsov et al 2016 J. Phys.: Conf. Ser. 737 012074
Results of Vibration Study for LCLS-II Construction in FEE, Hutch 3 LODCM and M3H 1
 LCLS-TN-12-4 Results of Vibration Study for LCLS-II Construction in FEE, Hutch 3 LODCM and M3H 1 Georg Gassner SLAC August 30, 2012 Abstract To study the influence of LCLS-II construction on the stability
BER MEASUREMENT IN THE NOISY CHANNEL
 BER MEASUREMENT IN THE NOISY CHANNEL PREPARATION... 2 overview... 2 the basic system... 3 a more detailed description... 4 theoretical predictions... 5 EXPERIMENT... 6 the ERROR COUNTING UTILITIES module...
Dither Explained. An explanation and proof of the benefit of dither. for the audio engineer. By Nika Aldrich. April 25, 2002
 Dither Explained An explanation and proof of the benefit of dither for the audio engineer By Nika Aldrich April 25, 2002 Several people have asked me to explain this, and I have to admit it was one of
II. SYSTEM MODEL In a single cell, an access point and multiple wireless terminals are located. We only consider the downlink
 Subcarrier allocation for variable bit rate video streams in wireless OFDM systems James Gross, Jirka Klaue, Holger Karl, Adam Wolisz TU Berlin, Einsteinufer 25, 1587 Berlin, Germany {gross,jklaue,karl,wolisz}@ee.tu-berlin.de
Realizing Waveform Characteristics up to a Digitizer s Full Bandwidth Increasing the effective sampling rate when measuring repetitive signals
 Realizing Waveform Characteristics up to a Digitizer s Full Bandwidth Increasing the effective sampling rate when measuring repetitive signals By Jean Dassonville Agilent Technologies Introduction The
Application Note AN-708 Vibration Measurements with the Vibration Synchronization Module
 Application Note AN-708 Vibration Measurements with the Vibration Synchronization Module Introduction The vibration module allows complete analysis of cyclical events using low-speed cameras. This is accomplished
Multirate Digital Signal Processing
 Multirate Digital Signal Processing Contents 1) What is multirate DSP? 2) Downsampling and Decimation 3) Upsampling and Interpolation 4) FIR filters 5) IIR filters a) Direct form filter b) Cascaded form
Interface Practices Subcommittee SCTE STANDARD SCTE Composite Distortion Measurements (CSO & CTB)
") Interface Practices Subcommittee SCTE STANDARD Composite Distortion Measurements (CSO & CTB) NOTICE The Society of Cable Telecommunications Engineers (SCTE) / International Society of Broadband Experts
Interface Practices Subcommittee SCTE STANDARD Composite Distortion Measurements (CSO & CTB) NOTICE The Society of Cable Telecommunications Engineers (SCTE) / International Society of Broadband Experts
Module 8 VIDEO CODING STANDARDS. Version 2 ECE IIT, Kharagpur
 Module 8 VIDEO CODING STANDARDS Lesson 24 MPEG-2 Standards Lesson Objectives At the end of this lesson, the students should be able to: 1. State the basic objectives of MPEG-2 standard. 2. Enlist the profiles
Interface Practices Subcommittee SCTE STANDARD SCTE Measurement Procedure for Noise Power Ratio
 Interface Practices Subcommittee SCTE STANDARD SCTE 119 2018 Measurement Procedure for Noise Power Ratio NOTICE The Society of Cable Telecommunications Engineers (SCTE) / International Society of Broadband
Music Source Separation
 Music Source Separation Hao-Wei Tseng Electrical and Engineering System University of Michigan Ann Arbor, Michigan Email: blakesen@umich.edu Abstract In popular music, a cover version or cover song, or