Somewhere over the Rainbow How to Make Effective Use of Colors in Statistical Graphics
|
|
|
- Rosamond Mosley
- 5 years ago
- Views:
Transcription

1 Somewhere over the Rainbow How to Make Effective Use of Colors in Statistical Graphics Achim Zeileis
2 Introduction Zeileis A, Hornik K, Murrell P (2009). Escaping RGBland: Selecting Colors for Statistical Graphics. Computational Statistics & Data Analysis, 53(9), doi: /j.csda Stauffer R, Mayr GJ, Dabernig M, Zeileis A (2015). Somewhere over the Rainbow: How to Make Effective Use of Colors in Meteorological Visualizations. Bulletin of the American Meteorological Society, 96(2), doi: /bams-d Ihaka R, Murrell P, Hornik K, Fisher J, Stauffer R, Zeileis A (2016). colorspace: Color Space Manipulation. R package version Overview:
3 Introduction Color: Integral element in graphical displays. Easily available in statistical software. Omnipresent in (electronic) publications: Technical reports, electronic journal articles, presentation slides. Problem: Little guidance about how to choose appropriate colors for a particular visualization task. Question: What are useful color palettes for coding qualitative and quantitative variables?
4 Introduction Main goal of our work: Raise awareness of the issue. Introduce Hue-Chroma-Luminance (HCL) model. Based on human perception. Better control for choosing color palettes. Provide convenient software for exploring and assessing HCL-based palettes.
famous rainbow color")
5 RGB rainbow RGB color space: And the (in)famous rainbow color palette.
famous rainbow color")
6 RGB rainbow = RGB color space: And the (in)famous rainbow color palette.
7 RGB rainbow RGB rainbow 1.0 RGB rainbow spectrum RGB Red Green Blue Desaturated
8 RGB rainbow RGB rainbow RGB rainbow spectrum RGB Red Green Blue Desaturated The default color in many software packages. Conveniently used by many practitioners. Defaults only change slowly (if at all). Question: Everybody does it why should it be wrong?
9 What s wrong? Original figure as published by the NOAA ( ).
10 What s wrong? Gradients: Very strong. Original figure as published by the NOAA ( ).
11 What s wrong? Gradients: Very strong. Saturation: Highly-saturated colors. Original figure as published by the NOAA ( ).
12 What s wrong? Gradients: Very strong. Saturation: Highly-saturated colors. Discontinuous: Bright, dark, bright, dark,... Original figure as published by the NOAA ( ).
.")
13 What s wrong? Gradients: Very strong. Saturation: Highly-saturated colors. Discontinuous: Bright, dark, bright, dark,... Original figure as published by the NOAA ( ). Basic guidelines: Colors should be assisting, simple, clear, appealing.
14 What s wrong? Desaturated version of the original figure.
15 What s wrong? Assignment: No longer unique. Desaturated version of the original figure.
16 What s wrong? Assignment: No longer unique. Interpretation: Where is the maximum? Desaturated version of the original figure.
17 What s wrong? Assignment: No longer unique. Interpretation: Where is the maximum? Focus: On dark artefacts. Desaturated version of the original figure.

18 What s wrong? Assignment: No longer unique. Interpretation: Where is the maximum? Focus: On dark artefacts. Desaturated version of the original figure. Color should: Work everywhere, guide to important information.
19 What s wrong? What color-blind people see (red-green weakness). About 5% of all Europeans are affected.
20 What s wrong? End user: Who is it? Consider: Visual constraints? What color-blind people see (red-green weakness). About 5% of all Europeans are affected.
. About 5% of all Europeans are affected.")
21 What s wrong? End user: Who is it? Consider: Visual constraints? What color-blind people see (red-green weakness). About 5% of all Europeans are affected. Color should: Consider end user needs.
22 Challenges Summary: The colors in a palette should be simple and natural, not be unappealing, highlight the important information, not mislead the reader, work everywhere and for everyone.
23 Challenges Summary: The colors in a palette should be simple and natural, not be unappealing, highlight the important information, not mislead the reader, work everywhere and for everyone. In practice: People often do not think about it at all.... and simply use default colors.
24 Challenges Summary: The colors in a palette should be simple and natural, not be unappealing, highlight the important information, not mislead the reader, work everywhere and for everyone. In practice: People often do not think about it at all.... and simply use default colors. Potential problems: For end users reviewer, supervisor, colleague, customer. For your own day-to-day work.
25 HCL rainbow A HCL rainbow HCL rainbow spectrum HCL Hue Chroma Luminance Desaturated Hue: Type of color. Chroma: Colorfulness. Luminance: Brightness.
26 HCL color space Perceptually-based color model: Hue Hue: Type of color. Chroma Chroma: Colorfulness. Luminance Luminance: Brightness.
27 HCL version Same information, HCL-based color palette.

28 HCL version Colors: Smooth gradients. Information: Guiding, no hidden information. Works: Screen, projector, gray-scale device. Same information, HCL-based color palette.
29 HCL version Colors: Smooth gradients. Information: Guiding, no hidden information. Works: Screen, projector, gray-scale device. Same information, HCL-based color palette (red-green weakness).
30 HCL version Same information, HCL-based color palette (desaturated). Colors: Smooth gradients. Information: Guiding, no hidden information. Works: Screen, projector, gray-scale device.
31 HCL version Assignment: Higher values (more precipitation) lower luminance. Same information, HCL-based color palette (desaturated).
32 HCL version Same information, HCL-based color palette (desaturated). Assignment: Higher values (more precipitation) lower luminance. Focus: Lead readers to most important areas.
33 HCL version Same information, HCL-based color palette (desaturated). Assignment: Higher values (more precipitation) lower luminance. Focus: Lead readers to most important areas. Summary: Solved a lot of problems by changing the color palette.
34 Experiences with practitioners In the beginning: Hesitation of colleagues. Not necessary! Why should we change existing products? Everybody does it like this...
35 Experiences with practitioners In the beginning: Hesitation of colleagues. Not necessary! Why should we change existing products? Everybody does it like this... A few days later: Mainly positive feedback Decrease of misinterpretations in classroom ( Weather and Forecast ). Much easier to interpret... How can I make use of those palettes (in my software)?
36 Experiences with practitioners In the beginning: Hesitation of colleagues. Not necessary! Why should we change existing products? Everybody does it like this... A few days later: Mainly positive feedback Decrease of misinterpretations in classroom ( Weather and Forecast ). Much easier to interpret... How can I make use of those palettes (in my software)? Visit

37 Experiences with practitioners
38 Experiences with practitioners In R: HCL color space: hcl() or polarluv() in colorspace. HCL-based palettes in colorspace: rainbow_hcl(), heat_hcl(), sequential_hcl(), diverge_hcl(),... Interactive exploration: choose_palette() (in Tcl/Tk) or hclwizard() (in shiny). Further useful packages: RColorBrewer (fixed palettes from ColorBrewer.org), ggplot2,...
39 Color vision and color spaces Human color vision is hypothesized to have evolved in three stages: 1 Light/dark (monochrome only). 2 Yellow/blue (associated with warm/cold colors). 3 Green/red (associated with ripeness of fruit). Yellow Green Red Blue
40 Color vision and color spaces Due to these three color axes, colors are typically described as locations in a 3-dimensional space, often by mixing three primary colors, e.g., RGB or CIEXYZ. Physiological axes do not correspond to natural perception of color but rather to polar coordinates in the color plane: Hue (dominant wavelength). Chroma (colorfulness, intensity of color as compared to gray). Luminance (brightness, amount of gray). Perceptually based color spaces try to capture these three axes of the human perceptual system.
41 Color space: HCL HCL space: Perceptually based color space, polar coordinates in CIELUV space. Specification: Triplet (H, C, L) with H = 0,..., 360 and C, L = 0,..., 100. Shape: Distorted double cone. Problem: Care is needed when traversing along the axes due to distorted shape. In R: hcl() or polarluv() in colorspace.

42 Color space: HCL
43 Color space: HCL

44 Color space: HCL

45 Color palettes: Qualitative Goal: Code qualitative information. Solution: Use different hues for different categories. Keep chroma and luminance fixed, e.g., (H, 50, 70) Remark: The admissible hues (within HCL space) depend on the values of chroma and luminance chosen.
46 Color palettes: Qualitative
47 Color palettes: Qualitative Hues can be chosen from different subsets of [0, 360] to create different moods or as metaphors for the categories they code (Ihaka, 2003). dynamic [30, 300] harmonic [60, 240] cold [270, 150] warm [90, 30]
48 Color palettes: Qualitative Illustrations: Pie chart of seats in the German parliament Bundestag, Mosaic display of votes for the German Bundestag, Scatter plot with three clusters (and many points). Colors: Palettes are constructed based on HSV space, especially by varying hue. Problems: Flashy colors: Good for drawing attention to a plot but hard to look at for a longer time. Large areas of saturated colors: Can produce distracting after-image effects.
49 Color palettes: Qualitative SPD CDU/CSU Gruene Linke FDP
50 Color palettes: Qualitative SPD CDU/CSU Gruene Linke FDP
51 Color palettes: Qualitative Schleswig Holstein Hamburg Niedersachsen Bremen CDU/CSU FDP SPD Gr Li Nordrhein Westfalen Hessen Rheinland Pfalz Bayern Baden Wuerttemberg Saarland Mecklenburg Vorpommern Brandenburg Sachsen Anhalt Berlin Sachsen Thueringen
52 Color palettes: Qualitative Schleswig Holstein Hamburg Niedersachsen Bremen CDU/CSU FDP SPD Gr Li Nordrhein Westfalen Hessen Rheinland Pfalz Bayern Baden Wuerttemberg Saarland Mecklenburg Vorpommern Brandenburg Sachsen Anhalt Berlin Sachsen Thueringen
53 Color palettes: Qualitative
54 Color palettes: Qualitative
55 Color palettes: Sequential Goal: Code quantitative information. Intensity/interestingness i ranges in [0, 1], where 0 is uninteresting, 1 is interesting. Solution: Code i by increasing amount of gray (luminance), no color used, e.g., (H, 0, 90 i 60) The hue H does not matter, chroma is set to 0 (no color), luminance ranges in [30, 90], avoiding the extreme colors black and white. Modification: In addition, code i by colorfulness (chroma). Thus, more formally: for a fixed hue H. (H, 0 + i C max, L max i (L max L min )

56 Color palettes: Sequential
57 Color palettes: Sequential Modification: To increase the contrast within the palette even further, simultaneously vary the hue as well: (H 2 i (H 1 H 2 ), C max i p1 (C max C min ), L max i p2 (L max L min )). To make the change in hue visible, the chroma needs to increase rather quickly for low values of i and then only slowly for higher values of i. A convenient transformation for achieving this is to use i p instead of i with different powers for chroma and luminance.
58 Color palettes: Sequential
59 Color palettes: Sequential Illustrations: Heatmap of bivariate kernel density estimate for Old Faithful geyser eruptions data. Palettes: rainbow() heat.colors() heat_hcl() (color and desaturated)

60 Color palettes: Sequential

61 Color palettes: Sequential

62 Color palettes: Sequential
63 Color palettes: Sequential
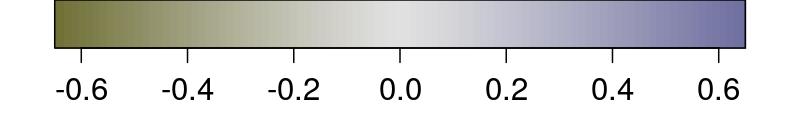
64 Color palettes: Diverging Goal: Code quantitative information. Intensity/interestingness i ranges in [ 1, 1], where 0 is uninteresting, ±1 is interesting. Solution: Combine sequential palettes with different hues. Remark: To achieve both large chroma and/or large luminance contrasts, use hues with similar chroma/luminance plane, e.g., H = 0 (red) and H = 260 (blue).

65 Color palettes: Diverging
66 Color palettes: Diverging
67 Color palettes: Diverging Illustrations: Map of Nigeria shaded by posterior mode estimates for childhood mortality. Model-based mosaic display for treatment of arthritis. Palettes: rainbow() vs. diverge_hcl()
68 Color palettes: Diverging
69 Color palettes: Diverging
70 Color blindness Problem: A few percent of humans (particularly males) have deficiencies in their color vision, typically referred to as color blindness. Specifically: The most common forms of color blindness are different types of red-green color blindness: deuteranopia (lack of green-sensitive pigment), protanopia (lack of red-sensitive pigment). Solution: Construct suitable HCL colors. Use large large luminance contrasts (visible even for monochromats). Use chroma contrasts on the yellow-blue axis (visible for dichromats). Check colors by emulating dichromatic vision, e.g., utilizing dichromat (Lumley 2006).
71 Color blindness
72 Color blindness

73 Color blindness
74 Color blindness
75 Color blindness
76 Color blindness
77 Color blindness

78 Color blindness
79 Summary Choice of colors: Use color with care, do not overestimate power of color. Think about who the readers/users are. Avoid large areas of flashy, highly-saturated colors. Employ monotonic luminance scale for numerical data. Try it yourself: colorspace in R.
80 References Zeileis A, Hornik K, Murrell P (2009). Escaping RGBland: Selecting Colors for Statistical Graphics. Computational Statistics & Data Analysis, 53, doi: /j.csda Stauffer R, Mayr GJ, Dabernig M, Zeileis A (2015). Somewhere over the Rainbow: How to Make Effective Use of Colors in Meteorological Visualizations. Bulletin of the American Meteorological Society, 96(2), doi: /bams-d Ihaka R, Murrell P, Hornik K, Fisher JC, Stauffer R, Zeileis A (2016). colorspace: Color Space Manipulation. R package version Ihaka R (2003). Colour for Presentation Graphics. In K Hornik, F Leisch, A Zeileis (eds.), Proceedings of the 3rd International Workshop on Distributed Statistical Computing, Vienna, Austria, ISSN X, Lumley T (2006). Color Coding and Color Blindness in Statistical Graphics. ASA Statistical Computing & Graphics Newsletter, 17(2), 4 7. http: // Wilke CO (2018). Color Scales. In: Fundamentals of Data Visualization. O Reilly Media, Forthcoming.
Escaping RGBland: Selecting Colors for Statistical Graphics
 Escaping RGBland: Selecting Colors for Statistical Graphics Achim Zeileis Kurt Hornik Paul Murrell http://statmath.wu-wien.ac.at/~zeileis/ Overview Motivation Statistical graphics and color Color vision
A Toolbox for Manipulating and Assessing Color Palettes for Statistical Graphics
 A Toolbox for Manipulating and Assessing Color Palettes for Statistical Graphics Achim Zeileis, Jason C. Fisher, Kurt Hornik, Ross Ihaka, Claire D. McWhite, Paul Murrell, Reto Stauffer, Claus O. Wilke
HCL-Based Color Palettes in R
 HCL-Based Color Palettes in R Achim Zeileis Universität Innsbruck Kurt Hornik WU Wirtschaftsuniversität Wien Paul Murrell The University of Auckland Abstract The package colorspace provides various functions
CSE Data Visualization. Color. Jeffrey Heer University of Washington
 CSE 512 - Data Visualization Color Jeffrey Heer University of Washington Color in Visualization Identify, Group, Layer, Highlight Colin Ware Purpose of Color To label To measure To represent and imitate
Murdoch redux. Colorimetry as Linear Algebra. Math of additive mixing. Approaching color mathematically. RGB colors add as vectors
 Murdoch redux Colorimetry as Linear Algebra CS 465 Lecture 23 RGB colors add as vectors so do primary spectra in additive display (CRT, LCD, etc.) Chromaticity: color ratios (r = R/(R+G+B), etc.) color
Understanding Human Color Vision
 Understanding Human Color Vision CinemaSource, 18 Denbow Rd., Durham, NH 03824 cinemasource.com 800-483-9778 CinemaSource Technical Bulletins. Copyright 2002 by CinemaSource, Inc. All rights reserved.
The theory of data visualisation
 The theory of data visualisation V2017-10 Simon Andrews, Phil Ewels simon.andrews@babraham.ac.uk phil.ewels@scilifelab.se Data Visualisation A scientific discipline involving the creation and study of
The Art and Science of Depiction. Color. Fredo Durand MIT- Lab for Computer Science
 The Art and Science of Depiction Color Fredo Durand MIT- Lab for Computer Science Color Color Vision 2 Talks Abstract Issues Color Vision 3 Plan Color blindness Color Opponents, Hue-Saturation Value Perceptual
Automatic Testing of Color Blindness
 Automatic Testing of Color Blindness S. Dey 1, S. Roy 2 and K. Roy 3 1 Dept. of IT, Camellia Institute of Technology 2 Dept. of Biotech & Medical Engg., NIT Rourkella 3 Dept. of Comp. Sc., West Bengal
Visual Encoding Design
 CSE 442 - Data Visualization Visual Encoding Design Jeffrey Heer University of Washington A Design Space of Visual Encodings Mapping Data to Visual Variables Assign data fields (e.g., with N, O, Q types)
Get to Know Germany COLORING & ACTIVIT Y BOOK
 Get to Know Germany COLORING & ACTIVIT Y BOOK Bakery Bäckerei Germany s states Deutschlands Bundesländer Schleswig- Holstein Mecklenburg-Vorpommern Bremen Hamburg Niedersachsen Brandenburg Berlin Bäckerei
Color in Information Visualization
 Color in Information Visualization James Bernhard April 2012 Color serves different purposes in art and in information visualization: In art, color is used for creative and expressive purposes In information
Colour Features in Adobe Creative Suite
 Colour Features in Adobe Creative Suite HSB Based on the human perception of color, the HSB model describes three fundamental characteristics of color: Hue, Saturation, Brightness Hue Color reflected from
Mapping: Methods & Tips
 61 Mapping: Methods & Tips Color Design for the Color Vision Impaired Bernhard Jenny Institute of Cartography ETH Zurich, Switzerland jenny@karto.baug.ethz.ch Nathaniel Vaughn Kelso The Washington Post
Using the NTSC color space to double the quantity of information in an image
 Stanford Exploration Project, Report 110, September 18, 2001, pages 1 181 Short Note Using the NTSC color space to double the quantity of information in an image Ioan Vlad 1 INTRODUCTION Geophysical images
Fundamentals of Multimedia. Lecture 3 Color in Image & Video
 Fundamentals of Multimedia Lecture 3 Color in Image & Video Mahmoud El-Gayyar elgayyar@ci.suez.edu.eg Mahmoud El-Gayyar / Fundamentals of Multimedia 1 Black & white imags Outcomes of Lecture 2 1 bit images,
Color Reproduction Complex
 Color Reproduction Complex 1 Introduction Transparency 1 Topics of the presentation - the basic terminology in colorimetry and color mixing - the potentials of an extended color space with a laser projector
Why visualize data? Advanced GDA and Software: Multivariate approaches, Interactive Graphics, Mondrian, iplots and R. German Bundestagswahl 2005
 Advanced GDA and Software: Multivariate approaches, Interactive Graphics, Mondrian, iplots and R Why visualize data? Looking for global trends overall structure Looking for local features data quality
[source unknown] Cornell CS465 Fall 2004 Lecture Steve Marschner 1
![[source unknown] Cornell CS465 Fall 2004 Lecture Steve Marschner 1](/thumbs/80/81460800.jpg "[source unknown] Cornell CS465 Fall 2004 Lecture Steve Marschner 1") [source unknown] 2004 Steve Marschner 1 What light is Light is electromagnetic radiation exists as oscillations of different frequency (or, wavelength) [Lawrence Berkeley Lab / MicroWorlds] 2004 Steve
[source unknown] 2004 Steve Marschner 1 What light is Light is electromagnetic radiation exists as oscillations of different frequency (or, wavelength) [Lawrence Berkeley Lab / MicroWorlds] 2004 Steve
Statistics for Engineers
 Statistics for Engineers ChE 4C3 and 6C3 Kevin Dunn, 2013 kevin.dunn@mcmaster.ca http://learnche.mcmaster.ca/4c3 Overall revision number: 19 (January 2013) 1 Copyright, sharing, and attribution notice
Overview of Information Presentation Technologies for Visually Impaired and Applications in Broadcasting
 Overview of Information Presentation Technologies for Visually Impaired and Applications in Broadcasting It has been over 60 years since television broadcasting began in Japan. Today, digital broadcasts
https://mediasolutions.ericsson.com/cms/wpcontent/uploads/2017/10/ibc pdf Why CbCr?
 Disclaimers: Credit for images is given where possible, apologies for any omissions The optical demonstrations slides may not work on the target monitor / projector The HDR images have been tonemapped
Edge-Aware Color Appearance. Supplemental Material
 Edge-Aware Color Appearance Supplemental Material Min H. Kim 1,2 Tobias Ritschel 3,4 Jan Kautz 2 1 Yale University 2 University College London 3 Télécom ParisTech 4 MPI Informatik 1 Color Appearance Data
ggplot and ColorBrewer Nice plots with R November 30, 2015
 ggplot and ColorBrewer Nice plots with R November 30, 2015 ggplot ggplot2 ggplot is an advanced plotting system for R. The current version is ggplot2 (http://ggplot2.org/). It is not in the base installation
Supplemental Material: Color Compatibility From Large Datasets
 Supplemental Material: Color Compatibility From Large Datasets Peter O Donovan, Aseem Agarwala, and Aaron Hertzmann Project URL: www.dgp.toronto.edu/ donovan/color/ 1 Unmixing color preferences In the
Color Reproduction Complex
 Color Reproduction Complex -1 - JENOPTIK LDT GmbH Andreas Deter Dr. Wolfram Biehlig IPS Valencia 2004 Expanded Color Space Basic terms in colorimetry and color mixing User benefit of laser projection with
Power saving in LCD panels
 Power saving in LCD panels How to save power while watching TV Hans van Mourik - Philips Consumer Lifestyle May I introduce myself Hans van Mourik Display Specialist Philips Consumer Lifestyle Advanced
A Handbook of Statistical Analyses Using R. Brian S. Everitt and Torsten Hothorn
 A Handbook of Statistical Analyses Using R Brian S. Everitt and Torsten Hothorn Preface ThisbookisintendedasaguidetodataanalysiswiththeRsystemforstatistical computing. R is an environment incorporating
Research on Color Reproduction Characteristics of Mobile Terminals
 Applied Mechanics and Materials Submitted: 2014-09-14 ISSN: 1662-7482, Vol. 731, pp 80-86 Accepted: 2014-11-19 doi:10.4028/www.scientific.net/amm.731.80 Online: 2015-01-29 2015 Trans Tech Publications,
Computer Graphics. Raster Scan Display System, Rasterization, Refresh Rate, Video Basics and Scan Conversion
 Computer Graphics Raster Scan Display System, Rasterization, Refresh Rate, Video Basics and Scan Conversion 2 Refresh and Raster Scan Display System Used in Television Screens. Refresh CRT is point plotting
Recap of Last (Last) Week
 Week") Recap of Last (Last) Week 1 The Beauty of Information Visualization Napoléon s Historical Retreat 2 Course Design Homepage: have you visited and registered? 3 The Value of Information Visualization Have
Recap of Last (Last) Week 1 The Beauty of Information Visualization Napoléon s Historical Retreat 2 Course Design Homepage: have you visited and registered? 3 The Value of Information Visualization Have
DCI Memorandum Regarding Direct View Displays
 1. Introduction DCI Memorandum Regarding Direct View Displays Approved 27 June 2018 Digital Cinema Initiatives, LLC, Member Representatives Committee Direct view displays provide the potential for an improved
Congratulations to the Bureau of Labor Statistics for Creating an Excellent Graph By Jeffrey A. Shaffer 12/16/2011
 Congratulations to the Bureau of Labor Statistics for Creating an Excellent Graph By Jeffrey A. Shaffer 12/16/2011 The Bureau of Labor Statistics (BLS) has published some really bad graphs and maps over
Analysis and Improvement of the Open- StreetMap Street Color Scheme for Users with Color Vision Deficiencies
 Analysis and Improvement of the Open- StreetMap Street Color Scheme for Users with Color Vision Deficiencies Johannes Kröger, Jochen Schiewe, Beate Weninger HafenCity Universität Hamburg Abstract. In this
Introduction & Colour
 Introduction & Colour Eric C. McCreath School of Computer Science The Australian National University ACT 0200 Australia ericm@cs.anu.edu.au Overview Computer Graphics Uses Basic Hardware and Software Colour
Spearhead Display. How To Guide
 Spearhead Display The Tektronix color tool set has always been about allowing the user to marry the Art & Science irrespective of the color space they are working in. How To Guide How To Guide Figure 1.
Visual Imaging and the Electronic Age Color Science
 Visual Imaging and the Electronic Age Color Science Color Gamuts & Color Spaces for User Interaction Lecture #7 September 13, 2016 Donald P. Greenberg Describing Color in XYZ Luminance Y Chromaticity x
University of Bristol - Explore Bristol Research. Peer reviewed version. Link to published version (if available): /ICIP.2016.
: /ICIP.2016.") Mercer Moss, F., Zhang, F., Baddeley, R. J., & Bull, D. R. (2017). What's on TV: A large scale quantitative characterisation of modern broadcast video content. In 2016 IEEE International Conference on
Mercer Moss, F., Zhang, F., Baddeley, R. J., & Bull, D. R. (2017). What's on TV: A large scale quantitative characterisation of modern broadcast video content. In 2016 IEEE International Conference on
Man-Machine-Interface (Video) Nataliya Nadtoka coach: Jens Bialkowski
 Nataliya Nadtoka coach: Jens Bialkowski") Seminar Digitale Signalverarbeitung in Multimedia-Geräten SS 2003 Man-Machine-Interface (Video) Computation Engineering Student Nataliya Nadtoka coach: Jens Bialkowski Outline 1. Processing Scheme 2. Human
Seminar Digitale Signalverarbeitung in Multimedia-Geräten SS 2003 Man-Machine-Interface (Video) Computation Engineering Student Nataliya Nadtoka coach: Jens Bialkowski Outline 1. Processing Scheme 2. Human
Colour Reproduction Performance of JPEG and JPEG2000 Codecs
 Colour Reproduction Performance of JPEG and JPEG000 Codecs A. Punchihewa, D. G. Bailey, and R. M. Hodgson Institute of Information Sciences & Technology, Massey University, Palmerston North, New Zealand
Achieve Accurate Critical Display Performance With Professional and Consumer Level Displays
 Achieve Accurate Critical Display Performance With Professional and Consumer Level Displays Display Accuracy to Industry Standards Reference quality monitors are able to very accurately reproduce video,
Visual Imaging and the Electronic Age Color Science
 Visual Imaging and the Electronic Age Color Science Color Gamuts & Color Spaces for User Interaction Lecture #7 September 15, 2015 Donald P. Greenberg Chromaticity Diagram The luminance or lightness axis,
Quantify. The Subjective. PQM: A New Quantitative Tool for Evaluating Display Design Options
 PQM: A New Quantitative Tool for Evaluating Display Design Options Software, Electronics, and Mechanical Systems Laboratory 3M Optical Systems Division Jennifer F. Schumacher, John Van Derlofske, Brian
Objectives. Explain perception Analyze color perception Analyze vision Relate perception with color models
 Color Perception Ayse Kalkan-Savoy NSF GK-12 Fellow Vibes and Waves in Action Center for Advanced Computation and Telecommunications University of Massachusetts Lowell Objectives Explain perception Analyze
Essence of Image and Video
 1 Essence of Image and Video Wei-Ta Chu 2009/9/24 Outline 2 Image Digital Image Fundamentals Representation of Images Video Representation of Videos 3 Essence of Image Wei-Ta Chu 2009/9/24 Chapters 2 and
Graphical Perception. Graphical Perception. Graphical Perception. Which best encodes quantities? Jeffrey Heer Stanford University
 CS448B :: 7 Oct 2010 Graphical Perception Graphical Perception Jeffrey Heer Stanford University Graphical Perception The ability of viewers to interpret visual (graphical) encodings of information and
A Study on the Psychology of Color Perception In Color Palettes & Color Pickers
 A Study on the Psychology of Color Perception In Color Palettes & Color Pickers S. M. Fazlul Hoque Department of Computer and Systems Sciences The Royal Institute of Technology (KTH) Stockholm, Sweden
DRAFT. Proposal to modify International Standard IEC
 Imaging & Color Science Research & Product Development 2528 Waunona Way, Madison, WI 53713 (608) 222-0378 www.lumita.com Proposal to modify International Standard IEC 61947-1 Electronic projection Measurement
LCD and Plasma display technologies are promising solutions for large-format
 Chapter 4 4. LCD and Plasma Display Characterization 4. Overview LCD and Plasma display technologies are promising solutions for large-format color displays. As these devices become more popular, display
DCI Requirements Image - Dynamics
 DCI Requirements Image - Dynamics Matt Cowan Entertainment Technology Consultants www.etconsult.com Gamma 2.6 12 bit Luminance Coding Black level coding Post Production Implications Measurement Processes
MATH 214 (NOTES) Math 214 Al Nosedal. Department of Mathematics Indiana University of Pennsylvania. MATH 214 (NOTES) p. 1/3
 Math 214 Al Nosedal. Department of Mathematics Indiana University of Pennsylvania. MATH 214 (NOTES) p. 1/3") MATH 214 (NOTES) Math 214 Al Nosedal Department of Mathematics Indiana University of Pennsylvania MATH 214 (NOTES) p. 1/3 CHAPTER 1 DATA AND STATISTICS MATH 214 (NOTES) p. 2/3 Definitions. Statistics is
MATH 214 (NOTES) Math 214 Al Nosedal Department of Mathematics Indiana University of Pennsylvania MATH 214 (NOTES) p. 1/3 CHAPTER 1 DATA AND STATISTICS MATH 214 (NOTES) p. 2/3 Definitions. Statistics is
Inventions on color selections in Graphical User Interfaces
 From the SelectedWorks of Umakant Mishra November, 2005 Inventions on color selections in Graphical User Interfaces Umakant Mishra Available at: https://works.bepress.com/umakant_mishra/31/ Inventions
LED Light Achieves The Colour Rendering Of Sunlight. Hubert Ott Technical Marketing Director Lighting Avnet Silica
 LED Light Achieves The Colour Rendering Of Sunlight Hubert Ott Technical Marketing Director Lighting EMEA @ Avnet Silica The Evolution of Light The latest mass market technology is the LED. Records, Records,
Chapter 5. Describing Distributions Numerically. Finding the Center: The Median. Spread: Home on the Range. Finding the Center: The Median (cont.
 Chapter 5 Describing Distributions Numerically Copyright 2007 Pearson Education, Inc. Publishing as Pearson Addison-Wesley Copyright 2007 Pearson Education, Inc. Publishing as Pearson Addison-Wesley Slide
Television History. Date / Place E. Nemer - 1
 Television History Television to see from a distance Earlier Selenium photosensitive cells were used for converting light from pictures into electrical signals Real breakthrough invention of CRT AT&T Bell
Discreet Logic Inc., All Rights Reserved. This documentation contains proprietary information of Discreet Logic Inc. and its subsidiaries.
 Discreet Logic Inc., 1996-2000. All Rights Reserved. This documentation contains proprietary information of Discreet Logic Inc. and its subsidiaries. No part of this documentation may be reproduced, stored
Frequencies. Chapter 2. Descriptive statistics and charts
 An analyst usually does not concentrate on each individual data values but would like to have a whole picture of how the variables distributed. In this chapter, we will introduce some tools to tabulate
Hue, Value and Intensity
 Art 148, Color theory Course Outline Spring 2015 Petrosky Wed. 01/21/15 Review syllabus, course outline and material requirements. Show Student project examples of color wheels. Bring all materials next
Package Polychrome. R topics documented: November 20, 2017
 Title Qualitative Palettes with Many Colors Version 1.0.0 Date 2017-11-18 Author Kevin R. Coombes, Guy Brock Package Polychrome November 20, 2017 Tools for creating, viewing, and assessing qualitative
Television and video engineering
 Television and video engineering Unit-4a Colour Television Chapter 1 Introduction to Colour TV We all know how pleasing it is to see a picture in natural colours or watch a colour film in comparison with
9/27/14. Color part 2. Today s Class. Mini- Presenta;ons. Jesse, Greg, Q. Readings for Today Today s Crayon Exercise
 Color part 2 Today s Class Mini- Presenta;ons Jesse, Greg, Q Readings for Today Today s Crayon Exercise 1 9/27/14 Today s Class Mini- Presenta;ons Jesse, Greg, Q Readings for Today Today s Crayon Exercise
ICC Color Symposium. Soft Proofing Revisit and Reborn. Chris Bai Senior Color Expert BenQ. 22/10/2018 Hong Kong. Organizers
 ICC Color Symposium 22/10/2018 Hong Kong Soft Proofing Revisit and Reborn Chris Bai Senior Color Expert BenQ Organizers Overview What is Soft Proofing? What is needed for Soft Proofing? Why monitor is
!"#"$%& Some slides taken shamelessly from Prof. Yao Wang s lecture slides
 http://ekclothing.com/blog/wp-content/uploads/2010/02/spring-colors.jpg Some slides taken shamelessly from Prof. Yao Wang s lecture slides $& Definition of An Image! Think an image as a function, f! f
STAT 113: Statistics and Society Ellen Gundlach, Purdue University. (Chapters refer to Moore and Notz, Statistics: Concepts and Controversies, 8e)
") STAT 113: Statistics and Society Ellen Gundlach, Purdue University (Chapters refer to Moore and Notz, Statistics: Concepts and Controversies, 8e) Learning Objectives for Exam 1: Unit 1, Part 1: Population
STAT 113: Statistics and Society Ellen Gundlach, Purdue University (Chapters refer to Moore and Notz, Statistics: Concepts and Controversies, 8e) Learning Objectives for Exam 1: Unit 1, Part 1: Population
ROY G BIV COLOR VISION EXPLORED
 1/13/2017 ROY G BIV COLOR VISION EXPLORED * Learning Objectives: 1. State which three color sensitive receptors are present in the human eye 2. Explain the differences between congenital & acquired color
Improving Color Text Sharpness in Images with Reduced Chromatic Bandwidth
 Improving Color Text Sharpness in Images with Reduced Chromatic Bandwidth Scott Daly, Jack Van Oosterhout, and William Kress Digital Imaging Department, Digital Video Department Sharp aboratories of America
Principles of Data Visualization. Jeffrey University of Washington
 Principles of Data Visualization Jeffrey Heer @jeffrey_heer University of Washington Data Analysis & Statistics, Tukey & Wilk 1966 Four major influences act on data analysis today: 1. The formal theories
Vannevar Bush: As We May Think
 Vannevar Bush: As We May Think 1. What is the context in which As We May Think was written? 2. What is the Memex? 3. In basic terms, how was the Memex intended to work? 4. In what ways does personal computing
ILDA Image Data Transfer Format
 ILDA Technical Committee Technical Committee International Laser Display Association www.laserist.org Introduction... 4 ILDA Coordinates... 7 ILDA Color Tables... 9 Color Table Notes... 11 Revision 005.1,
Ch. 1: Audio/Image/Video Fundamentals Multimedia Systems. School of Electrical Engineering and Computer Science Oregon State University
 Ch. 1: Audio/Image/Video Fundamentals Multimedia Systems Prof. Ben Lee School of Electrical Engineering and Computer Science Oregon State University Outline Computer Representation of Audio Quantization
Journal of Chemical and Pharmaceutical Research, 2015, 7(3): Research Article
: Research Article") Available online www.jocpr.com Journal of Chemical and Pharmaceutical Research, 2015, 7(3):555-563 Research Article ISSN : 0975-7384 CODEN(USA) : JCPRC5 Application of color matching in the design of network
Available online www.jocpr.com Journal of Chemical and Pharmaceutical Research, 2015, 7(3):555-563 Research Article ISSN : 0975-7384 CODEN(USA) : JCPRC5 Application of color matching in the design of network
INTRODUCTION TO GRAPHICS. Color Vision Simulator Examples
 INTRODUCTION TO GRAPHICS Color Perception Information Color Vision Simulator Examples Information Sheet No. XXXX Vischeck s color vision model allows you to simulate how the world looks to people with
How to use the NATIVE format reader Readmsg.exe
 How to use the NATIVE format reader Readmsg.exe This document describes summarily the way to operate the program Readmsg.exe, which has been created to help users with the inspection of Meteosat Second
Preventing Illegal Colors
 Test Equipment Depot - 800.517.8431-99 Washington Street Melrose, MA 02176 - TestEquipmentDepot.com Preventing Illegal Colors Application Note Color gamut compliance is important to ensure faithful reproduction
VISUAL MILL LAB. SECTION 1: Complete the following tests and fill out the appropriate sections on your Visual Mill Color Deficit Worksheet.
 VISUAL MILL LAB Visual Mill is available on the two computers in the neuroscience lab (NEURO5 & NEURO6). Make sure that the monitor is set to normal color function part 2 will have you adjust the monitor
Getting My Art Talk On Lesson 2
 Critical Learning Elements and principles of design are everywhere. Elements and principles of design are used to communicate. Guiding Questions What are the elements and principles of design? How will
Real-time body tracking of a teacher for automatic dimming of overlapping screen areas for a large display device being used for teaching
 CSIT 6910 Independent Project Real-time body tracking of a teacher for automatic dimming of overlapping screen areas for a large display device being used for teaching Student: Supervisor: Prof. David
Tradeoffs in information graphics 1. Andrew Gelman 2 and Antony Unwin Oct 2012
 Tradeoffs in information graphics 1 Andrew Gelman 2 and Antony Unwin 3 27 Oct 2012 The visual display of quantitative information (to use Edward Tufte s wonderful term) is a diverse field or set of fields,
Computer and Machine Vision
 Computer and Machine Vision Introduction to Continuous Camera Capture, Sampling, Encoding, Decoding and Transport January 22, 2014 Sam Siewert Video Camera Fundamentals Overview Introduction to Codecs
Wide Color Gamut SET EXPO 2016
 Wide Color Gamut SET EXPO 2016 31 AUGUST 2016 Eliésio Silva Júnior Reseller Account Manager E/ esilvaj@tek.com T/ +55 11 3530-8940 M/ +55 21 9 7242-4211 tek.com Anatomy Human Vision CIE Chart Color Gamuts
Colors. Matthew Woehlke
 Matthew Woehlke 2 Contents 1 Colors 4 1.1 Scheme Management.................................... 4 1.2 Edit or Create Schemes................................... 4 1.2.1 Color Scheme Options...............................
Calibration Best Practices
 Calibration Best Practices for Manufacturers By Tom Schulte SpectraCal, Inc. 17544 Midvale Avenue N., Suite 100 Shoreline, WA 98133 (206) 420-7514 info@spectracal.com http://studio.spectracal.com Calibration
K-EYE K10 & K20 HCR OPERATING MODES
 K-EYE K10 & K20 HCR Channels 10/2018 OPERATING MODES The projector has 4 operating modes: Raw Mode, HSV, RGB emulation and CMY emulation. Raw Mode enables specific control of each color. HSV Mode is based
Fundamentals of Studio Art I
 Fundamentals of Studio Art I Overview This studio art course offers a survey of methods and materials associated with student art creation. Focus will be on basic instruction in drawing, painting, printmaking,
UNIVERSITY OF MASSACHUSETTS Department of Biostatistics and Epidemiology BioEpi 540W - Introduction to Biostatistics Fall 2002
 1 UNIVERSITY OF MASSACHUSETTS Department of Biostatistics and Epidemiology BioEpi 540W - Introduction to Biostatistics Fall 2002 Exercises Unit 2 Descriptive Statistics Tables and Graphs Due: Monday September
CSE Data Visualization. Graphical Perception. Jeffrey Heer University of Washington
 CSE 512 - Data Visualization Graphical Perception Jeffrey Heer University of Washington Design Principles [Mackinlay 86] Expressiveness A set of facts is expressible in a visual language if the sentences
TECHNICAL SUPPLEMENT FOR THE DELIVERY OF PROGRAMMES WITH HIGH DYNAMIC RANGE
 TECHNICAL SUPPLEMENT FOR THE DELIVERY OF PROGRAMMES WITH HIGH DYNAMIC RANGE Please note: This document is a supplement to the Digital Production Partnership's Technical Delivery Specifications, and should
Package colorpatch. June 10, 2017
 Type Package Package colorpatch June 10, 2017 Title Optimized Rendering of Fold Changes and Confidence s Shows color patches for encoding fold changes (e.g. log ratios) together with confidence values
Processing. Electrical Engineering, Department. IIT Kanpur. NPTEL Online - IIT Kanpur
 NPTEL Online - IIT Kanpur Course Name Department Instructor : Digital Video Signal Processing Electrical Engineering, : IIT Kanpur : Prof. Sumana Gupta file:///d /...e%20(ganesh%20rana)/my%20course_ganesh%20rana/prof.%20sumana%20gupta/final%20dvsp/lecture1/main.htm[12/31/2015
7thSense Design Delta Media Server
 7thSense Design Delta Media Server Channel Alignment Guide: Warping and Blending Original by Andy B Adapted by Helen W (November 2015) 1 Trademark Information Delta, Delta Media Server, Delta Nano, Delta
Getting Started with the LabVIEW Sound and Vibration Toolkit
 1 Getting Started with the LabVIEW Sound and Vibration Toolkit This tutorial is designed to introduce you to some of the sound and vibration analysis capabilities in the industry-leading software tool
Chapter 10. Lighting Lighting of Indoor Workplaces 180
 Chapter 10 Lighting 10.1 Lighting of Indoor Workplaces 180 10 10 Lighting 10.1 Lighting of Indoor Workplaces In March 2003, the German version of the European Standard EN 12464-1 Lighting of workplaces,
ILDA Image Data Transfer Format
 INTERNATIONAL LASER DISPLAY ASSOCIATION Technical Committee Revision 006, April 2004 REVISED STANDARD EVALUATION COPY EXPIRES Oct 1 st, 2005 This document is intended to replace the existing versions of
Calibration of Colour Analysers
 DK-Audio A/S PM5639 Technical notes Page 1 of 6 Calibration of Colour Analysers The use of monitors instead of standard light sources, the use of light from sources generating noncontinuous spectra) Standard
Graphical User Interface for Modifying Structables and their Mosaic Plots
 Graphical User Interface for Modifying Structables and their Mosaic Plots UseR 2011 Heiberger and Neuwirth 1 Graphical User Interface for Modifying Structables and their Mosaic Plots Richard M. Heiberger
USER MANUAL. VP-425 PC / Component to HDMI Scaler MODEL: P/N: Rev 3
 KRAMER ELECTRONICS LTD. USER MANUAL MODEL: VP-425 PC / Component to HDMI Scaler P/N: 2900-300111 Rev 3 Contents 1 Introduction 1 2 Getting Started 2 2.1 Achieving the Best Performance 2 2.2 Safety Instructions
colors AN INTRODUCTION TO USING COLORS FOR UNITY v1.1
 colors AN INTRODUCTION TO USING COLORS FOR UNITY v1.1 Q&A https://gamelogic.quandora.com/colors_unity Knowledgebase Online http://gamelogic.co.za/colors/documentation-andtutorial// Documentation API http://www.gamelogic.co.za/documentation/colors/
Circular Statistics Applied to Colour Images
 Circular Statistics pplied to Colour Images llan Hanbury PRIP, TU Wien, Favoritenstraße 9/183, -1040 Vienna, ustria hanbury@prip.tuwien.ac.at bstract Three methods for summarising the characteristics of
ELEMENTS AND PRINCIPLES OF DESIGN
 ELEMENTS AND PRINCIPLES OF DESIGN The Elements of Design The Elements of Design (what we see): Line Shape & Form Colour Texture Space Proportion Line Lines have direction: A linear mark on a page vertical,
Media Information. Trade fairs and conferences supra-regional regional. Frankfurt/Main, Heimtextil. Essen,
 Publication Schedule 1 st Semester Actual circulation calculated on the annual average (1 st July 2016 30 th June ) 19,259 copies, 14,907 of them subscribed copies! Important information for painters and