BumbleBee-TABLET. UMPC Spectrum Analyzer manual version 1.5
|
|
|
- Ronald Hawkins
- 5 years ago
- Views:
Transcription

1 BumbleBee-TABLET UMPC Spectrum Analyzer manual version 1.5
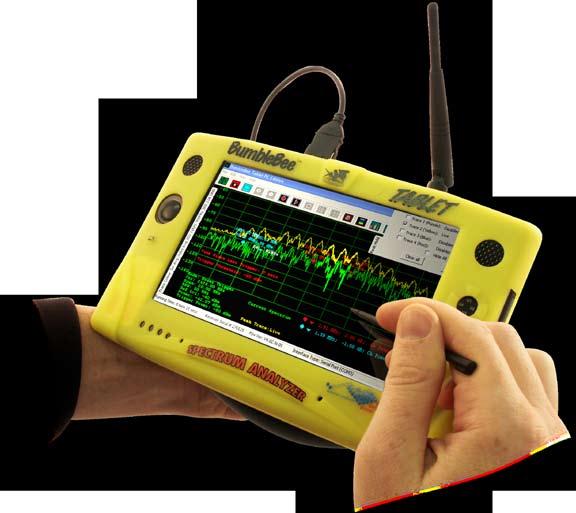
2 BumbleBee-TABLET Interface Hardware user s manual BumbleBee-TABLET/BumbleBee-TABLET Interface Hardware Unpacking Your BumbleBee-TABLET... 2 About Your BumbleBee-TABLET... 3 Powering Your BumbleBee-TABLET... 3 OpeningYour BumbleBee-TABLET... 3 Optional Direction Finding Antenna Specifications... 4 BumbleBee-TABLET Accessories Sheet... 5 BumbleBee-TABLET Data Sheet... 5 BumbleBee-TABLET Interface Software user s manual 1. Establishing connection between BumbleBee Receiver and BumbleBee Tablet Software Description of Toolbar buttons Description of the Tab Options Frequency Control Power Trigger Mode Reference Level Resolution Bandwidth Markers Peak Hold Trace Averaging Bin Averaging Presets Channel Power Measurements Using Markers Using the Selection Tool Examples of Channel Power Measurement Capabilities Using the Trigger Mode Recording and Replaying a Spectrum Log File User-defined Presets IMPORTANT NOTES ON THE BUMBLEBEE TABLET PC IMPORTANT NOTE: Please disable the Wireless LAN Radio and the Bluetooth Transmitter on the Tablet PC to minimize interference with the BumbleBee Receiver before you establish a connection. 1


3 Unpacking Your BumbleBee-TABLET BumbleBee-TABLET protective case & Samsung Q1 UMPC Tablet Documentation includes software CD-ROM, user s manual and claibration certificate Samsung Q1 UMPC Tablet & BumbleBee- TABLET user s manual and software Unpack and assemble your BumbleBee-TABLET unit as shown. Your BumbleBee-TABLET is a self-contained spectrum analyzer. The user interface (Samsung Q1 UMPC Tablet), antenna and power connections are all accessible, but there is usually no need to open the protective, yellow rubber casing. The tablet may be disconnected and removed and batteries changed by users but the other components should only be accessed by Berkeley technicians. Removing such components will void your hardware warranty. Please consult the included Samsung Q1 documentation for complete operating instructions, troubleshooting and tips of tablet PC. When you open your yellow, hard, protective case you will see the BumbleBee-TABLET unit with receiver hidden below it, included antenna (frequency depending upon model ordered), spare Ni-MH AA batteries, CF serial communication card, tablet power/charging adapter and BumbleBee receiver Ni-MH battery charger. BumbleBee-TABLET shown with all available options below 2

4 BumbleBee-TABLET FRONT VIEW SMA Male Antenna Input Warning: Maximum input 0 dbm NO DC Input BumbleBee-TABLET Receiver CF Serial Communication Cable About Your BumbleBee-TABLET Some basic operations can be easily accessed on the tablet s face with the protective rubber sleeve still on the unit. The stereo speakers are located on either side of unit. The joystick plays the same role as the arrow keys on your keyboard and can also be toggled to move the cursor similarly to using a mouse. The auto-scaler button toggles between 3 different screen resolutions on the tablet s LCD. The status indicators display current tablet active features such as hard drive, Wi-Fi (be sure your tabet s Wi-Fi radio is OFF when taking measurements), power/charging and screen backlight in iconic form. At the bottom are 2 array microphones. The menu button launches various OS menus. The enter button runs the currently selected item. The quick launch button allows the user to create hot keys for instant launching of the most popular applications. Other buttons and features including power, monitor out, USB, DC power jack, etc. are found on the top and Tablet All ports and air ventilation should be easily accessed through the tablet s protective rubber sleeve still on the unit. Never block or modify the vents as it could overheat your tablet UMPC. Working down from the left view of the tablet, you will see the external ODD power port, the USB port, headphone jack, volume control button and hold switch. Working over from the left side at the top of the tablet, you will see the stylus holder, air vent, power/av station switch, CF card slot and wired LAN port. Working down from the right view of the tablet, you will see the VGA monitor port, USB port and DC-in power jack. 3

 Frequency 890-960 MHz Gain 9 dbi")


 Mounting 2 in. (50.")


5 Optional Direction Finding Antenna Specifications 900 MHz Direction Finding Yagi 900 MHz Omni-Directional (9.5 long) Frequency MHz Gain 9 dbi Polarization Horizontal or Vertical Horizontal Beam Width 54 Vertical Beam Width 48 Front to Back Ratio 14 db Impedance 50 Ohm Max. Input Power 100 Watts VSWR < 1.5:1 avg. Elements 5 Weight 1.5 lbs. (0.7 kg) Length 19.6 in. (0.5 m) Mounting 2 in. (50.8 mm) diameter mast max. Operating Temperature -40 C to to 85 C (-40 F to 185 F) Lightning Protection DC Short Connector N-Female 2.4 GHz Direction Finding Corner Reflector 2.4 GHz Omni-Directional (7.5 long) 4.9/5 GHz Direction Finding Corner Reflector 4.9/5 GHz Omni-Directional (5.5 long) 4

 SMA male to female P/N bbpad30 $ 30.")


6 Accessories for your 12VDC to 110VAC car cigarette lighter power inverter 75 Watts output P/N BB-12V $ OPTIONAL 900 MHz DF Yagi Antenna with mounting bracket, cable & SMA male 9 dbi gain P/N 900-Y $ OPTIONAL 4.9/5 GHz Direction Finding Antenna with mounting bracket, cable & SMA male 9 dbi gain P/N 5NE $ OPTIONAL 30 db attenuator pad for use with directional antennas (between DF antenna & BumbleBee) SMA male to female P/N bbpad30 $ OPTIONAL Bumble Bee-TABLET STANDARD Ni-MH Fast-Charger 4 AA 6 V P/N NIMH-001 $ Rugged Carrying Case ABS Plastic P/N P-CASE $ GHz Omni Antenna SMA male swivel P/N S151AM-2450S $ STANDARD Data Playback Windows PC Software $ OPTIONAL Honeycomb Interference Mapping Software Ask for a Quote OPTIONAL STANDARD 2.4 GHz Direction Finding Antenna with mounting bracket, cable & SMA male 9 dbi gain P/N 2ND $ OPTIONAL OPTIONAL MHz Omni Antenna SMA male swivel P/N C191AM-925 $ STANDARD 4.9/5 GHz Omni Antenna SMA male swivel Co-Linear Dipole 5 dbi VSWR 1.8:1 P/N K181AM-5250S $ STANDARD

 users to map interference using BVS receiver technology.")


7 HONEYCOMB TM RF Interference-Mapping Site Surveys C H NEY M B 1 Create Survey Maps: HoneyComb Projector (PC) Import any image file of a floorplan or site Create a distance projection Add simple objects to image Add custom objects to floorplan Scale and crop image Save for use in Collector and Analyzer Use Yellowjacket b/g PLUS receiver hardware for handheld surveys anywhere in the world. Honeycomb allows either BumbleBee- TABLET users or BumbleBee handheld (ipaq) users to map interference using BVS receiver technology. HoneyComb is Windows XP (Tablet/PC or ipaq/pc) interferencemapping software designed for use with the BumbleBee -TABLET spectrum analyzer system. It consists of three parts: Projector, Collector, and Analyzer. Sources of interference can be separated from WLAN signals, allowing the user to graph severity of interference, percentage of channel capacity remaining and other significant interference related quantities. HoneyComb aids in locating jamming interference, unintentional interference and network intrusion as well as channel verification. HoneyComb will also map all likely signal sources and strengths for helping to clear RF free zones. Floorplans or site maps can be used as a reference to collect data leaving the resulting interference maps to be overlayed onto floorplans for easy identification of interference prone areas. 2 Instant RF Surveys: Honeycomb Collector (ipaq) Save multiple data files while using same projection file Ability to choose up to b/a/g channels Adjust duration of scan Adjust period of scan for each channel Automatically saves data to file Take screen snapshots of any site Saves data for further analysis in HoneyComb Analyzer Shows walk/drive path Access information on any point at any time 3Plot Interference Analysis: Honeycomb Analyzer (PC) Imports data from other Honeycomb applications Detect/Separate interference from Wi-Fi signals Interference severity and channel Plot and view interference-related problems Wi-Fi channel capacity for intrusion detection Plot and view RF free zones Print and export plots into bmp files Create a HTML report for any survey area OPTIONAL SOFTWARE AVAILABLE FOR YOUR BUMBLEBEE

8 1. Establishing a Connection with the receiver: Double click the BumbleBee Tablet icon on the desktop to start the software. Ensure that the USB cable is properly connected to both, the Tablet PC and the BumbleBee Receiver. Once this is done, click on the toolbar to connect to the BumbleBee Receiver. The connection box pops up with the USB device listed in the list box. Fig 1: USB Connection Select the listing which indicates that the product is a BUMBLEBEE TABLET and click OK. On clicking OK, the software will establish a connection with the BumbleBee Receiver. Once connection is successful, the receiver will be set in the default spectrum mode which is centered at 2425 MHz and spans 50 MHz with a Resolution Bandwidth of 50 KHz and a Receiver reference level of 20 dbm.. 7

9 2 Description of Tool Bar Buttons: 2.1 Connection: This button is establishes a connection with the hardware as discussed above. 2.2 Snapshot: This button takes a snapshot of the application window. The snapshot can be saved either as a jpeg or a bmp at any location. 2.3 Selection Tool: This button is used to select an area on the Display to measure spectral power within the selected area or to zoom into the selected area. This button is first clicked, then the mouse is dragged while keeping the Left Button down, over the desired Spectral Region and that area is highlighted. Spectral Power within this selected region is calculated and displayed as shown: 2.4 Zoom In: Fig 2: Spectrum Selection This button zooms into a selected area. 2.5 Zoom Out: This button zooms out from a previously zoomed in region. 8

10 2.6 Record/ Log Spectrum: Once in the Spectrum Mode or the Trigger Spectrum Mode, the Spectrum Data being viewed on the Screen may be logged by clicking this button. The Logged File is saved with the spl extension. 2.7 Replay the Logged Spectrum for post-processing/analysis: This button selects BumbleBee Tablet Log Files (with extension spl) and replays them for postprocessing and analysis. Once the playback begins, this button changes in appearance to. Clicking this changed button freezes the playback and the button becomes button again to resume normal playback. in appearance again. Click this 2.8 Stop Recording/Playback: Stop the current recording or playback. 2.9 Fast Forward: The replay speed is doubled. Click this button again to resume normal playback Rewind: The play back is reversed at doubled speed. Click this button again to resume normal playback. NOTE: For detailed explanation on Logging and re-playing a Spectrum Log File, see page Print Preview & Print. This prints out the current Spectrum Display. The Display can be printed out either in True Color: A true snapshot of the Display screen is printed as seen on the Display (with the Black Background); or in Econo Color: A snapshot of the Display is taken and printed against a white background or in Black and White: A Black and White print out is taken (i.e. Black foreground against a white background). The options can be changed in the File menu by Clicking on Print Color Options. Once clicked, the following Dialog Box pops up. Then select the option of choice and then click OK and click preview of the screen. see a Fig 3: Print Color Selection Options Dialog 9
 print out.")
11 Fig 4: A Print Preview for a Black and White (Monochrome) print out. Fig 5: An Econo Color Print Preview Option 10


12 Fig 6: A true Color Print 2.12 Spectrogram Display: Fig 7.1: Burst of Microwave Energy from a Microwave oven. Fig 7.2: Persistence of a Direct Sequence Spread Spectrum Signal; from an b AP 11

13 The Spectrogram Display shows the power gradient of the last 100 spectral sweeps. The Power Gradient is plotted with Past Instances vs. the Current Span. The spectrogram is displayed using the colors given on the Color Bar. The Colors in the Color Bar represent the power values between the defined Maximum and Minimum power values. By selecting either or the corresponding values can be changed by clicking the buttons. Any power value greater than the Maximum Power value set is represented by WHITE color in the spectrogram while, any power value lesser than the set Minimum Power value is represented by BLACK. The Spectrogram can also be displayed for Spectrum being replayed from BumbleBee Tablet Log Files Histogram Display: This displays the Histogram Display for the current waveform. The Histogram displays the percentage of time that the power in each frequency bin is above the threshold. Fig 8: Histogram Display of an RFID waveform. 12

14 2.14 Interference Analyst: The Interference Analyst is a collection of waveforms of most commonly used digital modulation and transmission techniques in the 900 MHz, 2.4 GHz and 5.8 GHz frequency bands. The Interference Analyst provides visual representation and description of waveforms of Direct Sequency Spread Spectrum (DSSS), Frequency Hopping Spread Spectrum (FHSS), Orthogonal Frequency Division Multiplexing (OFDM), Microwave oven Power Leakage. It also provides visual images of what the Spectrum looks like when one transmission scheme interferes with another. The Interference Analyst is very useful for users who do not have a good understanding of the above mentioned digital modulation and transmission schemes. It can be a handy feature for them to detect and identify the type of device transmitting on a particular channel. Fig 9: Interference Analyst Display of a Narrow Band waveform Create a User defined Spectrum Preset by saving a Spectrum Context File Re-Open a saved Spectrum Context File to trigger a User-defined Spectrum Preset. 13

15 3. Tab Options: The Tabs on the Left and Right hand edge of the application window form the Control and Data Panel for the BumbleBee Tablet PC Software. Tapping on a Tab with the Stylus will make it pop out on the screen. Tapping outside the Tab will cause the popped up Tab to slide back and hide. 3.1 Frequency Control Panel: Fig 10: Frequency Control Panel The Frequency Control Panel allows the user to set the Center Frequency and the Span of the Spectrum Analyzer. To set the Center Frequency 1. Click the Radio Button for the Center Frequency. 2. Click Clear to delete the value shown. 3. Enter the Center Frequency value in the Text Box. 4. Select the units (KHz/MHz). 3. Click Set. To set the Span, repeat the steps 2 through 5 after clicking selecting Span. 14

16 IMPORTANT NOTE: 1. The Center Frequency has to be within the Frequency Band supported by the BumbleBee Receiver. 2. The Span is divided equally on both the sides of the Center Frequency. 3. The software performs Span Checking to make sure that the span does not exceed the bounds of the Frequency Band supported by the BumbleBee Receiver. For example: For a BumbleBee which supports the 2400 MHz 2500 MHz frequency band, if the current center frequency is 2480 MH,. the maximum span which can be set would be 40 MHz. The Legend on the bottom of the window is explained as below: 3.2 Trigger Mode: The Swept Spectrum Mode can be slow in detecting and measuring bursts of signal energy. This is because when the receiver scans a certain portion of the spectrum, it will miss a burst of signal energy such as a frequency hop of a Frequency Hopping device on a nearby frequency. In the Swept Spectrum Mode, the only time the receiver will detect and measure signal energy is when the burst of signal energy occurs at the frequencies the BumbleBee receiver is currently scanning. This problem can be particularly compounded if the Sweep Span is large and the resolution bandwidth is small. As a solution to this problem, the BumbleBee Receiver has a Power Trigger Mode. In this mode, the user can set a power threshold for the receiver to trigger on, every time the channel power exceeds this threshold. This way, the receiver captures bursts of signal energy occurring over a 20 MHz channel bandwidth whenever the Channel Power within this 20 MHz channel exceeds the Power Threshold. In addition to this, the user can set a delay so that the receiver will measure the channel power only after the amount of specified delay following a trigger. This setting ensures that the RF energy of the desired portion of the data packet is measured. 15
17 Fig 11: Trigger Mode Settings: The Direct Sequence Spread Spectrum Waveform above shows the presence of an B Access Point. To Set the Receiver to Trigger on a Channel Power greater than the Power Threshold: 1. Set the Receiver Reference Level. 2. Set the center frequency of the channel. This can be done either using the Frequency Control panel or the Preset Panels. IMPORTANT: The Span must be set to 20 MHz. 3. Tap the stylus on the Trigger Tab to pop up the Trigger Panel. 4. Set the Trigger Threshold power to within 20 db of the current Reference Level Click Set Trigger to Set the BumbleBee Receiver to Trigger on a Channel Power greater than the Power Threshold. 6. To change any Spectrum parameter when the unit is in trigger mode, Stop the Trigger, make the desired setting and then click Set Trigger again. 7. A Trigger Delay in Micro Seconds can be entered to set the receiver to measures the spectrum after the delay following the channel power exceeding the power threshold. 16
18 IMPORTANT NOTES: 1. The Trigger is only applied for a maximum Span of 20 MHz. Set the Center Frequency to a suitable value and then set the Span to 20 MHz. 2. The Trigger Threshold Power must be within 20 db of the Reference Level. If the Threshold value is below 20 db of the Reference Level, the BumbleBee Receiver will not trigger. To adjust the threshold level greater than 20 db below the reference level, lower the reference level and then adjust the trigger threshold. 3. Stop the Trigger by clicking Stop Trigger to exit the Trigger Mode and resume the normal Spectrum Mode. IMPORTANT TIPS WHILE USING THE TRIGGER MODE: The trigger mode will trigger when the power in a 20 MHz channel exceeds the set power threshold. The presets can be very helpful in conjunction with the trigger mode. Select a channel using the Preset tabs. Set the Reference Level and the Resolution Bandwidth. Set a threshold value to be within AT MOST 20 db below the reference level. Start the trigger. The receiver will now trigger on the preset channel. Click Stop Trigger to stop the trigger. 17

19 3.3 Reference Level: The Dynamic Range of Power measurement of the BumbleBee can be changed by varying the Reference Level of the Receiver. The Reference Level Settings for the BumbleBee Receiver can be changed from 20 dbm to 70 dbm in steps of 10 db. For measuring very strong signals the reference level can be set to a high value like 20 dbm while low power signals can be measured by setting the reference level to 70 dbm. Hence when the Reference level has been set to 20 dbm, the receiver can measure signals with a maximum value of 20 dbm. If the reference level is a low value compared to the value of the received signal, the signals are subjected to clipping as seen in Fig 13. IMPORTANT NOTE: Fig 12: Reference Level Settings When using the Trigger Mode, the Reference Level setting must be at most 20 db above the set Power Threshold value otherwise the BumbleBee Receiver will not trigger. 18

20 3.4 Resolution Bandwidth: The BumbleBee measures the energy present within the frequency bins. The width of each bin is equal to the Resolution bandwidth. Fig 13.1 Burst of Signal Energy as observed using a 100 KHz resolution bandwidth. Fig 13.2 Burst of Signal Energy as observed using a 500 KHz resolution bandwidth. The Resolution Bandwidth of the trace shown in Fig 14.2 is 500 KHz. Each point in the spectrum above represents the total energy present in a frequency bin 500 KHz wide. A lower Resolution Bandwidth is very useful in accurately capturing and measuring individual frequency components within the spectrum. However, for a large span, a smaller Resolution Bandwidth would result in a longer sweep time. A higher Resolution Bandwidth can be used for a large span to reduce the sweep time. A Resolution Bandwidth greater than or equal to the bandwidth of the signal can be used to measure the Channel Power. 19

21 3.5 Markers/Delta Markers Fig 14: Markers/Delta Markers Settings This Tab Panel can be used to set Markers/Delta Markers on the Spectral waveform at desired frequencies to measure power at that frequency. The Marker/Delta can be positioned either on the Active Trace, the Peak Hold Trace or the Average Trace provided those traces are active and not frozen IMPORTANT: The Selection feature must be disabled. If the button is, then click the button again to restore it to and disable the Selection feature. In order to set the Marker and the Delta: 1. Click on the Marker Tab Panel to set the Marker. 2. Then tap the stylus on the spectrum at the point of interest. This will set the Marker ( ) at the desired point. 3. Click on the Marker Panel to set the Delta. 4. Then again tap the stylus at some point away from the Marker to place the Delta at that point. 5. The Frequency and the Power at the Marker and the Delta will be displayed just above them as shown below. 6. If the Markers need to be placed on the Peak Hold or the Average Trace, click the respective button on the Marker Settings Panel. This will cause the markers to shift from the Active SpectrumTrace to the selected Trace. To set the Markers back to the Active Spectrum Trace, click Active Spectrum Trace on the Marker Settings Panel. 20

22 7. If the Marker/Delta have been positioned on the Peak Hold Trace or the Average Trace, the markers will shift on the Active Spectrum Trace the moment the Peak Hold or the Average Trace is disabled. 8. Click to position the markers on the Peak value of the trace on which they have been set. 9. Click to position the markers on the Center Frequency of the trace on which they have been set. 10. Click to shift the Marker/Delta to the left and click to shift the Marker/Delta on the right of the trace on which they have been set. Fig 15.1: Marker/Delta Marker Fig Marker/Delta Info Fig 15.2 shows the measurements between the Maker and the Delta. The Red Marker/Delta pair is 2.51 MHz apart with the Delta being 6 db above the Marker. The Channel Power between the Marker and the Delta marker is dbm. Similarly the Blue Marker/Delta marker pair is MHz apart, with the Delta being 41 db below the Marker. The Channel Power between them is dbm. 21

23 3.6 Peak Hold Traces: Up to four traces, each, which traces the Peak Power in the Live Sweep waveform, can be set. However, only one of these four traces can be active at a given time. An active trace can be frozen by clicking the Freeze button for further analysis. If a peak trace is frozen, a new trace can be activated by clicking the corresponding check box, without disabling the frozen trace. Clicking Hide check box can hide the traces. Fig 4 shows the Peak traces in detail. Fig 16 Peak Traces 22

24 3.7 Trace Averaging: Trace Averaging is useful to obtain a trace, which is the average of the last N traces. This is helpful in reducing Noise in signals that are continuous to obtain a smooth trace with fewer variations. Noncontinuous signals can be filtered with Adjacent Bin Averaging discussed later. When Trace Averaging is selected, a dialog box as shown on the left hand will pop-up. The desired number of traces to be averaged can be increased or decreased using the up/down arrow buttons. Fig 5 shows the trace averaged over the last 7 sweeps Fig 17.1: The trace in OLIVE color is the trace representing NO Averaging. Fig 17.2: The above trace contains points which are an average of the last 5 trace points. 23

25 3.8 Adjacent Bin Averaging: Adjacent Bin Averaging is also called Video Smoothing. This technique uses the adjacent-point averaging to reduce the amount of fluctuation in the measured trace due to the noise. N points of a trace are averaged together to produce each point. This reduces fluctuations in Noise and smoothes the trace. However, the user has to apply good judgment over the amount of smoothing to be applied as excessive smoothing could lead to loss of the desired information, with the waveform conveying nothing. Fig 18.2 displays the live trace smoothed over 6 consecutive adjacent bins. Fig 18.1: The White trace represents a waveform with no adjacent bin averaging 24

26 Fig 18.2: The White trace represents the average trace over 6 consecutive adjacent bins of the active trace. The above figure demonstrates the use of Video Averaging. The Fig 18.3 shows the waveform with no averaging; Fig 18.4 shows a waveform with 4 adjacent bin averaged, while Fig 18.5 shows a waveform with 8 adjacent bins averaged. It must be noted that lack of good judgment while using Video Averaging can cause a loss of information. This can be seen in Fig 18.5 which seems to be over-averaged. The Fig 18.4 shows a good use of the video averaging feature with 4 adjacent bins being averaged. This not only eliminates the rapid noise fluctuations, but also retains the signal amplitude, which happens to be the information of interest. 3.9 Presets: Presets allow the user to set the spectral parameters for channels of interest without manually setting all the parameters. Presets are a One Button Selection for changing channels for various wireless standards. The figure below shows the Presets for the B/BG standard. Check the desired channel. IMPORTANT TIPS WHILE USING THE TRIGGER MODE: The trigger mode will trigger when the power in a 20 MHz channel exceeds the set power threshold. The presets can be very helpful in conjunction with the trigger mode. Select a channel using the Preset tabs. Set the Reference Level and the Resolution Bandwidth. Set a threshold value to be within AT MOST 20 db below the reference level. Start the trigger. The receiver will now trigger on the preset channel. Click Stop Trigger to stop the trigger. 25

27 Fig 19: B/G Channel Presets 26

28 4. Channel Power Measurements using the BumbleBee Tablet software Measurement of channel power is an important application of the BumbleBee Tablet software and this can be done in three different ways. 4.1 Using Frequency Markers and Delta Markers: By setting the Markers and Delta Markers as described in 4.4 on page 11, power will be calculated in the Spectrum between the marker and the delta marker. 4.2 Selecting a portion of the Spectrum Display: By selecting a portion of the Display using the Selection tool as described on page 10, The spectral power within the selected region is calculated and displayed within the selection in the color corresponding to the trace whose power it represents. The measurement is only made on the live trace (GREEN). Power for the Peak and Average Traces is not measured. Measurement stops if the selected region is cleared. Examples of Channel Power Measurement Capabilities: Fig 20.1: Wideband FM Signal centered at 2451 MHz with a power of dbm 27

29 The Figure above shows a Wideband Frequency Modulated signal with a center frequency of 2451 MHz and a span of approximately 11 MHz. The Channel Power can be measured by clicking on and then dragging the stylus across the spectrum. It should be noted that when you click, the button will change to. To assign a channel to the selected region, tap and hold the stylus on the screen for a couple of seconds. A pop-up menu will drop down and when you click Channel 1, for example, the selected region will be set to channel 1. This will ensure that if you tap the stylus on the display thereafter, the selected region for Channel 1 will not get disrupted until you again tap the stylus on the screen and check off Channel 1 from the pop-up menu. To stop selections, click which will then disable the selection tool and return the button to. Fig 20.1: Narrowband unmodulated Signal with a peak power of 31 dbm. Upon turning the Frequency Modulation off, it can be seen that the spectrum consists of a single peak at the center frequency of the previous Frequency Modulated signal. The Red Marker on the Peak indicates a Peak power of 31 dbm. This is in agreement to the principles of modulation that the power in the modulated signal is the same as the power in the unmodulated signal. 28

30 Fig 20.2: power measurement of a 3 channel multicarrier CDMA waveform. The Figure above shows the power measurement of a 3 channel, multicarrier CDMA waveform. For demonstration purposes, this is simulated using a CDMA signal source within the 2.4GHz frequency band. The signal generated has a total channel power of 40 dbm. The BumbleBee Tablet PC accurately captures and measures this signal power as can be seen below. Measurement of Power from a GSM Signal in the 900 MHz frequency band. The BumbleBee Tablet PC software can accurately capture and measure power from a GMSK modulated GSM Signal in the 900 MHz band. A GSM Signal is narrow band signal (~ 200 KHz), the following procedure should be followed to capture and measure GSM Signals: 1. Set the span to a low value: about 2 3 MHz. 2. Center the frequency to the frequency of the desired channel. 3. Set the Resolution bandwidth to either 50KHz or 100 KHz. 4. After setting the Reference Level to a desirably suitable value, set the receiver to trigger on a certain power threshold. 5. Turn the Peak trace on. You will then gradually be able to see the spectral envelope of the GSM signal, which alternates between several narrow band signals in the 200 KHz bandwidth. 6. By clicking, drag the stylus across the Peak GSM Signal. Hold the stylus for a couple of seconds on the screen to be able to set the selected region to Channel The Signal power will then be displayed within the selected region. 29

 Packets from")
31 4.3 Power Trigger Mode: The Power Trigger Mode is a useful mode, in which, the receiver triggers only when the channel power exceeds a certain threshold, which is set by the user. If the user has set a value for the measurement delay, the receiver will take measurements only after that delay time. The device will trigger when the detected channel power exceeds the set power threshold. This mode is useful in detecting activity from noncontinuous transmission sources such as Beacon packets from an AP or Frequency Hopping Spread Spectrum (FHSS) Packets from a Bluetooth device or any other Narrow band or CW signal. Important Note: The trigger mode can be set only for a 20 MHz channel. 30

32 Fig 21: The Power Trigger Mode: A Direct Sequence Spread Spectrum Signal Possibly from an B Access Point. The BumbleBee receiver has been set to trigger at 50 dbm with no delay in measurement. 31

33 5.1 Recording/Creating a Spectrum Log File for Future Playback: Fig 22: Creating and Saving a Spectrum Log File. Once in the Spectrum Mode or the Trigger Spectrum Mode, the Spectrum being observed on the display can be logged in a Log File for future analysis. This is done by clicking the toolbar. Save the Log File at a desired location. (Record) button on the NOTE: The log file will be created and stored with a.spl extension. Once logging begins, the Current Log File size (in Bytes) and the Current duration (in Minutes) of the file logged on the Display portion of the Spectrum are shown: To stop the logging, simply click the (Stop) Button. This does not stop the current spectrum display. 32
 can be replayed by clicking the (playback) button.")

34 5.2 Replaying the Logged File: Fig 23: Replaying a previously Logged File. A previously logged file (with extension spl) can be replayed by clicking the (playback) button. The replay begins and the replay progress can be seen as a red progress bar on the bottom left of the display as shown in the Fig 3.2 above and the figure below: Using the and buttons, the playback can be forwarded or rewound respectively at higher speeds, so as to jump to points of interest within the logged spectrum display quicker. To stop the playback, click the (Stop) button. 33

35 5.3 User-defined Presets: A particular spectral context of interest can be saved in a file at the click of the above tool-bar button for future access. This provides for user-defined presets for quck-access in situations when certain spectral settings need to be changed frequently. Upon clicking the Save Context button the current spectrum analyzer settings which can be saved in a file: the software displays Fig 24: Create a user-defined preset by saving a Spectrum Context to a file. Upon clicking the Set Context button on the settings display dialog, the settings can be saved to a file at a desired location. This saved context file can later be invoked by clicking the button on the toolbar to set the BumbleBee spectrum analyzer to operate in that context. This way, the user can store frequently visited contexts and later revisit them conveniently without having to change the settings often. 34
36 IMPORTANT NOTES In order to eliminate known sources of interference with the BumbleBee Tablet Receiver, please ensure that the Wireless LAN Radio and the Bluetooth transmitter are disabled before using the software. The Software, along with the Billionton CF Card Drivers are installed on the Tablet at the following location: C:\ProgramFiles\BVS\BumbleBee Tablet Edition. If there is ever any problem in getting the software to talk to the BumbleBee Receiver, please uninstall and re-install the Billionton CF Card Drivers. Before replaying of a Previously logged spectrum file begins, if the software is talking to the receiver, the software will terminate the connection to the Receiver through the CF Card. In order to begin active spectrum analysis again, the connection will have to be re-established as discussed in the manual. When the BumbleBee receiver is being used with Batteries, the software will monitor the battery charge and will terminate the application if the batteries drop low on charge. A notification message will be displayed before the software terminates. This is done to protect the batteries from draining completely. The CF Card must be securely connected to the cable and the cable must be securely connected to the BumbleBee Receiver through the round connector. Loose cable connection can be a major problem while using the BumbleBee Tablet Software. Please remove the CF card from the CF Card slot on the BumbleBee Tablet before replacing the batteries on the BumbleBee Receiver. Use Fully charged batteries in the BumbleBee Receiver and charge the BumbleBee Tablet before running the software for a longer duration of usage. When the batteries in the BumbleBee Receiver fall low on charge and need to be recharged, the BumbleBee Tablet software will shut down after a 30 second warning message. When using the BumbleBee with an external power supply, ensure that the Green power indicator LED turns on when the power supply is connected. The default power settings cause the Tablet PC to turn off and hibernate after 15 minutes. For better performance, set the Tablet PC power options to optimize performance. This can be done by: Start Menu>>Control Panel>>Power Options. 35
USB Mini Spectrum Analyzer User s Guide TSA5G35
 USB Mini Spectrum Analyzer User s Guide TSA5G35 Triarchy Technologies, Corp. Page 1 of 21 USB Mini Spectrum Analyzer User s Guide Copyright Notice Copyright 2011 Triarchy Technologies, Corp. All rights
Cisco Spectrum Expert Software Overview
 CHAPTER 5 If your computer has an 802.11 interface, it should be enabled in order to detect Wi-Fi devices. If you are connected to an AP or ad-hoc network through the 802.11 interface, you will occasionally
JD725A Cable and Antenna Analyzer - Dual Port
 COMMUNICATIONS TEST & MEASUREMENT SOLUTIONS JD725A Cable and Antenna Analyzer - Dual Port Key Features Portable and lightweight handheld instrument Built-in wireless frequency bands as well as the most
Yellow Frog. Manual Version 1.1
 Yellow Frog Manual Version 1.1 1 YellowFrog Contents PC Requirements...... 2 YellowFrog Power Meter Measurement.... 3 YellowFrog PC Software..... 3 Main Screen....... 4 Input Overload....... 5 Battery
Tektronix RSA306 USB Spectrum Analyzer
 Tektronix RSA306 USB Spectrum Analyzer Simple Demos The Demo of the RSA306 is easy. Even you do not have signal generators, devices under test, or demo boards, using the whip antenna provided in box, you
USB Mini Spectrum Analyzer User Manual TSA Program for PC TSA4G1 TSA6G1 TSA8G1
 USB Mini Spectrum Analyzer User Manual TSA Program for PC TSA4G1 TSA6G1 TSA8G1 Triarchy Technologies Corp. Page 1 of 17 USB Mini Spectrum Analyzer User Manual Copyright Notice Copyright 2013 Triarchy Technologies,
USB Mini Spectrum Analyzer User Manual PC program TSA For TSA5G35 TSA4G1 TSA6G1 TSA12G5
 USB Mini Spectrum Analyzer User Manual PC program TSA For TSA5G35 TSA4G1 TSA6G1 TSA12G5 Triarchy Technologies, Corp. Page 1 of 17 USB Mini Spectrum Analyzer User Manual Copyright Notice Copyright 2013
Please feel free to download the Demo application software from analogarts.com to help you follow this seminar.
 Hello, welcome to Analog Arts spectrum analyzer tutorial. Please feel free to download the Demo application software from analogarts.com to help you follow this seminar. For this presentation, we use a
SNG-2150C User s Guide
 SNG-2150C User s Guide Avcom of Virginia SNG-2150C User s Guide 7730 Whitepine Road Revision 001 Richmond, VA 23237 USA GENERAL SAFETY If one or more components of your earth station are connected to 120
System Requirements SA0314 Spectrum analyzer:
 System Requirements SA0314 Spectrum analyzer: System requirements Windows XP, 7, Vista or 8: 1 GHz or faster 32-bit or 64-bit processor 1 GB RAM 10 MB hard disk space \ 1. Getting Started Insert DVD into
WiPry 5x User Manual. 2.4 & 5 GHz Wireless Troubleshooting Dual Band Spectrum Analyzer
 WiPry 5x User Manual 2.4 & 5 GHz Wireless Troubleshooting Dual Band Spectrum Analyzer 1 Table of Contents Section 1 Getting Started 1.10 Quickstart Guide 1.20 Compatibility Section 2 How WiPry Works 2.10
WiPry User Manual. 2.4 GHz Wireless Troubleshooting
 WiPry User Manual 2.4 GHz Wireless Troubleshooting 1 Table of Contents Section 1 Getting Started 1.10 Quickstart Guide 1.20 Compatibility Section 2 How WiPry Works 2.10 Basics 2.11 Screen Layout 2.12 Color
Advanced Test Equipment Rentals ATEC (2832)
") E stablished 1981 Advanced Test Equipment Rentals www.atecorp.com 800-404-ATEC (2832) Technical Datasheet Scalar Network Analyzer Model 8003-10 MHz to 40 GHz The Giga-tronics Model 8003 Precision Scalar
E stablished 1981 Advanced Test Equipment Rentals www.atecorp.com 800-404-ATEC (2832) Technical Datasheet Scalar Network Analyzer Model 8003-10 MHz to 40 GHz The Giga-tronics Model 8003 Precision Scalar
RF Explorer RackPRO. User Manual. Introduction. Greetings fellow traveler on the RF spectrum.
 RF Explorer RackPRO User Manual Introduction Greetings fellow traveler on the RF spectrum. The RF Explorer RackPRO (referred to in this document in shorthand as RackPRO ) has been designed to be intuitive
RF Signal Capture & Playback Simple Operation Guide
 User Guide RF Signal Capture & Playback Simple Operation Guide Signal Analyzer and Built-in Vector Signal Generator Option MS2690A Series MS2830A (3.6/6.0/13.5 GHz Model) MS2840A (3.6/6.0 GHz Model) This
Spectrum Master. Compact Handheld Spectrum Analyzer. Technical Data Sheet
 Technical Data Sheet Spectrum Master Compact Handheld Spectrum Analyzer MS2712E MS2713E 100 khz to 4 GHz 100 khz to 6 GHz Introduction Anritsu introduces its next generation compact handheld Spectrum Analyzers
innovative technology to keep you a step ahead Tailored to Simplify Installation and Troubleshooting of RF Signals
 Tailored to Simplify Installation and Troubleshooting of RF Signals Intuitive Color Display with Simple Pass/ Fail Indicators Reduce Installer Entry Errors and Improve Decision Making Autotests Streamline
Dragon. manual version 1.6
 Dragon manual version 1.6 Contents DRAGON TOP PANEL... 2 DRAGON STARTUP... 2 DRAGON STARTUP SCREEN... 2 DRAGON INFO SCREEN... 3 DRAGON MAIN SCREEN... 3 TURNING ON A TRANSMITTER... 4 CHANGING MAIN SCREEN
WiPry 5x User Manual. 2.4 & 5 GHz Wireless Troubleshooting Dual Band Spectrum Analyzer
 WiPry 5x User Manual 2.4 & 5 GHz Wireless Troubleshooting Dual Band Spectrum Analyzer 1 Table of Contents Section 1 Getting Started 1.10 Quickstart Guide 1.20 Compatibility 2.10 Basics 2.11 Screen Layout
DVR-431 USB Wireless Receiver User Manual
 DVR-431 USB Wireless Receiver User Manual Thank you for using our wireless USB receiver, please read the following content carefully before using, it will help you make better use of this product. Introduction
RS232 Connection. Graphic LCD Screen. Power Button. Charger Adapter Input LNB Output. MagicFINDER Digital SatLock Operating Manual
 GENERAL FEATURES Easy-to-understand user-friendly menu and keypad. LNB short circuit protection. Display of Analog Signal Level, Digital Signal Quality with % and Bar, audible notification. Timer Lock,
Version Users Manual
 Version 1.0.12 Users Manual Table of Contents Overview... 3 Installation... 3 Minimum Requirements... 3 Licensing the Software... 3 Demo Mode... 4 Software Reference... 4 Invisible Waves X Main Window...
AVTuner PVR Quick Installation Guide
 AVTuner PVR Quick Installation Guide Introducing the AVTuner PVR The AVTuner PVR allows you to watch, record, pause live TV and capture high resolution video on your computer. Features and Benefits Up
Be sure to run the vehicle engine while using this unit to avoid battery exhaustion.
 CAUTION: TO REDUCE THE RISK OF ELECTRIC SHOCK DO NOT REMOVE COVER (OR BACK) NO USER-SERVICEABLE PARTS INSIDE REFER SERVICING TO QUALIFIED SERVICE PERSONNE; Please Read all of these instructions regarding
Manual of Operation for WaveNode Model WN-2m. Revision 1.0
 Manual of Operation for WaveNode Model WN-2m. Revision 1.0 TABLE OF CONTENTS 1. Description of Operation 2. Features 3. Installation and Checkout 4. Graphical Menus 5. Information for Software Expansion
innovative technology to keep you a step ahead Tailored to Simplify Installation and Troubleshooting of RF Signals
 Tailored to Simplify Installation and Troubleshooting of RF Signals Intuitive Color Display with Simple Pass/ Fail Indicators Reduce Installer Entry Errors and Improves Decision Making Autotests Streamline
Television Analyser - TVA97
 Television Analyser - TVA97 Multi-functional instrument for RF applications setting the pace in professional RF technology summary setting the pace in professional RF technology Feature Frequency, Gain
Ultra-ViewRF 8HD Director Monitor. User Operation Manual
 Ultra-ViewRF 8HD 5.8GHz Wireless Director Monitor User Operation Manual 17.1.2013 v2_7 Video Equipment Rentals - VER 912 Ruberta Avenue Glendale, CA 91201 - U.S.A. Office 818-956-1444 Table of Contents
USB-TG124A Tracking Generator User Manual
 USB-TG124A Tracking Generator User Manual Signal Hound USB-TG124A User Manual 2017, Signal Hound, Inc. 35707 NE 86th Ave La Center, WA 98629 USA Phone 360.263.5006 Fax 360.263.5007 This information is
Noise Detector ND-1 Operating Manual
 Noise Detector ND-1 Operating Manual SPECTRADYNAMICS, INC 1849 Cherry St. Unit 2 Louisville, CO 80027 Phone: (303) 665-1852 Fax: (303) 604-6088 Table of Contents ND-1 Description...... 3 Safety and Preparation
Quick Start for TrueRTA (v3.5) on Windows XP (and earlier)
 on Windows XP (and earlier)") Skip directly to the section that covers your version of Windows (XP and earlier, Vista or Windows 7) Quick Start for TrueRTA (v3.5) on Windows XP (and earlier) Here are step-by-step instructions to get
Skip directly to the section that covers your version of Windows (XP and earlier, Vista or Windows 7) Quick Start for TrueRTA (v3.5) on Windows XP (and earlier) Here are step-by-step instructions to get
DVB-T USB SET-TOP BOX
 DVB-T USB SET-TOP BOX User Manual Version: 1.0 (February 2005) TRANSYSTEM INC. No.1-2 Li-Hsin Rd.I Science-Based Industrial Park, Hsinchu, Taiwan Tel:+886-3-5780393 Fax:+886-3-5784111 e-mail: sales@transystem.com.tw
The Measurement Tools and What They Do
 2 The Measurement Tools The Measurement Tools and What They Do JITTERWIZARD The JitterWizard is a unique capability of the JitterPro package that performs the requisite scope setup chores while simplifying
PYROPTIX TM IMAGE PROCESSING SOFTWARE
 Innovative Technologies for Maximum Efficiency PYROPTIX TM IMAGE PROCESSING SOFTWARE V1.0 SOFTWARE GUIDE 2017 Enertechnix Inc. PyrOptix Image Processing Software v1.0 Section Index 1. Software Overview...
Using R&S NRP Series Power Sensors with Android TM Handheld Devices. Application Note. Products: R&S NRP Series. R&S NRP-Zxx Series
 Using R&S NRP Series Power Sensors with Android TM Handheld Devices Products: R&S NRP Series R&S NRP-Zxx Series This application note describes how to connect and use the highly popular R&S NRP family
SAGE Instruments UCTT 8901 Release Notes
 SAGE Instruments UCTT 8901 Release Notes Friday June 20, 2014, Sage Instruments is excited to announce a major new release for its wireless base station test tool, model 8901 UCTT. Release Summary This
M5-H002. Multiview T-35. DVB-T to PAL / 5 channels on all TV s
 120531 M5-H002 Multiview T-35 DVB-T to PAL / 5 channels on all TV s Contents Multiview... 3 Features... 3 Caution... 3 Front & Rear Panel... 4 Connecting... 5 Programming... 6 Information... 7 Installation...8
SWR TRUE Antenna Analyzer
 SWR TRUE Antenna Analyzer Operators Manual In partnership with www.instruments4engineers.com Edition Notice! This publication applies to COMM-connect A/S SWR True type 3013 SWR Analyzer product hardware
VNS2200 Amplifier & Controller Installation Guide
 VNS2200 Amplifier & Controller Installation Guide VNS2200 Amplifier & Controller Installation 1. Determine the installation location for the VNS2200 device. Consider the following when determining the
Model 7330 Signal Source Analyzer Dedicated Phase Noise Test System V1.02
 Model 7330 Signal Source Analyzer Dedicated Phase Noise Test System V1.02 A fully integrated high-performance cross-correlation signal source analyzer from 5 MHz to 33+ GHz Key Features Complete broadband
LPT-3000 Remote User s Guide (LPT-3000R) LP Technologies
 LP Technologies") 99 Washington Street Melrose, MA 02176 Phone 781-665-1400 Toll Free 1-800-517-8431 Visit us at www.testequipmentdepot.com LPT-3000 Remote User s Guide (LPT-3000R) LP Technologies 1 Table of Contents Chapter
99 Washington Street Melrose, MA 02176 Phone 781-665-1400 Toll Free 1-800-517-8431 Visit us at www.testequipmentdepot.com LPT-3000 Remote User s Guide (LPT-3000R) LP Technologies 1 Table of Contents Chapter
2013, 2014 Hewlett-Packard Development Company, L.P.
 User Guide 2013, 2014 Hewlett-Packard Development Company, L.P. The only warranties for HP products and services are set forth in the express warranty statements accompanying such products and services.
Datasheet SHF A
 SHF Communication Technologies AG Wilhelm-von-Siemens-Str. 23D 12277 Berlin Germany Phone +49 30 772051-0 Fax ++49 30 7531078 E-Mail: sales@shf.de Web: http://www.shf.de Datasheet SHF 19120 A 2.85 GSa/s
MINI PC SCOPE PCSU01. User manual. test leads software download USB cable design enclosure
 MINI PC SCOPE PCSU01 User manual Features test leads software download USB cable design enclosure Specifications oscilloscope: o bandwidth: DC to 200 khz ± 3 db o input impedance: 100 ko / 20 pf o maximum
860 DSP Digital Field Analyzer
 DSP Technology Allows for Quick, Accurate Level Measurements Measures Signal Levels in the 5 to 870 MHz Frequency QPSK and QAM Measurements, High-Resolution Spectrum Analyzer, and Reverse Path Tester Adaptable
Spectrum Analyzer. User Manual
 Spectrum Analyzer User Manual Research Electronics International, LLC 455 Security Drive, Cookeville, TN 38506 U.S.A. (800) 824-3190 (US Only) +1 931-537-6032 www.reiusa.net Copyright Research Electronics
Connevans.info. DeafEquipment.co.uk. This product may be purchased from Connevans Limited secure online store at
 Connevans.info Solutions to improve the quality of life Offering you choice Helping you choose This product may be purchased from Connevans Limited secure online store at www.deafequipment.co.uk DeafEquipment.co.uk
User s Guide W-E
 Presto! PVR ISDB User s Guide 518100-02-01-W-E-112307-02 Copyright 2007, NewSoft Technology Corp. All Rights Reserved. No portion of this document may be copied or reproduced in any manner without prior
Wireless Studio. User s Guide Version 5.1x Before using this software, please read this manual thoroughly and retain it for future reference.
 4-743-161-12 (1) Wireless Studio User s Guide Version 5.1x Before using this software, please read this manual thoroughly and retain it for future reference. DWR-R01D/R02D/R02DN/R03D 2018 Sony Corporation
i-repeater Control and monitor all your repeaters through the cloud Rackmount Wallmount
 i-repeater Control and monitor all your repeaters through the cloud Rackmount Wallmount Cloud control and monitoring Touch screen interface Alarms Statisics Details *Device = any repeater or line-amp Connection
R3267/3273 Spectrum Analyzers
 R3267/3273 Spectrum Analyzers For 3rd-Generation Mobile Communications Present Digital Communication standards (W-CDMA, PDC, PHS, IS-136, GSM, DECT, cdmaone ) R3267/3273 New communication technologies
Keysight FieldFox Microwave Analyzers
 Quick Reference Guide Contents Keysight FieldFox Microwave Analyzers Do you have everything?... 1 The Power Button and LED... 1 Battery Usage... 2 Measure Return Loss (CAT Mode)... 3 Measure 1-Port Cable
7000 Series Signal Source Analyzer & Dedicated Phase Noise Test System
 7000 Series Signal Source Analyzer & Dedicated Phase Noise Test System A fully integrated high-performance cross-correlation signal source analyzer with platforms from 5MHz to 7GHz, 26GHz, and 40GHz Key
Manual Version Ver 1.0
 The BG-3 & The BG-7 Multiple Test Pattern Generator with Field Programmable ID Option Manual Version Ver 1.0 BURST ELECTRONICS INC CORRALES, NM 87048 USA (505) 898-1455 VOICE (505) 890-8926 Tech Support
TransitHound Cellphone Detector User Manual Version 1.3
 TransitHound Cellphone Detector User Manual Version 1.3 RF3 RF2 Table of Contents Introduction...3 PC Requirements...3 Unit Description...3 Electrical Interfaces...4 Interface Cable...5 USB to Serial Interface
Hardware Setup. HP Dual TV Tuner/Digital Video Recorder. Document Part Number:
 Hardware Setup HP Dual TV Tuner/Digital Video Recorder Document Part Number: 374787-001 November 2004 This guide provides steps to help you set up your HP Dual TV Tuner/Digital Video Recorder hardware
Model RTSA7550 Specification v1.1
 Model RTSA7550 Specification v1.1 Real-Time Spectrum Analyzers - 9 khz to 8/18/27 GHz Featuring Real-Time Bandwidth (RTBW) up to 160 MHz Spurious Free Dynamic Range (SFDR) up to 100 dbc Small form-factor,
Spike Spectrum Analyzer Software User Manual
 TM Spike Spectrum Analyzer Software User Manual Spike TM Spectrum Analyzer Software User Manual 2015, Signal Hound, Inc. 35707 NE 86th Ave La Center, WA 98629 USA Phone 360.263.5006 Fax 360.263.5007 ii
ST-4000 SIGNAL LEVEL METER
 ST-4000 SIGNAL LEVEL METER Table of Contents Features / Specifications.... 1 Keypad Illustration....... 2 Keypad Controls.... 2 Getting Started: Powering the Meter.... 3 Quick Use Instructions.. 3 Main
Gazer VI700A-SYNC/IN and VI700W- SYNC/IN INSTALLATION MANUAL
 Gazer VI700A-SYNC/IN and VI700W- SYNC/IN INSTALLATION MANUAL Contents List of compatible cars... 3 Package contents... 4 Special information... 6 Car interior disassembly and connection guide for Ford
Reference. TDS7000 Series Digital Phosphor Oscilloscopes
 Reference TDS7000 Series Digital Phosphor Oscilloscopes 07-070-00 0707000 To Use the Front Panel You can use the dedicated, front-panel knobs and buttons to do the most common operations. Turn INTENSITY
22" Touchscreen LED Monitor USER'S GUIDE
 22" Touchscreen LED Monitor USER'S GUIDE Content Operation Instructions...1 Unpacking Instructions...2 Safety Precautions...2 Front View of the Product...3 Rear View of the Product...4 Quick Installation...5
CVM-WM300. UHF Wireless Microphone USER MANUAL
 CVM-WM300 UHF Wireless Microphone USER MNUL Foreword Thanks for purchasing COMIC WM300 UHF wireless microphone. WM300 is an all-metal wireless microphone with dual-transmitter triggered by one receiver,
Gazer VI700A-SYNC2 and VI700W- SYNC2 INSTALLATION MANUAL
 Gazer VI700A-SYNC2 and VI700W- SYNC2 INSTALLATION MANUAL Contents List of compatible cars... 3 Package contents... 4 Special information... 6 Car interior disassembly and connection guide for Ford Focus...
HyperMedia User Manual
 HyperMedia User Manual Contents V3.5 Chapter 1 : HyperMedia Software Functions... 3 1.1 HyperMedia Introduction... 3 1.2 Main Panel... 3 1.2.2 Information Window... 4 1.2.3 Keypad... 4 1.2.4 Channel Index...
Transmitter Interface Program
 Transmitter Interface Program Operational Manual Version 3.0.4 1 Overview The transmitter interface software allows you to adjust configuration settings of your Max solid state transmitters. The following
USER S MANUAL REV 1.0 FORM# 7677
 DTU-236 RFProbe & RFXpert 8-VSB, QAM A/B/C, and NTSC Analysis and Monitoring Hardware / Software Package USER S MANUAL REV 1.0 FORM# 7677 Support and Service Information: For support and service information
AVerTV 6. User Manual. English DISCLAIMER COPYRIGHT
 User Manual English DISCLAIMER All the screen shots in this documentation are only example images. The images may vary depending on the product and software version. Information presented in this documentation
HP 71910A and 71910P Wide Bandwidth Receiver Technical Specifications
 HP 71910A and 71910P Wide Bandwidth Receiver Technical Specifications 100 Hz to 26.5 GHz The HP 71910A/P is a receiver for monitoring signals from 100 Hz to 26.5 GHz. It provides a cost effective combination
Getting started with Spike Recorder on PC/Mac/Linux
 Getting started with Spike Recorder on PC/Mac/Linux You can connect your SpikerBox to your computer using either the blue laptop cable, or the green smartphone cable. How do I connect SpikerBox to computer
Application Note DT-AN DTU-315 Verification of Specifications
 DTU-315 Verification of Specifications APPLICATION NOTE January 2018 Table of Contents 1. Introduction... 3 General Description of the DTU-315... 3 Purpose of this Application Note... 3 2. Measurements...
A few quick notes about the use of Spectran V2
 A few quick notes about the use of Spectran V2 The full fledged help file of Spectran is not ready yet, but many have asked for some sort of help. This document tries to explain in a quick-and-dirty way
Check our knowledge base at
 USER MANUAL Check our knowledge base at www.paralinx.net/support Copyright 2015 Paralinx LLC All Rights Reserved TABLE OF CONTENTS 1 Important Notice 10 LCD Screen 2 Safety Instructions 11 Indicators 3
Spectrum Analyser Basics
 Hands-On Learning Spectrum Analyser Basics Peter D. Hiscocks Syscomp Electronic Design Limited Email: phiscock@ee.ryerson.ca June 28, 2014 Introduction Figure 1: GUI Startup Screen In a previous exercise,
Table of Contents. Chapter 1 Introduction System Requirements Chapter 2 Introducing the AVerTV Application... 3
 Table of Contents Chapter 1 Introduction... 1 System Requirements... 2 Chapter 2 Introducing the AVerTV Application... 3 Launching the AVerTV DVB-T USB2.0 Application... 3 Running AVerTV DVB-T USB2.0 application
S7H-DK S7H 7" High Bright Monitor Deluxe Kit
 S7H-DK S7H 7" High Bright Monitor Deluxe Kit QUICKSTART GUIDE What s Included 1 x S7H Monitor 1 x Camera Shoe Mount 1 x Neoprene Sleeve 1 x Mini-XLR to P-TAP Cable 2 x DV Battery Plate 1 x DV Battery 1
Owner s Manual. Sat-Meter MSK 15. Order No.:
 Owner s Manual Sat-Meter MSK 15 Order No.: 217 100 13 Thank you for choosing our latest and most innovative satellite meter. It has been designed and manufactured to a very high standard and offers a UNIQUE
Getting Started. Connect green audio output of SpikerBox/SpikerShield using green cable to your headphones input on iphone/ipad.
 Getting Started First thing you should do is to connect your iphone or ipad to SpikerBox with a green smartphone cable. Green cable comes with designators on each end of the cable ( Smartphone and SpikerBox
Ultra-Wideband Scanning Receiver with Signal Activity Detection, Real-Time Recording, IF Playback & Data Analysis Capabilities
 Ultra-Wideband Scanning Receiver RFvision-2 (DTA-95) Ultra-Wideband Scanning Receiver with Signal Activity Detection, Real-Time Recording, IF Playback & Data Analysis Capabilities www.d-ta.com RFvision-2
860 DSPi. Multifunction HFC Analyzer. Enhanced Sweep and RSVP Features. DSP Technology Provides Quick, Accurate Measurements
 860 DSPi Multifunction HFC Analyzer Enhanced Sweep and RSVP Features DSP Technology Provides Quick, Accurate Measurements Tests DOCSIS Cable Modem Performance and VoIP Quality Analysis Internet Browser
American DJ. Show Designer. Software Revision 2.08
 American DJ Show Designer Software Revision 2.08 American DJ 4295 Charter Street Los Angeles, CA 90058 USA E-mail: support@ameriandj.com Web: www.americandj.com OVERVIEW Show Designer is a new lighting
Agilent FieldFox RF Analyzer N9912A
 Contents Agilent FieldFox RF Analyzer N9912A Quick Reference Guide Do You Have Everything?... 2 The Power Button and LED... 2 Battery Usage... 3 Measure Return Loss... 4 Measure Cable Loss (1-Port)...
JS007WQK HEAVY DUTY WIRELESS REVERSING KIT 7 LCD DIGITAL QUAD RECORDING MONITOR with WATERPROOF CCD CAMERA
 JS007WQK HEAVY DUTY WIRELESS REVERSING KIT 7 LCD DIGITAL QUAD RECORDING MONITOR with WATERPROOF CCD CAMERA The JS007WQK is loaded with userfriendly features and is ideal for use in heavy duty vehicles.
SM02. High Definition Video Encoder and Pattern Generator. User Manual
 SM02 High Definition Video Encoder and Pattern Generator User Manual Revision 0.2 20 th May 2016 1 Contents Contents... 2 Tables... 2 Figures... 3 1. Introduction... 4 2. acvi Overview... 6 3. Connecting
Out of Band Spurious Measurement for Bluetooth Modules
 Products: Signal Analyser FSIQ26/FSP13/FSU8/FSQ26 Out of Band Spurious Measurement for Bluetooth Modules This application notes describes the out of band Spurious emission measurement for Bluetooth modules
Q-Lab Software. for the 8821Q-R OPERATION MANUAL
 Q-Lab Software for the 8821Q-R OPERATION MANUAL Trilithic Company Profile Trilithic is a privately held manufacturer founded in 1986 as an engineering and assembly company that built and designed customer-directed
AC335A. VGA-Video Ultimate Plus BLACK BOX Back Panel View. Remote Control. Side View MOUSE DC IN OVERLAY
 AC335A BLACK BOX 724-746-5500 VGA-Video Ultimate Plus Position OVERLAY MIX POWER FREEZE ZOOM NTSC/PAL SIZE GENLOCK POWER DC IN MOUSE MIC IN AUDIO OUT VGA IN/OUT (MAC) Remote Control Back Panel View RGB
HD-CM HORIZON DIGITAL CABLE METER
 HD-CM OFF! Max RF i/p = +17dBm 75Ω Max AC/DC i/p = 120Vrms MENU INPUT ON HORIZON DIGITAL CABLE METER Horizon Global Electronics Ltd. Unit 3, West Side Flex Meadow Harlow, Essex CM19 5SR Phone: +44(0) 1279
ST-4000D SIGNAL LEVEL METER
 ST-4000D SIGNAL LEVEL METER Rev 100606 Table of Contents Features / Specifications.... 1 Keypad Illustration....... 2 Keypad Controls.... 2 Getting Started: Powering the Meter...... 3 Quick Use Instructions.....
VideoMate U3 Digital Terrestrial USB 2.0 TV Box Start Up Guide
 VideoMate U3 Digital Terrestrial USB 2.0 TV Box Start Up Guide Compro Technology, Inc. www.comprousa.com Copyright 2001-2005. Compro Technology, Inc. No part of this document may be copied or reproduced
BVS Indoor Forecaster Predictive RF In-Building Survey Analysis for CW Signals
 BVS Indoor Forecaster Predictive RF In-Building Survey Analysis for CW Signals User Manual Version 1.5 Version 120607 Copyright!2010, Berkeley Varitronics Systems, Inc. All Rights Reserved Table of Contents
DH5e-V2. Delta 5 On-Camera 4K HDMI Monitor with 3D LUTs. Quick Start Guide. What s Included
 DH5e-V2 Quick Start Guide Delta 5 On-Camera 4K Monitor with 3D LUTs What s Included 1 x DH5e-V2 Monitor 1 x L Series Battery Plate 1 x AC Adapter 1 x Screen Cleaning Wipe 1 x Screen Protection Film 1 x
Part names (continued) Remote control
 Remote control") Introduction Part names (continued) Remote control (1) STANDBY ( 25) (1) (2) ON ( 25) (3) (3) ID - 1 / 2 / 3 / 4 s ( 18) (4) (4) COMPUTER 1 ( 27) (7) (5) COMPUTER 2 * (8) (6) COMPUTER 3 * (10) (13) (7)
Introduction Part names (continued) Remote control (1) STANDBY ( 25) (1) (2) ON ( 25) (3) (3) ID - 1 / 2 / 3 / 4 s ( 18) (4) (4) COMPUTER 1 ( 27) (7) (5) COMPUTER 2 * (8) (6) COMPUTER 3 * (10) (13) (7)
ISA OPERATOR S MANUAL. ECR 3 SMARTSCAN TM CoSpectra System. Rev: January 8, 2008 ENTIRE CONTENTS COPYRIGHT 2007 INFORMATION SECURITY ASSOCIATES
 ISA Information Security Associates, LLC. Information Security Associates, LLC ECR 3 SMARTSCAN TM CoSpectra System OPERATOR S MANUAL Rev: January 8, 2008 ENTIRE CONTENTS COPYRIGHT 2007 INFORMATION SECURITY
Model Two and Model Two Lite Signal Level Meters OPERATION MANUAL
 Model Two and Model Two Lite Signal Level Meters OPERATION MANUAL Trilithic Company Profile Trilithic is a privately held manufacturer founded in 1986 as an engineering and assembly company that built
EASY-MCS. Multichannel Scaler. Profiling Counting Rates up to 150 MHz with 15 ppm Time Resolution.
 Multichannel Scaler Profiling Counting Rates up to 150 MHz with 15 ppm Time Resolution. The ideal solution for: Time-resolved single-photon counting Phosphorescence lifetime spectrometry Atmospheric and
ME EN 363 ELEMENTARY INSTRUMENTATION Lab: Basic Lab Instruments and Data Acquisition
 ME EN 363 ELEMENTARY INSTRUMENTATION Lab: Basic Lab Instruments and Data Acquisition INTRODUCTION Many sensors produce continuous voltage signals. In this lab, you will learn about some common methods
Wireless Cloud Camera TV-IP751WC (v1.0r)
") TRENDnet s, model, takes the work out of viewing video over the internet. Previously to view video remotely, users needed to perform many complicated and time consuming steps: such as signing up for a
TRENDnet s, model, takes the work out of viewing video over the internet. Previously to view video remotely, users needed to perform many complicated and time consuming steps: such as signing up for a
D-901 PC SOFTWARE Version 3
 INSTRUCTION MANUAL D-901 PC SOFTWARE Version 3 Please follow the instructions in this manual to obtain the optimum results from this unit. We also recommend that you keep this manual handy for future reference.
Application Note DT-AN-2115B-1. DTA-2115B Verification of Specifations
 DTA-2115B Verification of Specifations APPLICATION NOTE January 2018 Table of Contents 1. Introduction... 3 General Description of the DTA-2115B... 3 Purpose of this Application Note... 3 2. Measurements...