Update on Antenna Elevation Pattern Estimation from Rain Forest Data
|
|
|
- Dortha Lamb
- 5 years ago
- Views:
Transcription
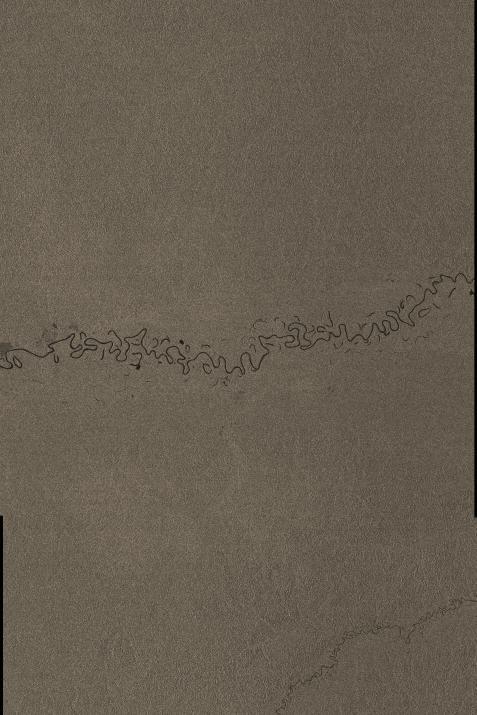
1 Update on Antenna Elevation Pattern Estimation from Rain Forest Data Manfred Zink ENVISAT Programme, ESA-ESTEC Keplerlaan 1, 2200 AG, Noordwijk The Netherlands Tel: , Fax: ABSTRACT Antenna elevation pattern estimation is based on acquisitions over a large homogeneous rain forest area in the Amazon basin. The estimation procedure accepts IMP, APP and WSM products as input and generates a combined estimate from as many input products as are available for a certain beam. For IS3-IS6 IM and WS products can be combined as well. Beam patterns for vertical polarization have been presented at the ENVISAT Calibration Review (ECR) [1]. Here we present some fine-tuning of the WS VV beam patterns at the swath boundaries and the patterns in HH, HV and VH polarizations. Comparison with the pre-launch patterns versus time in the receive window allows verifying the compensation of the receiver gain droop. Pattern corrected range profiles have been analysed with respect to beam-tobeam radiometric normalization. 2 ANTENNA PATTERN ESTIMATION APPROACH Pattern estimation from several products requires a three-step approach (for details see [1]): Range power profiles are calculated applying a simple threshold based masking of non-homogeneous areas like rivers and clear-cuts. The antenna pattern correction is then reversed using the pattern applied during processing and the range power profile is multiplied with the tangent of the incidence angle. The resulting gamma profile is only modulated by the elevation antenna pattern, which in turn can be estimated under the assumption that gamma profiles are flat for rain forest. Individual profiles are combined to one cloud of estimates versus elevation angle. The final step is a least squares polynomial fit to the estimates. Outside the imaged swath we use the pre-launch pattern to extrapolate the patterns to ±5 deg. Proc. of Envisat Validation Workshop, Frascati, Italy, 9 13 December 2002 (ESA SP-531, August 2003)


2 3 RAIN FOREST AREA AND ACQUISITIONS Fig. 1. Rain forest area used for antenna pattern estimation, the red marked area was used for ERS. The rain forest we are using for antenna pattern estimation covers a latitude/longitude range of 4-11 deg South and deg West respectively. We selected this rather large area based on information from RADARSAT and on the Rain Forest Mosaic produced from JERS-1 data. Fig. 1 shows the area in an ESOV plot indicating one of the IS2 acquisitions in orbit 973. The area used for ERS antenna pattern determination is shown as a red rectangle. Compared to ERS we had to increase the extent of the area because on ASAR we have to determine 32 beam patterns. In one 35-day repeatcycle there are in total 30 acquisition opportunities. Fig. 2 shows some typical IMP, APP and WSM products. The area is mostly flat and quite homogeneous with a few rivers and some clear-cuts. IMP&WSM products, HH - polarization


3 APP products, VH - polarization APP products, HV - polarization Fig. 2. Examples of IMP and WSM products in HH and APP products in VH and HV polarization over the selected area in the Amazon basin
.")


4 4 FINE-TUNING OF WS VV PATTERNS AT THE SWATH BOUNDARIES In ECR we reported problems at the sub-swath boundaries in the case of WSM products. We used only data samples well away from the beam-merging region (about 0.5deg on either side). On the other hand the beam patterns at the transition from one sub-swath to the other are very critical for WS beam merging. Consequently all WS beams need further fine-tuning at the beam boundaries (see for example the far range edge of the SS1 beam in fig. 3). Fig. 3. Rain forest estimates (green), in-flight antenna pattern as polynomial fit (red) and pre-launch pattern (blue) for SS1-VV; vertical axis: two-way gain in [db], horizontal axis: off-reference angle [deg]; left: first estimate not using the data close to the beam merging region, right: improved estimate using all available data per subswath; red circles indicate the change at the far range edge of SS1. Fig. 4. Range power profiles for WSM VV products; left/right: before/after fine-tuning of the beam patterns.
.")
. Please note the change in vertical scale for the plots in fig. 4. Furthermore between the processing of the WSM products used in the left and right plots of fig.")


5 The consequence of not using the data close to the beam merging region is a too steep drop of the beam patterns in near and/or far range and as a result an over-compensation of the beam pattern especially for the far range edge of SS1 and the near range edge of SS2 and SS3 (fig. 4, left). After applying the refined patterns the range power profiles show consistent slopes in the beam merging regions (see fig. 4, right). Please note the change in vertical scale for the plots in fig. 4. Furthermore between the processing of the WSM products used in the left and right plots of fig. 4 the processing gain from beam to beam has been adjusted resulting in an improved normalization across the whole WS image. The absolute levels are in good agreement with the calibration factors from the transponders and the expected σ o for the rain forest. 5 ESTIMATED ELEVATION BEAM PATTERNS FOR HH, VH AND HV POLARIZATIONS Figs. 5 and 6 show some of the estimated elevation beam patterns for HH, VH and HV polarization. The numbers in the title of the plots indicate the orbit numbers of the products used. If the same orbit number appears more than once several non-overlapping IMP or APP products processed from one long acquisition have been used. For HH polarized beams IS3 to IS6 only WSM products have been used in the refined approach. The green cloud represents the combined range power profiles from all products. The red curve is the final antenna pattern obtained by piecewise least squares fitting of 3 rd order polynomials to the green cloud of estimates. The polynomial pieces have been merged to obtain a smooth beam pattern over the whole angular range. Pre-launch patterns are show as blue curves. Range power profiles from the different products used agree very well with each other and the standard deviation of the green estimates is below 0.1dB as for the VV patterns [1]. Estimated patterns (red curves) deviate by up to 0.5dB from the pre-launch measurements (blue curves). Differences are most likely due to pre-launch measurement artifacts. Fig. 5. Rain forest estimates (green), in-flight antenna pattern as polynomial fit (red) and pre-launch pattern (blue) for HH polarized beams IS1, IS3, IS5, SS1; vertical axis: two-way gain in [db], horizontal axis: off-reference angle [deg]


6 Fig. 6. Rain forest estimates (green), in-flight antenna pattern as polynomial fit (red) and pre-launch pattern (blue) for VH polarized beams IS2, IS4, IS5 and HV polarized beams IS1, IS2, IS7; vertical axis: two-way gain in [db], horizontal axis: off-reference angle [deg]

7 The good agreement of range power profiles from different acquisitions is a further indicator of the stability of the antenna and the low standard deviation of the estimates confirms the high performance of the pattern estimation from rain forest data. Furthermore we can conclude that one single product can provide a reasonable estimate for the beam pattern. This was important for the cross-pol patterns, where in some cases only one product was available (see fig. 6). For HV polarization and beams IS3 and IS6 we have not received any product yet. Patterns synthesized from Module Stepping Mode measurements are currently being used to correct these beams in the processor. 6 COMPARISON WITH PRE-LAUNCH PATTERNS Fig. 7 shows the difference between pre-launch and in-flight patterns versus time in the receive window for VV polarization. Any common trend would indicate inaccurate knowledge of the receiver gain droop function. No such trend is visible and we conclude that the receiver gain droop has been well characterized pre-launch. It is also a verification of the gain droop compensation in PF-ASAR. Any residual receiver gain droop effects do not affect our products. Fig. 7. Difference between pre-launch and in-flight patterns (VV polarization) versus time in the receive window To further understand the difference between pre-launch and in-flight antenna beam patterns we plotted this difference for IS1, IS4 and IS7 in fig. 8. These plots include all 4 polarizations and we see similar behavior for different polarizations within one beam but quite different shapes from beam to beam. The main reasons for these differences are: The accuracy of pre-launch measurement does not match highly accurate RF estimates. The limited control/knowledge of module gain/phase settings during pre-launch characterization The limited accuracy of the pre-launch characterisation measurements also impacts on the patterns synthesis from Module Stepping and internal calibration data (see below).

, VV (dotted), VH (dashed), HV (dash-dot) 7 PATTERN CORRECTED")


8 IS1 IS7 IS4 Fig. 8. Difference in db between pre-launch and in-flight antenna elevation beam patterns as a function of offreference angle for beams IS1, IS4 and IS7: HH (solid ), VV (dotted), VH (dashed), HV (dash-dot) 7 PATTERN CORRECTED RANGE POWER PROFILES Calibration pulse measurements are used to derive the elevation gain for product normalization. After correction of the in-flight antenna pattern we would expect flat range power profiles within each swath and, if the internal calibration is able to track the gain difference from swath to swath, even across the whole incidence angle range from IS1 to IS7. VV HH Fig. 9. Range power profiles after correction of the in-flight antenna pattern for IMP products in beams IS1-IS7

9 Fig. 9 shows the pattern corrected range power profiles for all IMP products analyzed in all 7 beams and for both VV and HH polarizations. Within one swath the profiles are quite flat and the different measurements are within 0.5dB. From swath to swath we see jumps of up to 1dB. This means that the internal calibration does not completely track the gain change from beam to beam and we believe it is due to the limited accuracy of the pre-launch characterization data (embedded row patterns were only measured on an incomplete antenna array - 14 out of 20 tiles). The variation across all swath is different for different polarization (slightly higher in HH) due to the polarization dependence in the antenna characteristics. Absolute levels are consistent with calibration factors from transponder measurements and the expected σ o of the rain forest. Profiles for IS1 are above all the others in both polarizations. In [1] we concluded, that this might be due to terrain effects but we now believe that the flatness of the γ-profiles across the whole incidence angle range has to be confirmed. Fig. 10. Range power profiles after correction of the in-flight antenna pattern for HH polarized WSM products Fig. 10 shows similar plots for the WSM HH polarized products. The range power profiles are flat across the whole incidence angle range and the slopes are consistent at the beam boundaries. These products have been processed using the processing gains optimized for VV polarization. As explained above, the gains are polarization dependent and we therefore see some increase in the variation across the whole images. Finally fig. 11 contains all the pattern corrected range power profiles from APP products. These products where generated in a very hectic period of processor adjustments, which we could not fully recover. We therefore discarded the profiles, which where completely off from the rest. As for IMP and WSM products the individual profiles are flat and we see similar variations in gain from beam to beam. The absolute levels are close to the IMP levels in fig. 9 above despite the different processing algorithm (SPECAN versus Range-Doppler). VV profiles are approximately 2 db lower than HH profiles. Cross-polar returns are about 7 db below co-polar measurements.

10 Fig. 11. Range power profiles after correction of the in-flight antenna pattern for APP products 8 CONCLUSIONS Our antenna elevation pattern estimation from rain forest acquisitions is based on the combination of IMP, APP and WSM products. Range profiles from different IMP, APP and WSM products are very consistent with a standard deviation of better than 0.1dB. Because of this excellent agreement we could obtain reasonable patterns from single products in AP mode. HV IS3&IS6 patterns are still missing as we have not received any products in these modes yet. Fine-tuning of the WS beam patterns at the swath boundaries has been performed successfully resulting in consistent slopes of the range power profiles in the beam merging regions. Differences to the pre-launch patterns reach up to 0.5dB and show no systematic trend versus time in the receive window. This confirms the pre-launch receiver gain droop characterization and the compensation in the processor. Differences are due to limitations in the pre-launch characterization measurements. Pattern corrected range power profiles are within 0.5dB for one beam, but beam-to-beam variations can reach up to 1dB. The internal calibration does not fully track this gain differences. The most likely reason is the limited accuracy of the pre-launch characterized embedded row patterns, which was performed on an incomplete antenna array (only 14 from the 20 tiles). 9 REFERENCES [1] M. Zink & B. Rosich, Antenna Elevation Pattern Estimation from Rain Forest Acquisitions, Proceedings ENVISAT Calibration Review, ESTEC, September 2002 [2] R. Torres, ASAR On-board Instrument, Proceedings ENVISAT Validation Workshop, ESRIN, December 2002
Analysis of WFS Measurements from first half of 2004
 Analysis of WFS Measurements from first half of 24 (Report4) Graham Cox August 19, 24 1 Abstract Described in this report is the results of wavefront sensor measurements taken during the first seven months
Common assumptions in color characterization of projectors
 Common assumptions in color characterization of projectors Arne Magnus Bakke 1, Jean-Baptiste Thomas 12, and Jérémie Gerhardt 3 1 Gjøvik university College, The Norwegian color research laboratory, Gjøvik,
Characterisation of the far field pattern for plastic optical fibres
 Characterisation of the far field pattern for plastic optical fibres M. A. Losada, J. Mateo, D. Espinosa, I. Garcés, J. Zubia* University of Zaragoza, Zaragoza (Spain) *University of Basque Country, Bilbao
PHY221 Lab 1 Discovering Motion: Introduction to Logger Pro and the Motion Detector; Motion with Constant Velocity
 PHY221 Lab 1 Discovering Motion: Introduction to Logger Pro and the Motion Detector; Motion with Constant Velocity Print Your Name Print Your Partners' Names Instructions August 31, 2016 Before lab, read
m RSC Chromatographie Integration Methods Second Edition CHROMATOGRAPHY MONOGRAPHS Norman Dyson Dyson Instruments Ltd., UK
 m RSC CHROMATOGRAPHY MONOGRAPHS Chromatographie Integration Methods Second Edition Norman Dyson Dyson Instruments Ltd., UK THE ROYAL SOCIETY OF CHEMISTRY Chapter 1 Measurements and Models The Basic Measurements
For the SIA. Applications of Propagation Delay & Skew tool. Introduction. Theory of Operation. Propagation Delay & Skew Tool
 For the SIA Applications of Propagation Delay & Skew tool Determine signal propagation delay time Detect skewing between channels on rising or falling edges Create histograms of different edge relationships
Sodern recent development in the design and verification of the passive polarization scramblers for space applications
 Sodern recent development in the design and verification of the passive polarization scramblers for space applications M. Richert, G. Dubroca, D. Genestier, K. Ravel, M. Forget, J. Caron and J.L. Bézy
Precise Digital Integration of Fast Analogue Signals using a 12-bit Oscilloscope
 EUROPEAN ORGANIZATION FOR NUCLEAR RESEARCH CERN BEAMS DEPARTMENT CERN-BE-2014-002 BI Precise Digital Integration of Fast Analogue Signals using a 12-bit Oscilloscope M. Gasior; M. Krupa CERN Geneva/CH
Measurement of overtone frequencies of a toy piano and perception of its pitch
 Measurement of overtone frequencies of a toy piano and perception of its pitch PACS: 43.75.Mn ABSTRACT Akira Nishimura Department of Media and Cultural Studies, Tokyo University of Information Sciences,
More Info at Open Access Database Process Control for Computed Tomography using Digital Detector Arrays
 Digital Industrial Radiology and Computed Tomography (DIR 2015) 22-25 June 2015, Belgium, Ghent - www.ndt.net/app.dir2015 More Info at Open Access Database www.ndt.net/?id=18082 Process Control for Computed
AP Statistics Sec 5.1: An Exercise in Sampling: The Corn Field
 AP Statistics Sec.: An Exercise in Sampling: The Corn Field Name: A farmer has planted a new field for corn. It is a rectangular plot of land with a river that runs along the right side of the field. The
Setting Up the Warp System File: Warp Theater Set-up.doc 25 MAY 04
 Setting Up the Warp System File: Warp Theater Set-up.doc 25 MAY 04 Initial Assumptions: Theater geometry has been calculated and the screens have been marked with fiducial points that represent the limits
New-Generation Scalable Motion Processing from Mobile to 4K and Beyond
 Mobile to 4K and Beyond White Paper Today s broadcast video content is being viewed on the widest range of display devices ever known, from small phone screens and legacy SD TV sets to enormous 4K and
Python Quick-Look Utilities for Ground WFC3 Images
 Instrument Science Report WFC3 2008-002 Python Quick-Look Utilities for Ground WFC3 Images A.R. Martel January 25, 2008 ABSTRACT A Python module to process and manipulate ground WFC3 UVIS and IR images
Investigation of Digital Signal Processing of High-speed DACs Signals for Settling Time Testing
 Universal Journal of Electrical and Electronic Engineering 4(2): 67-72, 2016 DOI: 10.13189/ujeee.2016.040204 http://www.hrpub.org Investigation of Digital Signal Processing of High-speed DACs Signals for
STATUS OF THE SwissFEL C-BAND LINAC
 STATUS OF THE SwissFEL C-BAND LINAC F. Loehl, J. Alex, H. Blumer, M. Bopp, H. Braun, A. Citterio, U. Ellenberger, H. Fitze, H. Joehri, T. Kleeb, L. Paly, J.-Y. Raguin, L. Schulz, R. Zennaro, C. Zumbach,
RC3000 User s Manual additions for the Positive Identification feature.
 RC3000 User s Manual additions for the Positive Identification feature. 1.2 Software Configuration The positive identification feature requires the presence of three navigation sensors: 1) GPS receiver,
A Colorimetric Study of Spatial Uniformity in Projection Displays
 A Colorimetric Study of Spatial Uniformity in Projection Displays Jean-Baptiste Thomas 1,2 and Arne Magnus Bakke 1 1 Gjøvik University College, The Norwegian Color Research Laboratory 2 Université de Bourgogne,
PICOSECOND TIMING USING FAST ANALOG SAMPLING
 PICOSECOND TIMING USING FAST ANALOG SAMPLING H. Frisch, J-F Genat, F. Tang, EFI Chicago, Tuesday 6 th Nov 2007 INTRODUCTION In the context of picosecond timing, analog detector pulse sampling in the 10
Keysight Technologies De-Embedding and Embedding S-Parameter Networks Using a Vector Network Analyzer. Application Note
 Keysight Technologies De-Embedding and Embedding S-Parameter Networks Using a Vector Network Analyzer Application Note L C Introduction Traditionally RF and microwave components have been designed in packages
Evaluating Oscilloscope Mask Testing for Six Sigma Quality Standards
 Evaluating Oscilloscope Mask Testing for Six Sigma Quality Standards Application Note Introduction Engineers use oscilloscopes to measure and evaluate a variety of signals from a range of sources. Oscilloscopes
Monitoring Of Drag Anchor Embedment Parameters. Roderick Ruinen, Vryhof Anchors BV
 Monitoring Of Drag Anchor Embedment Parameters. Roderick Ruinen, Vryhof Anchors BV Introduction. Drag embedment anchor installation typically consists of applying a pre-determined load to the mooring line
ISOMET. Compensation look-up-table (LUT) and How to Generate. Isomet: Contents:
 and How to Generate. Isomet: Contents:") Compensation look-up-table (LUT) and How to Generate Contents: Description Background theory Basic LUT pg 2 Creating a LUT pg 3 Using the LUT pg 7 Comment pg 9 The compensation look-up-table (LUT) contains
Compensation look-up-table (LUT) and How to Generate Contents: Description Background theory Basic LUT pg 2 Creating a LUT pg 3 Using the LUT pg 7 Comment pg 9 The compensation look-up-table (LUT) contains
Characterization and improvement of unpatterned wafer defect review on SEMs
 Characterization and improvement of unpatterned wafer defect review on SEMs Alan S. Parkes *, Zane Marek ** JEOL USA, Inc. 11 Dearborn Road, Peabody, MA 01960 ABSTRACT Defect Scatter Analysis (DSA) provides
Torsional vibration analysis in ArtemiS SUITE 1
 02/18 in ArtemiS SUITE 1 Introduction 1 Revolution speed information as a separate analog channel 1 Revolution speed information as a digital pulse channel 2 Proceeding and general notes 3 Application
STATUS OF THE SWISSFEL C-BAND LINEAR ACCELERATOR
 Proceedings of FEL213, New York, NY, USA STATUS OF THE SWISSFEL C-BAND LINEAR ACCELERATOR F. Loehl, J. Alex, H. Blumer, M. Bopp, H. Braun, A. Citterio, U. Ellenberger, H. Fitze, H. Joehri, T. Kleeb, L.
Practical Application of the Phased-Array Technology with Paint-Brush Evaluation for Seamless-Tube Testing
 ECNDT 2006 - Th.1.1.4 Practical Application of the Phased-Array Technology with Paint-Brush Evaluation for Seamless-Tube Testing R.H. PAWELLETZ, E. EUFRASIO, Vallourec & Mannesmann do Brazil, Belo Horizonte,
CAEN Tools for Discovery
 Viareggio March 28, 2011 Introduction: what is the SiPM? The Silicon PhotoMultiplier (SiPM) consists of a high density (up to ~10 3 /mm 2 ) matrix of diodes connected in parallel on a common Si substrate.
A video signal processor for motioncompensated field-rate upconversion in consumer television
 A video signal processor for motioncompensated field-rate upconversion in consumer television B. De Loore, P. Lippens, P. Eeckhout, H. Huijgen, A. Löning, B. McSweeney, M. Verstraelen, B. Pham, G. de Haan,
Application Note #63 Field Analyzers in EMC Radiated Immunity Testing
 Application Note #63 Field Analyzers in EMC Radiated Immunity Testing By Jason Galluppi, Supervisor Systems Control Software In radiated immunity testing, it is common practice to utilize a radio frequency
Open loop tracking of radio occultation signals in the lower troposphere
 Open loop tracking of radio occultation signals in the lower troposphere S. Sokolovskiy University Corporation for Atmospheric Research Boulder, CO Refractivity profiles used for simulations (1-3) high
An Overview of Video Coding Algorithms
 An Overview of Video Coding Algorithms Prof. Ja-Ling Wu Department of Computer Science and Information Engineering National Taiwan University Video coding can be viewed as image compression with a temporal
Advanced Photon Source - Upgrades and Improvements
 Advanced Photon Source - Upgrades and Improvements Horst W. Friedsam, Jaromir M. Penicka Argonne National Laboratory, Argonne, Illinois, USA 1. INTRODUCTION The APS has been operational since 1995. Recently
The absolute opposite of ordinary. G804 Quad Channel Edge Blending processor
 The absolute opposite of ordinary G804 Quad Channel Edge Blending processor Input: up to 4096*2160 @60hz 4:4:4 full color sampling Output: 2048*1080 @60Hz New generation Warp & Edge blending engine Technical
Getting Started. Connect green audio output of SpikerBox/SpikerShield using green cable to your headphones input on iphone/ipad.
 Getting Started First thing you should do is to connect your iphone or ipad to SpikerBox with a green smartphone cable. Green cable comes with designators on each end of the cable ( Smartphone and SpikerBox
Proceedings of Meetings on Acoustics
 Proceedings of Meetings on Acoustics Volume 19, 2013 http://acousticalsociety.org/ ICA 2013 Montreal Montreal, Canada 2-7 June 2013 Psychological and Physiological Acoustics Session 4aPPb: Binaural Hearing
National Institute of Radiological Sciences. Naoya Saotome
 National Institute of Radiological Sciences Naoya Saotome 1 Contents Introduction History and collaboration KCC i-rock Commissioning of commercial scanning system NIRS Gantry Commissioning of NIRS s Gantry
Field Service Procedure Replacement PCU Kit, ST24
 1. Brief Summary: Troubleshooting document for diagnosing a fault with and replacing the main PCU PCB on the ST24 antenna. 2. Checklist: Verify Initialization Built In Test 3. Theory of Operation: The
PERFORMANCE SPECIFICATIONS*
 PERFORMANCE SPECIFICATIONS* 18T-2127 26T-2127 Reflector Material Mounting Hardware Gain Input Frequency** -3 db Beam Width Cross Polarity Rejection Front to Back Ratio Impedance @ Output Elevation Adjustment
Iterative Direct DPD White Paper
 Iterative Direct DPD White Paper Products: ı ı R&S FSW-K18D R&S FPS-K18D Digital pre-distortion (DPD) is a common method to linearize the output signal of a power amplifier (PA), which is being operated
Solution for Nonuniformities and Spatial Noise in Medical LCD Displays by Using Pixel-Based Correction
 Solution for Nonuniformities and Spatial Noise in Medical LCD Displays by Using Pixel-Based Correction Tom Kimpe, Albert Xthona, Paul Matthijs, and Lode De Paepe Liquid crystal displays (LCD) are rapidly
ESI VLS-2000 Video Line Scaler
 ESI VLS-2000 Video Line Scaler Operating Manual Version 1.2 October 3, 2003 ESI VLS-2000 Video Line Scaler Operating Manual Page 1 TABLE OF CONTENTS 1. INTRODUCTION...4 2. INSTALLATION AND SETUP...5 2.1.Connections...5
APPLICATION NOTE AN-B03. Aug 30, Bobcat CAMERA SERIES CREATING LOOK-UP-TABLES
 APPLICATION NOTE AN-B03 Aug 30, 2013 Bobcat CAMERA SERIES CREATING LOOK-UP-TABLES Abstract: This application note describes how to create and use look-uptables. This note applies to both CameraLink and
Algebra I Module 2 Lessons 1 19
 Eureka Math 2015 2016 Algebra I Module 2 Lessons 1 19 Eureka Math, Published by the non-profit Great Minds. Copyright 2015 Great Minds. No part of this work may be reproduced, distributed, modified, sold,
Infrared Laser Satellite- Aircraft Communication
 Infrared Laser Satellite- Aircraft Communication Paul Christopher PFC Associates Leesburg, VA pfchristopher56@gmail.com Satellite-Aircraft Laser Communication Chu and Hogg laser attenuation vs wavelength
N T I. Introduction. II. Proposed Adaptive CTI Algorithm. III. Experimental Results. IV. Conclusion. Seo Jeong-Hoon
 An Adaptive Color Transient Improvement Algorithm IEEE Transactions on Consumer Electronics Vol. 49, No. 4, November 2003 Peng Lin, Yeong-Taeg Kim jhseo@dms.sejong.ac.kr 0811136 Seo Jeong-Hoon CONTENTS
New Filling Pattern for SLS-FEMTO
 SLS-TME-TA-2009-0317 July 14, 2009 New Filling Pattern for SLS-FEMTO Natalia Prado de Abreu, Paul Beaud, Gerhard Ingold and Andreas Streun Paul Scherrer Institut, CH-5232 Villigen PSI, Switzerland A new
PRACTICAL APPLICATION OF THE PHASED-ARRAY TECHNOLOGY WITH PAINT-BRUSH EVALUATION FOR SEAMLESS-TUBE TESTING
 PRACTICAL APPLICATION OF THE PHASED-ARRAY TECHNOLOGY WITH PAINT-BRUSH EVALUATION FOR SEAMLESS-TUBE TESTING R.H. Pawelletz, E. Eufrasio, Vallourec & Mannesmann do Brazil, Belo Horizonte, Brazil; B. M. Bisiaux,
BCM Calibration for E Abstract
 Jefferson Lab E8-4 Analysis Report July 22 BCM Calibration for E8-4 Patricia Solvignon Jefferson Lab E-mail solvigno@jlab.org Abstract In this note, the calibration procedure of the Beam Current Monitors
Pre-processing of revolution speed data in ArtemiS SUITE 1
 03/18 in ArtemiS SUITE 1 Introduction 1 TTL logic 2 Sources of error in pulse data acquisition 3 Processing of trigger signals 5 Revolution speed acquisition with complex pulse patterns 7 Introduction
G-106Ex Single channel edge blending Processor. G-106Ex is multiple purpose video processor with warp, de-warp, video wall control, format
 G-106Ex Single channel edge blending Processor G-106Ex is multiple purpose video processor with warp, de-warp, video wall control, format conversion, scaler switcher, PIP/POP, 3D format conversion, image
Analyze Frequency Response (Bode Plots) with R&S Oscilloscopes Application Note
 with R&S Oscilloscopes Application Note") Analyze Frequency Response (Bode Plots) with R&S Oscilloscopes Application Note Products: R&S RTO2002 R&S RTO2004 R&S RTO2012 R&S RTO2014 R&S RTO2022 R&S RTO2024 R&S RTO2044 R&S RTO2064 This application
Analyze Frequency Response (Bode Plots) with R&S Oscilloscopes Application Note Products: R&S RTO2002 R&S RTO2004 R&S RTO2012 R&S RTO2014 R&S RTO2022 R&S RTO2024 R&S RTO2044 R&S RTO2064 This application
Subtitle Safe Crop Area SCA
 Subtitle Safe Crop Area SCA BBC, 9 th June 2016 Introduction This document describes a proposal for a Safe Crop Area parameter attribute for inclusion within TTML documents to provide additional information
Reconstruction of Ca 2+ dynamics from low frame rate Ca 2+ imaging data CS229 final project. Submitted by: Limor Bursztyn
 Reconstruction of Ca 2+ dynamics from low frame rate Ca 2+ imaging data CS229 final project. Submitted by: Limor Bursztyn Introduction Active neurons communicate by action potential firing (spikes), accompanied
HOW TO POINT A DISH ANTENNA
 HOW TO POINT A DISH ANTENNA A2.1 INSTALLING A SATELLITE DISH USING HD RANGER 2 A2.1.1 A bit of history That's it, a bit of history. First artificial satellite "Sputnik I" was launched 4th of October of
First LHC Beams in ATLAS. Peter Krieger University of Toronto On behalf of the ATLAS Collaboration
 First LHC Beams in ATLAS Peter Krieger University of Toronto On behalf of the ATLAS Collaboration Cutaway View LHC/ATLAS (Graphic) P. Krieger, University of Toronto Aspen Winter Conference, Feb. 2009 2
SAAV contains upgraded MEMS sensors that reduce power consumption and improve resolution.
 SAAV Model 001 Inspired by feedback from customers, SAAV has been designed to enable faster and simpler installation with direct installation in casing sizes from 47 mm to 100 mm inside diameter. SAAV
Technical report on validation of error models for n.
 Technical report on validation of error models for 802.11n. Rohan Patidar, Sumit Roy, Thomas R. Henderson Department of Electrical Engineering, University of Washington Seattle Abstract This technical
Communication Theory and Engineering
 Communication Theory and Engineering Master's Degree in Electronic Engineering Sapienza University of Rome A.A. 2018-2019 Practice work 14 Image signals Example 1 Calculate the aspect ratio for an image
Statistical Consulting Topics. RCBD with a covariate
 Statistical Consulting Topics RCBD with a covariate Goal: to determine the optimal level of feed additive to maximize the average daily gain of steers. VARIABLES Y = Average Daily Gain of steers for 160
Agilent PN Time-Capture Capabilities of the Agilent Series Vector Signal Analyzers Product Note
 Agilent PN 89400-10 Time-Capture Capabilities of the Agilent 89400 Series Vector Signal Analyzers Product Note Figure 1. Simplified block diagram showing basic signal flow in the Agilent 89400 Series VSAs
CRT Dynamics. A report on the dynamical properties of CRT based visual displays
 CRT Dynamics A report on the dynamical properties of CRT based visual displays Display-Metrology & Systems 2007 Introduction In 2004 more LCD-monitors have been sold as computer monitors than CRT-based
ROOM LOW-FREQUENCY RESPONSE ESTIMATION USING MICROPHONE AVERAGING
 ROOM LOW-FREQUENCY RESPONSE ESTIMATION USING MICROPHONE AVERAGING Julius Newell, Newell Acoustic Engineering, Lisbon, Portugal Philip Newell, Acoustics consultant, Moaña, Spain Keith Holland, ISVR, University
E X P E R I M E N T 1
 E X P E R I M E N T 1 Getting to Know Data Studio Produced by the Physics Staff at Collin College Copyright Collin College Physics Department. All Rights Reserved. University Physics, Exp 1: Getting to
Testing and Characterization of the MPA Pixel Readout ASIC for the Upgrade of the CMS Outer Tracker at the High Luminosity LHC
 Testing and Characterization of the MPA Pixel Readout ASIC for the Upgrade of the CMS Outer Tracker at the High Luminosity LHC Dena Giovinazzo University of California, Santa Cruz Supervisors: Davide Ceresa
Beam test of the QMB6 calibration board and HBU0 prototype
 Beam test of the QMB6 calibration board and HBU0 prototype J. Cvach 1, J. Kvasnička 1,2, I. Polák 1, J. Zálešák 1 May 23, 2011 Abstract We report about the performance of the HBU0 board and the optical
A Simple, Yet Powerful Method to Characterize Differential Interconnects
 A Simple, Yet Powerful Method to Characterize Differential Interconnects Overview Measurements in perspective The automatic fixture removal (AFR) technique for symmetric fixtures Automatic Fixture Removal
Mmw radar solution for terrain awareness in UAVs ("1+2" solution)
") Mmw radar solution for terrain awareness in UAVs ("1+2" solution) Aimed at the flight environment of plant protection UAVs, Nanoradar has launched a millimeter-wave radar solution for terrain awareness
Mmw radar solution for terrain awareness in UAVs ("1+2" solution) Aimed at the flight environment of plant protection UAVs, Nanoradar has launched a millimeter-wave radar solution for terrain awareness
BitWise (V2.1 and later) includes features for determining AP240 settings and measuring the Single Ion Area.
 includes features for determining AP240 settings and measuring the Single Ion Area.") BitWise. Instructions for New Features in ToF-AMS DAQ V2.1 Prepared by Joel Kimmel University of Colorado at Boulder & Aerodyne Research Inc. Last Revised 15-Jun-07 BitWise (V2.1 and later) includes features
BitWise. Instructions for New Features in ToF-AMS DAQ V2.1 Prepared by Joel Kimmel University of Colorado at Boulder & Aerodyne Research Inc. Last Revised 15-Jun-07 BitWise (V2.1 and later) includes features
DCI Memorandum Regarding Direct View Displays
 1. Introduction DCI Memorandum Regarding Direct View Displays Approved 27 June 2018 Digital Cinema Initiatives, LLC, Member Representatives Committee Direct view displays provide the potential for an improved
Spatial Light Modulators XY Series
 Spatial Light Modulators XY Series Phase and Amplitude 512x512 and 256x256 A spatial light modulator (SLM) is an electrically programmable device that modulates light according to a fixed spatial (pixel)
A New Standardized Method for Objectively Measuring Video Quality
 1 A New Standardized Method for Objectively Measuring Video Quality Margaret H Pinson and Stephen Wolf Abstract The National Telecommunications and Information Administration (NTIA) General Model for estimating
The Inframetrics 760 airborne thermal infrared data
 The Inframetrics 76 airborne thermal infrared data on the ReSeDA experiment Quality assessment and first recalibration of brightness temperature maps Table of Contents 7 Quality assessment and first recalibration
A New 4MW LHCD System for EAST
 1 EXW/P7-29 A New 4MW LHCD System for EAST Jiafang SHAN 1), Yong YANG 1), Fukun LIU 1), Lianmin ZHAO 1) and LHCD Team 1) 1) Institute of Plasma Physics, Chinese Academy of Sciences, Hefei, China E-mail
Agilent 81600B Tunable Laser Source Family Technical Specifications August New model: nm, low SSE output!
 New model: 1260 1375 nm, low SSE output! Agilent Tunable Laser Source Family Technical Specifications August 2004 The Agilent Tunable Laser Source Family offers the from 1260 nm to 1640 nm with the minimum
CCSDS TELEMETRY CHANNEL CODING: THE TURBO CODING OPTION. Gian Paolo Calzolari #, Enrico Vassallo #, Sandi Habinc * ABSTRACT
 CCSDS TELEMETRY CHANNEL CODING: THE TURBO CODING OPTION Gian Paolo Calzolari #, Enrico Vassallo #, Sandi Habinc * ABSTRACT As of 1993 a new coding concept promising gains as close as 0.5 db to the Shannon
De-embedding Gigaprobes Using Time Domain Gating with the LeCroy SPARQ
 De-embedding Gigaprobes Using Time Domain Gating with the LeCroy SPARQ Dr. Alan Blankman, Product Manager Summary Differential S-parameters can be measured using the Gigaprobe DVT30-1mm differential TDR
FIBRE CHANNEL CONSORTIUM
 FIBRE CHANNEL CONSORTIUM FC-PI-2 Clause 6 Optical Physical Layer Test Suite Version 0.51 Technical Document Last Updated: August 15, 2005 Fibre Channel Consortium Durham, NH 03824 Phone: +1-603-862-0701
Full Disclosure Monitoring
 Full Disclosure Monitoring Power Quality Application Note Full Disclosure monitoring is the ability to measure all aspects of power quality, on every voltage cycle, and record them in appropriate detail
BIBLIOMETRIC REPORT. Bibliometric analysis of Mälardalen University. Final Report - updated. April 28 th, 2014
 BIBLIOMETRIC REPORT Bibliometric analysis of Mälardalen University Final Report - updated April 28 th, 2014 Bibliometric analysis of Mälardalen University Report for Mälardalen University Per Nyström PhD,
Sentinel 2 Image Delivery Platform
 Sentinel 2 Image Delivery Platform Forest Industry Informatics - SCION Sam Damesin, Grant Pearse, Ralf Gommers, Andrew Gordon, Jonathan Dash March 2017 Imagine Currently not possible National natural resource
High Resolution Multicolor Contrast Scanner. Dimensioned drawing
 Specifications and description KRTM 20 High Resolution Multicolor Contrast Scanner Dimensioned drawing en 01-2011/06 50116669 12mm 20mm 50mm 12-30 V DC 50 / 25 khz We reserve the right to make changes
Blueline, Linefree, Accuracy Ratio, & Moving Absolute Mean Ratio Charts
 INTRODUCTION This instruction manual describes for users of the Excel Standard Celeration Template(s) the features of each page or worksheet in the template, allowing the user to set up and generate charts
PACS. Dark Current of Ge:Ga detectors from FM-ILT. J. Schreiber 1, U. Klaas 1, H. Dannerbauer 1, M. Nielbock 1, J. Bouwman 1.
 PACS Test Analysis Report FM-ILT Page 1 Dark Current of Ge:Ga detectors from FM-ILT J. Schreiber 1, U. Klaas 1, H. Dannerbauer 1, M. Nielbock 1, J. Bouwman 1 1 Max-Planck-Institut für Astronomie, Königstuhl
MODE FIELD DIAMETER AND EFFECTIVE AREA MEASUREMENT OF DISPERSION COMPENSATION OPTICAL DEVICES
 MODE FIELD DIAMETER AND EFFECTIVE AREA MEASUREMENT OF DISPERSION COMPENSATION OPTICAL DEVICES Hale R. Farley, Jeffrey L. Guttman, Razvan Chirita and Carmen D. Pâlsan Photon inc. 6860 Santa Teresa Blvd
DESIGNING OPTIMIZED MICROPHONE BEAMFORMERS
 3235 Kifer Rd. Suite 100 Santa Clara, CA 95051 www.dspconcepts.com DESIGNING OPTIMIZED MICROPHONE BEAMFORMERS Our previous paper, Fundamentals of Voice UI, explained the algorithms and processes required
Analog Performance-based Self-Test Approaches for Mixed-Signal Circuits
 Analog Performance-based Self-Test Approaches for Mixed-Signal Circuits Tutorial, September 1, 2015 Byoungho Kim, Ph.D. Division of Electrical Engineering Hanyang University Outline State of the Art for
Screen investigations for low energetic electron beams at PITZ
 1 Screen investigations for low energetic electron beams at PITZ S. Rimjaem, J. Bähr, H.J. Grabosch, M. Groß Contents Review of PITZ setup Screens and beam profile monitors at PITZ Test results Summary
Laboratory Assignment 3. Digital Music Synthesis: Beethoven s Fifth Symphony Using MATLAB
 Laboratory Assignment 3 Digital Music Synthesis: Beethoven s Fifth Symphony Using MATLAB PURPOSE In this laboratory assignment, you will use MATLAB to synthesize the audio tones that make up a well-known
Accurate Colour Reproduction in Prepress
 Acta Polytechnica Hungarica Vol. 5, No. 3, 2008 Accurate Colour Reproduction in Prepress Ákos Borbély Institute of Media Technology, Rejtő Sándor Faculty of Light Industry and Environmental Engineering,
Agilent 81600B Tunable Laser Source Family
 Agilent 81600B Tunable Laser Source Family Technical Specifications August 2007 The Agilent 81600B Tunable Laser Source Family offers the full wavelength range from 1260 nm to 1640 nm with the minimum
KRAMER ELECTRONICS LTD. USER MANUAL
 KRAMER ELECTRONICS LTD. USER MANUAL MODEL: Projection Curved Screen Blend Guide How to blend projection images on a curved screen using the Warp Generator version K-1.4 Introduction The guide describes
Cycle-7 MAMA Pulse height distribution stability: Fold Analysis Measurement
 STIS Instrument Science Report, STIS 98-02R Cycle-7 MAMA Pulse height distribution stability: Fold Analysis Measurement Harry Ferguson, Mark Clampin and Vic Argabright October 26, 1998 ABSTRACT We describe
Characterizing Transverse Beam Dynamics at the APS Storage Ring Using a Dual-Sweep Streak Camera
 Characterizing Transverse Beam Dynamics at the APS Storage Ring Using a Dual-Sweep Streak Camera Bingxin Yang, Alex H. Lumpkin, Katherine Harkay, Louis Emery, Michael Borland, and Frank Lenkszus Advanced
ISOMET. Compensation look-up-table (LUT) and Scan Uniformity
 and Scan Uniformity") Compensation look-up-table (LUT) and Scan Uniformity The compensation look-up-table (LUT) contains both phase and amplitude data. This is automatically applied to the Image data to maximize diffraction
Compensation look-up-table (LUT) and Scan Uniformity The compensation look-up-table (LUT) contains both phase and amplitude data. This is automatically applied to the Image data to maximize diffraction
The high-end network analyzers from Rohde & Schwarz now include an option for pulse profile measurements plus, the new R&S ZVA 40 covers the
 GENERAL PURPOSE 44 448 The high-end network analyzers from Rohde & Schwarz now include an option for pulse profile measurements plus, the new R&S ZVA 4 covers the frequency range up to 4 GHz. News from
In-Cell Projected Capacitive Touch Panel Technology
 1384 INVITED PAPER Special Section on Electronic Displays In-Cell Projected Capacitive Touch Panel Technology Yasuhiro SUGITA a), Member, Kazutoshi KIDA, and Shinji YAMAGISHI, Nonmembers SUMMARY We describe
2. AN INTROSPECTION OF THE MORPHING PROCESS
 1. INTRODUCTION Voice morphing means the transition of one speech signal into another. Like image morphing, speech morphing aims to preserve the shared characteristics of the starting and final signals,
The absolute opposite of ordinary
 The absolute opposite of ordinary G406Lite 4K/60 video wall controller 1 in / 4 out in one box, HDMI 2.0 / HDCP 2.2 input up to DCi/UHD 4K/60 fps, 10-bit processor, 4:4:4 Chroma sampling, Independent rotation/
How Close Can They be Stacked? By K0CQ. How close can yagis for harmonically related bands be stacked? What are the consequences of close stacking?
 How Close Can They be Stacked? By K0CQ How close can yagis for harmonically related bands be stacked? What are the consequences of close stacking? This study has been inspired by Kent Britain's display