Do delay tactics affect silking date and yield of maize inbreds? Stephen Zimmerman Creative Component November 2015
|
|
|
- Della Sanders
- 5 years ago
- Views:
Transcription
1 Do delay tactics affect silking date and yield of maize inbreds? Stephen Zimmerman Creative Component November 2015
2 Overview Acknowledgements My Background Introduction Materials and Methods Results and Discussion Conclusion Questions
3 Acknowledgements Major Professor Dr. Allen Knapp Program of Study Committee Dr. Thomas Loynachan and Dr. Kenneth Moore Program Coordinator Dawn Miller Mentors/Supporters Patrick McMullan, Adda Sayers, Darrin Roberts, and John Schmidt DuPont Pioneer Production Research staff


4 My Background Grew up near Harlan, IA on a family farm. Currently, my wife Beth and I live in Ankeny, IA. Enjoy, the outdoors, gardening, visiting family, and attending ISU sporting events.
5 Career DuPont Pioneer Production Research Group KMR Carroll, IA Independent research company that conducts yield trials across the Midwest. ISU Bachelors of Science in Agronomy Bizy Farms Inc Corn/soybean farm with swine confinements. Iowa Western Community College AAS Ag Business degree

6 Production Research Production of hybrid corn requires a female parent to be pollinated by a male parent. Production Research conducts research on parents going into production. Research projects focus on practices that influence seed quality, yield, and reliability.
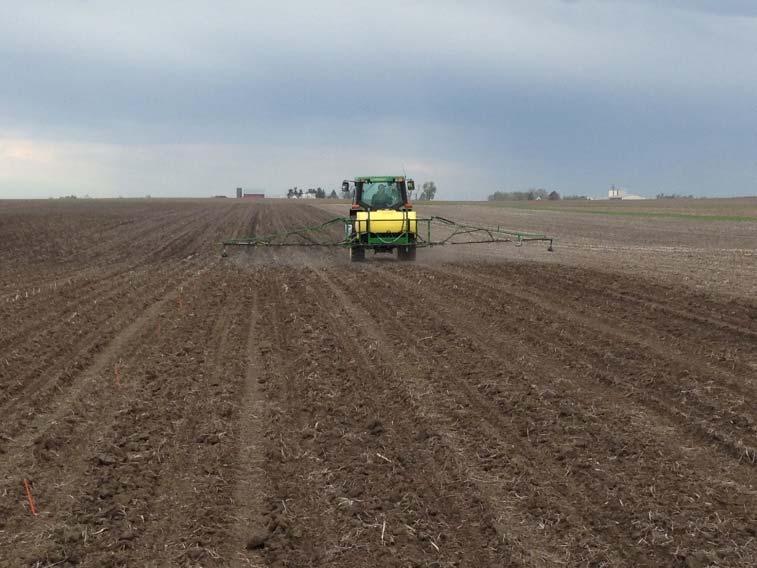
7 Introduction To facilitate a proper nick standard practice is to delay the male by planting at a later date or by mechanical means after emergence. Because of weather or other unforeseen issues, planting the male at the recommended delay is not possible. The results in a poor nick, which can result in reduced yield, and increased outcrossing due to a low pollen environment. Currently, even if the agronomist realizes this is going to occur, few corrective actions are available.
8 The Nick Ideal Situation Desired. planting timing with 200 GDU delay Female 1400 GDUs Male 1200 GDUs Problem Rain causes male to be planted at 300 GDU delay. Female 1400 GDUs Male 1200 GDUs


9 Materials and Methods Trial conducted in 2013 & 2014 Locations in 2013 Alleman, IA; Windfall, IN; Champaign, IL; York, NE Locations in 2014 Alleman, IA; Windfall, IN; Champaign, IL; Constantine, MI Split plot design with 4 replications Whole plot: Entry SP: Treatment Plot represented by four rows of female parent with one row of mixed male pollinator on each side. Data collected on center two female rows. M F F F F M Plot length FT. 4 rows wide or 10 FT.
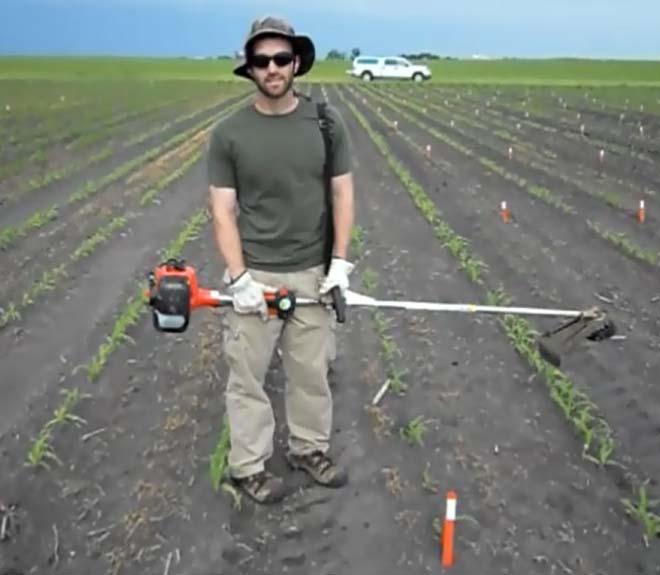
10 Materials and Methods Entries whole plot Entry No. GDUs to silk Plant Height (inches) Treatments split plot Treatment No. Treatment Timing Comments 1 Untreated check UNT 2 Cut at V2 V2 Leave 1 inch of stalk above soil 3 Cut at V5 V5 Standard cut leave 4 in. stalk 4 Vertical Cut at V5 V5 Cut plant vertically leaving stalk intact

11 V2 Cut Treatment

12 V5 Cut Treatment

13 V5 Vertical Cut Treatment
14 Data Collected Early Stand count not presented Late stand count not presented GDUs calculated from % silking dates Growing Degree Unit = (Tmax +Tmin)/2 Tbase (50 degree F min) Barren count not presented Yield 80k units/female acre (Weight, moisture, kernels/pound, saleable seed %) Small discard Large discard not presented Percent cold germination Warm germination not presented
15 Analysis Completed using PROC GLIMMIX in SAS EG version 6.1 Entry and treatment run as fixed factors Factors considered significant at alpha level 0.05 Least square means calculated using a LSMEANS statement direct comparisons made with an ESTIMATE statement
16 Results Cut effect on silking Treatment effects on GDUSLK (growing degree units to 50% silking) delay compared to untreated check GDUs of Delay From UTC A 33 B 0 C 2.V2_CUT 3.V5_CUT 4.V5_VC LS means with the same letter are not significantly different (P<=0.05) Type III tests of fixed effects GDUSLK (growing degree units to 50% silking) Effect Num DF Den DF F Value Pr > F Entry <.0001 Treatment <.0001 EntryTreatment
17 Results GDU s to silking GDUs ,503 1, ,515 1, ,545 1, Entry 1 Entry 2 Entry 3 Entry 4 1,492 1, UNT 2.V2_CUT 3.V5_CUT 4.V5_VC
18 Results Entry Treatment Contrasts for the V2 cut delay, Entry 4 compared to Entries 1, 2 and 3. Treatment Entry Treatment Entry Estimate Standard DF t Value Pr > t (GDU) Error 2.V2_CUT 1 2.V2_CUT V2_CUT 2 2.V2_CUT V2_CUT 3 2.V2_CUT
19 Results Silking Duration Silking duration (GDUs) A 67.3 B 64.2 B 62.5 B 0 2.V2_CUT 1.UNT 3.V5_CUT 4.V5_VC LS means with the same letter are not significantly different (P<=0.05).
20 Results Small discard A 9.3 A 9.0 A % small discard B UNT 4.V5_VC 3.V5_CUT 2.V2_CUT LS means with the same letter are not significantly different (P<=0.05).
21 Results Saleable seed A 91.0 % Saleable seed B 90.0 BC 89.4 C V2_CUT 3.V5_CUT 4.V5_VC 1.UNT LS means with the same letter are not significantly different (P<=0.05). Type 3 Tests of Fixed Effects % Saleable Seed Effect Num DF Den DF F Value Pr > F Entry <.0001 Treatment EntryTreatment
22 Results Saleable seed % saleable seed UNT 2.V2_CUT 3.V5_CUT 4.V5_VC Entry 1 Entry 2 Entry 3 Entry 4 An asterisk indicates a sign. diff. (P<=0.05) with the untreated check within an entry.
23 Results 80K units % dif. from UNT V2_CUT 3.V5_CUT 4.V5_VC An asterisk indicates a sign. diff. (P<=0.05) compared to the UNT.
24 Results Cold germination Percent cold germination shown entry by treatment. % Cold germination UNT 2.V2_CUT 3.V5_CUT 4.V5_VC 70 Entry 1 Entry 2 Entry 3 Entry 4
25 Conclusion V2 Cut treatment most effective at delaying female silking (43 GDUs). V2 effect on seed yield minimal ( 3.5% 80k units/acre). V2 cut did not cause loss of female plant population. V2 cut did not negatively effect warm/cold germination. V2 cut slightly decreased small discard and increased salable seed percentage.


26 Questions? Thank you!
27 Silk timing and delay Type III Tests of Fixed Effects GDUSLK Effect Num DF Den DF F Value Pr > F EntryNUM <.0001 TRT <.0001 EntryNUMTRT Estimates Label Estimate Standard DF t Value Pr > t Error GDUs to 50% silk C 1508 A 1498 B 1465 C 1.UNT vs 2.V2_CUT < UNT vs 3.V5Cut < UNT vs 4.V5_VC TRT Least Squares Means 1560 TRT Estimate Standard DF Dif. in 1540 Error GDUs 1,504 from ,503 UNT 1.UNT V2_CUT V5_CUT V5_VC , ,450 GDUs to 50% silk/ UNT 2.V2_CUT 3.V5_CUT 4.V5_VC 1,515 1,505 1,466 1,461 1,545 1,530 1,492 1,490 1,492 1,487 1,465 1,468 1.UNT 2.V2_CUT 3.V5_CUT 4.V5_VC 1400 Entry 1 Entry 2 Entry 3 Entry 4 Asterisk indicates sig. dif. from UNT at.05 level
28 80k/acre Female yield Type III Tests of Fixed Effects 80K/acre yield Effect Num Den DF F Value Pr > F DF EntryNUM TRT <.0001 EntryNUMTRT Estimates Label Standard DF t Value Pr > t Error 1.UNT vs 2.V2_CUT % yield change from UNT V2_CUT 3.V5_CUT 4.V5_VC 1.UNT vs 3.V5Cut UNT vs 4.V5_VC
29 Duration of silking Type 3 Tests of Fixed Effects Effect Num DF Den DF F Value Pr > F EntryNUM A TRT <.0001 EntryNUMTRT Estimates Label Estimate STD ERR DF Pr > F 1.UNT vs 2.V2_CUT UNT vs 3.V5Cut Length of silking (GDUs) B 64.2 B 62.5 B 1.UNT vs 4.V5_VC V2_CUT 1.UNT 3.V5_CUT 4.V5_VC GDUs UNT 2.V2_CUT 3.V5_CUT 4.V5_VC slk 50slk 90slk
30 Percent Saleable Seed Type 3 Tests of Fixed Effects Effect Num DF Den DF F Value Pr > F EntryNUM <.0001 TRT EntryNUMT RT Contrasts Label Estimate STD ERR DF Pr > F 1.UNT vs 2.V2_CUT 1.UNT vs 3.V5Cut 1.UNT vs 4.V5_VC < Effect TRT Estimate Diff. from UNT TRT 1.UNT TRT 2.V2_CUT TRT 3.V5_CUT TRT 4.V5_VC % saleable seed % saleable seed A 90 B 90 BC 89 C 2.V2_CUT 3.V5_CUT 4.V5_VC 1.UNT UNT 2.V2_CUT 3.V5_CUT 4.V5_VC Entry 3 4 Asterisk indicates sig. dif. from UNT at.05 level
31 Small discard Type 3 Tests of Fixed Effects Effect Num DF Den DF F Value Pr > F EntryNUM <.0001 TRT EntryNUMTRT Estimates Label Estimate STD ERR DF Pr > F 1.UNT vs 2.V2_CUT < UNT vs V5Cut 1.UNT vs 4.V5_VC % Small Discard A 9.3 A 9.0 A 7.9 B 1.UNT 4.V5_VC 3.V5_CUT 2.V2_CUT Effect TRT Estimate Diff. from UNT TRT 1.UNT TRT 2.V2_CUT TRT 3.V5_CUT TRT 4.V5_VC % Small Discard UNT 2.V2_CUT 3.V5_CUT 4.V5_VC 0 Entry 1 Entry 2 Entry 3 Entry 4 Asterisk indicates sig. dif. from UNT at.05 level
32 Large discard Type 3 Tests of Fixed Effects Effect Num DF Den DF F Value Pr > F EntryNUM <.0001 TRT EntryNUMTRT Contrasts Label Num DF Den DF F Value Pr > F 1.UNT vs 2.V2_CUT UNT vs 3.V5Cut UNT vs 4.V5_VC % Large discard UNT 2.V2_CUT 3.V5_CUT 4.V5_VC Entry 3 4
33 Kernels per pound Type 3 Tests of Fixed Effects Effect Num DF Den DF F Value Pr > F EntryNUM <.0001 TRT EntryNUMTRT Contrasts Label Num DF Den DF F Value Pr > F 1.UNT vs V2_CUT 1.UNT vs V5Cut 1.UNT vs 4.V5_VC Kernels/lb Entry UNT 2.V2_CUT 3.V5_CUT 4.V5_VC
34 Harvest stalk count Type 3 Tests of Fixed Effects Effect Num Den DF F Value Pr > F DF EntryNUM TRT EntryNUMTRT Contrasts Label Num DF Den DF F Value Pr > F 1.UNT vs V2_CUT 1.UNT vs V5Cut 1.UNT vs 4.V5_VC Harvest stalk count UNT 2.V2_CUT 3.V5_CUT 4.V5_VC Entry 3 4 One plant in row equal 500 plants per acre
35 Process of analysis Data checked for outliers and bad data points Performed Bartlett test to confirm normalized data Proc mixed determined if location or year were significant factors PROC GLIMMIX used to determine fixed effects, LSMEANS and significant differences Estimate statement made direct comparisons of treatment effects.
36 SAS Code proc glimmix plots=residualpanel; class entrynum trt rep loc; model kersalpct = entrynum trt/ ddfm=kr; random rep(loc) entrynumrep(loc) loc; lsmeans entrynum /lines; estimate '1.UNT vs 2.V2_CUT' trt 1 100/cl; estimate '1.UNT vs 3.V5Cut' trt 1 010/cl; estimate '1.UNT vs 4.V5_VC' trt 1 001/cl; run; PROC MIXED METHOD=REML; CLASS entrynum Loc TRT Rep; MODEL warm=entrynum Loc TRT entrynumloc entrynumtrt LocTRT entrynumloctrt/ddfm=kenwardroger; RANDOM Rep(Loc) entrynumrep(loc) / TYPE=VC;; LSMEANS entrynum Loc TRT entrynumloc entrynumtrt LocTRT entrynumloctrt / ; RUN; QUIT;
Replicated Latin Square and Crossover Designs
 Replicated Latin Square and Crossover Designs Replicated Latin Square Latin Square Design small df E, low power If 3 treatments 2 df error If 4 treatments 6 df error Can use replication to increase df
RANDOMIZED COMPLETE BLOCK DESIGN (RCBD) Probably the most used and useful of the experimental designs.
 Probably the most used and useful of the experimental designs.") Description of the Design RANDOMIZED COMPLETE BLOCK DESIGN (RCBD) Probably the most used and useful of the experimental designs. Takes advantage of grouping similar experimental units into blocks or replicates.
Description of the Design RANDOMIZED COMPLETE BLOCK DESIGN (RCBD) Probably the most used and useful of the experimental designs. Takes advantage of grouping similar experimental units into blocks or replicates.
Mixed Effects Models Yan Wang, Bristol-Myers Squibb, Wallingford, CT
 PharmaSUG 2016 - Paper PO06 Mixed Effects Models Yan Wang, Bristol-Myers Squibb, Wallingford, CT ABSTRACT The MIXED procedure has been commonly used at the Bristol-Myers Squibb Company for quality of life
Statistical Consulting Topics. RCBD with a covariate
 Statistical Consulting Topics RCBD with a covariate Goal: to determine the optimal level of feed additive to maximize the average daily gain of steers. VARIABLES Y = Average Daily Gain of steers for 160
Paired plot designs experience and recommendations for in field product evaluation at Syngenta
 Paired plot designs experience and recommendations for in field product evaluation at Syngenta 1. What are paired plot designs? 2. Analysis and reporting of paired plot designs 3. Case study 1 : analysis
Latin Square Design. Design of Experiments - Montgomery Section 4-2
 Latin Square Design Design of Experiments - Montgomery Section 4-2 Latin Square Design Can be used when goal is to block on two nuisance factors Constructed so blocking factors orthogonal to treatment
Mixed Models Lecture Notes By Dr. Hanford page 151 More Statistics& SAS Tutorial at Type 3 Tests of Fixed Effects
 Assessing fixed effects Mixed Models Lecture Notes By Dr. Hanford page 151 In our example so far, we have been concentrating on determining the covariance pattern. Now we ll look at the treatment effects
AP Statistics Sec 5.1: An Exercise in Sampling: The Corn Field
 AP Statistics Sec.: An Exercise in Sampling: The Corn Field Name: A farmer has planted a new field for corn. It is a rectangular plot of land with a river that runs along the right side of the field. The
PROC GLM AND PROC MIXED CODES FOR TREND ANALYSES FOR ROW-COLUMN DESIGNED EXPERIMENTS
 PROC GLM AND PROC MIXED CODES FOR TREND ANALYSES FOR ROW-COLUMN DESIGNED EXPERIMENTS BU-1491-M June,2000 Walter T. Federer Dept. of Biometrics Cornell University Ithaca, NY 14853 wtfl@cornell.edu and Russell
Let s randomize your treatment (draw plot #s)
") Laying out the experiment Determine size of experimental area Our area: 75 x 90 Number of Treatments: Four + Control = 5 Don t forget control Tests no treatment Randomized Complete Block (RCB) Design Replication
Laying out the experiment Determine size of experimental area Our area: 75 x 90 Number of Treatments: Four + Control = 5 Don t forget control Tests no treatment Randomized Complete Block (RCB) Design Replication
Sampling Worksheet: Rolling Down the River
 Sampling Worksheet: Rolling Down the River Name: Part I A farmer has just cleared a new field for corn. It is a unique plot of land in that a river runs along one side. The corn looks good in some areas
RCBD with Sampling Pooling Experimental and Sampling Error
 RCBD with Sampling Pooling Experimental and Sampling Error As we had with the CRD with sampling, we will have a source of variation for sampling error. Calculation of the Experimental Error df is done
AP Statistics Sampling. Sampling Exercise (adapted from a document from the NCSSM Leadership Institute, July 2000).
.") AP Statistics Sampling Name Sampling Exercise (adapted from a document from the NCSSM Leadership Institute, July 2000). Problem: A farmer has just cleared a field for corn that can be divided into 100
AP Statistics Sampling Name Sampling Exercise (adapted from a document from the NCSSM Leadership Institute, July 2000). Problem: A farmer has just cleared a field for corn that can be divided into 100
Model II ANOVA: Variance Components
 Model II ANOVA: Variance Components Model II MS A = s 2 + ns 2 A MS A MS W = ns 2 A (MS A MS W )/n = ns 2 A /n = s2 A Usually Expressed: s 2 A /(s2 A + s2 W ) x 100 Assumptions of ANOVA Random Sampling
Integrated Precision Harvesting System: A Promising Technology to Improve Berry Yield and Quality. Precision Agriculture Research Team
 Integrated Precision Harvesting System: A Promising Technology to Improve Berry Yield and Quality Precision Research Team Objectives Develop improved integrated harvesting management systems = coupling
1'-tq/? BU-- _-M August 2000 Technical Report Series of the Department of Biometrics, Cornell University, Ithaca, New York 14853
 SAS/GLM AND SAS/MIXED FOR TREND ANALYSES US:ING FOURIER AND POLYNOMIAL REGRESSION FOR CENTERED AND NON-CENTERED VARIATES BY Walter T. Federer, Murari Singh, and Russell D. Wolfinger ABSTRACT Spatial variation
In this Issue: AMS News Letter. John Deere s new Display Shearer Equipment s 2017 Test Plot Information on the 17-1 Software update
 AMS News Letter Shearer Equipment Quarterly AMS News Summer 2017 Inside this issue: New John Deere Gen 4, 4640 Display 2 JDLink Reminders 4 5 2017 Test Plot Overview 17-1 Software Update Information 7
Modelling Intervention Effects in Clustered Randomized Pretest/Posttest Studies. Ed Stanek
 Modelling Intervention Effects in Clustered Randomized Pretest/Posttest Studies Introduction Ed Stanek We consider a study design similar to the design for the Well Women Project, and discuss analyses
Linear mixed models and when implied assumptions not appropriate
 Mixed Models Lecture Notes By Dr. Hanford page 94 Generalized Linear Mixed Models (GLMM) GLMMs are based on GLM, extended to include random effects, random coefficients and covariance patterns. GLMMs are
GLM Example: One-Way Analysis of Covariance
 Understanding Design and Analysis of Research Experiments An animal scientist is interested in determining the effects of four different feed plans on hogs. Twenty four hogs of a breed were chosen and
Block Block Block
 Advanced Biostatistics Quiz 3 Name March 16, 2005 9 or 10 Total Points Directions: Thoroughly, clearly and neatly answer the following two problems in the space given, showing all relevant calculations.
Prospects for managing Sclerotinia head rot with fungicides LESSONS FROM FIELD TRIALS CONDUCTED IN 2011
 Prospects for managing Sclerotinia head rot with fungicides LESSONS FROM FIELD TRIALS CONDUCTED IN 2011 Photos: Leonard Besemann Michael Wunsch, Michael Schaefer and Blaine Schatz, NDSU Carrington Research
TITLE OF PROJECT: 2004 Processing Pea Cultivar Evaluation
 TITLE OF PROJECT: 2004 Processing Pea Cultivar Evaluation PEA04-1 NAME OF CONTRIBUTOR(S) AND THEIR AGENCY: J.W. Zandstra and R.C. Squire, Ridgetown College, University of Guelph. Ridgetown ON. N0P 2C0
Moving on from MSTAT. March The University of Reading Statistical Services Centre Biometrics Advisory and Support Service to DFID
 Moving on from MSTAT March 2000 The University of Reading Statistical Services Centre Biometrics Advisory and Support Service to DFID Contents 1. Introduction 3 2. Moving from MSTAT to Genstat 4 2.1 Analysis
Problem Points Score USE YOUR TIME WISELY USE CLOSEST DF AVAILABLE IN TABLE SHOW YOUR WORK TO RECEIVE PARTIAL CREDIT
 Stat 514 EXAM I Stat 514 Name (6 pts) Problem Points Score 1 32 2 30 3 32 USE YOUR TIME WISELY USE CLOSEST DF AVAILABLE IN TABLE SHOW YOUR WORK TO RECEIVE PARTIAL CREDIT WRITE LEGIBLY. ANYTHING UNREADABLE
Oat Forage. Tifton, Georgia: Oat Forage Performance, Dry Matter Yield
 Brand-Variety 12/21/15 1/20/16 2/19/16 3/11/16 3/31/16 2016 2-Yr Avg -------------------------------------------- lb/acre -------------------------------------------- Okay 1775 1492 1372 2058 1481 8179
COTTON. Mississippi VARIETY TRIALS, Information Bulletin 441 February 2008
 Information Bulletin 441 February 2008 Mississippi COTTON VARIETY TRIALS, 2007 MISSISSIPPI AGRICULTURAL & FORESTRY EXPERIMENT STATION VANCE H. WATSON, DIRECTOR MISSISSIPPI STATE UNIVERSITY ROBERT H. FOGLESONG,
Resampling Statistics. Conventional Statistics. Resampling Statistics
 Resampling Statistics Introduction to Resampling Probability Modeling Resample add-in Bootstrapping values, vectors, matrices R boot package Conclusions Conventional Statistics Assumptions of conventional
Homework Packet Week #5 All problems with answers or work are examples.
 Lesson 8.1 Construct the graphical display for each given data set. Describe the distribution of the data. 1. Construct a box-and-whisker plot to display the number of miles from school that a number of
Missouri Cotton Varieties. Gene Stevens, PhD
 Missouri Cotton Varieties Gene Stevens, PhD Lewis Rone Farm- Portageville, MO November 2017 Bobby Tanner April Forrester Tyler Morris Heath Conaway 2017 Cotton Performance Testing Results Posted on two
Forage Test Results. Wheat Forage. Tifton, Georgia: Wheat Forage Performance,
 Forage Test Results Wheat Forage Tifton, Georgia: Brand-Variety 12-18-14 1-21-15 2-27-15 4-07-15 2015 2-Yr Avg ------------------------------------------ lb/acre ------------------------------------------
Supplementary Figures Supplementary Figure 1 Comparison of among-replicate variance in invasion dynamics
 1 Supplementary Figures Supplementary Figure 1 Comparison of among-replicate variance in invasion dynamics Scaled posterior probability densities for among-replicate variances in invasion speed (nine replicates
Relationships Between Quantitative Variables
 Chapter 5 Relationships Between Quantitative Variables Three Tools we will use Scatterplot, a two-dimensional graph of data values Correlation, a statistic that measures the strength and direction of a
N12/5/MATSD/SP2/ENG/TZ0/XX. mathematical STUDIES. Wednesday 7 November 2012 (morning) 1 hour 30 minutes. instructions to candidates
 1 hour 30 minutes. instructions to candidates") 88127402 mathematical STUDIES STANDARD level Paper 2 Wednesday 7 November 2012 (morning) 1 hour 30 minutes instructions to candidates Do not open this examination paper until instructed to do so. A graphic
88127402 mathematical STUDIES STANDARD level Paper 2 Wednesday 7 November 2012 (morning) 1 hour 30 minutes instructions to candidates Do not open this examination paper until instructed to do so. A graphic
Relationships. Between Quantitative Variables. Chapter 5. Copyright 2006 Brooks/Cole, a division of Thomson Learning, Inc.
 Relationships Chapter 5 Between Quantitative Variables Copyright 2006 Brooks/Cole, a division of Thomson Learning, Inc. Three Tools we will use Scatterplot, a two-dimensional graph of data values Correlation,
Texas Music Education Research
 Texas Music Education Research Reports of Research in Music Education Presented at the Annual Meetings of the Texas Music Educators Association San Antonio, Texas Robert A. Duke, Chair TMEA Research Committee
Algebra I Module 2 Lessons 1 19
 Eureka Math 2015 2016 Algebra I Module 2 Lessons 1 19 Eureka Math, Published by the non-profit Great Minds. Copyright 2015 Great Minds. No part of this work may be reproduced, distributed, modified, sold,
Mesotrione: Program for Bentgrass Removal and Overseeding (Fall Timing)
") Mesotrione: Program for Bentgrass Removal and Overseeding (Fall Timing) (Protocol #: HMS805B4-2007US) Final Report Charles T. Golob, William J. Johnston, Matthew W. Williams, and Christopher A. Proctor
Mesotrione: Program for Bentgrass Removal and Overseeding (Fall Timing) (Protocol #: HMS805B4-2007US) Final Report Charles T. Golob, William J. Johnston, Matthew W. Williams, and Christopher A. Proctor
Chapter 4. Displaying Quantitative Data. Copyright 2007 Pearson Education, Inc. Publishing as Pearson Addison-Wesley
 Chapter 4 Displaying Quantitative Data Copyright 2007 Pearson Education, Inc. Publishing as Pearson Addison-Wesley Dealing With a Lot of Numbers Summarizing the data will help us when we look at large
MultiSpec Tutorial: Visualizing Growing Degree Day (GDD) Images. In this tutorial, the MultiSpec image processing software will be used to:
 Images. In this tutorial, the MultiSpec image processing software will be used to:") MultiSpec Tutorial: Background: This tutorial illustrates how MultiSpec can me used for handling and analysis of general geospatial images. The image data used in this example is not multispectral data
MultiSpec Tutorial: Background: This tutorial illustrates how MultiSpec can me used for handling and analysis of general geospatial images. The image data used in this example is not multispectral data
Electrospray-MS Charge Deconvolutions without Compromise an Enhanced Data Reconstruction Algorithm utilising Variable Peak Modelling
 Electrospray-MS Charge Deconvolutions without Compromise an Enhanced Data Reconstruction Algorithm utilising Variable Peak Modelling Overview A.Ferrige1, S.Ray1, R.Alecio1, S.Ye2 and K.Waddell2 1 PPL,
subplots (30-m by 33-m) without space between potential subplots. Depending on the size of the
 without space between potential subplots. Depending on the size of the") REM-S-13-00090 Online Supplemental Information Pyke et al. Appendix I Subplot Selection within Arid SageSTEP whole plots Each of the four whole plots (fuel reduction treatments) was gridded into potential
REM-S-13-00090 Online Supplemental Information Pyke et al. Appendix I Subplot Selection within Arid SageSTEP whole plots Each of the four whole plots (fuel reduction treatments) was gridded into potential
More About Regression
 Regression Line for the Sample Chapter 14 More About Regression is spoken as y-hat, and it is also referred to either as predicted y or estimated y. b 0 is the intercept of the straight line. The intercept
Libraries as Repositories of Popular Culture: Is Popular Culture Still Forgotten?
 Wayne State University School of Library and Information Science Faculty Research Publications School of Library and Information Science 1-1-2007 Libraries as Repositories of Popular Culture: Is Popular
Ryegrass. Tifton, Georgia: Ryegrass Forage Performance, Dry Matter Yield
 Ryegrass Tifton, Georgia: Dry Matter Yield Harvest Date Season Totals Brand-Variety 1-06-11 2-24-11 3-17-11 4-07-11 4-21-11 2011 2-Yr Avg -------------------------------------------- lb/acre --------------------------------------------
STAT 113: Statistics and Society Ellen Gundlach, Purdue University. (Chapters refer to Moore and Notz, Statistics: Concepts and Controversies, 8e)
") STAT 113: Statistics and Society Ellen Gundlach, Purdue University (Chapters refer to Moore and Notz, Statistics: Concepts and Controversies, 8e) Learning Objectives for Exam 1: Unit 1, Part 1: Population
STAT 113: Statistics and Society Ellen Gundlach, Purdue University (Chapters refer to Moore and Notz, Statistics: Concepts and Controversies, 8e) Learning Objectives for Exam 1: Unit 1, Part 1: Population
I. Model. Q29a. I love the options at my fingertips today, watching videos on my phone, texting, and streaming films. Main Effect X1: Gender
 1 Hopewell, Sonoyta & Walker, Krista COM 631/731 Multivariate Statistical Methods Dr. Kim Neuendorf Film & TV National Survey dataset (2014) by Jeffres & Neuendorf MANOVA Class Presentation I. Model INDEPENDENT
TI-Inspire manual 1. Real old version. This version works well but is not as convenient entering letter
 TI-Inspire manual 1 Newest version Older version Real old version This version works well but is not as convenient entering letter Instructions TI-Inspire manual 1 General Introduction Ti-Inspire for statistics
MATH& 146 Lesson 11. Section 1.6 Categorical Data
 MATH& 146 Lesson 11 Section 1.6 Categorical Data 1 Frequency The first step to organizing categorical data is to count the number of data values there are in each category of interest. We can organize
Final Report. Selective Control of Persistent Perennial Ryegrass from Bermudagrass Turf
 Final Report Title: Investigators: Selective Control of Persistent Perennial Ryegrass from Bermudagrass Turf Jim Baird, Brent Barnes, and Alea Miehls Department of Botany and Plant Sciences 2137 Batchelor
How Large a Sample? CHAPTER 24. Issues in determining sample size
 388 Resampling: The New Statistics CHAPTER 24 How Large a Sample? Issues in Determining Sample Size Some Practical Examples Step-Wise Sample-Size Determination Summary Issues in determining sample size
FRAME SCORING BEEF CATTLE: WHY AND HOW. K.C. Olson and J.A. Walker. Department of Animal Science, South Dakota State University
 INTRODUCTION FRAME SCORING BEEF CATTLE: WHY AND HOW 102 RANGE BEEF COW SYMPOSIUM K.C. Olson and J.A. Walker Department of Animal Science, South Dakota State University Frame scoring is a tool to evaluate
Measuring Variability for Skewed Distributions
 Measuring Variability for Skewed Distributions Skewed Data and its Measure of Center Consider the following scenario. A television game show, Fact or Fiction, was canceled after nine shows. Many people
Subject-specific observed profiles of change from baseline vs week trt=10000u
 Mean of age 1 The MEANS Procedure Analysis Variable : age N Mean Std Dev Minimum Maximum ƒƒƒƒƒƒƒƒƒƒƒƒƒƒƒƒƒƒƒƒƒƒƒƒƒƒƒƒƒƒƒƒƒƒƒƒƒƒƒƒƒƒƒƒƒƒƒƒƒƒƒƒƒƒƒƒƒƒƒƒƒƒƒƒƒƒƒ 109 55.5321101 12.1255537 26.0000000 83.0000000
Estimating. Proportions with Confidence. Chapter 10. Copyright 2006 Brooks/Cole, a division of Thomson Learning, Inc.
 Estimating Chapter 10 Proportions with Confidence Copyright 2006 Brooks/Cole, a division of Thomson Learning, Inc. Principal Idea: Survey 150 randomly selected students and 41% think marijuana should be
The Efficacy of Herbicide Modes of Action in Roundup Ready and LibertyLink Systems
 The Efficacy of Herbicide Modes of ction in Roundup Ready and LibertyLink Systems In agriculture, we are always looking for the next new tool or management practice that will allow us to become even more
RWL11X2 GREENHOUSE CONTROLLER. Operation Manual
 RWL11X2 GREENHOUSE CONTROLLER Operation Manual BARTLETT Instrument Co. 1032 Avenue H Fort Madison, IA 52627 319-372-8366 www.bartinst.com Revised: 1/30/15 2 Front Panel Description... 3 Introductory Notes
TMR Delivery and Variability on the Farm
 TMR Delivery and Variability on the Farm Dennis R. Buckmaster Penn State Agricultural & Biological Engineering Workshop Outline Presentation (25 min) TMR acronyms Uniformity among batches Uniformity within
Best Pat-Tricks on Model Diagnostics What are they? Why use them? What good do they do?
 Best Pat-Tricks on Model Diagnostics What are they? Why use them? What good do they do? Before we get started feel free to download the presentation and file(s) being used for today s webinar. http://www.statease.com/webinar.html
COMP Test on Psychology 320 Check on Mastery of Prerequisites
 COMP Test on Psychology 320 Check on Mastery of Prerequisites This test is designed to provide you and your instructor with information on your mastery of the basic content of Psychology 320. The results
Bootstrap Methods in Regression Questions Have you had a chance to try any of this? Any of the review questions?
 ICPSR Blalock Lectures, 2003 Bootstrap Resampling Robert Stine Lecture 3 Bootstrap Methods in Regression Questions Have you had a chance to try any of this? Any of the review questions? Getting class notes
For the SIA. Applications of Propagation Delay & Skew tool. Introduction. Theory of Operation. Propagation Delay & Skew Tool
 For the SIA Applications of Propagation Delay & Skew tool Determine signal propagation delay time Detect skewing between channels on rising or falling edges Create histograms of different edge relationships
DV: Liking Cartoon Comedy
 1 Stepwise Multiple Regression Model Rikki Price Com 631/731 March 24, 2016 I. MODEL Block 1 Block 2 DV: Liking Cartoon Comedy 2 Block Stepwise Block 1 = Demographics: Item: Age (G2) Item: Political Philosophy
Advanced Seed Monitoring
 All Rows Displays the planter average for the four display items: Population, Spacing Quality, Singulation, and Skips and Doubles. Population Displays the average population for the planter, or selected
The Proportion of NUC Pre-56 Titles Represented in OCLC WorldCat
 The Proportion of NUC Pre-56 Titles Represented in OCLC WorldCat Jeffrey Beall and Karen Kafadar This article describes a research project that included a designed experiment and statistical analysis to
THE INTERACTION BETWEEN MELODIC PITCH CONTENT AND RHYTHMIC PERCEPTION. Gideon Broshy, Leah Latterner and Kevin Sherwin
 THE INTERACTION BETWEEN MELODIC PITCH CONTENT AND RHYTHMIC PERCEPTION. BACKGROUND AND AIMS [Leah Latterner]. Introduction Gideon Broshy, Leah Latterner and Kevin Sherwin Yale University, Cognition of Musical
Draft last edited May 13, 2013 by Belinda Robertson
 Draft last edited May 13, 2013 by Belinda Robertson 97 98 Appendix A: Prolem Handouts Problem Title Location or Page number 1 CCA Interpreting Algebraic Expressions Map.mathshell.org high school concept
Dot Plots and Distributions
 EXTENSION Dot Plots and Distributions A dot plot is a data representation that uses a number line and x s, dots, or other symbols to show frequency. Dot plots are sometimes called line plots. E X A M P
Distribution of Data and the Empirical Rule
 302360_File_B.qxd 7/7/03 7:18 AM Page 1 Distribution of Data and the Empirical Rule 1 Distribution of Data and the Empirical Rule Stem-and-Leaf Diagrams Frequency Distributions and Histograms Normal Distributions
Estimation of inter-rater reliability
 Estimation of inter-rater reliability January 2013 Note: This report is best printed in colour so that the graphs are clear. Vikas Dhawan & Tom Bramley ARD Research Division Cambridge Assessment Ofqual/13/5260
TEST WIRE FOR HIGH VOLTAGE POWER SUPPLY CROWBAR SYSTEM
 TEST WIRE FOR HIGH VOLTAGE POWER SUPPLY CROWBAR SYSTEM Joseph T. Bradley III and Michael Collins Los Alamos National Laboratory, LANSCE-5, M.S. H827, P.O. Box 1663 Los Alamos, NM 87545 John M. Gahl, University
Box Plots. So that I can: look at large amount of data in condensed form.
 LESSON 5 Box Plots LEARNING OBJECTIVES Today I am: creating box plots. So that I can: look at large amount of data in condensed form. I ll know I have it when I can: make observations about the data based
PogoStick and Research Pogo App Operator s Guide
 PogoStick and Research Pogo App Operator s Guide Research POGO App Overview Getting Started with the Research POGO App When you first start the Research POGO App, you will be asked to log into your Precision
How can you determine the amount of cardboard used to make a cereal box? List at least two different methods.
 Activity Start Thinking! For use before Activity How can you determine the amount of cardboard used to make a cereal box? List at least two different methods. Activity Warm Up For use before Activity Evaluate
Full file at
 Exam Name SHORT ANSWER. Write the word or phrase that best completes each statement or answers the question. Provide an appropriate response. 1) A parcel delivery service lowered its prices and finds that
How Many Bears can Live in This Forest?
 Age: Grades 3 9 How Many Bears can Live in This Forest? Group Size any (adjust number of food squares per size group; less than 80 lbs of food per Pathfinder) Duration 20 455 minutes or longer Settings:
1. MORTALITY AT ADVANCED AGES IN SPAIN MARIA DELS ÀNGELS FELIPE CHECA 1 COL LEGI D ACTUARIS DE CATALUNYA
 1. MORTALITY AT ADVANCED AGES IN SPAIN BY MARIA DELS ÀNGELS FELIPE CHECA 1 COL LEGI D ACTUARIS DE CATALUNYA 2. ABSTRACT We have compiled national data for people over the age of 100 in Spain. We have faced
Dennis R. Buckmaster Purdue University Agricultural & Biological Engineering
 Managing TMR Mixers to optimize performance Dennis R. Buckmaster Purdue University Agricultural & Biological Engineering Outline Introduction Variation Among Batches Variation Within Batches Experimenting
Sector sampling. Nick Smith, Kim Iles and Kurt Raynor
 Sector sampling Nick Smith, Kim Iles and Kurt Raynor Partly funded by British Columbia Forest Science Program, Canada; Western Forest Products, Canada with support from ESRI Canada What do sector samples
955608_01 4/4/18. SeedSense Operator s Guide For Gen2 20/20 Displays
 955608_01 4/4/18 SeedSense Operator s Guide For Gen2 20/20 Displays Contents System Requirements...3 Quick Start Guide...4 Display Overview...5 Gen1 20/20 SeedSense Monitor...5 Gen2 20/20 SeedSense Monitor
Check out the Great New JD Products
 June 2016 Volume 5, Issue 2 Inside this issue: StarFire 6000 p. 1 AutoTrac Vision & RowSense p. 2 Rate Controller 2000 p. 2 Sloan Implement App p. 3 Gen 4 Activation p. 3 JDLink Connect p. 3 Sloan Support
Northern Dakota County Cable Communications Commission ~
 Northern Dakota County Cable Communications Commission ~ Cable Subscriber Survey April 2014 This document presents data, analysis and interpretation of study findings by Group W Communications, L.L.C.
Lesson 7: Measuring Variability for Skewed Distributions (Interquartile Range)
") : Measuring Variability for Skewed Distributions (Interquartile Range) Exploratory Challenge 1: Skewed Data and its Measure of Center Consider the following scenario. A television game show, Fact or Fiction,
: Measuring Variability for Skewed Distributions (Interquartile Range) Exploratory Challenge 1: Skewed Data and its Measure of Center Consider the following scenario. A television game show, Fact or Fiction,
NAA ENHANCING THE QUALITY OF MARKING PROJECT: THE EFFECT OF SAMPLE SIZE ON INCREASED PRECISION IN DETECTING ERRANT MARKING
 NAA ENHANCING THE QUALITY OF MARKING PROJECT: THE EFFECT OF SAMPLE SIZE ON INCREASED PRECISION IN DETECTING ERRANT MARKING Mudhaffar Al-Bayatti and Ben Jones February 00 This report was commissioned by
Reproducibility Assessment of Independent Component Analysis of Expression Ratios from DNA microarrays.
 Reproducibility Assessment of Independent Component Analysis of Expression Ratios from DNA microarrays. David Philip Kreil David J. C. MacKay Technical Report Revision 1., compiled 16th October 22 Department
Reliability. What We Will Cover. What Is It? An estimate of the consistency of a test score.
 Reliability 4/8/2003 PSY 721 Reliability 1 What We Will Cover What reliability is. How a test s reliability is estimated. How to interpret and use reliability estimates. How to enhance reliability. 4/8/2003
Objective: Write on the goal/objective sheet and give a before class rating. Determine the types of graphs appropriate for specific data.
 Objective: Write on the goal/objective sheet and give a before class rating. Determine the types of graphs appropriate for specific data. Khan Academy test Tuesday Sept th. NO CALCULATORS allowed. Not
Sample Analysis Design. Element2 - Basic Software Concepts (cont d)
") Sample Analysis Design Element2 - Basic Software Concepts (cont d) Samples per Peak In order to establish a minimum level of precision, the ion signal (peak) must be measured several times during the scan
Sample Analysis Design Element2 - Basic Software Concepts (cont d) Samples per Peak In order to establish a minimum level of precision, the ion signal (peak) must be measured several times during the scan
LCD and Plasma display technologies are promising solutions for large-format
 Chapter 4 4. LCD and Plasma Display Characterization 4. Overview LCD and Plasma display technologies are promising solutions for large-format color displays. As these devices become more popular, display
Identifying the Importance of Types of Music Information among Music Students
 Identifying the Importance of Types of Music Information among Music Students Norliya Ahmad Kassim Faculty of Information Management, Universiti Teknologi MARA (UiTM), Selangor, MALAYSIA Email: norliya@salam.uitm.edu.my
Sunday Maximum All TV News Big Four Average Saturday
 RTNDA/Ball State University Survey 2004 Additional Data: Newsroom Staffing and Amount of News Television Hours of Local TV News Per Day TV News Budgets: Up, Down or Same? TV News Profitability by Size
MANOVA COM 631/731 Spring 2017 M. DANIELS. From Jeffres & Neuendorf (2015) Film and TV Usage National Survey
 Film and TV Usage National Survey") 1 MANOVA COM 631/731 Spring 2017 M. DANIELS I. MODEL From Jeffres & Neuendorf (2015) Film and TV Usage National Survey INDEPENDENT VARIABLES DEPENDENT VARIABLES X1: GENDER Q23a. I often watch a favorite
1 MANOVA COM 631/731 Spring 2017 M. DANIELS I. MODEL From Jeffres & Neuendorf (2015) Film and TV Usage National Survey INDEPENDENT VARIABLES DEPENDENT VARIABLES X1: GENDER Q23a. I often watch a favorite
Audio Compression Technology for Voice Transmission
 Audio Compression Technology for Voice Transmission 1 SUBRATA SAHA, 2 VIKRAM REDDY 1 Department of Electrical and Computer Engineering 2 Department of Computer Science University of Manitoba Winnipeg,
Where Do Insects Go In Winter?
 Level B Complete each sentence. Use words in the box. their travel under hidden trash protects shines hatch when flies Where Do Insects Go In Winter? In the summer, flies and ants bother people. In the
User Guide AC/DC 2 AC/DC 4 AC/DC 6 AC/DC 9 DC IP68 AC IP65
 User Guide AC/DC 2 AC/DC 4 AC/DC 6 AC/DC 9 DC IP68 AC IP65 2 What is in this package? 1 1 2 2 3 What else do I need? 9V 1-9 Moiture sensor (Opional) DC IP68 AC IP65 User Guide F e a t u r e s o f t h e
Normalization Methods for Two-Color Microarray Data
 Normalization Methods for Two-Color Microarray Data 1/13/2009 Copyright 2009 Dan Nettleton What is Normalization? Normalization describes the process of removing (or minimizing) non-biological variation
What is Statistics? 13.1 What is Statistics? Statistics
 13.1 What is Statistics? What is Statistics? The collection of all outcomes, responses, measurements, or counts that are of interest. A portion or subset of the population. Statistics Is the science of
The Celluloid Ceiling: Behind-the-Scenes Employment of Women on the Top 100, 250, and 500 Films of 2017
 The Celluloid Ceiling: Behind-the-Scenes Employment of Women on the Top 0, 50, and 500 Films of 0 by Martha M. Lauzen, Ph.D. Copyright 0 All rights reserved. The Celluloid Ceiling has tracked women s employment
To Link this Article: Vol. 7, No.1, January 2018, Pg. 1-11
 Identifying the Importance of Types of Music Information among Music Students Norliya Ahmad Kassim, Kasmarini Baharuddin, Nurul Hidayah Ishak, Nor Zaina Zaharah Mohamad Ariff, Siti Zahrah Buyong To Link
Visible Vibrations (originally Chladni Patterns) - Adding Memory Buttons. Joshua Gutwill. August 2002
 - Adding Memory Buttons. Joshua Gutwill. August 2002") (originally Chladni Patterns) - Adding Memory Buttons Joshua Gutwill August 2002 Keywords: 1 (originally Chladni Patterns) Adding Memory Buttons
(originally Chladni Patterns) - Adding Memory Buttons Joshua Gutwill August 2002 Keywords: 1 (originally Chladni Patterns) Adding Memory Buttons