INSTRUCTION MANUAL POWER QUALITY ANALYZER
|
|
|
- Archibald McDonald
- 6 years ago
- Views:
Transcription
1 INSTRUCTION MANUAL 3196 POWER QUALITY ANALYZER
2
3 Contents i Contents Introduction...1 Symbols...1 Outlook of Operating Procedures...2 Chapter 1 Overview Product Overview Features...4 Chapter 2 Key Explanations and Screen Configuration Key Explanations Screen Names and Configurations Common Display Areas Screen Configurations Screen Details...20 Chapter 3 Connections Connection Diagram...39 Chapter 4 Making System Settings (SYSTEM Screen) Using the SYSTEM Screen Checking the Connection Confirming the Connection Diagram Checking the Connection Making System Settings Main Settings Recording Settings Hardware Settings Event Settings Screen Measurement Settings Load/Save Screen...64
4 ii Contents Chapter 5 Using Waveforms, Vectors, DMMs, and Bar Graphs (VIEW Screen) Using the VIEW Screen Waveform Display Vector Display DMM Display Harmonics Display Harmonics Bar Graph Harmonics List Screen Chapter 6 Using the Time Series Graph (TIME PLOT Screen) Using the TIME PLOT Screen Time Plot Settings Changes in RMS Value Changes in Voltage Graphing Voltage Fluctuations for Each Interval Graphing Voltage Fluctuations for Events Changes in Harmonics Flicker IEC Flicker Meter and V10 Flicker Meter IEC Flicker Graph IEC Flicker List V10 Flicker Graph V10 Flicker List Chapter 7 Using Events (EVENT Screen) Using the EVENT Screen Event Detection Method Event Settings Voltage/Power Event Settings Harmonics Event Setting Event List Display Analyzing Event Occurrences Analyzing Transient Waveforms Event Monitor Display
5 Contents iii Chapter 8 Using the External Control Terminals Connecting to the External Control Terminal Event Input Terminal (EVENT IN) Event Output Terminal (EVENT OUT) Chapter 9 Loading and Saving Settings and Measured Data Using the Internal Memory Using a PC Card Selecting a PC Card Inserting and Removing the PC Card File Types Saving and Loading Files Chapter 10 Using a Printer Setting the Printer Printing Hard Copies Chapter 11 Using the PC Remote Control and Monitoring Using an RS-232C Interface Connecting a Modem Setting the Setting the PC Control and Monitoring Using a LAN Interface Connecting the Setting the Setting the PC HTTP Server Function Overview Setting the HTTP Server Function Chapter 12 Specifications Product Specifications Measurement Specifications Setting Functions Formulae...196
6 iv Contents Appendix 209 Measurement Range and Nominal Voltage TIME PLOT Recording Method Event Waveform Recording Method Detecting Anomalies and Phenomena Due to Drops in Power Quality Terminology V10 Flicker Text Time-sequence Data-header Composition222 IEC Flicker Text Time-sequence Data-header Composition. 222 Text Event Waveform Data Format Composition Text Voltage Fluctuation Event Data Format Composition Text Event Data-format Composition Contents of Automatic Setting of Events (thresholds) Event Recording Sequence (Priority Order) Block Diagram (Analog) Block Diagram (Digital)
7 1 Introduction The 3196 Quick Start Manual accompanies this device. Refer to this guide for precautions, information about connecting peripheral devices, connection methods, and measurement methods. The present Instruction Manual mainly deals with how to make screen settings and how to set peripheral devices. A clamp-on sensor (optional) is required to measure electrical currents with this device. For more details, refer to the Instruction Manual of the clamp-on sensor that you are using. For detailed information on the EN50160, see the Instruction Manual for EN Symbols Indicates advice about product performance and operations. Indicates references. Indicates quick references for operations and troubleshooting remedies. * Indicates that the explanation of a technical term is at the bottom of the page. Indicates the explanation of a technical term.

8 2 Outlook of Operating Procedures Indicates the purpose of the settings. Indicates the screen name selected with the DF key. Indicates the name of an item displayed on the screen. Indicates operation keys. Displays the item selected in the drop-down list box accompanied by an explanation.
9 1.1 Product Overview 3 Overview Chapter Product Overview The 3196 POWER QUALITY ANALYZER detects power line anomalities and analyzes power line quality. Electric power liberalization Need for power supply quality analysis Power electronics application devices Large arc heaters, large rectifiers Cooperative system with independent power 3196 Alternative energy (solar, wind power, gas turbine, etc.) Correctly analyze abnormal phenomena Analysis can be performed by correlating measurement items with particular standard characteristics to ascertain the causes of power line anomalies. Continuous long-term monitoring and recording Power line anomalies often occur intermittently, so they must be captured when an anomaly occurs, along with its type and intensity. Remote control The type and time of occurrence of anomalies can be instantly determined through a variety of interfaces (RS-232C, LAN, printer and modem). Modem Public circuit 3196 Modem Ethernet PC
10 4 1.2 Features 1.2 Features Safe design Designed to comply with safety standard EN :1993+A2:1995. Supports a variety of power lines Measures single-phase 2-wire, single-phase 3-wire, three-phase 3- wire and three-phase 4-wire systems. An extra input channel is provided for uses such as measuring power lines of a second system, for direct voltage measurement or for measuring a neutral line. Simultaneous measurement of multiple elements of power supply quality Multiple power supply quality parameters can be selected as desired for simultaneous measurement. 1. High speed voltage quality parameter Transient overvoltage (impulse) 2. RMS voltage quality parameters Voltage swell (surge), voltage dip (sag), instantaneous voltage interruption 3. Power quality parameters Frequency, voltage, current, active power, apparent power, reactive power, power factor (displacement power factor) 4. 3-Phase quality parameters Voltage unbalance factor, current unbalance factor 5. Harmonic quality parameters Harmonic voltage, current and power; inter-harmonic voltage and current; harmonic voltage and current phase angle; total harmonic voltage and current distortion factors (THD-F, THD-R); total interharmonic voltage and current distortion factors (THD-F, THD-R) 6. Other parameters K factor, flicker High-speed impulse detection and waveform display function Four voltage channels are sampled at 2 MS/s, so high-speed detection and waveform display can be performed at up to 0.5 µs and high voltage (2000 Vpk transient overvoltage (impulse)).
11 1.2 Features 5 V10 Flicker, IEC flicker measurement Select either IEC flicker (Pst, Plt) regulated by international standards, or V10 Flicker commonly used in Japan, and measure with power quality parameters. -Y and Y- conversion functions provided -Y conversion can be performed on three-phase 3-wire systems, and Y- conversion can be performed on three-phase 4-wire systems. In either case, line-to-line voltage or phase-to-neutral voltage display is available. Up to one month continuous measurement Data is saved to internal memory during the measurement period. Use of a PC card enables continuous measurement for more than one month. Time plot graph display Fluctuations in various power quality parameters are displayed in time plot graphs. Calculated maximum, average and minimum values for each interval are displayed. Event detection functions 1. Event detection using preset threshold settings Events exceeding thresholds are detected by setting thresholds for various power quality parameters. Up to 100 events can be saved to internal memory. Up to 1000 events can be saved on PC card. Events that occur simultaneously are correlated and treated as a single event. 2. Event Analysis Confirm when and what kind of events have occurred from the Event List. Each event can be analyzed using waveforms, vectors, harmonic bargraph and related parameter values. 3. External input and output of events A signal can be output when an event occurs. Also, an externally applied signal can be set to be recognized as an event. Easy-to-see TFT color LCD The display is a 6.4-inch (640 x 480 dot) high-contrast, wide-viewingangle TFT color liquid crystal display. The screen is easy to see in both bright and dark environments, and is capable of showing many power quality parameters at the same time.
12 6 1.2 Features RS-232C and LAN interfaces provided Connect a PC, printer or modem for remote control and data output. PC Card interface provided Measurement and event data can be preserved by saving to a PC Card. Setting conditions and measurement data can be stored and read back using a PC Card. Six selectable display languages Select the display language from Japanese, English, German, French, Spanish or Italian. Nickel-Metal-Hydride battery pack supplied The Ni-MH battery backs up internal data when power is off. When fully charged, data is backed up for 30 minutes when power is turned off. Compact and light weight The compact size and light weight allows installation even in limited space, such as in a cubicle. Carrying case options for portability The optional cases allow measurements to be taken without removing the instrument. Choose from a light-weight soft case or water-resistant hard case. A choice of optional clamp-on sensors Select either the 9660 CLAMP ON SENSOR (100 A rms rating), the 9661 CLAMP ON SENSOR (500 A rms rating), the 9667 FLEXIBLE CLAMP ON SENSOR (500/ 5000 A rms rating), or the 9669 CLAMP ON SENSOR (1000 A rms rating), 9694 CLAMP ON SENSOR (5 A rms rating). Control instrument settings and data acquisition by Web browser HTTP server functions are built in Instrument settings and data acquisition can be controlled by common Internet Web browsers like Internet Explorer or Netscape Navigator.
13 1.2 Features 7 Control instrument settings and data acquisition by Web browser HTTP server functions are built in Instrument settings and data acquisition can be controlled by common Internet Web browsers like Internet Explorer or Netscape Navigator. PC application software (option) for analyzing a large volume of data By using the optional 9624 PQA HiVIEW, a large volume of long-term measurement data recorded on a PC card can be analyzed. Remotely downloaded application software provided By using the Down96 download application supplied with the product, data in the main unit can be downloaded from a distant location via LAN or RS-232C (modem). EN50160-compliant evaluations Conforms to the European standard EN50160 (Voltage characteristics of electricity supplied by public distribution systems) and suitable for evaluation of the voltage quality of a power system. For detailed information on the EN50160, see the Instruction Manual for EN50160.
14 8 1.2 Features
15 2.1 Key Explanations 9 Key Explanations and Screen Configuration Chapter Key Explanations Front Panel Display 6.4-inch, TFT color LCD display DF1 to DF4 keys Press these Display Function DF keys to select the type of display. "Front Panel Enhanced View"(page 10) SYSTEM/ VIEW/ TIMEPLOT/ EVENT key Select the screen type according to the intended usage "Front Panel Enhanced View"(page 10) DATA HOLD key DATA RESET key START/STOP key Cursor keys ENTER key Used to set the contents of items that are selected or modified. F1 to F4 keys Select or change display or setting items. ESC key Ignores selected or changed items and returns the original setting. POWER LED This lamp lights when the power is on. Powered by AC adapter: Lit green Powered by battery pack: Lit red HARD COPY key Prints a screen image, or outputs the screen image as a file to a PC Card.
![10 2.1 Key Explanations Front Panel Enhanced View SYSTEM key Displays the [SYSTEM]screen (for selecting display of system settings).](/docs-images/72/66681917/images/16-1.jpg "VIEW key Displays the [VIEW]screen (for selecting an Analysis view) TIME PLOT key Displays the [TIME PLOT]screen (for selecting the time plot graph).")
![EVENT key Displays the [EVENT]screen (for selecting events). DATA HOLD key Temporarily stops display of measured values. Press again to cancel.](/docs-images/72/66681917/images/16-2.jpg "While recording, display of the measured value can be stopped for confirmation. DATA RESET key All measurement data is erased from internal memory.")


16 Key Explanations Front Panel Enhanced View SYSTEM key Displays the [SYSTEM]screen (for selecting display of system settings). VIEW key Displays the [VIEW]screen (for selecting an Analysis view) TIME PLOT key Displays the [TIME PLOT]screen (for selecting the time plot graph). EVENT key Displays the [EVENT]screen (for selecting events). DATA HOLD key Temporarily stops display of measured values. Press again to cancel. While recording, display of the measured value can be stopped for confirmation. DATA RESET key All measurement data is erased from internal memory. Press this key to reset before restarting recording. START/STOP key Starts and stops recording. To start recording, press the DATA RESET key to reset the data, then press this key. Cursor keys These keys move the cursor on the screen. Use to scroll the TIME PLOT screen. DF1 to DF4 keys (Display function) Select a screen to display from the selected screen type: SYSTEM, VIEW, TIME PLOT or EVENT. The screen selections are as follows: [SYSTEM]screen... Wiring diagram, Main settings, Event settings, Load/Save, etc. [TIME PLOT]screen... RMS fluctuations, Voltage fluctuations, Harmonic fluctuations, Flicker display, etc. [VIEW]screen... Waveforms, Vectors, DMM, Harmonic display, etc. [EVENT]screen... List, Monitor, etc.
17 2.2 Screen Names and Configurations Screen Names and Configurations Power ON Screen Selection Each screen type (SYSTEM, VIEW, TIMEPLOT and EVENT) displays the following information in response to the DF keys. WIRING WIRING VECTOR WAVE VOLT/CURR VOLTAGE CURRENT RMS 1 ELEMENT 2 ELEMENT EVENT LIST MONITOR MAIN MEASURE RECORDING HARDWARE VECTOR VOLTAGE INTERVAL EVENT EN50160 * Over View EVENT VOLTAGE POWER HARMONICS DMM POWER VOLTAGE CURRENT HARMONICS HARM INTERHARM EN50160 * Harmonics Signaling Events LOAD/SAVE MEMORY PC-CARD HARMONICS GRAPH LIST FLICKER GRAPH LIST EN50160 * Setting1 Setting2 Setting3 * Used when the EN50160 function is ON. Display Selection Internal Status Indicator [SETTING] [RECORDING] [ANALYZING] Other Displays

18 Screen Names and Configurations Common Display Areas Top of Screen The display elements common to all screens on the 3196 are as follows. Interface & Hold/Lock Indicators*4 Indicates interface usage and HOLD/LOCK status. Screen Selection*1 Indicates the screen type selected by the corresponding key. Internal Status Indicator*2 Indicates the current internal operating status. SYSTEM Settings Indicators*5 Displays the contents specified in MEASURE Memory Usage Indicators*3 Level meters indicate the usage status of internal memory and flash ATA card. Number of repeated recording operations*6 The number of repeated recording operations currently set will be indicated. Bottom of Screen Help Comment Display Shows a brief description of the item at the cursor position on the SYSTEM screen. Power Supply Indicator Indicator White/ Red White/ White Power supply status Powered by AC adapter Battery pack is charging Powered by AC adapter Installed Battery Pack Time Display Shows the current time. White White Powered by battery pack Powered by battery pack, but charge is low.
![2.2 Screen Names and Configurations 13 *1:Screen Selection Display [SYSTEM]screen... [VIEW]screen... [TIME PLOT]screen... [EVENT]screen.](/docs-images/72/66681917/images/19-1.jpg ".. *2:Internal Operating Status Display One of [SETTING], [RECORDING]([WAITING] until preset time to start measuring), or [ANALYZING] is displayed to indicate the internal status of the instrument.")
19 2.2 Screen Names and Configurations 13 *1:Screen Selection Display [SYSTEM]screen... [VIEW]screen... [TIME PLOT]screen... [EVENT]screen... *2:Internal Operating Status Display One of [SETTING], [RECORDING]([WAITING] until preset time to start measuring), or [ANALYZING] is displayed to indicate the internal status of the instrument. The internal status is changed by pressing START/STOP to start/stop recording. Display [SETTING] [WAITING] [RECORDING] [ANALYZING] Internal status description When turned on, there is no recorded data in the instrument Waiting until a preset start time to begin measuring Recording has started and measurement data is being saved to the instrument s internal memory (and perhaps to a PC Card) Recording has finished and the instrument is ready for analysis of the measurement data in internal memory Real-time measurement Possible Possible Possible Possible Recording status Preparation for recording (not recording) Recording in progress Recording finished Normal Measurement [SETTING] [RECORDING] [ANALYZING] Measurement starts Measurement finished Measurement with Specified Time Settings [SETTING] [WAITING] [RECORDING] [ANALYZ- ING] Starts measurement at the measurement start time. Finishes measurement at the measurement end time. If the preset measurement start time has already passed, measurement starts immediately.
 Total capacity: 5 MB *4:Status Icons INTERNAL MEMORY Up to 100 EVENT data sets can be stored After 100 events are stored, the earliest are overwritten.")
20 Screen Names and Configurations *3:Memory Usage Indicators INTERNAL MEMORY: Internal memory PC CARD MEMORY: ATA flash card TIME PLOT related data capacity Measurement stops when memory becomes full. (Selectable Stop/Continuous) Total capacity: 5 MB *4:Status Icons INTERNAL MEMORY Up to 100 EVENT data sets can be stored After 100 events are stored, the earliest are overwritten. Total capacity: 8 MB Interface usage status indicators Indicates the printer is ready for use. Indicates the modem is ready for use. Indicates the LAN interface is ready for use. HOLD/LOCK status indicators Indicates the DATA HOLD key has been pressed to activate the Data Hold function. Indicates the KEY LOCK switch has set to lock the keys. PC card status display Lights when the PC Card is being accessed. *5: SYSTEM settings display Voltage/Current Range Red Indication: means out of range In this case, increase the range setting. Frequency of Measured Line Red Indication: means the measurement frequency is different from the line frequency PT(VT)/CT Ratio [SC] (scaling):appears when the PT or CT ratio has been set. [(Not displayed)]: when the PT and CT ratios are both 1. Measurement Line type Set on the SYSTEM screen CH4 Voltage measurement function (AC/ DC/OFF) PLL Sync Frequency source Indicates red when no input is applied at the selected source.

21 15 *6: Number of repeated recording operations 2.2 Screen Names and Configurations When the repeated recording function is set, the number of repeated recording operations currently set will be indicated. Repeated recording operations can be conducted up to 99 days at one-day measuring intervals, and up to 99 weeks at one-week measuring intervals. The measured data file of repeated recording is saved as a separate binary file for each one-day or one-week period on the PC card.
22 Screen Names and Configurations Screen Configurations For a detailed description of each screen, see "Screen Details", and for information about how to make settings, see the references on the right. SYSTEM Screen WIRING WIRING VECTOR MAIN MEASURE RECORDING HARDWARE EVENT VOLTAGE POWER HARMON- ICS LOAD/SAVE MEMORY PC-CARD Displays connection diagrams. You can confirm the connections of the voltage cord and clamp sensors. Displays voltage and current vector diagrams. You can check the oscillation and phase. Set the connection, voltage and current ranges, PT and CT ratios, and clamp sensors. Make time settings, such as the measurement start and end times, and intervals. Make hardware settings, such as the display language, beep, screen color, clock, as well as make RS- 232C and LAN settings. Set the threshold for events, such as transient, swell, dip, and instantaneous interruption. Set the threshold for events, such as the distortion and unbalance factors for voltage, current, and power. Set the threshold for harmonics events. You can read and save internal memory settings and measured data. You can read and save PC card settings and measured data. 4.2 "Checking the Connection"(page 45) "Confirming the Connection Diagram"(page 45) "Checking the Connection"(page 47) 4.3 "Making System Settings"(page 49) "Main Settings"(page 49) 6.2 "Time Plot Settings"(page 81) "Hardware Settings"(page 59) 7.3 "Event Settings"(page 121) "Voltage/Power Event Settings"(page 122) "Voltage/Power Event Settings"(page 122) "Harmonics Event Setting"(page 126) Chapter 9 "Loading and Saving Settings and Measured Data"(page 139) 9.1 "Using the Internal Memory"(page 140) 9.2 "Using a PC Card"(page 141)
23 2.2 Screen Names and Configurations 17 VIEW Screen VIEW Screen WAVE VOLT/CURR VOLTAGE CURRENT Displays voltage and current waveforms. You can display entire waveforms or enlarged parts of waveforms. Displays 4 channels of voltage waveforms. Displays 4 channels of current waveforms. 5.2 "Waveform Display"(page 67) VECTOR Displays voltage and current vector diagrams. Displays the numerical value for RMS and the unbalance factor. 5.3 "Vector Display"(page 70) DMM 5.4 "DMM Display"(page 73) POWER Displays voltage, current, active power, reactive power, apparent power, and power factor values. VOLTAGE CURRENT Displays voltage, voltage unbalance factor, and total voltage distortion values. Displays current, current waveform peak value, current unbalance factor, and the total current distortion values. HARMONICS 5.5 "Harmonics Display"(page 74) GRAPH LIST Displays the voltage, current, and active power bar graphs simultaneously. Displays the harmonics list selected from voltage, current, or active power.
24 Screen Names and Configurations TIME PLOT Screen RMS 1 ELEMENT You can select one measurement item and display RMS time series graphs for each measurement interval of 200 ms. 6.3 "Changes in RMS Value"(page 89) 2 ELEMENT You can select two measurement items and display RMS time series graphs for each measurement interval of 200 ms. VOLTAGE INTERVAL EVENT Displays a time series graph for the voltage measured in one waveform shifted over half a wave for each measurement interval. Displays a half wave-shifted, 10-second time series graph for a voltage event in a single waveform. 6.4 "Changes in Voltage"(page 93) HARMONICS HARM INTERHARM You can select 6 orders and display it in a harmonics time series graph. You can select 6 orders and display the inter-harmonics. 6.5 "Changes in Harmonics"(page 100) FLICKER 6.6 "Flicker"(page 104) GRAPH LIST Displays a time series graph for IEC flicker or V10 flicker. Displays a list of IEC flicker or V10 flicker statistics.
25 2.2 Screen Names and Configurations 19 EVENT Screen EVENT LIST MONITOR Displays the contents of events in the event list. Displays an LED on the monitor display when an event occurs. 7.4 "Event List Display"(page 127) 7.7 "Event Monitor Display"(page 134) EN50160 Over View Displays judgment results for all measurement items, in accordance with the EN See the Instruction Manual for the EN50160 EN50160 Harmonics Signaling Events Displays detailed judgment results for harmonics, in accordance with the EN Displays detailed judgment results for signaling voltage, in accordance with the EN Displays detailed judgment results for events, in accordance with the EN See the Instruction Manual for the EN50160 EN50160 Setting1 Setting2 Setting3 Sets the wiring, voltage range, PT ratio, nominal voltage, and thresholds of transient, swell, dip, and interruption, in accordance with the EN Sets the thresholds of frequency, voltage fluctuation, flicker, unbalance factor, THD, signaling voltage, in accordance with the EN Sets the thresholds of harmonic waveform, in accordance with the EN See the Instruction Manual for the EN50160
26 Screen Names and Configurations Screen Details WIRING SYSTEM Screen Press to switch the display screen. WIRING "Confirming the Connection Diagram"(page 45) Connection diagram corresponding to the connection method Displays (the connection methods for the voltage cord and clamp and) the voltage value, current value, and active power value for each channel. When the display value is wrong(page 46) VECTOR "Checking the Connection"(page 47) Displays the vector diagrams of voltage and current so that you can check the vectors. This allows you to determine the RMS levels and phase differences between channels. Setting tolerance levels(page 47) Tolerance levels are wrong(page 48)
27 2.2 Screen Names and Configurations 21 MAIN SYSTEM Screen Press to switch the display screen. MEASURE "Main Settings"(page 49) You can make basic measurement settings for the following. Connection method Voltage and current ranges PT and CT ratios Clamp sensor Nominal voltage Measured frequency PLL source Calculation method Flicker EN50160 and so on RECORDING 6.2 "Time Plot Settings"(page 81) You can make recording settings for the following. TIME PLOT (time series) data selection Measurement interval Auto-save to the PC card Real-time control Measurement start and end times Repeated recording and so on HARDWARE "Hardware Settings"(page 59) You can set the following hardware information. Display language Beep Screen color Clock settings RS-232C Automatic hard copy LAN and so on
28 Screen Names and Configurations EVENT SYSTEM Screen Press to switch the display screen. VOLTAGE "Voltage/Power Event Settings"(page 122) Select the event triggers and set the thresholds. You can set the following as events. Transient Swell Dip Instantaneous interruption Frequency Voltage waveform comparison POWER "Voltage/Power Event Settings"(page 122) Select the event triggers and set the thresholds. You can set the following as events. Voltage and current RMS values Voltage and current waveform peak values Active power Reactive power Apparent power Power factor K factor Voltage and current distortion factors Voltage and current unbalance factors HARMONICS "Harmonics Event Setting"(page 126) Select the event triggers and set the thresholds. You can set the following as events. Voltage, current, and power harmonics Harmonics phase difference angle
 Displays the settings file list stored in this device s internal memory. You can load and save settings using this device s internal memory. PC-CARD 9.")
29 2.2 Screen Names and Configurations 23 LOAD/SAVE SYSTEM Screen Press to switch the display screen. MEMORY 9.1 "Using the Internal Memory"(page 140) Displays the settings file list stored in this device s internal memory. You can load and save settings using this device s internal memory. PC-CARD 9.2 "Using a PC Card"(page 141) Displays the list of files stored on the PC card. You can load the measured data files and settings files stored on the PC card to the 3196, and then save them to the PC card again.
30 Screen Names and Configurations WAVE VIEW Screen Press to switch the display screen. VOLT/CURR 5.2 "Waveform Display"(page 67) Displays voltage and current waveforms for channels, depending on how they are connected. Displays 10 waveforms at 50 Hz, and 12 waveforms at 60 Hz. By scrolling when an event is selected, you can display 14 waveforms at 50 Hz and 16 waveforms at 60 Hz. VOLTAGE 5.2 "Waveform Display"(page 67) Displays voltage waveforms for channels, depending on how they are connected. When three-phase 4-wire is selected, you can display voltage waveforms for 4 channels to identify the degree of phase rotation of each channel. CURRENT 5.2 "Waveform Display"(page 67) Displays current waveforms for channels, depending on how they are connected. When three-phase 4-wire is selected, you can display current waveforms for 4 channels to identify the degree of phase rotation of each channel.
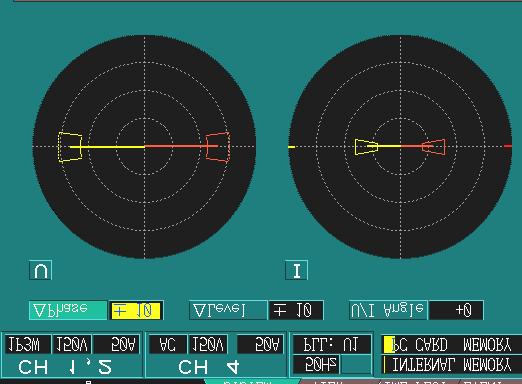
31 2.2 Screen Names and Configurations 25 VECTOR VIEW Screen Press to switch the display screen. VECTOR 5.3 "Vector Display"(page 70) Displays voltage and current vectors for channels, depending on how they are connected. You can display each order (1st to 50th order) for harmonic analysis as a vectors and simultaneously display the harmonic (RMS value or phase angle) and unbalance factors as numerical values. For phase angle display, you can select ±180 display or 360 lag display. Example screen: Displays vectors for 4, 3P4W (three-phase four-wire) channels.
32 Screen Names and Configurations DMM VIEW Screen Press to switch the display screen. POWER 5.4 "DMM Display"(page 73) You can display the following items on the DMM display. Voltage (U) Current (I) Active power (P) Reactive power (Q) Apparent power (S) Power factor (PF) or displacement power factor (DPF) Displays numerical values for channels, depending on how they are connected. Example: Displays 4, 3P4W (threephase four-wire) channels on the DMM display. VOLTAGE 5.4 "DMM Display"(page 73) You can display the following items on the DMM display. Voltage Total voltage distortion Voltage waveform peak Average voltage value Voltage unbalance factor Displays numerical values for channels on the DMM display, depending on how they are connected. Example: Displays 4, 3P4W (threephase four-wire) channels on the DMM display. CURRENT 5.4 "DMM Display"(page 73) You can display the following items on the DMM display. Current Total current distortion Current waveform peak Average current value Current unbalance factor Displays numerical values for channels on the DMM display, depending on how they are connected. Example: Displays 4, 3P4W (threephase four-wire) channels on the DMM display.
33 2.2 Screen Names and Configurations 27 HARMONICS VIEW Screen Press to switch the display screen. GRAPH "Harmonics Bar Graph"(page 74) Displays a bar graph for the harmonics and inter-harmonics. Displays three bar graphs for the voltage, current, and active power simultaneously. LIST "Harmonics List Screen"(page 76) Displays a list of the harmonics and inter-harmonics. Displays the list and distortion of the selected display items simultaneously.
34 Screen Names and Configurations RMS TIME PLOT Screen Press to switch the display screen. 1 ELEMENT 6.3 "Changes in RMS Value"(page 89) You can display the fluctuation graph of a single RMS value selected from the following. Frequency Voltage Voltage waveform peak Current Current waveform peak Active power Apparent power Reactive power Power factor K factor Voltage unbalance factor Current unbalance factor Harmonic voltage distortion factor Harmonic current distortion factor RMS values are calculated *1 in the 3196 at 200 ms intervals without gaps. The maximum, average, and minimum values are detected using the multiple 200 ms interval RMS values included in the set interval, and the display changes. 2 ELEMENT 6.3 "Changes in RMS Value"(page 89) You can display a fluctuation graph for two RMS values selected from the following. Frequency Voltage Voltage waveform peak Current Current waveform peak Active power Apparent power Reactive power Power factor K factor Voltage unbalance factor Current unbalance factor Harmonic voltage distortion factor Harmonic current distortion factor *1: Calculated without gaps.continuous RMS value calculations at 200 ms intervals (50 Hz: 10 waveforms, 60 Hz: 12 waveforms). No waveforms are missed during the recording interval. RMS values are calculated *1 in the 3196 at 200 ms intervals without any gaps. The maximum, average, and minimum values are detected from the multiple 200 ms interval RMS values included in the set interval, and the display changes.
35 2.2 Screen Names and Configurations 29 VOLTAGE TIME PLOT Screen Press to switch the display screen. INTERVAL 6.4 "Changes in Voltage"(page 93) Displays a voltage fluctuation graph used to calculate the swell, dip, and instantaneous interruption. Voltage is calculated for one waveform shifted over half a wave. The maximum and minimum values are detected from the multiple voltage values included in the set interval, and the display changes. You can also display S(t) (when IEC flicker is selected) or U (when DV10 flicker is selected), either of which indicates the voltage deviation with respect to nominal voltage. EVENT "Graphing Voltage Fluctuations for Events"(page 96) Displays the voltage fluctuation graph for a voltage swell, dip, or instantaneous interruption event. The result of calculation for a single half wave-shifted waveform is displayed without alteration as a voltage fluctuation graph. Pre-trigger is fixed to 0.5 second and recording length to 10 seconds. Although only one fluctuation graph is stored in internal memory, you can read multiple fluctuation graphs by using a PC card.
36 Screen Names and Configurations HARMONICS TIME PLOT Screen HARM 6.5 "Changes in Harmonics"(page 100) You can display a fluctuation graph for a single harmonic selected from the following. Harmonic voltage (RMS value, content percentage, and phase angle) Harmonic current (RMS value, content percentage, and phase angle) Harmonic power (RMS value and phase difference) You can select 6 orders to be displayed simultaneously from orders 1 to 50 for the basic wave. Recorded data is not displayed unless it is shown in P&Harm or ALL DATA in [SYSTEM]-DF2[RECORDING]. INTERHARM 6.5 "Changes in Harmonics"(page 100) You can display a fluctuation graph for a single inter-harmonic selected from the following. Inter-harmonic voltage (RMS value and content percentage) Inter-harmonic current (RMS value and content percentage) You can select 6 orders to be displayed simultaneously from 0.5th to 49.5th order. Recorded data is not displayed unless it is shown in P&Harm or ALL DATA in [SYSTEM]-DF2[RECORDING].
37 2.2 Screen Names and Configurations 31 FLICKER TIME PLOT Screen GRAPH 6.6 "Flicker"(page 104) Displays a graph for IEC flicker or V10 flicker IEC Flicker Displays a fluctuation graph for IEC flicker (Pst, Plt). The graph is updated every 10-minute, regardless of the interval that is set for [SYSTEM] - DF2 [MAIN] - [RE- CORDING]. This is only displayed if Pst, Plt is selected for flicker in [SYSTEM] - DF2 [MAIN] - [MEASURE]. V10 Flicker Displays a fluctuation graph for V10 flicker. The graph is updated once a minute, regardless of the interval that is set for [SYSTEM] - DF2 [MAIN] - [RE- CORDING]. This is only displayed if V10 is selected for flicker in [SYSTEM] - DF2 [MAIN] - [MEASURE].
 Displays a list for IEC flicker or V10 flicker IEC Flicker Displays the IEC flicker (Pst, Plt) values in a list.")
38 Screen Names and Configurations FLICKER TIME PLOT Screen LIST 6.6 "Flicker"(page 104) Displays a list for IEC flicker or V10 flicker IEC Flicker Displays the IEC flicker (Pst, Plt) values in a list. Pst (short interval voltage flicker) Plt (long interval voltage flicker) The list is updated every 10-minute. This is only displayed if Plt, Pst is selected for flicker in [SYSTEM] - DF2 [MAIN] - [MEASURE]. V10 Flicker Displays the V10 statistics below in a list. The maximum value over one hour for V10 Flicker The fourth maximum value over one hour for V10 Flicker The average value over one hour for V10 Flicker Overall maximum value for V10 Flicker The statistics are updated once an hour. This is only displayed if V10 is selected for flicker in [SYSTEM] - DF2 [MAIN] - [MEASURE].


39 2.2 Screen Names and Configurations 33 EVENT EVENT Screen LIST 7.4 "Event List Display"(page 127) Displays events in a form list. You can confirm the time and type of event that occurred. By selecting an event with the cursor, you can make a detailed analysis of the event in the VIEW Screen. You can select the time sequence and priority sequence for the list display method. MONITOR 7.7 "Event Monitor Display"(page 134) You can monitor if any events occurred and how many of each type of event. EN50160 EVENT Screen Over View Displays judgment results for all measurement items, in accordance with the EN50160.


40 Screen Names and Configurations EN50160 EVENT Screen Harmonics Displays detailed judgment results for harmonics, in accordance with the EN Signaling Displays detailed judgment results for signaling voltage, in accordance with the EN Events Displays detailed judgment results for events, in accordance with the EN50160.


41 2.2 Screen Names and Configurations 35 EN50160 EVENT Screen Setting1 Sets the wiring, voltage range, PT ratio, nominal voltage, and thresholds of transient, swell, dip, and interruption, in accordance with the EN Setting2 Sets the thresholds of frequency, voltage fluctuation, flicker, unbalance factor, THD, signaling voltage, in accordance with the EN Setting3 Sets the thresholds of harmonic waveform, in accordance with the EN50160.
42 Screen Names and Configurations
43 37 Connections Chapter 3 For details about connection precautions, Refer to the Quick Start Manual. 1. Connecting to the 3196 POWER QUALITY ANALYZER 1 Attach the Strap. *If unnecessary, go to step Install the battery pack. 3 Connect the AC adapter and power cord. 3 Rear 2 4 Connect the Wiring Adapter (optional). When not connecting the Wiring Adapter, go to step 5. 5 Connect the voltage cord. (Use the input cord label.) 7 Top view 6 Connect the clamp sensor. (Use the input cord label.) 7 Turn on the Before connecting to the power line that you want to measure, make sure that you perform steps 1 to 7. Connect to the power line that you want to measure. (to the next page)
 2 While consulting the connection diagram, connect the voltage cord and clamp sensor to the power line that you want to measure.")
 VECTOR 4 Check the connection status and set the tolerance levels.")
 Chapter 4 \"Making System Settings (SYSTEM Screen)\"(page 43) Chapter 5 \"Using Waveforms, Vectors, DMMs, and Bar Graphs (VIEW")
44 38 2. Connecting to the target power line. Advanced settings WIRING MEASURE 1 Set the connection method, nominal voltage, and frequency. 4.2 "Checking the Connection"(page 45) 2 While consulting the connection diagram, connect the voltage cord and clamp sensor to the power line that you want to measure. 3 Confirm the present connection status. (voltage, current, and active power on each channel) "Confirming the Connection Diagram"(page 45) VECTOR 4 Check the connection status and set the tolerance levels. (Check the oscillation and phase for the voltage and current in the vector.) "Checking the Connection"(page 47) Chapter 4 "Making System Settings (SYSTEM Screen)"(page 43) Chapter 5 "Using Waveforms, Vectors, DMMs, and Bar Graphs (VIEW Screen)"(page 65) Chapter 6 "Using the Time Series Graph (TIME PLOT Screen)"(page 79) Chapter 7 "Using Events (EVENT Screen)"(page 115) 5 OK Result Measurement/analysis NG Go to 2 Depending on your application, make recording and event settings.
 Source side Red A Black N SOURCE")

 Source side Red A Black Black N Yellow SOURCE B")
45 3.1 Connection Diagram 39 ê 3.1 Connection Diagram Single-phase 2-wire (1P2W) Source side Red A Black N SOURCE G A: Line, N: Neutral, G: Ground Load side Gray Black LOAD U- U+ U- U+ U- U+ U- U+ CH1 CH2 CH3 CH1 CH2 CH3 CH4 CH4 U INPUT I INPUT Face the arrow toward the Load U1=100 V I1=15 A U4=10 V I4=1.5 A Ground line measurement, etc. Single-phase 3-wire (1P3W) Source side Red A Black Black N Yellow SOURCE B G A: Line, N: Neutral, G: Ground Load side Gray Black LOAD U- U+ U- U+ U- U+ U- U+ CH1 CH2 CH3 CH1 CH2 CH3 CH4 CH4 U INPUT I INPUT Face the arrow toward the Load U1=U2=100 V I1=I2=15 A U4=10 V I4=1.5 A Neutral line measurement, etc.


46 Connection Diagram Three-phase 3-wire (3P3W2M) Source side Red SOURCE A Black B C Black Yellow A, B, C: Lines Load side LOAD U- U+ U- U+ U- U+ U- U+ CH1 CH2 CH3 CH1 CH2 CH3 CH4 CH4 U INPUT I INPUT Face the arrow toward the Load U1=U2=200 V I1=I2=50 A C U2 B I2 U1 I1 A Three-phase 3-wire (3P3W3M) Source side Red Black SOURCE A Black B C Yellow Black Blue A, B, C: Lines Load side LOAD U- U+ U- U+ U- U+ U- U+ CH1 CH2 CH3 CH1 CH2 CH3 CH4 CH4 U INPUT I INPUT Face the arrow toward the Load U1=U2=U3=200 V I1=I2=I3=50 A C U2 B I3 I2 I1 U1 U3 A

47 3.1 Connection Diagram 41 Three-phase 4-wire (3P4W) Source side Red A SOURCE B C Black N G A, B, C: Lines, N: Neutral, G: Ground Load side Yellow Blue Black Black Gray Black LOAD U- U+ U- U+ U- U+ U- U+ CH1 CH2 CH3 CH1 CH2 CH3 CH4 CH4 U INPUT Face the arrow toward the Load U1=U2=U3=115.5 V I1=I2=I3=50 A U4=0 V I4=0 A I INPUT Neutral line measurement, etc. Used for separate system 2 systems A: Line, N: Neutral Source side Load side Gray SOURCE A N Black LOAD 1 system and DC power supply Used for separate system Source side SOURCE A N A: Line, N: Neutral Load side Gray Black LOAD U- U+ U- U+ U- U+ U- U+ CH1 CH2 CH3 CH1 CH2 CH3 CH4 CH4 U INPUT I INPUT Face the arrow toward the Load U- U+ U- U+ U- U+ U- U+ CH1 CH2 CH3 CH1 CH2 CH3 CH4 CH4 U INPUT I INPUT
48 Connection Diagram
49 4.1 Using the SYSTEM Screen 43 Making System Settings (SYSTEM Screen) Chapter 4 1. Confirm the connection diagram. Confirming the Connection Diagram (page 45) 2. Check the connection vectors. Checking the Connection (page 47) 3. Make system settings. Making System Settings (page 49) Make other settings in the SYSTEM screen. Event Settings Screen (page 63) Using Events (EVENT Screen) (page 115) Load/Save Screen (page 64) Loading and Saving Settings and Measured Data (page 139) 4.1 Using the SYSTEM Screen Switching screen display You can make settings for this device s system on the SYSTEM screen. SYSTEM screen selector WIRING Display screen selector 4.2 "Checking the Connection" (page 45) MAIN 4.3 "Making System Settings" (page 49) EVENT "Voltage/Power Event Settings" (page 122) "Harmonics Event Setting" (page 126) LOAD/SAVE "Saving and Loading Files" (page 145) About the screen configuration "Screen Configurations"(page 16) "Screen Details"(page 20 to 23) The SYSTEM screen is made up of a number of screens that correspond to the DF1 to DF4 (DF: display function) keys. If you press a DF key, the screen corresponding to that key appears. Each time you press the same DF key, the display changes.

50 Using the SYSTEM Screen Screen operations depending on the internal operation status Screen operations are limited according to the internal operation status. : Possible on all screens : Possible in some screens only Internal operation status Display Settings [SETTING] [RECORDING] [ANALYZING] What is the relationship between the operation status and key operations? [SETTING] [RECORD- [ANALYZ- [RECORDING] The key does not start recording during [ANALYZING] operation! Return to the setting mode from analysis CAUTION! Pressing Start recording erases all data stored in internal memory. Changing settings while [RECORDING] or [ANALYZING] is displayed? During [RECORDING] operation: [SETTING] During [ANALYZING] operation: [SETTING] In either case, data stored in internal memory is erased.
 Setting the measured frequency (page 46) Setting the connection method WIRING Wiring Select from pulldown menu Confirm Cancel 1P2W 1P3W 3P3W2M 3P3W3M 3P4W To measure")
51 4.2 Checking the Connection Checking the Connection Confirming the Connection Diagram Example: 3P4W (three-phase four-wire) WIRING WIRING Setting the connection method (page 45) Setting the nominal voltage (page 46) Setting the measured frequency (page 46) Setting the connection method WIRING Wiring Select from pulldown menu Confirm Cancel 1P2W 1P3W 3P3W2M 3P3W3M 3P4W To measure single-phase two-wire power lines To measure single-phase three-wire power lines To measure single-phase three-wire power lines (using the 2 power meter method) (Use this when measuring three-phase power with 2- spot current measurement only.) To measure three-phase three-wire power lines (using the 3 power meter method) To measure three-phase four-wire power lines
52 Checking the Connection Setting the nominal voltage WIRING U Reference (Nominal voltage) Select from pulldown menu Confirm 100 V, 101 V, 110 V, 120 V, 200 V, 202 V, 208 V, 220 V, 230 V, 240 V, 277 V, 346 V, 380 V, 400 V, 415 V, 480 V, 600 V, VARIABLE Nominal voltage affects channels 1 to 3. Cancel Setting the measured frequency WIRING Frequency (Measured frequency) Select from pulldown menu 50 Hz, 60 Hz Confirm Cancel When the display value is wrong 1. When the voltage or current display value is lower than expected The voltage value is low: Is the voltage clip connected to the power line being tested? Is the voltage cord inserted in the voltage connector? The current value is low: Is the clamp-on sensor inserted in the device s current connector? 2. When the active power display value is negative Is the voltage cord of the channel displaying the negative value connected properly? Is the arrow (printed on the clamp) on the clamp-on sensor for the channel displaying the negative value pointing to the loaded side? 3. When the voltage display value differs from the expected value of three-phase connections Are the phase-to-neutral voltage and line-to-line voltage (voltage calculation methods) selections different? "Voltage calculation method settings" (page 54)

53 4.2 Checking the Connection Checking the Connection Example: 3P4W (three-phase four-wire) WIRING VECTOR You can check the voltage and current vectors of each connection method. When tolerance levels are set and the voltage or current falls outside these levels, check and correct the connection. When the input level is 50% or less of range, a marker is appended to the perimeter of the current vector to make it recognizable. Setting tolerance levels VECTOR Phase Select from pulldown menu Confirm Cancel Level U/I Angle Phase (Phase range) Level (Oscillation range) Tolerance level of each phase in the phase range ±1 to 30 Tolerance level of each phase in the RMS value range ±1 to 30% Set the voltage relative to the nominal voltage, and the current relative to the range. U/I Angle Tolerance level of current phase differences in (UI phase differences) -60 to relation to voltage 60
54 Checking the Connection Tolerance levels are wrong 1. When the RMS voltage value is wrong Is the voltage clip properly connected to the power line being tested? Is the voltage cord inserted correctly in the voltage connector? 2. When the voltage phase angle is wrong Is the voltage cord connected properly? Are the colors on the voltage input terminal and the voltage cord the same? 3. When the RMS current value is wrong Is the clamp-on sensor properly inserted in the device s current connector? 4. When the current phase angle is wrong Is the arrow on the clamp sensor pointing towards the load? Are the current input terminal and clamp sensor connected properly?
55 4.3 Making System Settings Making System Settings Main Settings MAIN MEASURE Connection method settings (CH 1, 2, 3) (page 50) Connection method settings (CH 4) (page 50) Clamp sensor settings (page 51) Voltage and current range settings (page 51) PT and CT ratio settings (page 52) Nominal voltage settings (page 52) Measured frequency settings (page 53) PLL source settings (page 53) Voltage calculation method settings (page 54) Harmonic calculation method settings (page 54) THD calculation method settings (page 55) Power factor calculation method settings (page 55) Flicker calculation settings (page 56) Voltage recording method settings (page 56) IEC flicker filter settings (page 57) V10 flicker measurement channel settings (page 57) EN50160 settings (page 58)
56 Making System Settings Connection method settings (CH 1, 2, 3) MEASURE Wiring Select from pulldown menu Confirm Cancel 1P2W 1P3W 3P3W2M 3P3W3M 3P4W To measure single-phase two-wire power lines To measure single-phase three-wire power lines To measure single-phase three-wire power lines (using the 2 power meter method) (Use this when measuring three-phase power with 2- spot current measurement only.) To measure three-phase three-wire power lines (using the 3 power meter method) To measure three-phase four-wire power lines Connection method settings (CH 4) MEASURE Wiring Select from pulldown menu Confirm Cancel OFF Set when you are not using channel 4. AC Set when measuring the voltage of neutral lines or other systems. DC Set when measuring DC power lines. When set to DC, the voltage of a DC power line can be measured. Regardless of the setting, current can be measured only in AC power lines. Even when you set DC, the 0 order harmonic cannot be displayed.
 of the clamp sensor you are using.")
 500A 9667 Use the 9667 FLEXIBLE CLAMP ON SENSOR (500 A range) 1000A 9669 Use the 9669 CLAMP ON SENSOR Voltage and current range settings MEASURE U Range Select from pulldown")
57 4.3 Making System Settings 51 Clamp sensor settings MEASURE Clamp Select from pulldown menu Confirm Cancel 0.1mV/A, 1mV/A 9661, 9660, 10mV/A 9694, 100mV/A, 5000A 9667, 500A 9667, 1000A 9669 Set the output rate (the output voltage to input current ratio) of the clamp sensor you are using. Settings of the optional clamp on sensor: 1mV/A 9661 Use the 9661 CLAMP ON SENSOR 9660 Use the 9660 CLAMP ON SENSOR 10mV/A 9694 Use the 9694 CLAMP ON SENSOR 5000A 9667 Use the 9667 FLEXIBLE CLAMP ON SENSOR (5000 A range) 500A 9667 Use the 9667 FLEXIBLE CLAMP ON SENSOR (500 A range) 1000A 9669 Use the 9669 CLAMP ON SENSOR Voltage and current range settings MEASURE U Range Select from pulldown menu Confirm Cancel I Range Channel (Voltage range) 123ch 150 V, 300 V, 600 V 4 ch (AC) 60 V, 150 V, 300 V, 600 V 4 ch (DC) 60 V, 600 V Clamp settings (Current range) 0.1mV/A 500A, 5000A 1mV/A A, 500A A, 100A 10mV/A A, 50A 100mV/A 0.5A, 5A 5000A A, 5000A 500A A, 500A 1000A A, 1000A The range that can be selected depends on the clamp you choose. The ranges of channels 1 to 3 (CH 1, 2, 3) are the same. You cannot set ranges separately for each channel. Set the voltage range higher than the set nominal voltage. The accuracy of this device is guaranteed for values measured within 1% to 110% of the set range. The 9694 is designed for 5 A. It can be used in the 50-A range, but the accuracy specification only applies to the 5-A range.
Ratio VARIABLE, 1, 60, 100, 200, 300, 600, 700, 1000, 2000, 2500, 5000 CT Ratio")


58 Making System Settings PT and CT ratio settings MEASURE PT Ratio Select from pulldown menu Confirm Cancel CT Ratio V(PT )Ratio VARIABLE, 1, 60, 100, 200, 300, 600, 700, 1000, 2000, 2500, 5000 CT Ratio VARIABLE, 1, 40, 60, 80, 120, 160, 200, 240, 300, 400, 600, 800, 1200 You can set the optional PT(VT) and CT ratios within the 0.01 to range. When setting Optional: Moving between values : Moves up through the values : Moves down through the values Setting value : Increases the value : Lowers the value When measuring on the secondary side of high-voltage and special high-voltage power lines, you can use this to convert the voltage and current values of the primary side. Nominal voltage settings MEASURE UReference (Nominal voltage) Select from pulldown menu Confirm Cancel 100 V, 101 V, 110 V, 120 V, 200 V, 202 V, 208 V, 220 V, 230 V, 240 V, 277 V, 346 V, 380 V, 400 V, 415 V, 480 V, 600 V, VARIABLE Nominal voltage is effective for channels 1 to 3. You can set the optional nominal voltage within the 50 to 600 range. When setting Optional: Moving between values : Moves up through the values : Moves down through the values Setting value : Increases the value : Lowers the value Nominal voltage settings use dip, swell, and interruption threshold settings as references and reference voltage for U.
59 4.3 Making System Settings 53 Measured frequency settings MEASURE Frequency Select from pulldown menu 50 Hz, 60 Hz Confirm Cancel Set the frequency used for internal processing. Be sure to note that the calculation result, particularly for harmonics, will be incorrect, if the setting deviates from the nominal frequency of the measuring line. If set to 50 Hz, 10 waveforms are used to calculate harmonics, and if set to 60 Hz, 12 waveforms are used to calculate harmonics. If the PLL unlocks due to power failure or another reason, sampling synchronous at the set frequency is internally generated for calculation. PLL source settings MEASURE PLL Source Select from pulldown menu Confirm U1, U2, U3 The PLL source is the source used to measure frequencies. The frequency measurement range is Hz to Hz. Cancel
60 Making System Settings Voltage calculation method settings MEASURE U CalcType Select from pulldown menu Confirm Cancel PHASE-N (phase-to-neutra voltage) LINE-LINE (line-to-line voltage) It is possible to switch to phase-to-neutral voltage or line-toline voltage only when the connection method is 3P3W3M (three-phase three-wire three power meter method) or 3P4W (three-phase four-wire). With 3P3W3M: Normally, line-to-line voltage (LINE-LINE) is measured, but this can be converted to phase-to-neutral voltage (PHASE-N) with internal processing on the The line-to-line voltage is processed so that the center of the triangle that created the threephase line-to-line voltage becomes the neutral point. With 3P4W: Normally, phase-to-neutral voltage (PHASE-N) is measured, but this can be converted to line-to-line voltage (LINE-LINE) with internal processing on the Harmonic calculation method settings MEASURE Harm Calc (Harmonic calculation) Select from pulldown menu Confirm Cancel LEVEL (RMS value) % of FND (Proportions) Displays the harmonic RMS voltage or the harmonic RMS current. Displays the harmonic component of each order around the fundamental wave (the proportion of harmonic voltage or harmonic current).


61 4.3 Making System Settings 55 THD calculation method settings MEASURE THD Calc (THD calculation) Select from pulldown menu Confirm Cancel THD_F The ratio of total harmonics to fundamental wave. THD_R The ratio of total harmonics to total harmonics, fundamental wave included. The selected THD calculation method is valid for both harmonic voltage and harmonic current. What is THD? THD (Total Harmonic Distortion) indicates the total harmonic distortion factor. Power factor calculation method settings MEASURE PF Type Select from pulldown menu PF DPF Power factor Displacement power factor Confirm Cancel What is a power factor? The PF (power factor) is the active power to apparent power ratio. Since calculations include all the frequency components, the greater the harmonic current becomes, the smaller the power factor becomes. The DPF (displacement power factor) is the cosine of the phase difference between the fundamental wave voltage and the fundamental wave current. It is only calculated using fundamental wave components and does not include harmonic wave components.

62 Making System Settings Flicker calculation settings MEASURE Flicker Select from pulldown menu Confirm Cancel OFF Flicker measurement is not used. Pst,Plt IEC flicker is measured. V10 V10 flicker is measured. V10 flicker can only be measured on one of voltage channels U1, U2 or U3. The measurement source is the channel that is selected for flicker measurement. Voltage recording method settings MEASURE TimePlot U Select from pulldown menu Confirm Cancel Urms Records the voltage rms value S(t) Records the flicker value instantly. (Pst, Plt is selected for Flicker) U Records the deviation with respect to the nominal RMS voltage. ( V10 is selected for Flicker) The data recorded is reflected in the voltage fluctuation time plot.


63 4.3 Making System Settings 57 IEC flicker filter settings MEASURE Filter Select from pulldown menu Confirm 120V lamp, 230V lamp Select a lamp system filter defined in IEC This setting is available only when Pst, Plt is selected for Flicker. Cancel V10 flicker measurement channel settings MEASURE Flicker CH Select from pulldown menu Confirm U1, U2, U3 V10 flicker can only be measured on one of channels U1, U2 or U3. This setting is available only when V10 is selected for Flicker. Cancel
 is a voltage-quality evaluation method used in Europe.")
64 Making System Settings EN50160 settings MEASURE EN50160 Select from pulldown menu ON OFF Perform evaluations conforming to the EN Do not perform evaluations conforming to the EN Confirm Cancel The EN50160 (Voltage characteristics of electricity supplied by public distribution systems) is a voltage-quality evaluation method used in Europe. It supports evaluations of 230-V 50- Hz power systems only. For detailed information on the EN50160, see the Instruction Manual for EN50160.
65 4.3 Making System Settings Recording Settings MAIN RECORDING Types of settings to record data 1 (page 82) Types of settings to record data 2 (page 83) Settings when the memory is full (page 83) Setting intervals (page 84) Setting Auto-save (page 85) Setting real-time control (page 85) Setting measurement start/stop time (page 86) Setting the repeated recording (page 87) Setting the number of repeated recording (page 88) For details, see 6.2 "Time Plot Settings" (page 81) Hardware Settings MAIN HARDWARE Version information (page 60) Display language settings (page 60) BEEP settings (page 60) Screen color settings (page 61) LCD backlight auto-off settings (page 61) Clock settings (page 62) Resetting the system (page 62) RS connection point, AUTO copy, IP address, subnet mask (Chapter 9, Chapter 10, Chapter 11)
 Confirm")
66 Making System Settings Version information HARDWARE Version Indicates the version of this device. Display language settings HARDWARE Language Select from pulldown menu English, Japanese, Deutsch, Francais, Italiano, Espanol (English, Japanese, German, French, Italian, Spanish) Confirm Cancel BEEP settings HARDWARE Beep Select from pulldown menu OFF, ON Confirm Cancel
 LCD backlight auto-off settings HARDWARE LCD Off (LCD backlight) Select from pulldown menu Confirm Cancel ON Ordinarily turns on the LCD")
67 4.3 Making System Settings 61 Screen color settings HARDWARE Color (Screen color) Select from pulldown menu Confirm Cancel COLOR 1 Default COLOR 2 Dark blue COLOR 3 Monochrome (characters are white) COLOR 4 Light blue MONO Monochrome (characters are black) LCD backlight auto-off settings HARDWARE LCD Off (LCD backlight) Select from pulldown menu Confirm Cancel ON Ordinarily turns on the LCD backlight. 1 min, 5 min, 10 min, Automatically turns off the backlight after the 30 min, 1 hour set time. How do I turn the backlight on again? If the backlight turns off automatically, press any key on the device to turn the backlight on again. You can turn the backlight on again even when in KEYLOCK status. This helps to reduce the device's power consumption when using a battery pack without the AC adapter.
, month (M), day (D), hour (h), and minutes(m). Confirm Cancel Make sure that you enter 00 in the seconds column.")

68 Making System Settings Clock settings HARDWARE Clock Numeric value settings Changes columns in the following order: year (Y), month (M), day (D), hour (h), and minutes(m). Confirm Cancel Make sure that you enter 00 in the seconds column. Press the instant the seconds are 00. Resetting the system HARDWARE System Reset When you think that the device is not operating properly, you can reset the system. If you reset the system, display settings (except language, LAN, and clock settings) return to their defaults.
69 4.4 Event Settings Screen Event Settings Screen Measurement Settings EVENT VOLTAGE POWER Automatic setting of event thresholds (page 123) Turning off all event thresholds (page 123) Setting the event recording sequence (page 124) Event ON/OFF settings (page 124) Setting of event thresholds (page 125) Setting of event thresholds (voltage waveform comparison) (page 125) HARMONICS Event ON/OFF settings and threshold settings (page 126) For details, see 7.3 "Event Settings" (page 121).
70 Load/Save Screen 4.5 Load/Save Screen LOAD/SAVE MEMORY 9.1 "Using the Internal Memory" (page 140) PC-CARD 9.2 "Using a PC Card" (page 141) For details, see Chapter 9 "Loading and Saving Settings and Measured Data" (page 139).
 3. Check measurement data on the DMM display. DMM Display (page 73) 4. Check measurement data with harmonics.")
71 5.1 Using the VIEW Screen 65 Using Waveforms, Vectors, DMMs, and Bar Graphs (VIEW Screen) Chapter 5 1. Check measurement data on the waveform display. Waveform Display (page 67) 2. Check measurement data on the vector display. Vector Display (page 70) 3. Check measurement data on the DMM display. DMM Display (page 73) 4. Check measurement data with harmonics. Harmonics Bar Graph (page 74) Harmonics List Screen (page 76) 5. Check event data on the VIEW display. Analyzing Event Occurrences (page 130) Analyzing Transient Waveforms (page 131) 5.1 Using the VIEW Screen Switching screen display You can confirm such items as waveform data and the measurement status on the VIEW screen. VIEW screen selector Display screen selector WAVE 5.2 "Waveform Display" (page 67) VECTOR 5.3 "Vector Display" (page 70) DMM 5.4 "DMM Display" (page 73) HARMONICS 5.5 "Harmonics Display" (page 74) The VIEW screen is composed of a number of screens corresponding to the DF1 to DF4 (DF: display function) keys. When you press a DF key, the screen corresponding to that key appears. Each time you press the same DF key, the display changes. About screen configuration "Screen Configurations"(page 17) "Screen Details"(page 24 to 27)

72 Using the VIEW Screen Screen operations depending on the internal operation status The screens that can be displayed differ depending on the internal operation status. Internal operation status [SETTING] [RECORDING] [ANALYZING] Display Contents of the latest display update during measurement. Contents of the display update during analysis, or contents at the moment an event selected in TIME PLOT or EVENT occurs. Display update Contents of the display update during setting. Approximately 1 second Screen display during [SETTING] or [RECORDING]: Indicates the screen being displayed for the current measurement. Screen display during [ANALYZING]: Indicates the analysis screen being displayed for the selected event. What is the relationship between the operation status and key operations? [SETTING] [RECORDING] [ANALYZING] [RECORDING] The key does not start recording during [ANALYZING] operation! Return to the setting mode from analysis CAUTION! Pressing Start recording erases all data stored in internal memory. Changing settings while [RECORDING] or [ANALYZ- ING] is displayed? During [RECORDING] operation: [SETTING] During [ANALYZING] operation: [SETTING] In either case, data stored in internal memory is erased.
73 5.2 Waveform Display Waveform Display Example: 4-channel waveform with a 3P4W (three-phase four-wire) configuration WAVE VOLT/CURR Superimposes and displays 4 channels of the voltage waveform. Currsor value (time) Superimposes and displays 4 channels of the current waveform. VOLTAGE Voltage waveform Red: CH1 Yellow: CH2 Blue: CH3 White: CH4 CURRENT Current waveform Red: CH1 Yellow: CH2 Blue: CH3 White: CH4 Enlarging waveforms (page 68) Changing the Y-axis scale of waveforms (page 68) Changing the X-axis scale of waveforms (page 68) Reading the cursor value (cursor measurement) [VOLTAGE], [CURRENT ] (page 69) Scrolling through waveforms (page 69)

74 Waveform Display Enlarging waveforms Changing the Y-axis scale of waveforms SELECT U I Select from pulldown menu Confirm Cancel x1/3, x1/2, x1, x2, x5, x10 When you want to reduce the waveform, make the scale smaller. When you want to enlarge the waveform, make the scale larger. Changing the X-axis scale of waveforms SELECT 2 cycles (Example) Select from pulldown menu Confirm Cancel For 50 Hz 2 cycles, 4 cycles, 10 cycles For 60 Hz 2 cycles, 4 cycles, 10 cycles, 12 cycles The waveforms are displayed over the entire screen in the selected number of cycles. Reading the cursor value (cursor measurement) [VOLT/CURR] CURSOR Move the vertical cursor left and right to read the display value. Cursor value (Waveform instantaneous values) Cursor position Vertical cursor Scroll bar Cursor value (Time) The cursor on the scroll bar indicates where the cursor is positioned on the saved waveform. You can read waveform instantaneous values and time with the cursor. Normally, the cursor is located at the beginning of the waveform.
![5.2 Waveform Display 69 Reading the cursor value (cursor measurement) [VOLTAGE], [CURRENT ] CURSOR Move the vertical cursor left and right to read the display value.](/docs-images/72/66681917/images/75-1.jpg "Cursor position Cursor value (Waveform instantaneous values) Vertical cursor Scroll bar The cursor on the scroll bar indicates where the cursor is positioned on the saved waveform.")
.")
75 5.2 Waveform Display 69 Reading the cursor value (cursor measurement) [VOLTAGE], [CURRENT ] CURSOR Move the vertical cursor left and right to read the display value. Cursor position Cursor value (Waveform instantaneous values) Vertical cursor Scroll bar The cursor on the scroll bar indicates where the cursor is positioned on the saved waveform. You can read waveform instantaneous values with the cursor. Normally, the cursor is located at the beginning of the waveform. Scrolling through waveforms SCROLL Scroll through the waveform Scroll bar Normally, displays the beginning of saved waveforms (50 Hz: 10 waveforms, 60 Hz: 12 waveforms). Waveform display range All recorded data The waveform display range (white belt) on the scroll bar indicates what interval of recorded data is displayed on the screen. When you scroll horizontally, you can check all the saved waveform. When you scroll vertically, you can change the offset position of the displayed waveform. If you select an event and display a waveform, you can scroll horizontally to analyze 14 waveforms at 50 Hz or 16 waveforms at 60 Hz.
 VECTOR Changing the axis display (page 70) Changing the RMS value/phase angle display (page 71) Changing the phase angle display method (page")
76 Vector Display 5.3 Vector Display Example: 3P4W (three-phase four-wire) VECTOR Changing the axis display (page 70) Changing the RMS value/phase angle display (page 71) Changing the phase angle display method (page 71) Changing the phase angle reference source (page 71) Changing harmonic number of orders (page 72) Changing the axis display SELECT LOG (Example) Select from pulldown menu Confirm Cancel LINEAR (linear display) LOG (logarithmic display) You can select whether to use a linear display (LINEAR) or logarithmic display (LOG) for the vector axis. If you select the logarithmic display method, the vector is easy to see even at low levels.
. When PHASE is selected, see \"Changing the phase angle display method\" (page 71).")
77 Vector Display Changing the RMS value/phase angle display SELECT VALUE (Example) Select from pulldown menu Confirm Cancel VALUE (RMS value) PHASE (phase angle) You can select what value to display (RMS value display or phase angle display). When PHASE is selected, see "Changing the phase angle display method" (page 71). Changing the phase angle display method SELECT ±180 (Example) Select from pulldown menu Confirm Cancel ±180 (lead: 0 to 180, lag: 0 to -180 ) lag360 (lag 0 to 360 ) You can select the type of phase angle display. By selecting lag360, you can display 0 to 360. When lag360 is selected, see "Changing the phase angle reference source" (page 71). The selection affects only numerical results, and vector display remains unchanged. Changing the phase angle reference source SELECT U1 (Example) Select from pulldown menu Confirm Cancel U1, I1, U2, I2, U3, I3 You can select the reference source (0 ) to display the phase angle value The selection affects only numerical results, and vector display remains unchanged.

78 Vector Display Changing harmonic number of orders ORDER Change the number of orders You can select what value to display. When you change the number of orders, the values change along with the vector. In this case, the voltage and current unbalance factors remain the same as the values calculated using the fundamental wave (1st order).
79 5.4 DMM Display DMM Display Example: 3P4W (three-phase four-wire) 4-channel DMM display Voltage, current POWER Active power, apparent power Reactive power, power factor (displacement power factor) VOLTAGE Voltage, total voltage distortion Voltage waveform peak monitor value (+, -) Voltage average value, Voltage unbalance factor CURRENT Current, total current total distortion factor Current waveformpeak monitor value (+, -) Current average value, K factor, and current unbalance factor Voltage calculation method settings (page 54) THD calculation method settings (page 55) Power factor calculation method settings (page 55)
 Changing the axis display (page 75) Changing the RMS value/phase angle display (page 75) Displaying inter-harmonics (page 75) Changing the order number")
80 Harmonics Display 5.5 Harmonics Display Harmonics Bar Graph Example: 3P4W (three-phase four-wire) HARMONICS GRAPH For the selected channel: Harmonic voltage Harmonic current Harmonic power Changing the display channel (page 74) Changing the axis display (page 75) Changing the RMS value/phase angle display (page 75) Displaying inter-harmonics (page 75) Changing the order number displayed (page 76) Changing the display channel SELECT CH1 (Example) Select from pulldown menu CH1, CH2, CH3, CH4 Confirm Cancel

81 Harmonics Display Changing the axis display SELECT LOG (Example) Select from pulldown menu Confirm Cancel LINEAR (linear display) LOG (logarithmic display) When you select the logarithmic display, the vector is easy to see even at low levels. Changing the RMS value/phase angle display SELECT VALUE (Example) Select from pulldown menu Confirm Cancel VALUE (RMS value) PHASE (phase angle) You can select whether RMS values or phase angles are displayed in the harmonic bar graph. The harmonic power phase angle indicates the harmonic voltage-current phase difference. Displaying inter-harmonics SELECT iharmoff (Example) Select from pulldown menu iharmoff, iharmon If you display inter-harmonics (iharmon), the screen changes as follows. Turquoise: inter-harmonics components Confirm Cancel

82 Harmonics Display Changing the order number displayed ORDER Change the order number The selected order number becomes green on the bar graph. If you change the order number, the values change along with the bar graph Harmonics List Screen Example: 3P4W (three-phase four-wire) HARMONICS LIST Changing the display channel (page 77) Changing the display item (page 77) Changing the RMS value/phase angle display (page 77) Displaying inter-harmonics (page 78) The 1st to 50th harmonic orders and 0.5 to 49.5 inter-harmonic orders are displayed in a list for the selected item.
83 Harmonics Display Changing the display channel CH1 (Example) Select from pulldown menu Confirm CH1, CH2, CH3, CH4 Cancel Changing the display item U (Example) Select from pulldown menu U, I, P Confirm Cancel Changing the RMS value/phase angle display VALUE (Example) Select from pulldown menu Confirm Cancel VALUE (RMS value) PHASE (phase angle) You can select whether RMS values or phase angles are displayed in the harmonic list. The harmonic power phase angle indicates the harmonic voltage-current phase difference.
 is selected as the display item, interharmonics are not displayed.")

84 Harmonics Display Displaying inter-harmonics iharmoff (Example) Select from pulldown menu iharmoff, iharmon Confirm Cancel When active power (P) is selected as the display item, interharmonics are not displayed. If you display inter-harmonics (iharmon), the screen changes as follows. The left side of the example shows harmonics and the right inter-harmonics. Inter-harmonics order numbers are 0.5 less than the order numbers of harmonics in the same line. (Example) The order of inter-harmonics on the right of the 21st harmonic is 20.5.
85 6.1 Using the TIME PLOT Screen 79 Using the Time Series Graph (TIME PLOT Screen)Chapter 6 1. Make time series settings Time Plot Settings (page 81) 2. Perform measurements Press to record data. 3. Analyze time series data Changes in RMS Value (page 89) Changes in Voltage (page 93) Changes in Harmonics (page 100) Flicker (page 104) 6.1 Using the TIME PLOT Screen Switching screen display TIME PLOT screen selector RMS Display screen selector 6.3 "Changes in RMS Value" (page 89) VOLTAGE 6.4 "Changes in Voltage" (page 93) HARMONICS 6.5 "Changes in Harmonics" (page 100) FLICKER 6.6 "Flicker" (page 104) About screen configuration "Screen Configurations"(page 18) "Screen Details"(page 28 to 32) The TIME PLOT screen is composed of a number of screens that correspond to the DF1 to DF4 (DF: display function) keys. When you press a DF key, the screen corresponding to that key appears. Each time you press the same DF key, the display changes.

86 Using the TIME PLOT Screen Screen operations depending on the internal operation status When measurement starts, the time series graph is displayed on the TIME PLOT screen. The Y-axis and X-axis are automatically scaled so that all the time series graphs are displayed on the screen. To change the scale of the Y-axis or X-axis, end measurement. When measurement stops, the time series graph is no longer displayed. Status Display Display update [SETTING] No time series graph display data [RECORDING] The time series graph display is At each set interval updated. [ANALYZING] The time series graph display is stopped What is the relationship between the operation status and key operations? [SETTING] [RECORDING] [ANALYZING] [RECORDING] The key does not start recording during [ANALYZING] operation! Return to the setting mode from analysis CAUTION! Pressing Start recording erases all data stored in internal memory. Changing settings while [RECORDING] or [ANALYZ- ING] is displayed? During [RECORDING] operation: [SETTING] During [ANALYZING] operation: [SETTING] In either case, data stored in internal memory is erased. Memory status display INTERNAL MEMORY: Internal memory PC CARD MEMORY: ATA flash card TIME PLOT related data capacity Measurement stops when memory becomes full. (Selectable Stop/Continuous) INTERNAL MEMORY Up to 100 EVENT data sets can be stored After 100 events are stored, the earliest are overwritten.
 Types of settings to record data 2 (page 83) Settings when the")
 Setting the number of repeated recording (page 88) Time series graph for TIME PLOT-DF1[RMS], TIME PLOT-DF3[HARMONICS]: Time series graph for TIME PLOT-DF2[VOLTAGE]: You can display all recorded")
87 Time Plot Settings 6.2 Time Plot Settings To display the time series graph, make the following settings in the SYSTEM screen. MAIN RECORDING 50 Hz:10 waveforms, 60 Hz:12 waveforms RMS calculation Harmonic calculation Types of settings to record data 1 (page 82) Types of settings to record data 2 (page 83) Settings when the memory is full (page 83) Setting intervals (page 84) Setting Auto-save (page 85) Setting real-time control (page 85) Setting measurement start/stop time (page 86) Setting the repeated recording (page 87) Setting the number of repeated recording (page 88) Time series graph for TIME PLOT-DF1[RMS], TIME PLOT-DF3[HARMONICS]: Time series graph for TIME PLOT-DF2[VOLTAGE]: You can display all recorded RMS values with voltage (calculated for a single half wave-shifted waveform) and flicker excluded. These RMS values are based on calculations that are performed every 200 ms. Based on these values, you can record the MAX, MIN, and AVE within the interval period, or the AVE by itself. Example: When the interval is set to 1 sec, 5 calculations are performed in the 1-second interval. From these, the MAX, MIN, and AVE or the AVE by itself are recorded Voltage RMS calculation You can display recorded voltage (value calculated for one waveform shifted over half a wave). Since this voltage is calculated for each single half wave-shifted waveform, it contains a calculated value for every half wave. Based on these values, you can record the MAX and MIN within the interval period. Example: When the interval is set to 1 sec, 100 calculations are performed in the 1-second interval for 50 Hz current. Of these, only the MAX and MIN values are recorded. Recording method of Timeplot graph: (page 211)
88 Time Plot Settings Types of settings to record data 1 RECORDING Rec. Data Select from pulldown menu Confirm Cancel ALL DATA P&Harm Power Records all the calculation values. Records all calculation values except inter-harmonics. Records all calculation values except harmonics and inter-harmonics. 1: Power/ 2: P&Harm/ 3: ALL DATA Recorded item Pattern Voltage (one wave shifted over half a wave) Frequency RMS voltage value RMS current value Voltage waveform peak Current waveform peak Active power Apparent power Reactive power Power factor/displacement power factor Voltage unbalance factor Current unbalance factor 1: Power/ 2: P&Harm/ 3: ALL DATA Recorded item Pattern Harmonic voltage Harmonic current Harmonic power Harmonic voltage-current phase difference angle Inter-harmonic voltage Inter-harmonic current Total harmonic voltage distortion factor Total harmonic current distortion factor Total inter-harmonic voltage distortion factor Total inter-harmonic current distortion factor K factor Flicker ( V10 or Pst, PLt)
89 6.2 Time Plot Settings 83 Types of settings to record data 2 RECORDING MAX/MIN/AVE (Example) Select from pulldown menu AVE MAX/MIN/AVE Records the average value only. Records the maximum, minimum, and average values. Confirm Cancel You can display the values (MAX, MIN, and AVE values) selected in the Change in RMS value or Change in harmonics time series graphs. The MAX, MIN, and AVE values are the maximum, minimum, and average calculated values calculated from calculated values included in the interval period. You can always record and display the MAX and MIN values in the change in voltage time series graph, regardless of the selection made here. TIME PLOT Recording Method (page 211) Settings when the memory is full RECORDING Memory Full Select from pulldown menu Confirm Cancel STOP LOOP (Continue) When the internal memory where time series data is saved becomes full, measurement stops. When the internal memory where time series data is saved is exceeded, measurement continues. (Maximum: 1 month) In this case, the oldest time series data in memory is deleted and the new data saved. Relationship between the internal memory and PC card when the memory is full: When the memory is full (page 151)

90 Time Plot Settings Setting intervals RECORDING Interval Select from pulldown menu Confirm Possible recording time 1, 3, 15, or 30 sec, 1, 5, 10, or 30 min, 1/2 hour Depending on the data recorded and interval settings, the time series graph's possible recording time changes. Types of settings to record data 1 (page 82) Types of settings to record data 2 (page 83) Cancel Possible recording time of the time series graph ALL DATA (Saves all data) P&Harm (Saves RMS values and Interval harmonics) Power (Saves RMS values only) MAX/MIN/AVE AVE MAX/MIN/AVE AVE MAX/MIN/AVE AVE 1 s 5 m 45 s 17 m 12 s 8 m 29 s 25 m 18 s 2 h 1 m 51 s 5 h 32 m 21 s 3 s 17 m 15 s 51 m 36 s 25 m 27 s 1 h 15 m 54 s 6 h 5 m 33 s 16 h 37 m 3 s 15 s 1 h 26 m 15 s 4 h 18 m 2 h 7 m 15 s 6 h 19 m 30 s 30 s 2 h 52 m 30 s 8 h 36 m 4 h 14 m 30 s 12 h 39 m Harmonics order data is not saved for Power, but it is saved in THD. 1 day 6 h 27 m 45 s 2 days 12 h 55 m 30 s 3 days 11 h 5 m 15 s 6 days 22 h 10 m 30 s 1 m 5 h 45 m 17 h 12 m 8 h 29 m 1 day 1 h 18 m 5 days 1 h 51 m 13 days 20 h 21 m 5 m 1 day 4 h 45 m 3 days 14 h 1 day 18 h 25 m 5 days 6 h 30 m 25 days 9 h 15 m 31 days 10 m 2 days 9 h 30 m 7 days 4 h 3 days 12 h 50 m 10 days 13 h 31 days 31 days 30m 7 days 4 h 30 m 21 days 12 h 10 days 14 h 30 m 31 days 31 days 31 days 1 h 14 days 9 h 31 days 21 days 5 h 31 days 31 days 31 days 2 h 28 days 18 h 31 days 31 days 31 days 31 days 31 days Measuring for an extended period of time. Use a Flash ATA card and set the Auto Save item to BINARY. When using a 32-MB Flash ATA card: above interval x approximately 2.5 When using a 64-MB Flash ATA card: above interval x approximately 5 (However, you can only measure for up to 31 days.) Measuring for an extended period of time more than 1 month. Setting the repeated recording (page 87), Setting the number of repeated recording (page 88)
 Saving and Loading Files (page 145) When BINARY or TEXT is selected, measurement data is recorded to PC card as well as internal memory.")
91 Time Plot Settings Setting Auto-save RECORDING Auto Save Select from pulldown menu Confirm Cancel OFF, BINARY, TEXT You can set the 3196 to save data automatically to the PC card. File Types (page 143) Saving and Loading Files (page 145) When BINARY or TEXT is selected, measurement data is recorded to PC card as well as internal memory. After measurement, the measurement data in internal memory can be saved manually in binary or text format. Manual saving of the measured data files 1 (Binary format: all data) (page 147) Manual saving of the measured data files 2 (Text format: time-series/ event list/ flicker data) (page 148) Setting real-time control RECORDING Time Start (Real-time control) Select from pulldown menu OFF ON Measurement starts or stops when you press the START/STOP key. Measurement starts or stops at the set measurement start/stop time. Confirm Cancel When ON is selected: [SETTING] [WAITING] [RECORDING] [ANALYZING] Starts measurement at the measurement start time. Finishes measurement at the measurement end time. When you want to stop measurement: Press the button again.

92 Time Plot Settings Setting measurement start/stop time RECORDING Start Time Stop Time When Manual setting: Set the values Numeric value settings Change columns Confirm When Automatic settings: Start time Set to the current time. Stop time Set to 1 hour after the start time. Set to 1 day after the start time. Set to 1 week after the start time. Cancel An error message appears when is pressed and the set measurement start time has already passed.


93 6.2 Time Plot Settings 87 Setting the repeated recording Repeated recording operations can be conducted up to 99 days at one-day measuring intervals, and up to 99 weeks at one-week measuring intervals. The measured data file of repeated recording is saved as a separate binary file for each one-day or one-week period on the PC card. The repeated recording function utilizes continuous measurement with full internal memory, real time control, and auto-save on PC card. To set the repeated recording function, make the following settings. Without these settings, the repeated recording function cannot be used. RECORDING MemoryFull Select from pulldown menu Confirm Cancel AutoSave TimeStart LOOP BINARY ON All measured data collected by repeated recording is stored on the PC card, but previous data is cleared in each recording operation and not retained in internal memory (data displayed on the screen). Therefore, only the latest data is retained in internal memory at any given time. Settings when the memory is full (page 83) Setting Auto-save (page 85) Setting real-time control (page 85) Make repeated recording settings RECORDING RepeatSave Select from pulldown menu OFF No repeated recording 1 Day Repeated recording at one-day intervals 1 Week Repeated recording at one-week intervals Confirm Cancel

![(Example) When number of repeated recording operations is set to 99 Start time Start measuring Auto-setting Stop time End measuring [SETTING] [WAITING] [RECORDING] [ANALYZING] 1/99 [SETTING]](/docs-images/72/66681917/images/94-4.jpg "[SETTING] [WAITING] [WAITING] Auto-setting Start time Start measuring [RECORDING] 2/99 Auto-setting Start time Start measuring [RECORDING] 99/99 Auto-setting Stop time End measuring [ANALYZING]")
94 Time Plot Settings Setting the number of repeated recording RECORDING RepeatSave Select from pulldown menu Confirm Cancel 99 (example) 1 to 99 Increases the value Lowers the value Indicates required PC card file capacity. When the repeated recording function is set, the number of repeated recording operations currently set will be indicated. (Example) When number of repeated recording operations is set to 99 Start time Start measuring Auto-setting Stop time End measuring [SETTING] [WAITING] [RECORDING] [ANALYZING] 1/99 [SETTING] [SETTING] [WAITING] [WAITING] Auto-setting Start time Start measuring [RECORDING] 2/99 Auto-setting Start time Start measuring [RECORDING] 99/99 Auto-setting Stop time End measuring [ANALYZING] Auto-setting Stop time End measuring [ANALYZING] PC card BINARY data file PC card BINARY data file PC card BINARY data file To set the start time, enter the start time of the first recording operation in repeated recording. The start and end times of subsequent repeated recording operations are then set automatically. Note that each repeated recording operation results in a measuring deviation of one minute.
95 Changes in RMS Value 6.3 Changes in RMS Value Display items calculated by the 3196 at 200 ms intervals can be displayed in a time series for each interval. RMS 1 ELEMENT Example: 3P4W (three-phase four-wire) You can select a single item from the display items to be displayed in the time series graph. Yellow: MAX value Green: AVE value Red: MIN value 2 ELEMENT You can select two items from the display items to be displayed in the time series graph. Yellow: MAX value Green: AVE value Red: MIN value Changing the display item (page 90) Changing the display channel (page 90) Changing the Y-axis scale (page 91) Changing the X-axis scale (page 91) Cursor measurements (page 91) Scrolling through waveforms (page 92) Searching for events (page 92) MAX, MIN, and AVE indicate the maximum, minimum, and average during the interval. When you select AVE in the data type settings as the recorded data ([SYSTEM]-DF2[RECORDING], a time series graph is displayed for the AVE value only instead of three types of time series graphs being displayed for the MAX, AVE, and MIN values as above. When using the time series graph to observe swells, dips, and instantaneous interruptions, and to record U deviation with respect to the nominal voltage, use VOLTAGE.
 Uunb I Current Iunb Ipeak+ Current waveform peak (+) U-THD Ipeak- Current waveform peak (-) I-THD Uave Average voltage value Iave Average current value P Active power I-iTHD S")

96 Changes in RMS Value Changing the display item SELECT Freq (Example) Select from pulldown menu Confirm Cancel Freq Frequency Q U Voltage PF Upeak+ Voltage waveform peak (+) KF Upeak- Voltage waveform peak (-) Uunb I Current Iunb Ipeak+ Current waveform peak (+) U-THD Ipeak- Current waveform peak (-) I-THD Uave Average voltage value Iave Average current value P Active power I-iTHD S Apparent power Reactive power Power factor K factor Voltage unbalance factor Current unbalance factor Total harmonic voltage distortion factor Total harmonic current distortion factor U-iTHD Total inter-harmonic voltage distortion factor Total inter-harmonic current distortion factor peak: waveform peak, ave: average value between channels. Depending on the following settings, some items cannot be selected. Setting item Settings Selection not possible Recorded data Power or P&Harm U-iTHD, I-iTHD Connection 1P2W Uave, Iave, Uunb, Iunb 1P3W, 3P3W2M Uunb, Iunb If the PLL unlocks due to a momentary power outage or another reason, the set frequency is displayed and recorded during the momentary power outage. Changing the display channel SELECT CH1 (Example) Select from pulldown menu CH1, CH2, CH3, CH4: Channel sum: Total for all channels Confirm Cancel If the connection method settings (4 channels) are off, you cannot select CH4.

97 6.3 Changes in RMS Value 91 Changing the Y-axis scale SELECT Ydiv Select from pulldown menu Confirm Cancel AUTO, x1, x2, x5, x10, x25, x50 When you want to reduce the graph, make the scale smaller. When you want to enlarge the graph, make the scale larger. When recording, use AUTO. Changing the X-axis scale SELECT Tdiv Select from pulldown menu Confirm Cancel AUTO, x1, x1/2, x1/4, x1/8, x1/16, x1/32, x1/64 When you want to reduce the graph, make the scale smaller. When you want to enlarge the graph, make the scale larger. When recording, use AUTO. Cursor measurements CURSOR Move the vertical cursor left and right to read the display value. (MAX/MIN/AVE display) Yellow: MAX value Green: AVE value Red: MIN value Cursor value Cursor time Cursor (AVE display) Yellow: AVE value You can read the value above the cursor and the time on the time series graph.


98 Changes in RMS Value Scrolling through waveforms SCROLL Scroll through the graph Waveform display range Scroll bar Graph display All recorded data The waveform display range (white belt) on the scroll bar indicates what interval of recorded data is displayed on the screen. When AUTO is set during recording, the X-axis and Y-axis are automatically scaled so that all the time series graphs are displayed on the screen. When measurement stops, if you change the X-axis scale, you can scroll through the time series graph in every direction. Searching for events EVENT JUMP Skips sideways through the event markers. Analyzing events using waveforms Event marker Synchronization is achieved with an event selected from the event list. You can search for the time the event occurred (event marker ). The start time and stop time event markers are always displayed. Event marker (red): Indicates an ordinary event. (blue): Indicates an event for which an event voltage fluctuation graph is recorded.
99 6.4 Changes in Voltage Changes in Voltage Graphing Voltage Fluctuations for Each Interval You can display interval-by-interval time series graphs of voltages ( U,S(t) as well as Urms) internally calculated from single half waveshifted waveforms VOLTAGE INTERVAL Example: 3P4W (three-phase four-wire) Displays a time series graph for U1, U2, and U3. Modified values are displayed as MAX and MIN values. Red: U1 Yellow: U2 Blue: U3 Changing the Y-axis scale (page 94) Changing the X-axis scale (page 94) Cursor measurements (page 94) Scrolling through waveforms (page 95) Searching for events (page 95) When Urms is selected as the voltage recording setting (SYSTEM-DF2[MEASURE]): The RMS voltage detected for swell, dip, and instantaneous interruption is displayed. The cursor value of the event marker area on the time series graph is the same as the swell, dip, or instantaneous interruption value. When Pst, Plt is selected The instantaneous flicker defined in IEC is displayed. When U is selected as the voltage recording setting (SYSTEM-DF2[MEASURE]): The deviation in RMS voltage to nominal voltage (positive and negative voltage waveform peaks for nominal voltage) is displayed. MAX and MIN indicate the maximum and minimum during the interval. When you select MAX/MIN/AVE or AVE in the data type settings as recorded data ([SYSTEM]-DF2[RECORDING]), the MAX and MIN values are displayed in a time series graph. Note that the MAX and MIN values are displayed in a single graph for changes in voltage instead of the MAX, MIN, and AVE values displayed in three graphs as for changes in RMS value.


100 Changes in Voltage Changing the Y-axis scale SELECT Ydiv Select from pulldown menu Confirm Cancel AUTO, x1, x2, x5, x10, x25, x50 When you want to reduce the graph, make the scale smaller. When you want to enlarge the graph, make the scale larger. AUTO scaling is used during recording. Changing the X-axis scale SELECT Tdiv Select from pulldown menu Confirm Cancel AUTO, x1, x1/2, x1/4, x1/8, x1/16, x1/32, x1/64 When you want to reduce the graph, make the scale smaller. When you want to enlarge the graph, make the scale larger. AUTO scaling is used during recording. This cannot be changed. Cursor measurements CURSOR Move the vertical cursor left and right to read the display value. Cursor value Cursor time Left side Right side (MAX value) Red: U1 Yellow: U2 Blue: U3 (MIN value) Red: U1 Yellow: U2 Blue: U3 Cursor You can read the value above the cursor and the time on the time series graph.
 on the scroll bar indicates what interval of recorded data is displayed on the screen.")

101 6.4 Changes in Voltage 95 Scrolling through waveforms SCROLL Scroll through the graph Waveform display range Cursor position Scroll bar Graph display The cursor on the scroll bar indicates where the cursor is positioned on the all recorded data. All recorded data The graph display range (white belt) on the scroll bar indicates what interval of recorded data is displayed on the screen. When AUTO is set during recording, the X-axis and Y-axis are automatically scaled so that all the time series graphs are displayed on the screen. If you change the X/Y-axis scale, you can scroll through the time series graph in every direction. Searching for events EVENT JUMP Skips sideways through the event markers. Analyzing events using waveforms Event marker Synchronization is achieved with an event selected from the event list. You can search for the time the event occurred (event marker ). The start time and stop time event markers are always displayed. Event marker (red): Indicates an ordinary event. (blue): Indicates an event for which an event voltage fluctuation graph is recorded.
102 Changes in Voltage Graphing Voltage Fluctuations for Events When an event occurs, the voltage calculated by the 3196 for a single waveform shifted half a wave can be displayed in a time series graph spanning 10 seconds. VOLTAGE EVENT Example: 1P2W (single-phase two-wire) Displays a time series graph for U1, U2, and U3. Pre-trigger is fixed to 0.5 second and overall recording length to 10 seconds. Red: U1 Yellow: U2 Blue: U3 Changing the Y-axis scale (page 97) Changing the X-axis scale (page 97) Cursor measurements (page 97) Scrolling through waveforms (page 98) Displaying voltage fluctuation event graphs stored on a PC card (page 98) Automatically recording multiple voltage fluctuation event graphs on a PC card (page 99) The only events that are valid for recording are voltage swells, voltage dips, and instantaneous voltage interruptions. Only one voltage fluctuation event graph is recorded in internal memory. By using a PC card, your can record and display multiple voltage fluctuation event graphs. Recording is possible regardless of the recording data type settings and interval setting (SYSTEM-DF2[RECORDING]).


103 6.4 Changes in Voltage 97 Changing the Y-axis scale SELECT Ydiv Select from pulldown menu Confirm Cancel AUTO, x1, x2, x5, x10, x25, x50 When you want to reduce the graph, make the scale smaller. When you want to enlarge the graph, make the scale larger. AUTO scaling is used during recording. Changing the X-axis scale SELECT Tdiv Select from pulldown menu Confirm Cancel AUTO, x5, x2, x1, x1/2, x1/4, x1/8, x1/16, x1/32, x1/64 When you want to reduce the graph, make the scale smaller. When you want to enlarge the graph, make the scale larger. AUTO scaling is used during recording. This cannot be changed. Cursor measurements CURSOR Move the vertical cursor left and right to read the display value. Event maker Cursor value Cursor time Red: U1 Yellow: U2 Blue: U3 Cursor You can read the value above the cursor and the time on the time series graph.
 on the scroll bar indicates what interval of recorded data is displayed on the screen.")
104 Changes in Voltage Scrolling through waveforms SCROLL Scroll through the graph Waveform display range Cursor position Scroll bar The cursor on the scroll bar indicates where the cursor is positioned on the all recorded data. Graph display All recorded data The graph display range (white belt) on the scroll bar indicates what interval of recorded data is displayed on the screen. When AUTO is set during recording, the X-axis and Y-axis are automatically scaled so that all the time series graphs are displayed on the screen. If you change the X/Y-axis scale, you can scroll through the time series graph in every direction. Displaying voltage fluctuation event graphs stored on a PC card NEXT FILE You can read and display voltage fluctuation event graphs recorded on a PC card. Each depression of this key reads the next in a series of voltage fluctuation event graph on the PC card. This operation is only possible in the following circumstances. When a PC card is inserted during analysis When voltage fluctuation event data is recorded on the PC card in binary format It is also possible to analyze data stored on the PC card after loading all binary measurement files into the analyzer. (However, the PC card must be left in the analyzer during operation as data is read at each stage.)
105 6.4 Changes in Voltage 99 Automatically recording multiple voltage fluctuation event graphs on a PC card Only one voltage fluctuation event graph is recorded in internal memory. By using a PC card, your can record multiple voltage fluctuation event graphs. When BINARY (binary format) or TEXT (text format) is selected as the auto save option, measurement files are automatically recorded on the PC card. Method of Auto-save settings: Measured data files Auto-save (binary format) settings (page 150) Auto-save measured data file (text format) settings (page 152)
106 Changes in Harmonics 6.5 Changes in Harmonics HARMONICS You can select six orders and display them in a harmonics time series graph. Example: 3P4W (three-phase four-wire) HARM Changing the display item (page 101) Changing the X-axis scale (page 101) Changing the order number displayed (page 102) Cursor measurements (page 102) Scrolling through waveforms (page 103) Searching for events (page 103) INTERHARM When Power is selected in the recorded item settings (SYSTEM- DF2[RECORDING]) as recorded data, you cannot display the harmonics time series graph. Also, when Power or P&Harm is selected, you cannot display the changes in harmonics time series graph for inter-harmonics. When you select MAX/MIN/AVE in the data type settings (SYSTEM- DF2[RECORDING]) as recorded data, the MAX and MIN values are displayed in a single graph.
 Psum Total active power θ1/θ2/θ3 Phase difference (CH1/2/3) θsum Total phase difference The display items that can be selected differ depending on the connection method.")

107 6.5 Changes in Harmonics 101 Changing the display item SELECT U1 Select from pulldown menu Confirm Cancel U1, U2, U3, U4 Voltage (CH1/2/3/4) I1/I2/I3/I4 Current (CH1/2/3/4) P1/P2/P3 Active power (CH1/2/3/) Psum Total active power θ1/θ2/θ3 Phase difference (CH1/2/3) θsum Total phase difference The display items that can be selected differ depending on the connection method. θ indicates the phase difference between the voltage and the current for that channel. You can only select U1, U2, U3, U4, I1, I2, I3, and I4 in the interharmonic time series graph. Changing the X-axis scale SELECT Tdiv Select from pulldown menu Confirm Cancel AUTO, x1, x1/2, x1/4, x1/8, x1/16, x1/32, x1/64 When you want to reduce the graph, make the scale smaller. When you want to enlarge the graph, make the scale larger. AUTO scaling is used during recording. This cannot be changed. The Y-axis scale cannot be changed. The maximum value for the Y-axis is the same as the full-scale range value.
![102 6.5 Changes in Harmonics Changing the order number displayed SELECT 1 (Example) Select from pulldown menu Confirm Cancel OFF, 1 to 50 (When harmonics DF3[HARM] is selected) OFF, 0.](/docs-images/72/66681917/images/108-1.jpg "5 to 49.5 (When Inter-harmonics DF3[INTERHARM] is selected) You can select up to six orders and display them simultaneously.")

108 Changes in Harmonics Changing the order number displayed SELECT 1 (Example) Select from pulldown menu Confirm Cancel OFF, 1 to 50 (When harmonics DF3[HARM] is selected) OFF, 0.5 to 49.5 (When Inter-harmonics DF3[INTERHARM] is selected) You can select up to six orders and display them simultaneously. Cursor measurements CURSOR Move the vertical cursor left and right to read the display value. Cursor value The cursor value is the same color as the selected order. You can read the value above the cursor and the time on the time series graph. When MAX/MIN/AVE is selected in the data type settings (SYS- TEM-DF2[RECORDING]) as recorded data, the cursor values indicate MAX values, and when AVE is selected, AVE values are indicated.
 on the scroll bar indicates what interval of recorded data is displayed on the screen.")

109 6.5 Changes in Harmonics 103 Scrolling through waveforms SCROLL Scroll through the graph Scroll bar Cursor position Scroll bar The cursor on the scroll bar indicates where the cursor is positioned on the all recorded data. Graph display All recorded data The graph display range (white belt) on the scroll bar indicates what interval of recorded data is displayed on the screen. During measurement, the Y-axis is automatically scaled so that all the time series graphs are displayed on the screen. When measurement stops, if you change the X-axis scale, you can scroll the time series graph right and left. Searching for events EVENT JUMP Skips sideways through the event markers. Analyzing events using waveforms Event marker Synchronization is achieved with an event selected from the event list. You can search for the time the event occurred (event marker ). The start time and stop time event markers are always displayed. Event marker (red): Indicates an ordinary event. (blue): Indicates an event for which an event voltage fluctuation graph is recorded.
110 Flicker 6.6 Flicker IEC Flicker Meter and V10 Flicker Meter A flicker meter is a device for measuring perceived instability in light resulting from variations in lighting brightness and wavelength. There are two types of flicker meters: the IEC flicker meter (UIE flicker meter), which is based on the IEC standard; and the V10 flicker meter, which is used primarily in Japan. Both types of flicker meter observe fluctuations in voltage and display a numeric value as an objective measure of flicker. IEC Flicker Meter The IEC flicker function is based on international standard IEC , Flickermeter - Functional and design specifications. Functional diagram of the IEC flicker meter RMS value Urms The RMS voltage (Urms) that is used by the IEC flicker meter is calculated every half cycle. Auto Gain Controller AGC This circuit adjusts the input RMS voltage (Urms) to a constant level without affecting the variable voltage component. The circuit has a 60-second response time (the time over which the fluctuation width changes from 10% to 90%) with respect to stepped variations in Urms.
111 6.6 Flicker 105 Weighting Filter Processing uses one of two selectable weighting filters, a filter of 230 V lamp, 50 Hz systems, and a filter for 120 V lamp, 60 Hz systems. F(s) = kω1s 1+s/ω2 / (s 2 +2λs+ω1 2 ) (1+s/ω3)(1+s/ω4) 230 V lamp 50Hz system k = λ = 2π ω1 = 2π ω2 = 2π ω3 = 2π ω4 = 2π V lamp 60Hz system k = λ = 2π ω1 = 2π ω2 = 2π ω3 = 2π ω4 = 2π Statistical Processing Statistics on flicker are compiled by applying the cumulative probability function (CPF) to 1,024 logarithmic divisions of instantaneous flicker values S(t) in the range from to P.U. to obtain cumulative probabilities P0.1, P1s, P3s, P10s, and P50s. Short Interval Flicker Value Pst This indicates degree of perceptibility (severity) of flicker measured over a 10-minute period. Calculation: Pst = P P1s P3s+0.28P10s+0.08P50s P50s = (P30+P50+P80)/3 P10s = (P6+P8+P10+P13+P17)/5 P3s = (P2.2+P3+P4)/3 P1s = (0.7+P1+P1.5)/3 P0.1 is not smoothed Long Interval Flicker Value Plt Indicates the degree of perceptibility (severity) of flicker determined from successive Pst measurements over a 2-hour period. To calculate a moving average of Pst, the displayed value is updated every 10 minutes. Calculation: Plt = 3 ΣPsti 3 /N
112 Flicker V10 Flicker Meter V10 Flicker The V10 flicker function is calculated using the perceived flicker curve calculation method, which is based on digital Fourier transformation. Calculation: V 10 = ( a n V n ) 2 n = 1 Vn: RMS value [V] for voltage fluctuations in frequency fn. an: Luminosity coefficient for fn where 10 Hz is 1.0. (0.05Hz to 30Hz) Evaluation period:for 1 minute V10 Perceived flicker curve V10 Perceived flicker coefficient Frequency[Hz] To measure the IEC Flicker or V10 Flicker Set the flicker calculation, voltage recording method, IEC flicker filter, and V10 flicker measurement channel in SYSTEM - DF2[MEA- SURE]. Flicker calculation settings (page 56) Voltage recording method settings (page 56) IEC flicker filter settings (page 57) V10 flicker measurement channel settings (page 57)
 Changing the X-axis scale (page 108) Cursor measurements (page 108) Scrolling through waveforms (page 109) The graph is updated every 10-minute,")
113 6.6 Flicker IEC Flicker Graph Displays the IEC flicker graph. FLICKER GRAPH Changing the Y-axis scale (page 107) Changing the X-axis scale (page 108) Cursor measurements (page 108) Scrolling through waveforms (page 109) The graph is updated every 10-minute, regardless of the interval that is set for [SYSTEM]-DF2[MAIN]-[RECORDING]. After you press, the clock displays 00 seconds and measurement starts. This is only displayed if Pst,Plt is selected for Flicker in [SYSTEM]- DF2[MAIN]-[MEASURE]. A fluctuation graph of S(t) is displayed in the DF2[VOLTAGE] screen. However, this graph is not displayed unless S(t) is selected for voltage recording with [SYSTEM]-DF2[MAIN]-[MEASURE]. Changing the Y-axis scale SELECT Ydiv Select from pulldown menu Confirm AUTO, x1, x2, x5, x10, x25, x50 When you want to reduce the graph, make the scale smaller. When you want to enlarge the graph, make the scale larger. AUTO scaling is used during recording. Cancel


114 Flicker Changing the X-axis scale SELECT Tdiv Select from pulldown menu Confirm Cancel AUTO, x1, x1/2, x1/4, x1/8, x1/16, x1/32, x1/64 When you want to reduce the graph, make the scale smaller. When you want to enlarge the graph, make the scale larger. AUTO scaling is used during recording. This cannot be changed. Cursor measurements CURSOR Move the vertical cursor left and right to read the display value. Cursor value Upper: Pst measured value Lower: Plt measured value Measured values of Pst and Plt can be read every 10 minutes.

115 6.6 Flicker 109 Scrolling through waveforms SCROLL Scroll through the graph Scroll bar Waveform display range Scroll bar Graph display All recorded data The waveform display range (white belt) on the scroll bar indicates what interval of recorded data is displayed on the screen. When AUTO is set during recording, the X-axis and Y-axis are automatically scaled so that all the time series graphs are displayed on the screen. If you change the X/Y-axis scale, you can scroll through the time series graph in every direction.
116 Flicker IEC Flicker List Statistics on Pst and Plt are displayed every 10 minutes, along with the date and time. Pst: short interval flicker value Plt: long interval flicker value FLICKER LIST The displayed statistics are for IEC flicker (Pst and Plt), and are displayed in the list every 10 minutes together with the date and time. This is only displayed if Pst, Plt is selected for flicker in [SYSTEM]-DF2 [MAIN]-[MEASURE]. EN50160, Voltage characteristics of electricity supplied by public distribution systems, specifies a limit of Plt 1 during 95% of a 1-week period.

117 6.6 Flicker V10 Flicker Graph FLICKER GRAPH Changing the Y-axis scale (page 112) Changing the X-axis scale (page 112) Cursor measurements (page 112) Scrolling through waveforms (page 113) The graph is updated once a minute, regardless of the interval that is set for [SYSTEM]-DF2[MAIN]-[RECORDING]. After you press, the clock displays 00 seconds and measurement starts. This is only displayed if V10 is selected for flicker in [SYSTEM]-DF2[ MAIN]-[MEASURE]. V10 flicker can only be measured on one of the voltage channels U1, U2, or U3. The measurement source is the same as the PLL source. Reference voltage for V10 flicker With V10 flicker measurement, the reference voltage is automatically set internally using AGC (automatic gain control). Once the fluctuating voltage value has stabilized, the reference voltage is automatically changed to that value. Therefore, unlike conventional V10 flicker meters, there is no need to switch supply voltage settings. Example: Fluctuating voltage: Stabilizes at 96 V rms reference voltage is automatically changed to 96 V rms Fluctuating voltage: Stabilizes at 102 V rms reference voltage is automatically changed to 102 V rms Due to the effect of the high pass filter used with V10 flicker, if you begin measuring V10 immediately after making settings, the V10 flicker measurement value may be unstable, causing the first and second settings to display large values. After making settings on the [SYSTEM] screen, it is recommended that you wait about 3 minutes before you start measuring.


118 Flicker Changing the Y-axis scale SELECT Ydiv Select from pulldown menu Confirm Cancel AUTO, x1, x2, x5, x10, x25, x50 When you want to reduce the graph, make the scale smaller. When you want to enlarge the graph, make the scale larger. AUTO scaling is used during recording. Changing the X-axis scale SELECT Tdiv Select from pulldown menu Confirm Cancel AUTO, x1, x1/2, x1/4, x1/8, x1/16, x1/32, x1/64 When you want to reduce the graph, make the scale smaller. When you want to enlarge the graph, make the scale larger. AUTO scaling is used during recording. This cannot be changed. Cursor measurements CURSOR Move the vertical cursor left and right to read the display value. Cursor value Left side Right side Measurement value V10 The measured value of V10 flick can be read every 1 minute.

119 6.6 Flicker 113 Scrolling through waveforms SCROLL Scroll through the graph Scroll bar Waveform display range Scroll bar Graph display All recorded data The waveform display range (white belt) on the scroll bar indicates what interval of recorded data is displayed on the screen. When AUTO is set during recording, the X-axis and Y-axis are automatically scaled so that all the time series graphs are displayed on the screen. If you change the X/Y-axis scale, you can scroll through the time series graph in every direction.
120 Flicker V10 Flicker List The following V10 flicker statistics are updated every hour and displayed in the list together with the date and time. The maximum value over one hour for V10 Flicker The fourth maximum value over one hour for V10 Flicker The average value over one hour for V10 Flicker FLICKER The V10 flicker statistics are displayed for the measurement period. V10 values are updated once a minute. Overall maximum value for V10 Flicker LIST The statistics are updated once an hour, and the overall maximum value for V10 flicker is updated once a minute. This is only displayed if V10 is selected for flicker in [SYSTEM]-DF2 [MAIN]-[MEASURE].
 By setting thresholds in advance, information regarding internal calculations that exceed the thresholds can be captured as events.")
121 115 Using Events (EVENT Screen) Chapter 7 1. Make event settings Event Settings (page 121) By setting thresholds in advance, information regarding internal calculations that exceed the thresholds can be captured as events. Since thresholds are ordinarily set as the rated limits of the electrical facilities being used, the occurrence of an event can be interpreted as a power supply anomaly. 2. Check event thresholds Event Monitor Display (page 134) You can check whether specified event thresholds are appropriate by looking at the event monitor screen. This is possible even without pressing the START key to start recording. 3. Perform measurements Press to record. As each event occurs, it is displayed on the EVENT screen. Event occurrence 4. Analyze events Event List Display (page 127) Analyzing Event Occurrences (page 130) Analyzing Transient Waveforms (page 131) Event Monitor Display (page 134) Events displayed by the 3196 Measurement start events Measurement stop events Calculation events (events for which thresholds can be specified) When measuring using events, be sure to enable event settings in the SYSTEM screen. EVENT Event Settings (page 121)
122 Using the EVENT Screen 7.1 Using the EVENT Screen Switching screen display Selecting the EVENT Screen EVENT Display screen selection LIST 7.4 "Event List Display" (page 127) MONITOR 7.7 "Event Monitor Display" (page 134) EN50160 (For details, see the instruction Manual for EN50160 (CD-R).) Over View Harmonics Signaling Events Setting1 Setting2 Setting3 About screen configuration "Screen Configurations"(page 19) "Screen Details"(page 33 to 35) The EVENT screen is made up of a number of screens that correspond to the DF1 to DF4 (DF: display function) keys. When you press a DF key, the screen corresponding to that key appears. Each time you press the same DF key, the display changes.

123 7.1 Using the EVENT Screen 117 Screen operations depending on the internal operation status Screen operations are limited according to the internal operation status. Status [SETTING] [RECORDING] [ANALYZING] Display update None Each time an event occurs Stop Can be used in the SETTING status only with the event monitor. What is the relationship between the operation status and key operations? [SETTING] [RECORDING] [ANALYZING] [RECORDING] The key does not start recording during [ANALYZING] operation! Return to the setting mode from analysis CAUTION! Pressing Start recording erases all data stored in internal memory. Changing settings while [RECORDING] or [ANALYZ- ING] is displayed? During [RECORDING] operation: [SETTING] During [ANALYZING] operation: [SETTING] In either case, data stored in internal memory is erased. Memory status display INTERNAL MEMORY: Internal memory PC CARD MEMORY: ATA flash card TIME PLOT related data capacity Measurement stops when memory becomes full. (Selectable Stop/Continuous) INTERNAL MEMORY Up to 100 EVENT data sets can be stored After 100 events are stored, the earliest are overwritten. While only 100 events can be recorded in internal memory, up to 1,000 events can be stored on a PC card.
124 Event Detection Method 7.2 Event Detection Method Transient overvoltage Threshold Detection method: The voltage channels (U1 to U4) are sampled at 2 MHz and transients exceeding the absolute value of the threshold are detected. Peak value 2 ms Interval 2 ms Threshold Threshold determines the variance from the voltage waveform. The waveform that is saved is the one that has the largest positive or negative transient peak. Recorded contents: 1. Peak value: Maximum absolute value (2000 Vmax) 2. Interval: Period over which the threshold is exceeded (4 msmax) 3. Waveform: Waveform centered around the peak value Voltage swells, voltage dips, and interruptions RMS voltage 2 4 Swell Threshold Hysteresis RMS voltage EVENT IN EVENT OUT Dips and interruptions RMS voltage Threshold EVENT IN Hysteresis EVENT OUT Detection method: Events are detected using the RMS voltage of sampling data for a single wave (256 points) from a voltage waveform that is shifted by a half wave. Detection is based on the line-to-line voltage with three-phase three-wire connection, and on the phase-to-neutral voltage with three-phase four-wire connection. Swell is detected when the RMS voltage RMS exceeds the threshold in the positive direction. Dips and interruptions are detected when the RMS voltage exceeds the threshold in the negative direction. (Hysteresis is applied for detection in both cases.) Recorded contents: 1. Height, depth: For swell, the threshold is the height, and is displayed as swell to %. For dips, the threshold is the depth, and is displayed as dip to %. For interruptions, the threshold is the depth, and is displayed as interruption to %. 2. Interval: Period over which the threshold is exceeded
125 7.2 Event Detection Method 119 Frequency Detection method: Reciprocal detection (sampling at 2 MHz) with measurement and detection approximately every 200 ms (about once every 10 cycles at 50 Hz or every 12 cycles at 60 Hz) The measurement source is U1, U2, or U3 (same as the PLL synchronization source) Voltage waveform peaks, current waveform peaks, RMS voltage (upper limit, lower limit, SENSE), RMS current, active power, reactive power, apparent power, power factor, and displacement power factor 50 Hz: 10 cycles, 60 Hz: 12 cycles RMS calculation With RMS voltage (upper limit) SENSE value Hysteresis Threshold Detection method: Measurement and detection at 256 points per cycle approximately every 200 ms (about once every 10 cycles at 50 Hz or every 12 cycles at 60 Hz) With three-phase connection, the voltage calculation method (either phase-to-neutral voltage or line-to line voltage) can be specified for RMS voltage detection. Voltage waveform peaks, current waveform peaks, active power, reactive power, power factor, and displacement power factor are detected using thresholds specified as absolute values. RMS value EVENT IN SENSE SENSE EVENT OUT Voltage unbalance factor, current unbalance factor, harmonic voltage, harmonic current, harmonic power, harmonic voltage-current phase difference, total harmonic voltage distortion factor, total harmonic current distortion factor, and K factor 50 Hz: 10 cycles, 60 Hz: 12 cycles Harmonic calculation in a rectangular window With 3rd order harmonic voltage Threshold EVENT IN EVENT OUT Hysteresis Detection method: Measurement and detection are performed in a 2048-point rectangular window containing 10 cycles at 50 Hz or 12 cycles at 60 Hz. Thresholds can be specified individually for each harmonic order for harmonic voltage, harmonic current, harmonic power, and harmonic voltage current phase difference. For harmonic voltage, harmonic current, and harmonic power, detection can be performed using either of two selectable harmonic calculation methods (effective value or content percentage). For total harmonic voltage distortion factor and total harmonic current distortion factor, detection can be performed using either of two selectable THD calculation methods (RMS based or fundamental wave based). Harmonic power and harmonic voltage current phase difference are detected using thresholds specified as absolute values.
126 Event Detection Method Harmonic voltage distortion Reference waveforms are formed above and below the voltage waveform with an interval of 200 ms and with an offset equivalent to the threshold value, then detection is performed by comparing the measured waveform with these reference values. External event External events are detected either when the external control terminal (EVENT IN) is shorted, or at the falling edge of the input pulse signal. Voltage and current waveforms can be recorded along with measured values upon occurrence of external events. (See Chapter 8.) Manual event Manual events are detected when and are pressed simultaneously. Voltage and current waveforms can be recorded along with measured values upon occurrence of manual events. Activates when the external event is set to ON. For details on the Event waveform recording method: Event Waveform Recording Method (page 212)
127 7.3 Event Settings Event Settings Events and thresholds are set in the SYSTEM screen. Voltage/Power Event Settings (page 122) Harmonics Event Setting (page 126) Item Voltage frequency Voltage waveform comparison* External event Order selection*2 Measurement selection*3 Positive and negative*4 Approximately Channel selection*5 PLL source Threshold*1 - OFF 0 to 30 Hz 1,2,3 - OFF 0 to 100% Input terminal - OFF None Voltage transient ± 1,2,3,4 - OFF 0 to 2000 Vpk Voltage swell 1,2,3 - OFF Threshold: 0 to 200% Voltage dip 1,2,3 - OFF Threshold: 0 to 100% Instantaneous voltage interruption (interruption) 1,2,3 - OFF Threshold: 0 to 100% RMS voltage value RMS voltage (SENSE) Upper limit/ Lower limit Phase-to-n/ line-to-line Phase-to-n/ line-to-line 1,2,3 4 OFF 0 to 600 Vrms 1,2,3 4 OFF 0 to 60 Vrms RMS current 1,2,3 4 OFF 0 to 500 A Voltage waveform peak ± 1,2,3 4 OFF 0 to 1.8 kv (±) Current waveform peak ± 1,2,3 4 OFF 0 to 2.0 ka (±) Active power ± 1,2,3 sum OFF 0 to 3 MW Reactive power ± 1,2,3 sum OFF 0 to 3 Mvar Apparent power 1,2,3 sum OFF 0 to 3 MVA Power factor/displacement PF/DPF ± 1,2,3 sum OFF 0 to 1 power factor K factor 1,2,3 4 OFF 0 to 500% Total harmonic voltage -F/-R 1,2,3 4 OFF 0 to 500% distortion factor Total harmonic current -F/-R 1,2,3 4 OFF 0 to 500% distortion factor Voltage unbalance factor - sum OFF 0 to 100% Current unbalance factor - sum OFF 0 to 100% Harmonic voltage 1st to 50th RMS/% 1,2,3 4 OFF 0 to 600 Vrms/0 to 100% orders Harmonic current 1st to 50th RMS/% 1,2,3 4 OFF 0 to 5 ka/0 to 100% orders Harmonic power 1st to 50th RMS/% ± 1,2,3 sum OFF 0 to 3 MW/0 to 100% orders Harmonic voltage-current phase difference 1st to 50th orders ± 1,2,3 sum OFF 0 to 180 *1: The recorded threshold is the multiplication result when the PT ratio and CT ratio are set. *2: For harmonics, settings can be made individually for each harmonic order. *3: Measurement settings can be selected for each type of measurement (inter-phase or line-to-line and -F or -R). *4: Plus and minus (±) indicates that the threshold is specified as an absolute value.(events are detected using absolute values regardless of whether they are positive or negative.) *5: You can set the thresholds individually for channels that are separate and not off. *6: Hysteresis is selected as a percentage value common to all thresholds in the range 0 to 10%. Frequency hysteresis is fixed at 0.1 Hz.
128 Event Settings Voltage/Power Event Settings Make the following settings in the SYSTEM screen. EVENT VOLTAGE POWER Automatic setting of event thresholds (page 123) Turning off all event thresholds (page 123) Setting the event recording sequence (page 124) Event ON/OFF settings (page 124) Setting of event thresholds (page 125) Setting of event thresholds (voltage waveform comparison) (page 125)

129 7.3 Event Settings 123 Automatic setting of event thresholds VOLTAGE Auto Setup AUTO SETUP Event thresholds (voltage, power, and harmonic) are set automatically, taking the current measurement as the normal value. It is recommended that thresholds be individually adjusted, using the thresholds set automatically for reference. The thresholds set will be meaningless if automatic setting is used when no input is present. See the Appendix for parameters and levels that are automatically set with automatic event setting. Contents of Automatic Setting of Events (thresholds) (page 224) Turning off all event thresholds VOLTAGE Auto Setup ALL OFF All event thresholds for voltage, power, and harmonics are turned OFF.
 Priority (Priority order) Events are listed in the order in which they occurred. Events are listed in worst-case order (according to severity).")

130 Event Settings Setting the event recording sequence VOLTAGE Event Record FIFO Priority Set the order in which events (voltage, power, and harmonic) are displayed in the event list screen. FIFO (Time order) Priority (Priority order) Events are listed in the order in which they occurred. Events are listed in worst-case order (according to severity). The event recording sequence cannot be changed during postmeasurement analysis. The order of event priority cannot be changed. See the Appendix regarding the internal setting of the event priority order. Event Recording Sequence (Priority Order) (page 226) Event ON/OFF settings VOLTAGE Urms SWELL (Example) OFF ON OFF ON Disables voltage swell event functions Enables voltage swell event functions Make threshold settings Make threshold settings Confirm Cancel The thresholds for voltage swell, voltage dip, and voltage interruption are set as percentages of the nominal voltage. Nominal voltage settings (page 52) Voltage equivalents of percentage values are displayed on the right side.

 VOLTAGE U wave (waveform comparison) Waveform currently being measured Upper side of waveform envelope level Lower side of waveform envelope")
131 7.3 Event Settings 125 Setting of event thresholds VOLTAGE Upper settable threshold limit Make threshold settings Confirm Cancel Frequency (Example) ON Currently set threshold Current measurement value Lower settable threshold limit Thresholds can be set while viewing the current measurement values. Events set are stored internally regardless of the event ON/ OFF setting. Event triggers are not effective until the event setting is set to ON. Setting of event thresholds (voltage waveform comparison) VOLTAGE U wave (waveform comparison) Waveform currently being measured Upper side of waveform envelope level Lower side of waveform envelope level Make threshold settings Confirm Cancel When the measured waveform exceeds the waveform envelope level, a voltage waveform comparison event is generated. Events set are stored internally regardless of the event ON/ OFF setting. Event triggers are not effective until the event setting is set to ON.
 Event ON/OFF settings and threshold settings HARMONICS U Harmonics (Example) Set ON or OFF for each harmonic order.")
 of")
132 Event Settings Harmonics Event Setting Make the following settings in the SYSTEM screen. EVENT HARMONICS Event ON/OFF settings and threshold settings (page 126) Event ON/OFF settings and threshold settings HARMONICS U Harmonics (Example) Set ON or OFF for each harmonic order. (ON: numeric value) The numeric value indicates the total number of harmonic orders set to ON. Select the harmonic order OFF ON Disables voltage harmonic event functions Enables voltage harmonic event functions OFF ON Make threshold settings Harmonic order being set Threshold Bar (green) of harmonic order being set Threshold(red) Confirm Cancel Measured value Events set are stored internally regardless of the event ON/ OFF setting. Event triggers are not effective until the event setting is set to ON.
 Displaying events (page 127) Scrolling through the event list (page 128) Scrolls the event details list.")
133 7.4 Event List Display Event List Display Displays events in a list. LIST Correspondence between event settings and event category display (page 128) Displaying events (page 127) Scrolling through the event list (page 128) Scrolls the event details list. (page 128) Information that is recorded as the event includes the start time, stop time, the 3196 message, and event parameters set in the SYSTEM screen. A total of 100 events can be recorded. If different multi-parameter events occur within the same 200 ms span, they are grouped and displayed together as one event. The contents of the multi-parameter events are displayed in the lower part of the screen. Changing the list display sequence Setting the event recording sequence (page 124) The display sequence cannot be changed while the status is [RECORDING] or [ANALYZING]. Change the display sequence while in the [SETTING] status. Displaying events LIST Select an event Confirm You can select an event and display detailed event information and the contents of multi-parameter events.
134 Event List Display Scrolling through the event list Scrolls the event list up or down. Scrolls the event details list. Scroll the event details list up or down. See the specifications for details. Measurements (page 181) Correspondence between event settings and event category display Event setting Event category Others Start Start Stop Stop Voltage Frequency Freq Voltage waveform comparison Wave External event, manual event Ext Voltage transient Tran Voltage swell Swell Voltage dip Dip Voltage instantaneous interruption Inter Power Voltage RMS upper limit Urms Voltage RMS lower limit Urms Current RMS value Irms Voltage waveform peak U peak+ U peak- Current waveform peak I peak+ I peak- Active power P Reactive power Q Apparent power S Power factor PF K factor KF Voltage distortion factor U_THD Current distortion factor I_THD Voltage unbalance factor U_UNB Current unbalance factor I_UNB Harmonic Voltage harmonic U_HARM Current harmonic I_HARM Power harmonic P_HARM Harmonic phase difference PHASE For details on events displayed in the last column of the event list, see Text Event Data-format Composition (page 223)
135 7.4 Event List Display 129 About the event list sequence Time order Example: When 35 events have occurred No.1 Dip CH1 OUT... Indicates the event that occurred last. (Events ended with occurrence of a voltage dip. No.35 Start... Indicates the event that occurred first. (Start event occurred. Priority order Example: When 100 or more events have occurred No.1 Dip CH1 OUT... Indicates the highest priority. (Events ended with occurrence of a voltage dip. No.100 Wave CH1... Indicates an event with low priority. (Voltage waveform distortion occurred. About the event list display contents List display Example: :47:58:253 U_THD CH1 IN Sequence number Month - Day 12:47:58: Hour:minute:second:1/1000th sec U_THD... Total voltage distortion factor. CH1... Channel 1 IN... Measurement start and end times Details display Example: 2001/6/16 12:48: Swell CH1 OUT V 0:00: /6/16... Year/Month/Day 12:48: Hour:minute:second:1/1000th sec Swell... Voltage swell CH1... Channel 1 OUT... End of occurrence V... The worst value 0:00: Time from start of occurrence to end of occurrence

, you can switch to the other screens related to")
136 Analyzing Event Occurrences 7.5 Analyzing Event Occurrences Analyzing event occurrences LIST Select an event Confirm Event details Select an event to display a corresponding waveform analysis. Return to event list From the event details screen (the event waveform screen), you can switch to the other screens related to event occurrence (DF1[WAVE], DF2[VECTOR], DF3[DMM], and DF4[HARMONICS]) by pressing the DF key. For details on the Event waveform recording method; Event Waveform Recording Method (page 212)


 TRANSIENT Voltage waveform Transient waveform Transient data")

137 7.6 Analyzing Transient Waveforms Analyzing Transient Waveforms Displaying transients LIST Select an event category from the event list or an event indicated with Tran in the detailed event list. Confirm (Display changes to the VIEW screen waveform display.) TRANSIENT Voltage waveform Transient waveform Transient data Year/ Month/Day Time Rising edge, peak value Duration Return to event list Display switches between the voltage/current waveform display and the voltage/transient waveform display each time you press.


138 Analyzing Transient Waveforms Enlarging transient waveforms Changing the Y-axis range of waveforms SELECT T Select from pulldown menu Confirm Cancel 1kV/div, 600V/div, 300V/div, 150V/div, 60V/div, 30V/div To reduce the waveform, make the voltage value larger. To enlarge the waveform, make the voltage value smaller. Changing the X-axis range of waveforms SELECT 50µs/div Select from pulldown menu Confirm 25µs/div, 50µs/div, 100µs/div, 200µs/div, 400µs/div To reduce the waveform, make the X-axis range value smaller. To enlarge the waveform, make the X-axis range value larger. Cancel Searching for transients TRANS SEARCH (Search for transients) Select transient from voltage waveform Return to event list If the voltage waveform contains multiple transients, you can select one of them.
 on the scroll bar indicates what interval of recorded data is displayed on the screen. When you scroll horizontally, you can check all the saved waveform.")
139 7.6 Analyzing Transient Waveforms 133 Scrolling through transient waveforms SCROLL Scroll through the waveform Scroll bar Return to event list Waveform display range All recorded data (4 ms) The waveform display range (white belt) on the scroll bar indicates what interval of recorded data is displayed on the screen. When you scroll horizontally, you can check all the saved waveform. When you scroll vertically, you can change the offset position of the displayed waveform.

140 Event Monitor Display 7.7 Event Monitor Display MONITOR You can monitor all events to determine whether and how many occurred. If there are no events, 0 is displayed If there are events, they are indicated in when and a count shows the number of occurrences. Voltage fluctuation event Transient Transient overvoltage Swell Voltage swell (rise in RMS voltage) Dip Voltage dip (drop in RMS voltage) Instantaneous interruption Interruption (voltage interruption) Waveform: Voltage waveform comparison Other events External Start, stop, external event, manual event Basic RMS event Frequency Frequency Voltage RMS voltage, voltage waveform peak Current RMS current, current waveform peak Power Active power, reactive power, apparent power Power factor Power factor (or displacement power factor) Unbalance Voltage unbalance factor, current unbalance factor Harmonic event Voltage Voltage harmonic Current Current harmonic Power Power harmonic, harmonic phase difference Voltage distortion Voltage THD-F (or voltage THD-R) Current distortion Current THD-F (or current THD-R) KF K factor You can use this function even when the internal operation status is [SETTING]. Threshold settings can be changed and you can check for occurrence of events in the event monitor by making event settings with [SYSTEM]-DF3[EVENT]. When recording is started and the internal operation status changes to [RECORDING], event monitoring starts after first clearing all events displayed. When recording is started, the start event occurs and External in Other Events always changes to 1. Similarly, when recording is stopped, the stop event occurs and External in Other Events always changes to 2.
141 135 Using the External Control Terminals Chapter 8 You can enter events and output event occurrence times with the external control terminals. EVENT EVENT IN GND OUT GND Anomaly search device Trigger input terminal HIOKI MEMORY HiCORDER Event input terminal (EVENT IN) Synchronized with an external device, analyzes anomalies. When you connect the search signal of an anomaly search device such as an overcurrent relay to the event input terminal, you can analyze anomalies using this device according to anomaly operations. 8.2 "Event Input Terminal (EVENT IN)" (page 137) Event output terminal (EVENT OUT) This informs an external device when anomalies occur within the When you connect the event output terminal to a trigger input terminal on a waveform recording device such as the HIOKI MEMORY HiCORDER, you can record waveforms on the MEMORY HiCORDER when events occur. 8.3 "Event Output Terminal (EVENT OUT)" (page 138) To avoid damaging this device, do not input voltages outside the ranges -5 V to +10 V (EVENT IN) or 0 to +50 V (EVENT OUT) to the external control terminals. When using the external control terminals, to use the external event function, set the external event to ON. VOLTAGE External ON
142 Connecting to the External Control Terminal 8.1 Connecting to the External Control Terminal To avoid electric shocks, use the specified material only. Connecting to the external control terminals Electric wires that conform with: single line φ1.0 mm (AWG 18) or twisted line 0.75 mm 2 Supported electric wires: single wire φ0.4 to 1.0 mm (AWG 26 to 18) twisted wire 0.3 to 0.75 mm 2 (AWG 22 to 20) diameter of search wire: more than φ0.18 mm Standard direction wire length: 10 mm Tools that conform to button operations: flat head screwdriver (width of blade-tip: 2.6 mm) 1. Press down on the terminal button using a tool, such as a flat head screwdriver. 2. While the button is depressed, insert the wire into the electric wire connection hole. 3. Release the button. The electric wire is locked in place.
143 8.2 Event Input Terminal (EVENT IN) Event Input Terminal (EVENT IN) By inputting a signal to the event input terminal externally, you can make the 3196 determine that an external event has occurred when that event was input. Similar to other events, you can record the voltage and current waveforms, and the measurement values of external events. Using this device, you can analyze power anomalies that occur in other electrical equipment. To avoid damaging this device, do not input voltages outside the range -5 V to +10 V to the external control terminals. Signal input methods Short-circuit the terminal or input a pulse signal. Use the event input terminal (EVENT IN) and the ground terminal (GND). You can control the event input terminal by short-circuiting the terminal (active LOW) or dropping the pulse signal (2.5 V). Input voltage range Maximum input voltage HIGH level: 3.0 to 5.0 V LOW level: 0 to 1.0 V -5 to 10 V EVENT IN Longer than 30 ms 5 V HIGH 2.5 to 5.0 V GND LOW 1 to 1.0 V 30 ms EVENT IN GND 10 kω 1 kω
144 Event Output Terminal (EVENT OUT) 8.3 Event Output Terminal (EVENT OUT) This indicates events occurring externally that were synchronized with events occurring internally for this device. Usage method 1. Connect a warning device. This is a good way to output warnings when events such an instantaneous interruptions occur. Usage method 2. Connect to the trigger input terminal of a MEMORY HiCORDER. This allows you to record waveforms on the MEMORY HiCORDER when events occur on the You can record between 14 and 16 waveforms on the 3196 when events occur. When you want to record waveforms for a longer period of time, use the 3196 in parallel with a MEMORY HiCORDER. To avoid damaging this device, do not input voltages outside the 0 V to +50 V range to the external control terminal. Signal output method If an event occurs in the 3196, a pulse signal is output. Use the event output terminal (EVENT OUT) and the ground terminal (GND). Output signal Open collector output (includes voltage output) Active LOW Output voltage HIGH level: 4.5 to 5.0 V range LOW level: 0 to 0.5 V Pulse width LOW level: longer than 30 ms Maximum input 0 to 50 V, max. 50 ma, 200 mw voltage EVENT OUT HIGH 4.5 to 5.0 V GND LOW 0 to 0.5 V Longer than 200 ms Longer than 30 ms 5 V 10 kω EVENT OUT GND
145 139 Loading and Saving Settings and Measured Data Chapter Internal memory PC card Card type: Flash ATA types I and II Slot: TYPE II x 1 standard Format: MS-DOS format Memory: must support up to 528 MB : Possible/ : Not possible Saving and loading data Using the internal memory Using a PC card (page 140) (page 141) Saving setting conditions (up to 10 files) Loading setting conditions Saving measured data (binary format/text format) Loading measured data (binary format only) Saving screen data (BMP files) The PC card interface installed in this device conforms to PCMCIA (Personal Computer Memory Card International Association) and JEIDA (Japan Electronic Industry Development Association) PC card standards.
 to save SAVE Inputs the file name SAVE When you want to delete a character: DELETE The setting conditions currently set on the 3196 are saved.")
 to load LOAD The selected setting conditions are loaded.")
146 Using the Internal Memory 9.1 Using the Internal Memory Save setting conditions You can only save or load setting conditions in the internal memory. MEMORY Select which number (No.) to save SAVE Inputs the file name SAVE When you want to delete a character: DELETE The setting conditions currently set on the 3196 are saved. Settings file names: up to 8 alphanumerical characters : Selects characters : Confirms the selected character : Backspace (deletes the selected character) The date and time are recorded automatically. If you do not input a file name, the setting conditions are not saved. Loading setting conditions MEMORY Select which number (No.) to load LOAD The selected setting conditions are loaded. Even if you save 10 condition settings, the possible recording time of the time series graph (page 84) does not change. You can only use the internal memory when the operation status is [SETTING].
147 9.2 Using a PC Card Using a PC Card Selecting a PC Card Use only PC Cards sold by HIOKI. Compatibility and performance are not guaranteed for PC cards made by other manufacturers. You may be unable to read from or save data to such cards. Make sure that you format your PC card before using it. (Format the PC card using this device or the PC.) When formatting a PC card on a PC, use the FAT-16 format. Formatting a card in FAT-32 format may result in incompatibility problems. Do not use the device where oil permeates the air or in dusty places. Doing so can cause the deterioration of connector contacts. PC card capacity HIOKI options The 3196 has an internal memory of 13 MB. Therefore, to transfer all the data recorded in the internal memory to a PC card, you need a PC card with a capacity of 13 MB. We recommend that you use a PC card with a capacity of 13 MB or more. PC cards (includes adapter) 9626 PC CARD 32M 9627 PC CARD 64M 9726 PC CARD 128M 9727 PC CARD 256M 9728 PC CARD 512M
148 Using a PC Card Inserting and Removing the PC Card Trying to force the PC card upside down or to insert the wrong end into the PC card slot, you can damage the PC card and/or this device. When you are not using a PC card, keep the cover closed. While the PC card is in use, is displayed on the upper left of this device. Do not remove the PC card from the device while this mark is present. Doing so can damage the data on the PC card. When transporting this device, remove the PC card and close the cover. Inserting the PC card Open the cover and insert the PC Card with the arrow facing up and in the direction of the PC card slot, as far as it will go. Removing the PC card Press the eject button and pull out the PC card.
149 Using a PC Card File Types File and Format Three types of data can be saved to PC cards, including settings, measured data (binary and text format), and screen copy files. : Possible/ : Not possible Directory name File name [SYSTEM]- DF4[PC-CARD] SAVE LOAD Opening files on a PC Setting Files ########.SET Measurement Data Files Binary format Text format Time-series data *4 Event data *1, *3 Transient waveform data *1 V10/ IEC Flicker data *1 Voltage fluctuation event data *3,*7 Time-series data *1 Event list data *1, *5 V10/ IEC Flicker data *1 Voltage fluctuation event data *3,*7 Event waveform data *2, *6 B+Date+No.*8 3196SET.SET 96INTVL.ITV 96EVT000.EVT to 96EVT999.EVT TRN to TRN 96FLICK.FLC T+Date+No.*8 96INTVL.CSV TEXTWAVE 96DV000.WDU to 96DV999.WDU 96EVENT.TXT 96FLICK.TXT HHMM000.CSV to HHMM999.CSV HHMM000.CSV to HHMM999.CSV *9 *10 Screen Hard Copy Files H BMP to H BMP Storage method *1: Files can be saved automatically every interval, or saved manually after measurement is finished (when analyzing). *2: After measurement is finished (when analyzing), you can select an event number and save files manually. *3: Data is saved automatically each time an event occurs. Creating event files *4: A file is created for each event (event data for all of the contents, including waveforms). *5: All of the events in the list are created within a single file. *6: A file is created for each event waveform. *7: A file is created for each voltage fluctuation event graph. Creating a directory and file name *8: A number is appended to files each time measurement data is saved. Binary format: B (1 digit)+ Date (5 digits: year, month, day) + Number (2 digits: 01 to 99) Text format:t (1 digit)+date (5 digits: year, month, day) + Number (2 digits: 01 to 99) The year is indicated using the lowest digit. (Example: The year 2002 is represented as 2.) 3196SET.SET is also saved in the text format directory. *9: HH indicates hours, and MM indicates minutes. *10: EVENT_DF1[LIST] is used to save event waveform data in text format.
150 Using a PC Card Binary format file capacity Time-series data Indicates the capacity of a time-series data file (.ITV) that can be saved at one interval. Power P&Harm ALL DATA MAX/MIN/AVE 720 bytes bytes bytes AVE 264 bytes 3464 bytes 5096 bytes The capacity of data attached to one file is 128 bytes. Example of calculation: Capacity of data file acquired in one-hour measurement with recorded data set to Power, MAX/MIN/AVE; and interval to 1 second File capacity=128(bytes)+720(bytes) 60(sec) 60(min) = 2,532K bytes Flicker data Indicates the capacity of a flicker data file (.FLC) saved in one calculation operation. V10 Flicker IEC Flicker Data capacity per calculation operation 4 bytes (every minute) 24 bytes (every ten minutes) The capacity of data attached to one file is 136 bytes. Example of calculation: Capacity of a data file acquired in one-hour measurement of V10 flicker File capacity = 136(bytes) + 4(bytes) 60(min) = 376 bytes Event data, Transient waveform data, Voltage fluctuation event data Indicates the capacity per each. Type of data Event data (.EVT) Transient waveform data (.TRN) Voltage fluctuation event data (.WDU) Capacity per each 81K bytes 17K bytes 34K bytes [For two transient waveforms (positive and negative) within one waveform] 15K bytes Setting files The setting file (3196SET.SET) capacity is 3.81 Kbytes. Formatting PC cards PC-CARD FORMAT During formatting, Now Formatting! is displayed. When the message disappears, formatting is finished. Note that formatting a PC card deletes all the files it contains and that they cannot be retrieved.
 (page 147) Manual saving of the measured data files 2 (Text format: time-series/ event list/ flicker data) (page 148) Manual saving of the measured data files 3")
151 9.2 Using a PC Card Saving and Loading Files Loading files Loading files (page 145) Deleting files (page 145) Manual saving of the settings files (page 147) Manual saving of the measured data files 1 (Binary format: all data) (page 147) Manual saving of the measured data files 2 (Text format: time-series/ event list/ flicker data) (page 148) Manual saving of the measured data files 3 (Text format: event waveform data) (page 150) Measured data files Auto-save (binary format) settings (page 150) Auto-save measured data file (text format) settings (page 152) Screen hard copies (auto-copy) (page 153) Screen hard copy (manual copy) (page 153) Before saving or loading data using a PC card, insert the PC card. When you select the PC card and there is no PC card present, the following error message appears. No card To make this error message disappear, press any key. PC-CARD Select which number (No.) to load LOAD When loading settings files, select.set files. When loading measured data files, select a directory <DIR> that begins with B. You cannot load text files, BMP files, or file of a type not supported by this device to the When loading binary files, the maximum time it takes to load a file is approximately 5 min. The 3196 cannot read binary format files that exceed 13MB in size. We recommend the use of the 9624 PQA-HiVIEW to analyze binary format files. Deleting files PC-CARD Select a number (No.) DELETE
152 Using a PC Card About file types and saving Settings file Manual save When the operation status is [SETTING]: Auto-save PC-CARD SAVE When the operation status is [ANALYZING]: PC-CARD SAVE Manual saving of the settings files (page 147) SETUP FILE Measured data file Manual save Auto-save (Binary format: Time-series, Event data) When the operation status is [ANALYZING]: PC-CARD SAVE BINARY FILE (Saves all data in the internal memory, including settings files.) Manual saving of the measured data files 1 (Binary format: all data) (page 147) Saving when the operation status is [RECORDING]: (Auto-save settings required) Measured data files Autosave (binary format) settings (page 150) (Text format: Time-series, Event list data) When the operation status is [ANALYZING]: PC-CARD TEXT Select RETURN SAVE TEXT FILE Saving when the operation status is [RECORDING]: (Auto-save settings required) Auto-save measured data file (text format) settings (page 152) Manual saving of the measured data files 2 (Text format: time-series/ event list/ flicker data) (page 148) (Text format: Event waveform data) When the operation status is [ANALYZING]: LIST WaveTextSave Manual saving of the measured data files 3 (Text format: event waveform data) (page 150) Screen copy file Manual save Saving is possible when the operation status is [SETTING], [RECORDING], [ANALYZING]. Auto-save Saving when the operation status is [RECORDING]: (Auto-save settings required)
![147 9.2 Using a PC Card Manual saving of the settings files PC-CARD You can save or delete settings files when the operation status is [SETTING] or [ANALYZING].](/docs-images/72/66681917/images/153-1.jpg "SAVE SETUP FILE For [ANALYZING] only (Does not need to be selected for [SETTING].) Inputs the file name SAVE The setting conditions currently set on the 3196 are saved.")
153 Using a PC Card Manual saving of the settings files PC-CARD You can save or delete settings files when the operation status is [SETTING] or [ANALYZING]. SAVE SETUP FILE For [ANALYZING] only (Does not need to be selected for [SETTING].) Inputs the file name SAVE The setting conditions currently set on the 3196 are saved. Settings file names: up to 8 alphanumerical characters :Selects characters : Confirms the selected character : Backspace (deletes the selected character) The date and time are recorded automatically. If you do not input a file name, the setting file is not saved. Manual saving of the measured data files 1 (Binary format: all data) You can save files when the operation status is [SETTING]. PC-CARD SAVE BINARY FILE Measured data files contain all data files, and can be saved with settings files in the directory. Files are saved automatically, with B (indicates binary format) and the date and No. used as the directory name. When saving files in binary format, the maximum time it takes to save files is 4 min 30 s. When data is saved in binary format, all data in the analyzer s memory is saved to PC card. Up to 13 MB in internal memory can be used to store data. (Time-series data capacity: 5 MB + event data capacity: 8 MB)
 PC-CARD SAVE TEXT Select You can save files when the operation status is [ANALYZING].")

154 Using a PC Card Manual saving of the measured data files 2 (Text format: time-series/ event list/ flicker data) PC-CARD SAVE TEXT Select You can save files when the operation status is [ANALYZING]. If you want to change or confirm the files that have been saved, make settings in the text item selection screen. In [SYSTEM]-DF2[RECORDING], the item selected for the AutoSave setting is the same as the item selected to be saved in the TEXT setting. Select item to save OFF ON RETURN TEXT FILE Measured data files contain time series graph data, event list data, and flicker data files, and can be saved with settings files in the directory. Files are saved automatically, with T (indicates text format) and the date and No. used as the directory name. In this case, the only measurement data that can be saved to PC card in text format is time series data and event list data. Event list data and flicker data are saved manually regardless of the TEXT save options. Text Time-sequence Data-header Composition (page 219) V10 Flicker Text Time-sequence Data-header Composition (page 222) IEC Flicker Text Time-sequence Data-header Composition (page 222) Text Voltage Fluctuation Event Data Format Composition (page 222) Text Event Data-format Composition (page 223)
155 Using a PC Card The following table lists the items saved by settings (ON) made on the [Text Select] screen. Item RMS fluctuation graph Voltage fluctuation graph Normal Item Freq Frequency Urms RMS voltage value RMS voltage value (Voltage fluctuation) Upk Voltage waveform peak Irms RMS current value Ipk Current waveform peak Uave Average RMS voltage value Iave Average RMS current value Power Item P Active power S Apparent power Q Reactive power PF Power factor/displacement power factor KF K factor Uunb Voltage unbalance factor Iunb Current unbalance factor UTHD Total harmonic voltage distortion factor ITHD Total harmonic current distortion factor Harmonics U Harmonic voltage I Harmonic current P Harmonic power angl Harmonic voltage-current phase difference iu Inter-harmonic voltage ii Inter-harmonic current iuth Total Inter-harmonic voltage distortion factor iith Total Inter-harmonic current distortion factor
![150 9.2 Using a PC Card Manual saving of the measured data files 3 (Text format: event waveform data) LIST You can save files when the operation status is [ANALYZING]. Select No.](/docs-images/72/66681917/images/156-1.jpg "WaveTextSave To save multiple event waveforms, select a number (No.) and repeat the process. Waveforms that can be saved differ depending on the connection method setting. (Wiring method) 1P2W.")
156 Using a PC Card Manual saving of the measured data files 3 (Text format: event waveform data) LIST You can save files when the operation status is [ANALYZING]. Select No. WaveTextSave To save multiple event waveforms, select a number (No.) and repeat the process. Waveforms that can be saved differ depending on the connection method setting. (Wiring method) 1P2W... U1, I1 1P3W... U1, U2, I1, I2 3P3W2M... U1, U2, I1, I2 3P3W3M... U1 to U3, I1 to I3 3P4W... U1 to U3, I1 to I3 4ch:AC/DC... U4, I4 Text Event Waveform Data Format Composition (page 222) Transient waveform data cannot be saved in text format. Measured data files Auto-save (binary format) settings RECORDING Measured data files are automatically saved to the PC card with the internal memory. Interval Auto save Select from pulldown menu 1. Set the interval. (page 84) 1, 3, 15, or 30 sec, 1, 5, 10, or 30 min, 1/2 hour 2. Set the auto-save format. BINARY Measured data files are saved automatically during recording. While auto-save is in progress, do not remove the PC card from the In binary format, all measurement data of the 3196 can be saved to a PC card.
157 When the memory is full When the memory is full: STOP Internal memory Measurement starts Internal memory capacity Recorded data Measurement forcibly ends 9.2 Using a PC Card 151 PC card Recorded data PC card capacity When the memory is full: LOOP Measurement starts Old data is deleted Internal memory Current time Internal memory capacity Recorded data Measurement stops Measurement is stopped forcibly after one month of measurement. PC card Recorded data Settings when the memory is full (page 83) When the PC card memory becomes full, recording to the PC card stops.
 1, 3, 15, or 30 sec, 1, 5, 10, or 30 min, 1/2 hour 2. Set the auto-save format. TEXT SELECT Select the item to be saved.")

158 Using a PC Card Auto-save measured data file (text format) settings RECORDING Measured data files are saved to the PC card with the internal memory automatically. Interval Auto Save Select from pulldown menu 1. Set the interval. (page 84) 1, 3, 15, or 30 sec, 1, 5, 10, or 30 min, 1/2 hour 2. Set the auto-save format. TEXT SELECT Select the item to be saved. OFF ON Select the item to be saved. The item currently selected appears to the right of the auto-save settings. OFF: Not selected as an item to be saved as text. ON: Selected as an item to be saved as text. RETURN Files are saved automatically when the internal operation status becomes [RECORDING]. Measured data files are saved automatically during recording. While auto-save is in progress, do not remove the PC card from the In this case, the only measurement data that can be saved to PC card in text format is time series data, event list data, flicker data, and voltage fluctuation event data. Event list data, flicker data, and voltage fluctuation event data are automatically saved as text, regardless of the TEXT save options. Settings selected in the text save options also apply when manually saving text data. Manual saving of the measured data files 2 (Text format: timeseries/ event list/ flicker data) (page 148)
159 9.2 Using a PC Card 153 Screen hard copies (auto-copy) HARDWARE Measured data files are saved to the PC card with the internal memory automatically. RS-232C Auto Copy Select from pulldown menu 1. Set the RS connection point. OFF or MODEM 2. Set to AUTO copy. ON 3. Set the interval. 1 min, 5 min, 10 min, 30 min, 1 hour, 2 hour Files are automatically copied to the PC card when the internal operation status becomes [RECORDING]. Display the screen that you want to hard copy. Screen hard copy (manual copy) Display the screen that you want to hard copy. You can copy screens as BMP files to the PC card manually. The RS connection point settings are the same as for auto-copy. Saves the displayed screen when pressed. In addition to being able to save screen images to the PC card, hard copies allow you to output them to a printer. When the RS connection point is set to PRINTER, a hard copy of the screen image is sent to the printer. For other settings, the hard copy of the screen image is sent to the PC card.
160 Using a PC Card


161 10.1 Setting the Printer 155 Using a Printer Chapter 10 Using the device s RS-232C interface, you can create hard copies of the 3196 screen with the 9670 PRINTER. For details about the printer and printer connection methods, Refer to the Quick Start Guide Setting the Printer Setting the RS-232C connection point on the printer HARDWARE RS-232C (RS connection point) Select from pulldown menu Confirm 9670 PRINTER is set automatically Set Printer 1. Set the connection point to PRINTER. PRINTER 2. Set the appropriate baud rate bps (slow printing), bps (mid-speed printing), bps (fast printing) When this is set to PRINTER, left of the screen. lights on the upper The baud rate and language set on this device as well as the auto-power off function (OFF) are set automatically in the 9670 PRINTER. After the printer is set automatically, turn off the printer and turn it on again before using it.


162 Printing Hard Copies 10.2 Printing Hard Copies The two methods to create screen hard copies with the printer are to output them automatically at each set interval or to output them manually by pressing the HARD COPY key. Printing screen images automatically HARDWARE Auto Copy Select from pulldown menu Confirm 1. Turn on the AUTO copy function. ON 2. Set the output interval. 1 min, 5 min, 10 min, 30 min, 1 hour, 2 hour 3. Set the connection point to PRINTER. Display the screen that you want to hard copy. Screen images are output automatically when the internal operation status becomes [RECORDING]. Printing screen images manually Display the screen that you want to hard copy. Set the RS connection point to PRINTER. Prints the displayed screen when pressed. In addition to being able to print screen images, hard copy allows you to save screen images to the PC card. When the RS connection point is set to PRINTER, a hard copy of the screen image is output by the printer. (When screen images can be output to the printer, lights on the upper left of the screen.) For all other settings, the screen image is saved to the PC card.
163 157 Using the PC Chapter 11 This device is equipped with an RS-232C and a LAN interface. This section describes how to use the device with a personal computer (hereafter, PC) and a modem. You can use the HTTP server function *1 installed on this device or Down96 (CD-R) with all the connection methods outlined above. Connecting the 3196 to a modem using the RS-232C cable and controlling/observing the 3196 from a PC connected to the 1 modem 3196 RS-232C Straight cable Modem Public circuit Modem RS-232C Straight cable 11.1 "Remote Control and Monitoring Using an RS-232C Interface" (page 158) 2 Connecting the 3196 to a hub using a LAN cable and controlling/ observing the 3196 from a PC Base-T Straight cable Hub LAN Hub 10Base-T Straight cable 11.2 "Control and Monitoring Using a LAN Interface" (page 165) 3 Connecting the 3196 to a PC with a LAN cable and controlling/observing the Base-T Cross cable 11.2 "Control and Monitoring Using a LAN Interface" (page 165) *1:The HTTP server function allows you to use any Internet browser, such as Internet Explorer, without having to install dedicated software on the PC to make settings for the 3196, acquire data, or observe screens. HTTP Server Function (page 172) *2: The Down96 download application software downloads data files stored in internal memory of the main unit or on the PC card to a PC. For details, see the Down96 Instruction manual (CD-R version) Both the RS-232C and LAN interfaces use TCP/IP. The connection protocol to use TCP/IP with an RS-232C interface is PPP (Point-to-Point Protocol). Note that you cannot use programs such as Visual Basic to send commands or receive data on the PC. Windows, MS-Excel, MS-Word are either registered trademarks of Microsoft Corporation in the United States and other countries.
164 Remote Control and Monitoring Using an RS-232C Interface 11.1 Remote Control and Monitoring Using an RS-232C Interface 1 The instrument can be connected by RS-232C cable to a modem for remote control and monitoring from a PC at another location using a public circuit or cellular phone. When the modem is directly connected to a public circuit: (example) 3196 RS-232C Straight cable Modem When the modem is connected to a cellular phone: (example) 3196 RS-232C Straight cable Modem Public circuit Cellular phone Connection Cable Modem RS-232C Straight cable PC card Procedure 1. Connect the instrument to the modem using an RS-232C cable (straigh cable). Connecting method: Refer to the Quick Start Manual "Connecting a Modem" (page 159) 2. Make connection point settings on the "Setting the 3196" (page 160) 3. Make 3196 settings using the PC "Setting the PC" (page 161) The settings of the modem connected to this device are made automatically by the After reading the user's guide of the PC and modem, set the modem connected to the PC. Make the same connection and settings even when using the HTTP server function or Down96 download application software.
165 11.1 Remote Control and Monitoring Using an RS-232C Interface Connecting a Modem Connecting method: Refer to the Quick Start Manual. When the modem is directly connected to a public circuit: Prepare the following: Modem for this instrument RS-232C cable A computer modem capable of speeds of 28.8 kbps or more is recommended. A modem that connects to an RS-232C terminal (modems that connect to a USB port or PC card slot cannot be used). Operationally confirmed model: DFML-560E, made by I-O Data Note: Models that do not have an E appended to the end of their model number use a USB connection, and cannot be used. Straight cable (supplied with the modem) Modem for the PC Any modem that can be used with the PC you are using. If your PC supports USB connections: USB connection-type modem If your PC does not support USB connection: RS-232C connection-type modem Notebook computer: PC card-type modem Make sure that a phone line is available both at the place where you set up the 3196 and near your PC. When the modem is connected to a cellular phone: Prepare the following: Modem for connecting a cellular phone to the Instrument Mobile communications adapter Model certified for use: TD-PHSAD, made by Telecom Electronics RS-232C cable Cable for connecting a cellular phone to the modem Modem for the PC Straight cable (supplied with the mobile communications adapter) PHS cellular cable (when using a PHS cellular phone) PDC cable (when using a cellular phone) (these cables are supplied with the mobile communications adapter) Any modem that can be used with the PC you are using. Model certified for use with a PC card when connecting the cellular phone to your PC: PCMA-9664P2, made by I-O Data Further, to avoid using up the remaining battery life for your cellular phone during use, make sure you use the optional charger or AC adapter for the cellular phone you are using. When using the remote control application of the HTTP server function, it is recommended that you connect a PHS cellular phone with a fast communication speed to your PC instead of connecting a regular cellular phone.

166 Remote Control and Monitoring Using an RS-232C Interface Setting the 3196 Configuring connection on the instrument Connection point Baud rate Communication monitoring time HARDWARE RS-232C Select from pulldown menu Confirm Cancel 1. Set the connection point. MODEM When the connection point is set to MODEM, lights on the upper left of the screen. 2. Set the baud rate bps and so on 3. Set the communication monitoring time that applies to modem connection. The analyzer is automatically disconnected after the selected amount of time (OFF, 1 min, 5 min, 10 min, or 30 min) elapses without communication. Except for the baud rate, all RS-232C settings are set as follows. Transfer method: Asynchronous communication method Data length: 8 bits Parity check: None (OFF) Stop bit: 1 Flow control: None Delimiter (sender, receiver): CR+ LF As an example, assume the IP address is to be set to , and the subnet mask is to be set to TCP/IP settings on the computer (page 163) After you have finished making the instrument settings, turn on the modem s power.

![Double-click [Dial-Up Networking] in [My Computer], and open [Make New Connection]. 2 Set the dial-up connection point. 1.](/docs-images/72/66681917/images/167-2.jpg "Type a name (example: [3196]) in the connection name entry box. 2. For the modem setting, select the modem that is to be used.")
![* If you cannot select the modem here, install the modem beforehand. 3. Press the [Configure...] button. The Properties screen opens.](/docs-images/72/66681917/images/167-3.jpg "4. Check that the communications port is the same port that the modem is connected to. 5.")
167 11.1 Remote Control and Monitoring Using an RS-232C Interface Setting the PC Example Computer OS Windows 98 Modem When using the DFML-560E made by I-O Data Dial-up settings 1 Open [Dial-Up Networking]. Double-click [Dial-Up Networking] in [My Computer], and open [Make New Connection]. 2 Set the dial-up connection point. 1. Type a name (example: [3196]) in the connection name entry box. 2. For the modem setting, select the modem that is to be used. * If you cannot select the modem here, install the modem beforehand. 3. Press the [Configure...] button. The Properties screen opens. 4. Check that the communications port is the same port that the modem is connected to. 5. Select [115200] bps (normal) as the maximum speed. 6. Check that the setting is correct, and click the [Connection] tab.
![162 11.1 Remote Control and Monitoring Using an RS-232C Interface 7. Set the [Connection preferences] as shown on the left.](/docs-images/72/66681917/images/168-1.jpg "* Normally, do not change [Call preferences] from the default setting.")
![If you are having trouble connecting using an internal line, remove the [Wait for dial tone before dialing] checkmark and try again. 8.](/docs-images/72/66681917/images/168-2.jpg "Confirm that the settings are correct and press the [OK] button, then press the [Next] button in the original dialog box. 9.")
![Type the telephone number that the instrument is connected to. 10. After you have entered the number, press the [Next] button.](/docs-images/72/66681917/images/168-4.jpg "To complete Dial-Up Networking settings, press the [Finish] button on the final confirmation screen. 3 Set the connection properties.")
168 Remote Control and Monitoring Using an RS-232C Interface 7. Set the [Connection preferences] as shown on the left. * Normally, do not change [Call preferences] from the default setting. If you are having trouble connecting using an internal line, remove the [Wait for dial tone before dialing] checkmark and try again. 8. Confirm that the settings are correct and press the [OK] button, then press the [Next] button in the original dialog box. 9. Type the telephone number that the instrument is connected to. 10. After you have entered the number, press the [Next] button. To complete Dial-Up Networking settings, press the [Finish] button on the final confirmation screen. 3 Set the connection properties. A "3196" connection icon is created. Right-click the [3196] icon, or select [Properties] from the [File] menu. A dialog box like the one in the diagram opens. Confirm the telephone number for the 3196.
![11.1 Remote Control and Monitoring Using an RS-232C Interface 163 11. Select the [Server Types] tab, and make settings as shown in the diagram. Select [TCP/IP] only. 12. Press the [TCP/IP Settings.](/docs-images/72/66681917/images/169-1.jpg "..] button. * Leave options on other sheets set to their default settings. 13. Once the [TCP/IP Settings] dialog box opens, make settings as shown in the diagram.")
![* In [IP address], be careful not to set the same IP address as that set for the 3196. For example, if you find that the setting on the computer is 192.168.0.](/docs-images/72/66681917/images/169-2.jpg "2, then you could set the address on the instrument to something like 192.168.0.1. 14. After you have finished making the settings, press the [OK] button.")
169 11.1 Remote Control and Monitoring Using an RS-232C Interface Select the [Server Types] tab, and make settings as shown in the diagram. Select [TCP/IP] only. 12. Press the [TCP/IP Settings...] button. * Leave options on other sheets set to their default settings. 13. Once the [TCP/IP Settings] dialog box opens, make settings as shown in the diagram. * In [IP address], be careful not to set the same IP address as that set for the For example, if you find that the setting on the computer is , then you could set the address on the instrument to something like After you have finished making the settings, press the [OK] button. * If you are having trouble making the connection, remove the [Use IP header compression] checkmark, and try again.
![164 11.1 Remote Control and Monitoring Using an RS-232C Interface Connection to the instrument 1. Double-click the [3196] icon. 2.](/docs-images/72/66681917/images/170-3.jpg "Type [3196] in the user name entry box, and [PASSWD] in the password entry box. 3. Check whether the telephone number for the instrument is correct, and press the [Connect] button.")
170 Remote Control and Monitoring Using an RS-232C Interface Connection to the instrument 1. Double-click the [3196] icon. 2. Type [3196] in the user name entry box, and [PASSWD] in the password entry box. 3. Check whether the telephone number for the instrument is correct, and press the [Connect] button. The [Connecting to 3196] dialog box opens. 4. Start up Internet Explorer, and enter the IP address that you set for the instrument (such as in the address column, then press the Enter key. When a normal connection is established, the Main page for the instrument s HTTP server function opens. Configure Internet Explorer so that it does not use a proxy server. (You can configure the [Use proxy server] option by clicking [Internet Options] on Internet Explorer s [Tools] menu, then clicking the [Connections] tab.
171 11.2 Control and Monitoring Using a LAN Interface Control and Monitoring Using a LAN Interface 2 Connecting the 3196 to a hub using a LAN cable and controlling/ observing the 3196 from a PC Base-T Straight cable Hub LAN Hub 10Base-T Straight cable 3 Connecting the 3196 to a PC with a LAN cable and controlling/observing the Base-T Cross cable Procedure 1. Connect the instrument to a hub or computer with a LAN cable. When connecting to a hub: 10BASE-T terminal, straight cable When connecting to a computer: 10BASE-T terminal, cross cable Connecting method: Refer to the Quick Start Manual "Connecting the 3196" (page 166) 2. Make connection point settings on the "Setting the 3196" (page 166) 3. Make 3196 settings using the PC Host name... (up to 12 characters) IP address... (***.***.***.***) ***:3 characters Subnet mask... (***.***.***.***) ***:3 characters Default gateway...on or OFF Gateway... (***.***.***.***)***:3 characters "Setting the PC" (page 170) Make the same connection and settings even when using the HTTP server function or Down96 download application software.

172 Control and Monitoring Using a LAN Interface Connecting the 3196 Connecting method: Refer to the Quick Start Manual. When connecting the instrument and computer through a hub: Prepare the following: Hub 10BASE-T cable A commercially sold hub. Straight cable (9642 LAN cable, you cannot use the supplied cross conversion cable) When connecting the instrument and computer directly: Prepare the following: 10BASE-T cable Cross cable (9642 LAN cable, using the supplied cross conversion cable) Setting the 3196 Configure connection on the instrument. HARDWARE RS-232C IP Address Select from pulldown menu Confirm Cancel Net Mask MAC Address 1. Set the connection point. OFF or PRINTER 2. Set the IP address. ***.***.*** 3. Set the subnet mask. ***.***.*** When the connection point is set to OFF or PRINTER, lights on the upper left of the screen. Example: How to Set the Instrument s IP Address and Subnet Mask When the computer s IP address and subnet mask are as follows: IP address: Subnet mask: IP address of the 3196: Set the last numerical value only in the computer s IP address to a different number. Subnet mask of the 3196: Set to the same value as the computer s subnet mask.
173 11.2 Control and Monitoring Using a LAN Interface 167 The number displayed to the right of the Net Mask is the MAC Address. This is the same as on the MAC Address label on the back panel. When you set the printer as the RS connection point, you can use the printer and LAN simultaneously. When you set the modem as the connection point, you cannot use the LAN. When communicating with this device and a PC through a LAN, make the proper network settings on this device. When connecting to an existing LAN network, consult your system administrator. This device does not support DHCP (an IP address automatic acquisition function). About the settings IP address Network mask The TCP/IP used for LAN communications with this device uses an IP address to differentiate each device. With IP version 4 (IPv4), widely used at present, IP addresses consist of 32-bit numbers. Normally, decimal notation is used to express each octet (8 bits) of the IP address, such as in , and this expression is joined with a period(.). IP addresses can be divided in 2: the network portion, expressing the network position where devices are connected; and the host portion that identifies devices on the network. The net mask is used to indicate the ranges of the network and host portions. The net mask expresses the bit corresponding to the network portion as 1, and the bit corresponding to the host portion as 0. (Example: When the network is assigned to the first 24 bits and the host is assigned to the remaining 8 bits: Normally, the IP address is expressed as a hexadecimal number (0xffffff00) or as a decimal number ( ). Also, the length (number of bits) of the network portion can be expressed as /24. In this case, the 24 that follows the / indicates that the network portion is 24 bits. Subnet mask Except in an extremely limited number of cases, when constructing a network within an organization, the network is usually divided in several smaller networks. In this case, each division of the IP network is referred to as a subnetwork. When the network is divided into subnetworks, the host portion of the IP address is assigned to the subnetwork and the host, and you can use the net mask to delimit the subnetwork and host portions. In this case, the net mask is referred to as a subnet mask.
174 Control and Monitoring Using a LAN Interface IP address assignment Because each device must have a unique address, IP addresses are monitored by the RIR (Regional Internet Registry). Usually, an ISP (internet service provider) is entrusted with the assignment of IP addresses to businesses, alleviating users of that ISP from any problems. Otherwise, certain IP addresses can be used freely within a distinct, closed network, as defined by RFC1597, as follows: / to / to / to When using a cross cable to communicate on a locally between the PC and this unit, or to communicate through a closed IP network, select one of the addresses above. However, addresses where the host portion bits are all 0 are used as network addresses only to identify the network itself. Addresses where the host portion bits are all 1 cannot be used as IP addresses because they indicate all the hosts that exist on the network. (Example: For an IP network that has a network address ( / 24): The address indicates all the devices that are connected to /24. Because 254 IP addresses ( to , except and ) can be used on this network, up to 254 devices can be connected to the network. Gateway Host name The gateway is a device that connects different networks. On an IP network, devices that connect different IP networks use a common router. You must specify the router s IP address as the gateway address. In the 3196, there is no gateway setting. With TCP/IP, individual devices are differentiated by their IP addresses. However, IP addresses are hard to understand and difficult to remember. Unlike IP addresses, a text string host name is assigned and this is used instead of the IP address. The IP address and host name are changed depending on the DNS (Domain Name Server). In the 3196, there is no host name setting.
175 11.2 Control and Monitoring Using a LAN Interface 169 Example of a network environment structure Example 1: Connecting the 3196 to an existing network When you connect the 3196 to an existing network, the system administrator must make the settings beforehand. Make sure that the settings are unique to this device. Note the following settings assigned by your system administrator. IP address Subnet mask Example 2: Connecting several 3196 units to a single PC through a hub When assembling a isolated local network, it is recommended that you use private IP addresses. When assembling the network with the network address /24: IP address... PC: This device: Add in the following order: , , , and so on. Subnet mask Example 3: Connecting the 3196 locally to a PC using the 9642 LAN CABLE When connecting the 3196 locally to a PC using the connector supplied with the 9642 LAN CABLE, you can set the desired IP address, but we recommend that you use a private IP address. IP address... PC: This device: (Set the IP address to a different value.) Subnet mask

. 1.")
176 Control and Monitoring Using a LAN Interface Setting the PC Example Computer OS Windows 98 When connecting the instrument and computer directly: Confirm the properties for Internet protocol (TCP/IP). 1. Move the cursor over [Network Neighborhood] and right-click the mouse to open the local area connection properties. 2. Select [TCP/IP], and press the [Properties] button.
![11.2 Control and Monitoring Using a LAN Interface 171 3. Confirm the IP address and subnet mask for the computer you are using. Do not check the [Obtain an IP address automatically] option.](/docs-images/72/66681917/images/177-1.jpg "To set the instrument s IP address, change the final numerical value only for the computer s IP address. To set the instrument s subnet mask, set the same value as the computer s subnet mask.")
177 11.2 Control and Monitoring Using a LAN Interface Confirm the IP address and subnet mask for the computer you are using. Do not check the [Obtain an IP address automatically] option. To set the instrument s IP address, change the final numerical value only for the computer s IP address. To set the instrument s subnet mask, set the same value as the computer s subnet mask. Example: PC IP address: Subnet mask: IP address: Subnet mask: Connection to the instrument Start up Internet Explorer, and enter the IP address that you set for the instrument (such as in the address column, then press the Enter key. When a normal connection is established, the Main page for the instrument s HTTP server function opens. Configuration of Internet Explorer: Deselect the [Use proxy server] option. Configure Internet Explorer so that it does not use a proxy server by clicking [Internet Options] on Internet Explorer s [Tools] menu, then clicking the [Connections] tab. If connection fails: Check the following items. Verify that you are using a straight LAN cable. If you are using a straight LAN cable, the computer s LINK LED lights. Verify that you set the IP address and subnet mask. Verify that the instrument s RS connection point is the modem. Verify that you are receiving a normal response from the ping command on the computer s DOS prompt screen. Verify that the checkmark is removed from the Internet browser proxy setting.
178 HTTP Server Function 11.3 HTTP Server Function Overview The HTTP server function allows you to use any Internet browser, such as Internet Explorer, without having to install dedicated software on the PC to make settings for the 3196, acquire data, or observe screens. You can use the following functions. However, functions other than the remote control application function are supported by version 1.02 or later of this instrument. Remote control application Event list System settings Starting and finishing measurement Displays the screen currently displayed on the 3196 in the Internet browser. You can enter the keys so that they are in the same position as the keys on the You can select from a black and white or color display, and select the screen update rate. Displays the event list stored in this device s internal memory on the Internet browser. By selecting an event, you can display the details, waveform, vector, and harmonic bar graph for the time that event occurred. You can also convert the voltage and current waveforms for the time the event occurred directly into text, and edit the data in MS-Excel. When using Internet Explorer as the Internet browser, you can edit the data in MS-Word and use it to create a report. You can make all of the settings for the instrument s [SYSTEM] screen using an Internet browser. You can control the start and finish of measurement using the Internet browser. Internet Explorer Version 4 or later is supported. You can also use Netscape Navigator, but some screens may not operate correctly.
 in the address column, then press the Enter key. When a normal connection is established, the Main page for the instrument s HTTP server function opens.")


![When the remote control application starts, [MONO] (displays keys only) is set as the default, but you should change this to [COLOR] before using the application.](/docs-images/72/66681917/images/179-4.jpg "Event List Screen The screen displays a list of the events currently recorded in this device s internal memory.")
179 HTTP Server Function Setting the HTTP Server Function Main Page Start up Internet Explorer, and enter the IP address that you set for the instrument (example: in the address column, then press the Enter key. When a normal connection is established, the Main page for the instrument s HTTP server function opens. To shift between the various screens, click the mouse as you would on a normal homepage. Remote Control Application Screen The screen displayed on the Internet browser is the same as the screen displayed on the instrument with the same key placement as the front panel. You can control the operation of the instrument by clicking each key. Select [MONO/COLOR], then select a screen update rate from OFF, 2 sec, 10 sec, and 1 min. When the remote control application starts, [MONO] (displays keys only) is set as the default, but you should change this to [COLOR] before using the application. Event List Screen The screen displays a list of the events currently recorded in this device s internal memory. Click an event category to display the event details screen (detailed information for the time the event occurred). On the event list screen, you can select a display update interval (STOP RENEWAL, 5 SEC, 10 SEC, 30 SEC, 1 MIN, 15 MIN, 30 MIN, or 1H).


180 HTTP Server Function Event Detailed Screen Just like the instrument, this screen displays a list of representational event categories and simultaneously occurring events. You can also display waveforms, vectors, and harmonics for event occurrence by selecting a graph. The Internet browser displays the same screen as the instrument s analysis screen when an event occurrence is moved from the event list screen using the ENTER key. Event Waveform Screen You can select the voltage, current, and waveform scales. When a transient occurs, the transient waveform is displayed. If multiple transients occur simultaneously, a link is displayed, and you can display the next waveform by following the link. If you click on the waveform display area in the event waveform screen, text data is sent from the instrument. MS-Excel starts automatically, and you can create graphs using the text data for the voltage or current waveform that you clicked. Event Vector Screen The graph s Y-axis is set to LOG. You can select the numeric display.


181 Event Harmonic Bar Graph Screen 11.3 HTTP Server Function 175 You can select the display channel, numeric display, and order number. Creating Reports You can select the display channel, numeric display, and order number. When using Internet Explorer as the Internet browser in the event details screen, you can create reports using MS-Word. When the Internet Explorer HTML editor is set to Word: Displays the HTTP server function s event list screen. Select [Edit with Microsoft Word for Windows] from the [File] menu or toolbar. MS-Word starts, and the data displayed in Internet Explorer is pasted into MS-Word. You can edit the data in MS-Word, and use it to create an event report. Note: MS-Word 97 or later must be installed on your computer. To set the Internet Explorer HTML editor to Word: Select [Internet Options] on Internet Explorer s [Tools] menu. On the [Programs] tab in the window that opened, select [Microsoft Word for Windows] in [HTML editor].
![176 11.3 HTTP Server Function System Setting Screen Options can be selected in [SYSTEM] [MAIN].](/docs-images/72/66681917/images/182-1.jpg "The event settings can be made. However, interface settings, text save option selections, and event settings cannot be made.")

182 HTTP Server Function System Setting Screen Options can be selected in [SYSTEM] [MAIN]. The event settings can be made. However, interface settings, text save option selections, and event settings cannot be made. Click setting items on the left side of the screen to display them on the right. Start and finish measurement screen This screen allows you to start and stop measurement, and execute the data reset control for the instrument. You can also display the current measurement status.
183 12.1 Product Specifications 177 SpecificationsChapter Product Specifications The specifications below apply to the 3196 POWER QUALITY ANALYZER. For the product specifications of the EN50160, see the Instruction Manual for EN Environmental and Safety Specifications Operating environment Storage temperature and humidity Operating temperature and humidity Maximum rated working voltage Maximum rated voltage to earth Dielectric strength (50 Hz for 1 min.) Indoors, altitude up to 2000 m (6562-ft.) -20 C to 50 C (-4 F to 122 F), 80% RH or less (no condensation) 0 C to 40 C (32 F to 104 F), 80% RH or less (non-condensating) In the temperature range -10 C to 0 C(14 F to 32 F), battery pack and PC card use are not supported. The LCD and accuracy are also not guaranteed. Voltage inputs: 780 Vrms, 1103 V peak value Current inputs: 1.7 Vrms, 2.4 V peak value Voltage input terminals: 600 Vrms(50/60 Hz) 5.55 kvrms for one minute (current sensitivity 1 ma) Between voltage and clamp input terminals, between voltage input terminals and instrument case, between voltage input terminals U1 to U3 and U4 Enclosure protection IP30(per EN60529) Applicable Standards Safety EN :1993+A2:1995 Voltage Input: Pollution Degree 2, Overvoltage Category III (anticipated transient overvoltage 6000V) EMC EN :1997+A1:1998 CLASS A EN :1995+A1:1998+A2:1998 EN :1995
184 Product Specifications Input Specifications Measurement line type Input channels Input methods Input resistance (50/60 Hz) Measurement method PLL synch channel source PLL synch frequency range Sampling frequency A/D converter resolution Compatible clamp sensors One single-phase 2-wire (1P2W), single-phase 3-wire (1P3W), three-phase 3-wire (3P3W2M,3P3W3M) or three-phase 4-wire (3P4W) plus one extra input channel Voltage: Four channels U1 to U4 (extra channel U4 can measure AC or DC) Current: Four channels I1 to I4 Voltage: Isolated inputs and differential operation Between U1,U2 and U3: these channels are not isolated from one another Between U1 to U3 and U4: channel U4 is isolated Current: input is isolated by the clamp-on sensor (voltage input) Voltage: 4 MΩ ±10% (differential input) Current: 200 kω ±10% Simultaneous digital sampling of voltage and current PLL synchronization (during instantaneous low period of PLL synchronization source, switches to a fixed clock, with no sampling gap during switching) One of voltages U1, U2 or U Hz to 69 Hz For calculations (including DC measurements): 256 per cycle For harmonic and inter-harmonic analysis: 2048 per 10 cycles (50Hz) 2048 per 12 cycles (60Hz) For transient overvoltage (impulse): 2 MHz For calculations (including DC measurements): 16 bits For transient overvoltage (impulse): 12 bits 0.5 Vrms output or more for full-scale current (0.5 Vrms recommended) Output-to-input ratios of 0.1, 1, 10 or 100 mv/a Basic Specifications Backup lithium battery life Clock functions Real-time clock accuracy Internal memory data capacity Maximum recording period Lithium battery to back up clock and settings, approx. 10 years (reference at 23 C, 73 F) Auto calendar, auto leap year, 24-hour clock ±0.3 s/day or better (instrument on), ±3 s/day or better (instrument off) 13 MB 1 month (when using internal memory) Maximum recordable events 100 events (when using the internal memory) (when using the PC card, up to 1000 events) External control terminals External event input, external event output Power supply 9458 AC ADAPTER (SINO-AMERICAN SA V) (12 VDC ±5%, 4.5 A) Rated voltage: 100 to 240 VAC (a change in voltage of ±10% taken into consideration), 50/60 Hz, maximum rated current: 1.2 A 9459 BATTERY PACK(Sanyo 6HR-AU Ni-MH) for backup during power off Recharge function Maximum rated power Using the 9458 AC ADAPTER or 9459 BATTERY PACK to recharge while the 3196 is operating. 40 VA
185 Product Specifications Basic Specifications Continuous battery operation time Dimensions Mass Power quality conforming standard Approx. 30 minutes with the 9459 BATTERY PACK (fully charged, 23 C, 73 F) Approx. 298W x 215H x 67D mm (not including protrusions) (11.73"W x 8.46"H x 2.64"D) Approx. 2.0 kg (70.5 oz) (without the battery pack), (mass of battery pack: approx. 250 g (8.8 oz)) IEEE1159 Display Specifications Display language Display device Dot pitch English, German, French, Italian, Spanish or Japanese 6.4-inch TFT color LCD ( pixels) (V) mm (H) mm (0.01"V 0.01"H) External Interface Specifications PC Card Interface Slot Supported cards Supported storage capacity Data format Recording contents TYPE II conforming to the PCMCIA/JEIDA PC Card Standard x 1 base Flash ATA cards (at least 13 MB) 528 MB MS-DOS Setting files, binary, text and screen image data RS-232C Interface Compliant standards Connector Connection devices Communication protocols Print function RS-232C EIA RS-232C, CCITT V.24, JIS X5101 One 9-pin D-sub Printer or modem PPP or TCP/IP (modem only) Hard copy LAN Interface Connector 10Base-T, RJ-45 connector x 1 Communication protocols Ethernet, TCP/IP
186 Product Specifications Accessories and Options Accessories Options VOLTAGE CORD 1 set: 8 cords (red, yellow, blue, and gray (one each), and 4 black cords) 9458 AC ADAPTER...1 (The power cord can be selected in country specifications.) 9459 BATTERY PACK (NiMH, 7.2 V/2700 mah) Strap...1 Quick Start Manual...1 (booklet) Instruction Manual for EN (booklet) CD-R...1 disc (Instruction Manual, Instruction Manual for EN50160, Down96 Download application software) LAN connector cover...1 Input cord label CLAMP ON SENSOR (500 A rms rating) voltage output type 9660 CLAMP ON SENSOR (100 A rms rating) voltage output type 9667 FLEXIBLE CLAMP ON SENSOR (500 A rms, 5000 A rms rating) voltage output type 9669 CLAMP ON SENSOR (1000 A rms rating) voltage output type 9694 CLAMP ON SENSOR (5 A rms rating) voltage output type 9290 CLAMP ON ADAPTER 9458 AC ADAPTER 9459 BATTERY PACK 9670 PRINTER (BL-80RS II made by SANEI ELECTRIC INC. ) 9671 AC ADAPTER (for the 9670) (BL-100W made by SANEI ELECTRIC INC. ) 9638 RS-232C CABLE (for the printer) 9237 RECORDING PAPER (80 mm x 25 m, 4 rolls) 9624 PQA-HiVIEW (PC application software) 9339 CARRYING CASE (soft type, storage room for the voltage cord and clamp-on sensor) 9340 CARRYING CASE (hard type, storage room for the voltage cord and clamp-on sensor) WIRING ADAPTER (for three-phase 3-wire (3P3W3M) voltage) WIRING ADAPTER (for three-phase 4-wire voltage) 9626 PC CARD 32M (32MB compact flash card + adapter) 9627 PC CARD 64M (64MB compact flash card + adapter) 9726 PC CARD 128M (128MB compact flash card + adapter) 9727 PC CARD 256M (256MB compact flash card + adapter) 9728 PC CARD 512M (512MB compact flash card + adapter) 9642 LAN CABLE
187 12.2 Measurement Specifications Measurement Specifications Measurements Items detected at 2 MHz sampling without a gap Item Variable 1P2W Transient overvoltage (impulse) 1P3W/ 3P3W2M 3P3W3M 3P4W MAX/MIN/AVE Utran 1,4 1, 2, 4 1, 2, 3, 4 1, 2, 3, 4 Items measured in half waves (calculates one waveform overlapped by half a wave) without gaps Item Variable 1P2W 1P3W/ 3P3W2M Voltage swell Uswell 1 1, 2 1, 2, 3 1, 2, 3 Voltage dip (sag) Udip 1 1, 2 1, 2, 3 1, 2, 3 Voltage instantaneous interruption RMS voltage value (one wave shifted over half a wave) UInterruption 1 1, 2 1, 2, 3 1, 2, 3 U 1 1, 2 1, 2, 3 1, 2, 3 Voltage fluctuation U 1 1, 2 1, 2, 3 1, 2, 3 Instantaneous flicker S(t) 1 1, 2 1, 2, 3 1, 2, 3 3P3W3M 3P4W MAX/MIN/AVE : Items measured every 200 ms (about once every 10 cycles at 50 Hz or every 12 cycles at 60 Hz) without a gap Item Variable 1P2W 1P3W/ 3P3W2M 3P3W3M 3P4W MAX/MIN/ AVE Voltage frequency Freq PLL source PLL source PLL source PLL source * Voltage waveform peak (±) Upeak 1,4 1, 2, 4 1, 2, 3, 4 1, 2, 3, 4 Current waveform peak (±) Ipeak 1,4 1, 2, 4 1, 2, 3, 4 1, 2, 3, 4 RMS voltage value Urms LINE- LINE/ PHASE-N 1,4 1, 2, 4, ave 1, 2, 3, 4, ave 1, 2, 3, 4, ave * RMS current value Irms 1,4 1, 2, 4, ave 1, 2, 3, 4, ave 1, 2, 3, 4, ave * Active power P 1 1, 2, sum 1, 2, 3, sum 1, 2, 3, sum * Apparent power S 1 1, 2, sum 1, 2, 3, sum 1, 2, 3, sum * Reactive power Q 1 1, 2, sum 1, 2, 3, sum 1, 2, 3, sum * Power factor/displacement power factor PF/DPF 1 1, 2, sum 1, 2, 3, sum 1, 2, 3, sum * Voltage unbalance factor Uunb - - sum sum * Current unbalance factor Iunb - - sum sum * Harmonic voltage (1st to 50th orders) Uharm RMS/% 1,4 1, 2, 4 1, 2, 3, 4 1, 2, 3, 4 * Harmonic current (1st to 50th orders) Harmonic power (1st to 50th orders) Inter-harmonic voltage (orders 0.5 to 49.5) Inter-harmonic current (orders 0.5 to 49.5) Harmonic voltage phase angle (1st to 50th orders) Iharm RMS/% 1,4 1, 2, 4 1, 2, 3, 4 1, 2, 3, 4 * Pharm RMS/% 1 1, 2, sum sum 1, 2, 3, sum * Uharm-i RMS/% 1,4 1, 2, 4 1, 2, 3, 4 1, 2, 3, 4 * Iharm-i RMS/% 1,4 1, 2, 4 1, 2, 3, 4 1, 2, 3, 4 * θuharm 1,4 1, 2, 4 1, 2, 3, 4 1, 2, 3, 4
188 Measurement Specifications Items measured every 200 ms (about once every 10 cycles at 50 Hz or every 12 cycles at 60 Hz) without a gap Item Variable 1P2W Harmonic current phase angle (1st to 50th orders) θiharm 1,4 1, 2, 4 1, 2, 3, 4 1, 2, 3, 4 Harmonic voltage-current phase difference (1st to 50th orders) θharm 1 1, 2, sum sum 1, 2, 3, sum * Total harmonic voltage distortion factor Uthd -F/-R 1,4 1, 2, 4 1, 2, 3, 4 1, 2, 3, 4 * Total harmonic current distortion factor Total inter-harmonic voltage distortion factor 1P3W/ 3P3W2M 3P3W3M 3P4W MAX/MIN/ AVE Ithd -F/-R 1,4 1, 2, 4 1, 2, 3, 4 1, 2, 3, 4 * Uthd-i -F/-R 1,4 1, 2, 4 1, 2, 3, 4 1, 2, 3, 4 * Total inter-harmonic current distortion factor Ithd-i -F/-R 1,4 1, 2, 4 1, 2, 3, 4 1, 2, 3, 4 * K factor KF 1,4 1, 2, 4 1, 2, 3, 4 1, 2, 3, 4 * Items measured in 1-minute intervals without a gap Item Variable 1P2W V10 flicker Select a channel to calculate 1P3W/ 3P3W2M 3P3W3M 3P4W MAX/MIN/ AVE V10 1 1, 2 1, 2, 3 1, 2, 3 Items measured in 10-minute intervals without a gap Item Variable 1P2W 1P3W/ 3P3W2M 3P3W3M 3P4W MAX/MIN/ AVE Short interval IEC voltage flicker Pst 1 1, 2 1, 2, 3 1, 2, 3 Items measured in 2-hour intervals without a gap Item Variable 1P2W 1P3W/ 3P3W2M 3P3W3M 3P4W MAX/MIN/ AVE Long interval IEC voltage flicker Plt 1 1, 2 1, 2, 3 1, 2, 3 *: Indicates that you can display the MAX, MIN, and AVE (all three) for the MAX/MIN/AVE interval. When CH4 is set to AC or DC, all of CH4 is displayed. (However, the 0 order of harmonics is not displayed.) When CH4 is off, CH4 is not displayed. (However, the waveform display is displayed.) U, U, or S(t) is measured, depending on which is selected. V10 or Pst/Plt is measured, depending on which is selected.
189 12.2 Measurement Specifications 183 Conditions of Guaranteed Accuracy Conditions of Guaranteed Accuracy Temperature and humidity for guaranteed accuracy Guaranteed accuracy period 6 months Fundamental waveform 42.5 to 69 Hz range for guaranteed accuracy Display area for guaranteed Effective measurement area accuracy Indicator After 30 min warm-up, however, when measuring AC voltage; sine-wave input, PF=1, synchronized PLL 23 C±5 C(73 F±9 F), 80% RH or less (applies to all specifications unless otherwise noted) Total display area 0.15 to 130% of selected range (RMS voltage value, RMS current value, effective power, apparent power, reactive power, power factor) Display is suppressed to zero when less than 0.15%. 0.3 to 130% of selected range (DC voltage) Display is suppressed to zero when less than 0.3%. 0 to 130% of selected range (measurement items other than the above) Effective measurement area 1 to 110% of selected range Miscellaneous Measurement Items (for all calculation items, there are no gaps of measurements) RMS Voltage Measurement method Display item True RMS type Measurement at 256 points per cycle about once every 10 cycles at 50 Hz or every 12 cycles at 60 Hz (approximately every 200 ms). RMS voltage value for each channel or AVE (average) RMS voltage value for multiple channels (For details, see the formula.(page 197)) Display conversion function Three-phase 3-wire (3P3W3M): (LINE-LINE, line-to-line voltage)-y (PHASE-N, phase-to-neutral voltage) conversion (The central point is calculated as the center.) Three-phase 4-wire: Y (phase-to-neutral voltage)- (line-to-line voltage)conversion Measurement range CH1 to 3: /300.00/ V rms CH4: /150.00/300.00/ V rms CH4 (for DC measurement): ±60.000/ V pk Range selection Manual range (Same operation switches the range for CH1 to 3.) DC measurement MEAN calculation Measurement accuracy AC: ±0.2% rdg. ±0.1% f.s. DC: ±0.3% rdg. ±0.4% f.s. Crest factor Less than 3 (for full-scale input) RMS Current Measurement method True RMS type Measurement at 256 points per cycle about once every 10 cycles at 50 Hz or every 12 cycles at 60 Hz (approximately every 200 ms).
190 184 RMS Current Item 12.2 Measurement Specifications The RMS current value for each channel or the AVE (average) RMS current value for multiple channels (For details, see the formula.(page 198)) Measurement range CH1 to 4 When using a 0.1 mv/a sensor A/ A rms When using a 1 mv/a sensor, A/ A rms When using a 1 mv/a sensor, A/ A rms When using a 10 mv/a sensor, A/ A rms When using a 100 mv/a sensor ma/ A rms When using a 9667sensor, 5000 A range A/ ka rms When using a 9667sensor, 500 A range A/ A rms When using a 9669 sensor A/ ka rms Range selection Manual range (Same operation switches the range for CH1 to 3.) Measurement accuracy ±0.2% rdg. ±0.1% f.s. + clamp sensor specification accuracy Crest factor Less than 4 (for full-scale input) Transient Overvoltage (impulse) Measurement method Measurement range Displayed items Minimum detectable duration Measurement accuracy Frequency range Restrictions on saving waveforms For detection, samples at 2 MHz are compared with calculation samples CH1 to 4: ±2000 V pk Peak voltage: This value exceeds the threshold and can be up to the maximum value. Period: Period threshold is exceeded (max. 4 ms) 0.5µs ±5.0% rdg. ±20 V (Conforms to 1000 V/DC or 700 V rms/100 khz.) DC to 200 khz (-3 db) (Conforms to 20 V rms) Saves waveforms that have a maximum transient overvoltage value (absolute value) within the basic voltage wave. (Waveforms in which the peak point is the center.) RMS Voltage (value calculated for one waveform shifted over half a wave) Measurement method True RMS type Data samples of each half of one cycle (256 points) of the voltage waveform are overlapped, and the RMS voltage is obtained by calculating from one half cycle. (the line-to-line voltage is used for three-phase 3-wire (3P3W3M) systems, and the phase-to-neutral voltage is used for three-phase 4-wire systems) Voltage Swell Displayed items Threshold and hysteresis Voltage swell height Voltage swell interval Swell amplitude and duration % of basic voltage swell to (threshold)% When the RMS voltage (value calculated for one waveform shifted over half a wave) exceeds the threshold in the right direction, the swell is detected and the threshold height displayed. The interval from the time of swell is detected until the threshold minus the hysteresis is exceeded in the wrong direction. Voltage Dip Displayed items Dip depth and duration
191 Measurement Specifications Voltage Dip Threshold and hysteresis Voltage dip depth Voltage dip interval % of basic voltage dip to (threshold)% When the RMS voltage (value calculated for one waveform shifted over half a wave) exceeds the threshold in the wrong direction, the swell is detected and the threshold depth displayed. The interval from time the dip is detected until the threshold minus the hysteresis is exceeded in the right direction. Instantaneous Interruption Display items Threshold and hysteresis Instantaneous interruption depth Instantaneous interruption interval Instantaneous interruption interval (and instantaneous interruption depth) % of basic voltage Interruption to (threshold)% When the RMS voltage (value calculated for one waveform shifted over half a wave) exceeds the threshold in the wrong direction, the instantaneous interruption is detected and the threshold height displayed. The interval from the time of instantaneous interruption is detected until the threshold minus the hysteresis is exceeded in the right direction. Frequency Measurement method Measurement range Measurement range Measurement source Measurement accuracy Reciprocal frequencies are sampled at 2 MHz about once every 10 cycles at 50 Hz or every 12 cycles at 60 Hz (approximately every 200 ms) to Hz Hz One of voltages U1, U2 or U3 (the same as the PLL synchronization source) Less than ±10 mhz For a sine wave input with a voltage range of 10% to 110%. Voltage Waveform Peak Measurement method Display items Measurement range Waveform consists of 256 points/cycle, measured every 12 or 10 cycles at 50 or 60 Hz, respectively (approx. 200 ms) Maximum and minimum sampling points within 200 ms Positive peak value and negative peak value Area of the RMS voltage range to which the crest factor was added. Current Waveform Peak Measurement method Display items Measurement range Waveform consists of 256 points/cycle, measured every 12 or 10 cycles at 50 or 60 Hz, respectively (approx. 200 ms) Maximum and minimum sampling points in 200 ms Positive peak value and negative peak value Area of the RMS current range to which the crest factor was added.
192 186 Active Power 12.2 Measurement Specifications Measurement method Waveform consists of 256 points/cycle, measured every 12 or 10 cycles at 50 or 60 Hz, respectively (approx. 200 ms) Calculated by averaging sampled voltage and current waveform data Display items Active power of each channel and its sum for multiple channels. (For details, see the formula.(page 198)) Measurement range Depends on the voltage current range combination. (See the power range configuration table (page 190).) Measurement accuracy ±0.2% rdg. ±0.1% f.s. + clamp sensor specification accuracy (power factor = 1)(The total is the sum of the channels used.) Power factor influence ±1.0% rdg. (45 Hz to 66 Hz, power factor = 0.5) Polarity display For influx (consumption) No symbol For outflow (regenerative) "-" Apparent Power Measurement method Calculated from RMS voltage U and RMS current I. Display item Apparent power of each channel and its sum for multiple channels. (For details, see the formula.(page 198)) Measurement range Depends on the voltage x current range combination. (See the power range configuration table (page 190).) Measurement accuracy ±1 dgt. for calculations derived from the various measurement values. (sum is ±3 dgt.) Polarity display No polarity Reactive Power Measurement method Calculated using apparent power S and active power P. Display item Reactive power of each channel and its sum for multiple channels. (For details, see the formula.(page 199)) Measurement range Depends on the voltage x current range combination. (See the power range configuration table (page 190).) Measurement accuracy ±1 dgt. for calculations derived from the various measurement values. (sum is ±3 dgt.) Polarity display For phase lag (LAG: current is slower than voltage): no symbol For lead phase (LEAD: current is faster than voltage): - Power Factor Measurement method Calculated from RMS voltage U, RMS current I, and active power P. Display item Measurement range Measurement accuracy Polarity display Power factor of each channel or its sum for multiple channels. (For details, see the formula.(page 199)) (lead) to to (lag) ±1 dgt. for calculations derived from the various measurement values. (sum value is ±3 dgt.) For phase lag (LAG: current is slower than voltage): no symbol For lead phase (LEAD: current is faster than voltage): -
193 Measurement Specifications Displacement Power Factor Measurement method Display item Measurement range Measurement accuracy Polarity display Calculated from the phase difference between the fundamental voltage wave and the fundamental current wave. Displacement power factor of each channel and its sum value for multiple channels. (For details, see the formula.(page 200)) (lead) to to (lag) ±0.5% rdg. ±0.2% f.s. ±1 dgt. (sum value is ±3 dgt.) For phase lag (LAG: current is slower than voltage): no symbol For lead phase (LEAD: current is faster than voltage): - Voltage Unbalance Factor Measurement method Total display area 0.00% to % Current Unbalance Factor Measurement method Display range 0.00% to % K Factor (multiplication factor) Calculated using various components of the three-phase fundamental voltage wave (line-to-line voltage) for three-phase 3-wire (3P3W3M) and threephase 4-wire connections. (For details, see the formula. (page 200)) Calculated using various components of the three-phase fundamental current wave (line-to-line current) for three-phase 3-wire (3P3W3M) and threephase 4-wire connections. (For details, see the formula. (page 201)) Measurement method Calculated using the harmonic RMS current of the 2nd to 50th orders. (For details, see the formula. (page 203)) Display range 0.00 to U Voltage Fluctuation Measurement method Display range Change in RMS voltage (value calculated for one waveform shifted over half a wave) with respect to standard voltage Nominal voltage S(t) Instantaneous Flicker value Measurement method Weighting filters Per IEC V lamp 50 Hz system, 120 V lamp 60 Hz system V10 Flicker Measurement method Calculated using the V10 perceived flicker curve.(page 207) V10 is measured at 1 minute intervals without gaps. 100 V conversion value Display item Standard voltage Measurement accuracy Conditions of guaranteed accuracy V10 measured at one minute intervals, average value for one hour, maximum value for one hour, fourth largest value for one hour, total (within the measurement interval) maximum value Automatic (using AGC) ±4%rdg.±0.01V For 100 V RMS fundamental wave (50/60 Hz), 1 V RMS fluctuating voltage, and 10 Hz fluctuating frequency.
194 Measurement Specifications IEC Flicker: short interval flicker value Pst and long interval flicker value Plt Measurement method Per IEC Pst is calculated after 10 minutes of continuous measurement and Plt after 2 hours of continuous measurement. Flicker range Uses logarithms to divides to P.U. into Measurement accuracy Pst: ±5% rdg.(as set forth for IEC performance testing) Valid for input ranging from 50 to 100% of the voltage measurement range Harmonic Voltage, Current and Power (including fundamental waveform content) Measurement method Harmonic analysis window width Number of points in 1 window Harmonic analysis window Harmonic analysis frequencies Measurement accuracy Harmonic voltage and harmonic current: After harmonic analysis is performed, the adjacent inter-harmonics component is added to the harmonics component of whole orders and displayed. Harmonic power: Displays the harmonic power of each channel and its sum for multiple channels. (For details, see the formula.(page 203)) 10 or 12 cycles for 50 or 60 Hz, respectively 2048 points Rectangular 1st to 50th orders (of to 69-Hz fundamental waveform) At 50/60 Hz: Harmonic voltage and harmonic current: 1st to 20th orders: ±0.5% rdg. ±0.2% f.s. 21st to 50th orders: ±1.0% rdg. ±0.3% f.s. Harmonic power: 1st to 20th orders: ±0.5% rdg. ±0.2% f.s. 21st to 30th orders: ±1.0% rdg. ±0.3% f.s. 31st to 40th orders:±2.0% rdg. ±0.3% f.s. 41st to 50th orders:±3.0% rdg. ±0.3% f.s. However, the clamp sensor s accuracy is added when calculating harmonic current and harmonic power. Inter-Harmonic Voltage and Current Measurement method Harmonic analysis window width Number of points in 1 window Harmonic analysis window Harmonic analysis frequencies Measurement accuracy After harmonic analysis, harmonic voltage and current are summed and displayed as inter-harmonic contents with the harmonic contents according to harmonic order 10 or 12 cycles for 50 or 60 Hz, respectively 2048 points Rectangular 0.5 to 49.5 orders (of to 69-Hz fundamental waveform) Unspecified
195 Measurement Specifications Harmonic Voltage/Current Phase Angle (including fundamental wave components) Measurement method Measurement accuracy After harmonic analysis, the harmonic phase angle components for whole orders are displayed. (Set the phase angle for the PLL source of the fundamental wave to 0.) Not defined Harmonic Voltage/Current Phase Difference (including fundamental wave components) Measurement method Display items Measurement accuracy Accuracy range After harmonic analysis, the difference between harmonic voltage and current phase angles is displayed Harmonic voltage-current phase difference for each channel and sum (total) value for multiple channels (For details, see the formula.(page 206)) At 50/60 Hz: 1st to 3rd orders: ±2, 4th to 50th orders: ±(0.02 k+2 ) (k: harmonic orders) However, clamp sensor accuracy is added. Harmonic voltage and current level for each order within 1% of the range. Total Harmonic Voltage/Current Distortion Factor Measurement display THD-F (total harmonic distortion factor for the fundamental wave) THD-R (total harmonic distortion factor for the total harmonic including the fundamental wave) Total Inter-harmonic Voltage/Current Distortion Factor Measurement display THD-F (total inter-harmonic distortion factor for the fundamental wave) THD-R (total inter-harmonic distortion factor for the total harmonic including the fundamental wave) Other Characteristics Frequency characteristic Temperature characteristic Effect of common mode voltage Effect of external magnetic field 42.5 Hz to 60 Hz: ±0.2% rdg. ±0.1% f.s. 69 Hz to 1 khz: ±3% f.s. 1 khz to 3 khz: ±10% f.s. (RMS voltage, RMS current), ±15% f.s. (active power) AC: Within ±0.03% f.s./ C (from 0 to 18 C and from 28 to 40 C) DC: Within ±0.1% f.s./ C (from 0 to 18 C and from 28 to 40 C) ±0.2% f.s. or less (600 Vrms, 50/60 Hz, between voltage input terminal and instrument case) ±1.5% f.s. or less (in a magnetic field of 400 A/m rms, 50/60 Hz)
196 Measurement Specifications Power Range Configuration Tables When using a 0.1 mv/a (5000A) sensor Current range Voltage range A A When using a 1 mv/a (500A) sensor or 9661 sensor Current range Voltage range A A V k k V k k V k M V k k V k M V k k When using a 9660 sensor Current range Voltage range A A When using a 10 mv/a (50A) sensor or 9694 sensor Current range Voltage range A A V k k V k V k k V k k V k k V k k When using a 100 mv/a (5A) sensor Current range Voltage range ma A When using a 9667 sensor 5000A range Current range Voltage range A ka V V k k V k V k M V k V k M When using a 9667 sensor 500A range Current range Voltage range A A When using a 9669 sensor Current range Voltage range A ka V k k V k k V k k V k k V k k V k k Applies to the active power of each channel (unit W), apparent power (unit VA), and reactive power (unit var). Event Specifications Event contents Event detection method Measurement used for event detection Various events, measurement start, measurement stop Detects events with OR. Instantaneous interruption values of measurements (Inter-harmonics detection is not possible.) (Event detection for MAX, MIN, and AVE values is not possible.)
197 Setting Functions 12.3 Setting Functions System Settings CH1, 2, 3 CH4 Measured line 1P2W, 1P3W, 3P3W2M, 3P3W3M, 3P4W AC, DC, and OFF Clamp sensor ratings 0.1 mv/a, 1 mv/a, 10 mv/a, 100 mv/a Same as CH1, CH2, and CH3. Voltage range 150 V, 300 V, 600 V PT ratio 1, 60, 100, 200, 300, 600, 700, 1000, 2000, 2500, 5000, VARIABLE (0.01 to ) Current range When using a 0.1 mv/a sensor: 500 A, 5000 A When using a 1 mv/a sensor: (9661): 50 A, 500 A (9660): 50 A, 100 A When using a 10 mv/a sensor: (9694): 5 A, 50 A When using a 100 mv/a sensor: 500 ma, 5 A When using a 9667 sensor: (5000 A range): 500 A, 5000 A (500 A range): 50 A, 500 A When using a 9669 sensor: 100 A, 1000 A CT ratio 1, 40, 60, 80, 120, 160, 200, 240, 300, 400, 600, 800, 1200, VARIABLE (0.01 to ) Measured line frequency PLL synchronization/frequency source Measured RMS voltage selection Measured harmonic selection Measured harmonic distortion factor selection Power factor selection Flicker measurement selection 50/60 Hz Voltage: U1, U2, U3 Phase-to-neutral voltage and line-to-line voltage RMS and % of fundamental (content percentage) For AC: 60 V, 150 V, 300 V, 600 V For DC: 60 V, 600 V Same as CH1, CH2, and CH3. Same as CH1, CH2, and CH3. Same as CH1, CH2, and CH3. THD-F (basic wave standard)/thd-r (total harmonic value standard) Power factor/displacement power factor OFF/ V10/ Pst,Plt Nominal voltage 100/ 101/ 110/ 120/ 200/ 202/ 208/ 220/ 230/ 240/ 277/ 346/ 380/ 400/ 415/ 480/ 600/ VARIABLE (50 to 600 V in 1 V increments) Voltage recording Urms/ U/ S(t) Flicker measurement CH U1 to U3 Filter 120 V lamp/ 230 V lamp EN50160 ON/ OFF
198 Setting Functions Hardware Settings Display language Beep Screen colors English, German, French, Italian, Spanish, Japanese ON/ OFF COLOR 1 to 4, MONO LCD backlight ON/ Auto OFF (I m, 5 m, 10 m, 30 m, 1 h) Real-time settings System reset Version information Print interval AUTO copy Year/month/day/hour/minute You can reset the unit to its defaults with the system's reset procedure. (This does not reset the display language, clock, IP address, or subnet mask.) Software version display OFF, 1 m, 5 m, 10 m, 30 m, 1 h, 2 h OFF/ ON Measurement Time Control Settings Real time control OFF (Manual) / ON (time settings) Start and end time settings year/month/day/hour/minute (24-hour clock) Time Series Data Settings Interval settings MAX/MIN/AVE settings 1 s, 3 s, 15 s, 30 s, 1 m, 5 m, 10 m, 30 m, 1 h, 2 h AVE value/(max value, MIN value, AVE value) Recorded item settings Pattern 1, Pattern 2, Pattern 3 1: Power/ 2: P&Harm/ 3: ALL DATA Recorded item Pattern Voltage (one wave shifted over half a wave) Frequency RMS voltage value RMS current value Voltage waveform peak Current waveform peak Active power Apparent power Reactive power Power factor/displacement power factor Voltage unbalance factor Current unbalance factor 1: Power/ 2: P&Harm/ 3: ALL DATA Recorded item Pattern Harmonic voltage Harmonic current Harmonic power Harmonic voltage-current phase difference Inter-harmonic voltage Inter-harmonic current Total harmonic voltage distortion factor Total harmonic current distortion factor Total inter-harmonic voltage distortion factor Total inter-harmonic current distortion factor K factor Flicker ( V10 or Pst, PLt)
199 Setting Functions Data Save Settings (save methods for time series data and event data) Data save area Settings when the data save area is full Always saves data in the internal memory (when a PC card is connected, saves data on the PC card as well) STOP/ LOOP (When LOOP is set: Time series data in internal memory: first in first out, event data: the worst event data is overwritten) External Interface Settings RS-232C output point printer/modem/off (The LAN may be used when modem is not set as the output point.) RS-232C settings Baud rate (bps): 9600, 19200, 38400, 57600, (Other settings are fixed, transfer method: asynchronous communication method, data length: 8 bits, parity check: none, stop bit: 1, flow control: off, delimiter: CR + LF) Modem setting Modem communication monitoring time: OFF/ 1min/ 5min/ 10min/ 30min LAN settings IP address: 3 characters.3 characters.3 characters.3 characters (***.***.***.***) Subnet mask: 3 characters.3 characters.3 characters.3 characters (***.***.***.***) PC Card Settings Auto-save settings PC card access function TEXT content setting OFF, BINARY, TEXT Load (BINARY only), Save (BINARY or TEXT), Delete, Initialize Fundamental, power, and channel settings. Harmonics, maximum order number, and channel settings. Repeated Recording Settings Repeated recording settings OFF/ 1 day/ 1 week The number of repeated 1 to 99 times recording operations Repeated recording function operable when MemoryFull: LOOP, Auto Saves: Binary, and Time- Start: ON.
200 Setting Functions Event Settings Item Order selection *1 Measurement selection *2 Positive and negative *3 Channel selection *4 Threshold *5 Transient overvoltage ± 1,2,3 4 OFF 0 to 2000 V pk Voltage swell 1,2,3 - OFF 0 to 200% Voltage dip 1,2,3 - OFF 0 to 100% Voltage instantaneous interruption 1,2,3 - OFF 0 to 100% Voltage frequency Approximately PLL source - OFF 0 to 30 Hz Voltage waveform peak (±) ± 1,2,3 4 OFF 0 to 1800 V Current waveform peak (±) ± 1,2,3 4 OFF 0 to 2000 A RMS voltage value Inter-phase/ line-to-line Up and down sense 1,2,3 4 OFF 0 to 600 V rms 0 to 60 V rms RMS current value 1,2,3 4 OFF 0 to 500 A RMS Active power ± 1,2,3 sum OFF 0 to 3 MW (9MW) Apparent power 1,2,3 sum OFF 0 to 3 MVA Reactive power ± 1,2,3 sum OFF 0 to 3 Mvar Power factor/displacement power factor PF/DPF ± 1,2,3 sum OFF 0 to 1 Voltage unbalance factor - sum OFF 0 to 100% Current unbalance factor - sum OFF 0 to 100% Harmonic voltage 1st to 50th orders RMS/% 1,2,3 4 OFF 0 to 600 V/ 0 to 100% Harmonic current Harmonic power Harmonic voltage-current phase difference Total harmonic voltage distortion factor Total harmonic current distortion factor 1st to 50th orders 1st to 50th orders 1st to 50th orders RMS/% 1,2,3 4 OFF RMS/% ± 1,2,3 sum OFF 0 to 5000 A/ 0 to 100% 0 to 3 MW/ 0 to 100% ± 1,2,3 sum OFF 0 to 180 -F/-R 1,2,3 4 OFF 0 to 100% -F/-R 1,2,3 4 OFF 0 to 500% K factor 1,2,3 4 OFF 0 to 500 Harmonic voltage distortion 1,2,3 - OFF 0 to 100% External event Input Terminal - OFF None *1: Settings can be made individually for each harmonic order. *2: Measurement settings can be selected for each type of measurement (inter-phase or line-to-line, RMS or %, and -F or -R). *3: Plus and minus (±) indicates that the threshold is specified as the absolute value. (Detects events using absolute values regardless of if they are positive or negative.) *4: You can set the threshold of channels that are separate and not off. (However, only 1, 2, and 3 are common settings.) *5: The recorded threshold is the value multiplied when the PT ratio and CT ratio are set. Hysteresis is set as a percentage of the threshold and for all measurements at once (default setting: 1%). However, it is fixed at 0.1 Hz.
201 Setting Functions Other Functions Warning functions Incorrect connection check Connection diagram screen: Check that the connection and clamp sensor are not reversed. Connection check screen: Check the phase order. Out of range When the input exceeds the range by 130%, displays Out of crest factor When the input peak value of the waveform is 3 times the voltage range or 4 times the current range, displays Out of crest factor. PLL unlock When PLL lock is not selected during an instantaneous interruption, the device switches to the fixed clock (without gaps), and PLL unlock is displayed for that duration. Other functions Display hold function Key lock function Read settings function External event input/output function LCD backlight auto-off function Manual event function You can hold and release the displayed value by pressing the DATA HOLD key. All key operations except the power switch operations are disabled. Settings can be read using the internal memory or a Flash ATA card. Number of settings that can be saved in the internal memory: up to 10 External event input External event input is possible for TTL low level (when the voltage drops to less than approximately 2.5 V or there is a short circuit) between the GND terminal and the EVENT IN terminal. External event output For TTL low output when each type of event occurs between the GND terminal and the EVENT OUT terminal. The backlight automatically turns off after the set time elapses since the last key operation. After the backlight automatically turns off, the LCD lights automatically when you push any key (also effective in key lock). An event can be manually generated by simultaneously pressing the ESC and EVENT keys. HTTP server function Description Connection method Supported software Remote control application function Start and finish measurement control function System settings function Event list function (you can also display waveforms, vectors, and harmonics bar graphs for events) (you can convert event waveforms into text) LAN interface or RS-232C interface Internet Explorer 4 or later EN50160 function See the product specifications in the Instruction Manual for EN50160.
202 Formulae 12.4 Formulae Voltage dips, voltage swells, and interruptions U (V rms) Single-phase 2-wire 1P2W U1 Uc Single-phase 3-wire 1P3W U1 U2 = M ( Ucs) M U12 S= 0 Three-phase 3-wire 3P3W2M Three-phase 3-wire 3P3W3M Three-phase 4-wire 3P4W Line-to-line voltage Line-to-line voltage Phase-to-neutral voltage M 1 M 1 1 U ( U1s) 2 1 = M U12= ---- M ( U1s) 2 U2 S= 0 S= 0 U3 U32 = M ( U2s) 2 M S= 0 U23 = M ( U2s) 2 M S= 0 U31 = M ( U3s) 2 M S= 0 Calculate a single waveform that has been overlapped half a wave at 256 points/wave. (M=256) Search for voltage dips, voltage swells, and instantaneous interruptions based on the above RMS voltage value. c: measured channel M: number of samples per cycle s: number of sampling points Voltage waveform peak Up (V peak) Single-phase 2-wire 1P2W Single-phase 3-wire 1P3W Three-phase 3-wire 3P3W2M Three-phase 3-wire 3P3W3M Three-phase 4-wire 3P4W Up1 Up4 Up1 Up2 Up4 Up12 Up32 Up4 Calculate the maximum positive and negative voltage waveform peaks of all points about once every 10 cycles at 50 Hz or every 12 cycles at 60 Hz with a single wave (256 points). The voltage waveform peak for CH4 can be calculated regardless of the connection method. c: measured channel M: number of samples per cycle s: number of sampling points Current waveform peak Ip (Apeak) Up12 Up23 Up31 Up4 Up12 Up23 Up31 Up4 Single-phase 2-wire 1P2W Single-phase 3-wire 1P3W Three-phase 3-wire 3P3W2M Three-phase 3-wire 3P3W3M Three-phase 4-wire 3P4W Ip1 Ip4 Ip1 Ip2 Ip4 Ip1 Ip2 Ip4 Calculate the maximum positive and negative current waveform peaks of all points about once every 10 cycles at 50 Hz or every 12 cycles at 60 Hz with a single wave (256 points). The current waveform peak for CH4 can be calculated regardless of the connection method. Ip1 Ip2 Ip3 Ip4 c: measured channel M: number of samples per cycle s: number of sampling points Ip1 Ip2 Ip3 Ip4
203 12.4 Formulae 197 RMS voltage U (V rms) Single-phase 2-wire 1P2W U1 U4 Uc= M ( Ucs) 2 M S= 0 Single-phase 3-wire 1P3W U1 U2 U4 Uave= ( U1+ U2) Three-phase 3-wire 3P3W2M Three-phase 3-wire 3P3W3M Three-phase 4-wire 3P4W line-to-line voltage Line-to-line voltage Phase-to-neutral voltage M 1 M 1 1 U1 U ( U1s) 1 = M U12= ---- M ( U1s) U2 S= 0 S= 0 U3 U32 = M ( U2s) 2 M S= 0 U23 U31 = = M ( U2s) 2 M S= 0 M ( U3s) 2 M S= 0 U4 U4 U4 Phase-to-neutral Phase-to-neutral Line-to-line voltage voltage voltage M 1 1 U 12 = U 1 = ---- U1s U3s M ( U1s U2s) M S= 0 3 M 1 2 S= 0 M 1 2 S= 0 1 U 2 = ---- U2s U1s M 3 U3 = M 1 2 S= U3s U2s M M 1 1 U 23 = ---- U2s U3s M U31 = ( ) 2 S= 0 M U3s U1s M ( ) 2 S= 0 U4 U4 Line-to-line voltage Line-to-line voltage Phase-to-neutral Uave= 1 voltage 2 -- ( U12+ U32) Uave= ( U12+ U23+ U31) Uave= ( U1+ U2+ U3) Phase-to-neutral voltage Phase-to-neutral voltage Uave= ( U1+ U2+ U3) Line-to-line voltage Uave= ( U12+ U23+ U31) RMS voltage is calculated about once every10 cycles at 50 Hz or every 12 cycles at 60 Hz with a single wave (256 points). Make the neutral point the center and calculate the phase-to-neutral voltage for three-phase 3-wire connections. The RMS voltage for CH4 can be calculated regardless of the connection method. Use the line-to-line voltage calculated for three-phase 3-wire and three-phase 4-wire connections to calculate V10.(See the formula for V10.) c: measured channel M: number of samples s: number of sampling points
204 Formulae RMS current I (A rms) Single-phase 2-wire 1P2W Single-phase 3-wire 1P3W Three-phase 3-wire 3P3W2M Three-phase 3-wire 3P3W3M Three-phase 4-wire 3P4W I1 I1 I1 I1 I1 I4 I2 I2 I2 I2 Ic= M ( Ics) 2 M S= 0 I4 I4 I3 I4 I3 I4 Iave= ( I1+ I2) Iave= ( I1+ I2) Iave= ( I1+ I2+ I3) Iave= ( I1+ I2+ I3) Calculate RMS current about once every 10 cycles at 50 Hz and every 12 cycles at 60 Hz with a single wave (256 points). The RMS current for CH4 can be calculated regardless of the connection method. c: measured channel M: number of samples s: number of sampling points Active power P (W) Single-phase 2-wire 1P2W Single-phase 3-wire 1P3W Three-phase 3-wire 3P3W2M Three-phase 3-wire 3P3W3M Three-phase 4-wire 3P4W P1 Pc= 1 M ---- M 1 S= 0 ( Ucs Ics) P1 P2 P1 P2 P1 P2 P3 P1 P2 P3 Psum= P1+ P2 Psum= P1+ P2 Psum= P1+ P2+ P3 Psum= P1+ P2+ P3 Calculate active power about once every 10 cycles at 50 Hz or every 12 cycles at 60 Hz with a single wave (256 points). For three-phase 3-wire 3M and three-phase 4-wire connections, use phase-to-neutral voltage as the voltage waveform Ucs. Three-phase 3-wire 3M: U1s = (U1s - U3s)/3, U2s = (U2s - U1s)/3, and U3s = (U3s - U2s)/3 Polarity symbols for active power P indicate the power direction when power is being consumed (+P) and when power is being regenerated (-P). c: measured channel M: number of samples s: number of sampling points Apparent power S (VA) Single-phase 2-wire 1P2W Single-phase 3-wire 1P3W Three-phase 3-wire 3P3W2M Three-phase 3-wire 3P3W3M Three-phase 4-wire 3P4W S1 Sc= Uc Ic (When P>, make P = S.) S1 S2 S1 S2 Ssum= S1+ S2 Ssum 3 Ssum= S1+ S2+ S3 Ssum= S1+ S2+ S3 = ( S1+ S2) 2 For three-phase 3-wire 3M and three-phase 4-wire connections, use phase-to-neutral voltage for Uc. c: measured channel M: number of samples s: number of sampling points S1 S2 S3 S1 S2 S3
205 12.4 Formulae 199 Reactive power Q (var) Single-phase 2-wire 1P2W Single-phase 3-wire 1P3W Three-phase 3-wire 3P3W2M Three-phase 3-wire 3P3W3M Three-phase 4-wire 3P4W Q1 Q1 Q1 Q1 Q1 Qc= sic Sc 2 Pc 2 Q2 Q2 Q2 Q3 Q2 Q3 Qsum= Q1+ Q2 Qsum= Q1+ Q2 Qsum= Q1+ Q2+ Q3 Qsum= Q1+ Q2+ Q3 The polarity symbol sic for reactive power Q indicates a LAG or LEAD in polarity; no symbol indicates a LAG, while the - symbol indicates a LEAD. Calculate the harmonic reactive power of each measured channel (c) using the polarity symbol sic, and attach the opposite symbol for fundamental wave reactive power (using k = 1 (1st order)). (See the harmonic reactive power formula.) c: measured channel M: number of samples s: number of sampling points Power factor PF Single-phase 2-wire 1P2W Single-phase 3-wire 1P3W Three-phase 3-wire 3P3W2M Three-phase 3-wire 3P3W3M Three-phase 4-wire 3P4W PF1 PFc= sic Pc Sc PF1 PF2 PF1 PF2 PF1 PF2 PF3 PF1 PF2 PF3 PFsum= sisum Psum PFsum= sisum Psum PFsum= sisum Psum PFsum= sisum Psum Ssum The polarity symbol si for power factors indicates a LEAD or LAG in polarity; no symbol indicates a LAG, while the - symbol indicates a LEAD. Calculate the harmonic reactive power using the polarity symbol sic and use the fundamental wave reactive power (using k = 1 (1st order) symbol for each measured channel (c)). Calculate the harmonic reactive power using the polarity symbol sisum and attach the opposite symbol of the sum of the fundamental wave reactive power (using k = 1 (1st order)). (See the harmonic reactive power formula.) c: measured channel, k: order for analysis Ssum Ssum Ssum
206 Formulae Displacement power factor DPF Single-phase 2-wire 1P2W Single-phase 3-wire 1P3W Three-phase 3-wire 3P3W2M Three-phase 3-wire 3P3W3M Three-phase 4-wire 3P4W DPF1 DPFc= siccos θc1 DPF1 DPF2 DPF1 DPF2 DPF1 DPF2 DPF3 DPF1 DPF2 DPF3 DPFsum= sisum Psum DPFsum= sisum Psum DPFsum= sisum Psum DPFsum= sisum Psum Ssum1 The polarity symbol si of power factors indicates a LEAD or LAG in polarity; no symbol indicates a LAG, while the - symbol indicates a LEAD. Calculate the harmonic reactive power using the polarity symbol sic and attach the symbol for the fundamental wave reactive power (using k = 1 (1st order) for each measured channel (c)). Calculate the harmonic reactive power using the polarity symbol sisum and attach the opposite symbol for the sum of the fundamental wave reactive power (using k = 1 (1st order)). (See the harmonic reactive power formula.(page 203)) θc1 indicates the voltage-current phase difference for the fundamental wave. (See the voltage-current phase difference formula.(page 206)) Psum1 indicates the total of fundamental wave power and the formula becomes k = 1 for the sum of harmonic power. (See the harmonic power formula.(page 203)) Ssum1 indicates the total of fundamental wave apparent power and can be searched for using the fundamental wave RMS voltage and fundamental wave RMS current. (For information on the formulae for harmonic voltage, harmonic current, and the sum of apparent power, see (page 201).) c: measured channel, k: order for analysis Voltage unbalance factor Uunb (%) Ssum1 Ssum1 Ssum1 Single-phase 2-wire 1P2W Single-phase 3-wire 1P3W Three-phase 3-wire 3P3W2M Three-phase 3-wire 3P3W3M Three-phase 4-wire 3P4W Uunb= β β Uunb= β β β U 4 + U 4 + U = ( U 2 + U 2 + U 2 ) β U 4 + U 4 + U = ( U 2 + U 2 + U 2 ) For U12, U23, and U31, use the fundamental wave RMS voltage from the calculated harmonics results. Calculate the Discrete Fourier Transform of the harmonic RMS voltage at 2048 points (about once every 10 cycles at 50 Hz or every 12 cycles at 60 Hz). For three-phase 4-wire configurations, this is detected using phase-to-neutral voltage but can be converted and calculated using line-to-line voltage.
207 12.4 Formulae 201 Current unbalance factor Iunb (%) Single-phase 2-wire 1P2W Single-phase 3-wire 1P3W Three-phase 3-wire 3P3W2M Three-phase 3-wire 3P3W3M Three-phase 4-wire 3P4W Iunb= β β Iunb= β β β I 4 + I 4 + I = ( I 2 + I 2 + I 2 ) β I 4 + I 4 + I = ( I 2 + I 2 + I 2 ) For I12, I23, and I31, use the fundamental wave RMS current (line-to-line current) from the calculated harmonics results. Calculate the Discrete Fourier Transform of harmonic RMS current at 2048 points (about once every 10 cycles at 50 Hz or every 12 cycles at 60 Hz). For three-phase 3-wire and three-phase 4-wire configurations this is detected using phase current, but can be converted and calculated using line-to-line current. Harmonic voltage Uk (V rms) (including adjacent inter-harmonics components) Single-phase 2-wire 1P2W Single-phase 3-wire 1P3W Three-phase 3-wire 3P3W2M Three-phase 3-wire 3P3W3M Three-phase 4-wire 3P4W U1k U1k U12k U12k U1k U4k U2k U32k U23k U2k U ck= ( Uckr) 2 +( Ucki) Uck= U c 10k n n= U4k U4k U31k U4k U3k U4k Calculate the Discrete Fourier Transform of harmonic RMS voltage at 2048 points (about once every 10 cycles at 50 Hz or every 12 cycles at 60 Hz). Indicates the results of the harmonic calculations of line-to-line voltage for three-phase 3-wire configurations and the results of harmonic calculations of phase-to-neutral voltage for three-phase 4-wire configurations. For harmonic voltage content percentage, divide the fundamental wave voltage component by the harmonic voltage component of the specified order, then multiply by 100. When using 60 Hz, the number 10 in the expression above is 12. c: measured channel, k: order for analysis, r: resistance after FFT, i: reactance after FFT Harmonic current Ik (A rms) (including adjacent inter-harmonic components) Single-phase 2-wire 1P2W Single-phase 3-wire 1P3W Three-phase 3-wire 3P3W2M Three-phase 3-wire 3P3W3M Three-phase 4-wire 3P4W I1k I1k I1k I1k I1k I4k I2k I2k I2k I2k I ck= ( Ickr) 2 +( Icki) Ick= I c 10k n n= I4k I4k I3k I4k I3k I4k Calculate the Discrete Fourier Transform of harmonic RMS current at 2048 points (about once every 10 cycles at 50 Hz or every 12 cycles at 60 Hz). For harmonic current content percentage, divide the fundamental wave current component by the harmonic current component of the specified order, then multiply by 100. When using 60 Hz, the number 10 in the expression above is 12. c: measured channel, k: order for analysis, r: resistance after FFT, i: reactance after FFT
208 Formulae Inter-harmonic voltage Uk (V rms) Single-phase 2-wire 1P2W Single-phase 3-wire 1P3W Three-phase 3-wire 3P3W2M Three-phase 3-wire 3P3W3M Three-phase 4-wire 3P4W U1k U1k U12k U12k U1k U4k U2k U32k U23k U2k U ck= ( Uckr) 2 +( Ucki) 2 U4k U4k U31k U4k U3k U4k 3 2 Uck= U c 10k n n= 3 10 Calculate the Discrete Fourier Transform of harmonic RMS voltage at 2048 points (about once every 10 cycles at 50 Hz or every 12 cycles at 60 Hz). In the equation above, 3 and -3 are used at 50 Hz, and 4 and -4 are used at 60 Hz. k = 0.5, 1.5, 2.5, 3.5,,, Indicates the results of the harmonic calculations of line-to-line voltage for three-phase 3-wire configurations and the results of harmonic calculations of phase-to-neutral voltage for three-phase 4-wire configurations. For inter-harmonic voltage content percentage, divide the fundamental wave voltage component by the inter-harmonic voltage component of the specified order, then multiply by 100. When using 60 Hz, the number 10 in the above expression is 12. c: measured channel, k: order for analysis, r: resistance after FFT, i: reactance after FFT Inter-harmonic current Ik (A rms) Single-phase 2-wire 1P2W Single-phase 3-wire 1P3W Three-phase 3-wire 3P3W2M Three-phase 3-wire 3P3W3M Three-phase 4-wire 3P4W I1k I1k I1k I1k I1k I4k I2k I2k I2k I2k I ck= ( Ickr) 2 +( Icki) 2 I4k I4k I3k I4k I3k I4k 3 2 Ick= I c 10k n n= 3 10 Calculate the Discrete Fourier Transform of harmonic RMS current at 2048 points (about once every 10 cycles at 50 Hz or every 12 cycles at 60 Hz). In the equation above, 3 and -3 are used at 50 Hz, and 4 and -4 are used at 60 Hz. k = 0.5, 1.5, 2.5, 3.5,,, For inter-harmonic current content percentage, divide the fundamental wave current component by the inter-harmonic current component for the specified order, then multiply by 100. When using 60 Hz, the number 10 in the above expression is 12. c: measured channel, k: order for analysis, r: resistance after FFT, i: reactance after FFT
209 12.4 Formulae 203 Harmonic power Pk (W) Single-phase 2-wire 1P2W Single-phase 3-wire 1P3W Three-phase 3-wire 3P3W2M Three-phase 3-wire 3P3W3M Three-phase 4-wire 3P4W P1k P1k Pck= Uckr Ickr+ Ucki Icki P2k Psumk= P1k+P2k P1k P2k Psumk= P1k+P2k Psumk=P1k+P2k+P3k P1k P2k P3k Psumk= P1k+P2k+P3k Calculate the Discrete Fourier Transform of harmonic power (harmonic active power) at 2048 points for voltage and current (about once every 10 cycles at 50 Hz or every 12 cycles at 60 Hz). For harmonic power content percentage, divide the fundamental wave power component by the harmonic power component of the specified order, then multiply by 100. c: measured channel, k: order for analysis, r: resistance after FFT, i: reactance after FFT P1k P2k P3k = ( U1kr U3kr) I1kr+ --( U1ki U3ki) I1ki = ( U2kr U1kr) I2kr+ --( U2ki U1ki) I2ki = ( U3kr U2kr) I3kr+ --( U3ki U2ki) I3ki 3 3 Harmonic reactive power Qk (var) (only for use with internal calculation) Single-phase 2-wire 1P2W Single-phase 3-wire 1P3W Three-phase 3- wire 3P3W2M Three-phase 3-wire 3P3W3M Three-phase 4-wire 3P4W Q1k Q1k Q1k Qck= Uckr Icki Ucki Ickr Q2k Q2k Q1k Qsumk= Q1k+Q2k Qsumk= Q1k+Q2k = ( U1kr U3kr) I1kr --( U1ki U3ki) I1ki = ( U2kr U1kr) I2kr --( U2ki U1ki) I2ki = ( U3kr U2kr) I3kr --( U3ki U2ki) I3ki 3 3 Qsumk=Q1k+Q2k+Q3k Q1k Q2k Q3k Qsumk= Q1k+Q2k+Q3k Calculate the Discrete Fourier Transform of harmonic reactive power at 2048 points for voltage and current (about once every 10 cycles at 50 Hz or every 12 cycles at 60 Hz). c: measured channel, k: order for analysis, r: resistance after FFT, i: reactance after FFT K factor KF Q2k Q3k Single-phase 2-wire 1P2W Single-phase 3-wire 1P3W Three-phase 3-wire 3P3W2M Three-phase 3-wire 3P3W3M Three-phase 4-wire 3P4W KF1 KF4 50 k 2 ( I 2 ) ck k= 1 KFc = I 2 ck k= 1 KF1 KF2 KF4 KF1 KF2 KF4 The K factor is also called the multiplication factor, and indicates the power loss using the harmonic RMS current for the electrical transformer. Calculate the Discrete Fourier Transform of harmonic RMS current at 2048 points (about once every 10 cycles at 50 Hz or every 12 cycles at 60 Hz). c: measured channel, k: order for analysis KF1 KF2 KF3 KF4 KF1 KF2 KF3 KF4
210 Formulae Total harmonic voltage distortion factor THDUF (%) Single-phase 2-wire 1P2W THDUF1 THDUF4 ( Uck) 2 k= 2 THDUFc= K Uc1 Single-phase 3-wire 1P3W THDUF1 THDUF2 THDUF4 Three-phase 3-wire 3P3W2M THDUF12 THDUF32 THDUF4 Three-phase 3-wire 3P3W3M THDUF12 THDUF23 THDUF31 THDUF4 Three-phase 4-wire 3P4W THDUF1 THDUF2 THDUF3 THDUF4 Calculate the Discrete Fourier Transform of harmonic RMS voltage at 2048 points (about once every 10 cycles at 50 Hz or every 12 cycles at 60 Hz). Three-phase 3-wire indicates the result of harmonic calculation with line-to-line voltage. In the equation above, K indicates the total of orders analyzed. Select THDUF or THDUR to calculate the total harmonic voltage distortion factor. Total harmonic current distortion factor THDIF (%) Single-phase 2-wire 1P2W THDIF1 THDIF4 ( Ick) 2 k= 2 THDIFc= K Ic1 Single-phase 3-wire 1P3W THDIF1 THDIF2 THDIF4 Three-phase 3-wire 3P3W2M THDIF1 THDIF2 THDIF4 c: measured channel, k: order for analysis Three-phase 3-wire 3P3W3M THDIF1 THDIF2 THDIF3 THDIF4 Three-phase 4-wire 3P4W THDIF1 THDIF2 THDIF3 THDIF4 Calculate the Discrete Fourier Transform of harmonic RMS current at 2048 points (about once every 10 cycles at 50 Hz or every 12 cycles at 60 Hz). In the equation above, K indicates the total of orders analyzed. Select either THDIF or THDIR to calculate the total harmonic current distortion factor. Total harmonic voltage distortion factor THDUR (%) Single-phase 2-wire 1P2W THDUR1 THDUR4 THDURc= K ( Uck) 2 k= 2 K ( Uck) 2 k= 1 Single-phase 3-wire 1P3W THDUR1 THDUR2 THDUR4 Three-phase 3-wire 3P3W2M THDUR12 THDUR32 THDUR4 c: measured channel, k: order for analysis Three-phase 3-wire 3P3W3M THDUR12 THDUR23 THDUR31 THDUR4 Three-phase 4-wire 3P4W THDUR1 THDUR2 THDUR3 THDUR4 Calculate the Discrete Fourier Transform of harmonic RMS voltage at 2048 points (about once every 10 cycles at 50 Hz or every 12 cycles at 60 Hz). Three-phase 3-wire indicates the result of harmonic calculation with line-to-line voltage. In the equation above, K indicates the total of orders analyzed. Select either THDUF or THDUR to calculate the total harmonic voltage distortion factor. c: measured channel, k: order for analysis
211 12.4 Formulae 205 Total harmonic current distortion factor THDIR (%) Single-phase 2-wire 1P2W THDIR1 THDIR4 ( Ick) 2 k= 2 THDIRc= K K ( Ick) 2 k= 1 Single-phase 3-wire 1P3W THDIR1 THDIR2 THDIR4 Three-phase 3-wire 3P3W2M THDIR1 THDIR2 THDIR4 Three-phase 3-wire 3P3W3M THDIR1 THDIR2 THDIR3 THDIR4 Three-phase 4-wire 3P4W THDIR1 THDIR2 THDIR3 THDIR4 Calculate the Discrete Fourier Transform of harmonic RMS current at 2048 points (about once every 10 cycles at 50 Hz or every 12 cycles at 60 Hz). In the equation above, K indicates the total of orders analyzed. Select either THDIF or THDIR to calculate the total harmonic current distortion factor. Harmonic voltage phase angle θuk (deg) c: measured channel, k: order for analysis Single-phase 2-wire 1P2W Single-phase 3-wire 1P3W Three-phase 3-wire 3P3W2M Three-phase 3-wire 3P3W3M Three-phase 4-wire 3P4W θu1k θu1k θu12k θu12k θu1k θu4k θuck=tan 1 Uckr Ucki θu2k θu4k θu32k θu4k θu23k θu31k θu4k θu2k θu3k θu4k Calculate the Discrete Fourier Transform of harmonic RMS voltage at 2048 points (about once every 10 cycles at 50 Hz or every 12 cycles at 60 Hz). Three-phase 3-wire indicates the result of harmonic calculation with line-to-line voltage. Corrects the PLL source fundamental wave to 0 and displays the harmonic voltage phase angle. When Uckr=Ucki=0 θuk=0. The harmonic voltage used in calculations is only taken from integral harmonics. c: measured channel, k: order for analysis, r: resistance after FFT, i: reactance after FFT Harmonic current phase angle θik (deg) Single-phase 2-wire 1P2W Single-phase 3-wire 1P3W Three-phase 3-wire 3P3W2M Three-phase 3-wire 3P3W3M Three-phase 4-wire 3P4W θi1k θi1k θi1k θi1k θi1k θi4k θick=tan 1 Ickr Icki θi2k θi4k θi2k θi4k θi2k θi3k θi4k θi2k θi3k θi4k Calculate the Discrete Fourier Transform of harmonic RMS current at 2048 points (about once every 10 cycles at 50 Hz or every 12 cycles at 60 Hz). Corrects the PLL source fundamental wave to 0 and displays the harmonic current phase angle. When Ickr=Icki=0 θik=0. The harmonic current used in calculations is only taken from integral harmonics. c: measured channel, k: order for analysis, r: resistance after FFT, i: reactance after FFT
212 Formulae Harmonic voltage-current phase difference θk (deg) Single-phase 2-wire 1P2W Single-phase 3-wire 1P3W Three-phase 3-wire 3P3W2M Three-phase 3-wire 3P3W3M Three-phase 4-wire 3P4W θ1k θck=θcik- θcuk θ1k θ2k θ1k θ2k θ1k θ2k θ1k θ2k θ3k θ3k Qsumk θsum Qsumk Qsumk = tan θsum= tan θsum= tan Psumk Psumk Psumk θsum=tan 1 Qsumk Psumk Calculate harmonic power at 2048 points for voltage and current (about once every 10 cycles at 50 Hz or every 12 cycles at 60 Hz). When Psumk=Qsumk=0, θk=0. Psumk indicates the total harmonic power. (See the harmonic power formula.) Qsumk indicates the total harmonic reactive power. (See the harmonic reactive power formula.) c: measured channel, k: order for analysis, r: resistance after FFT, i: reactance after FFT Voltage fluctuation U (Vrms) Single-phase 2-wire 1P2W U(c)=Uc-Ur Single-phase 3-wire 1P3W U(1) U(2) Three-phase 3-wire 3P3W2M U(12) U(32) Three-phase 3-wire 3P3W3M U(12) U(23) U(31) Three-phase 4-wire 3P4W U(1) U(2) U(3) Ur is the same value as the nominal voltage for standard voltage with respect to voltage fluctuations. c: measured channel, r: resistance after FFT
213 12.4 Formulae 207 Voltage flicker V10 (V) Single-phase 2-wire 1P2W Single-phase 3-wire 1P3W Three-phase 3-wire 3P3W2M Three-phase 3-wire 3P3W3M Three-phase 4-wire 3P4W V10( 1) V10() c = ( an Un )2 Uf V10(1) V10(2) V10(12) V10(32) V10 Perceived flicker curve V10(12) V10(23) V10(31) V10(1) V10(2) V10(3) Ur is the basic voltage for the change in voltage and Uf is the basic voltage for the voltage flicker, and they both operate automatically. Ur indicates the value passing through the primary LPF (for a response time of 1 m) and Uf indicates the average RMS voltage over a 1-minute interval. an is the flicker luminosity coefficient corresponding to the change in frequency fn (Hz) that can be detected from the flicker luminosity curve. Un is the change in voltage for fn. For connections other than single-phase two-wire, you can select any V10 value for calculation. V10 Perceived flicker coefficient c: measured channel Frequency[Hz]
214 Formulae Short interval voltage flicker Pst Single-phase 2-wire 1P2W Single-phase 3-wire 1P3W Three-phase 3-wire 3P3W2M Three-phase 3-wire 3P3W3M Three-phase 4-wire 3P4W Pst1 Pstc= K1P0.1+ K2P1s+ K3P3s+ K4P10s+ K5P50s Pst1 Pst2 Indicates the following values: K1=0.0314, K2=0.0525, K3=0.0657, K4=0.28, K5=0.08. The cumulative probability function (CPF) is in the 1024 class. Searches using linear interpolation between the various cumulative probabilities (Pi) and calculates a smoothed cumulative probability using the following methods (Pis). P1s=(P0.7+P1+P1.5)/3 P3s=(P2.2+P3+P4)/3 P10s=(P6+P8+P10+P13+P17)/5 P50s=(P30+P50+P80)/3 c: measured channel Long interval voltage flicker Plt Pst1 Pst2 Pst1 Pst2 Pst3 Pst1 Pst2 Pst3 Single-phase 2-wire 1P2W Single-phase 3-wire 1P3W Three-phase 3-wire 3P3W2M Three-phase 3-wire 3P3W3M Three-phase 4-wire 3P4W Plt1 3 Pltc= N ( Pstn) 3 n= N Plt1 Plt2 Plt1 Plt2 Plt1 Plt2 Plt3 Plt1 Plt2 Plt3 N indicates the number of measurements (N = 12 measurements). (When N<12, the number of measurements N is used.) c: measured channel
215 Appendix 209 Appendix Measurement Range and Nominal Voltage The voltage and current ranges of this unit are as follows. This unit is not equipped with an automatic range selection function, therefore you must select the operation ranges. Voltage range Current range CH 1 to V, 300 V, 600 V CH 4 (AC) 60 V, 150 V, 300 V, 600 V CH 4 (DC) 60 V, 600 V 0.1 mv/a 500 A, 5000 A 1 mv/a (9661) 50 A, 500 A 1 mv/a (9660) 50 A, 100 A 10 mv/a (9694) 5 A, 50 A 100 mv/a 0.5 A, 5 A 5000 A A, 5000A 500 A A, 500A 1000 A A, 1000A Voltage range The display and effective measurement ranges (ranges where accuracy is certain) of measurement ranges are as follows. 600V600 レンジV Effective measurement 有効測定範囲 range - 346~600V 660V 300Vレンジ 300 V 0.9V 6V Effective measurement 有効測定範囲 range - 200~277V 600V 780V 330V 150Vレンジ 150 V 0.23V 0.45V 3V Effective measurement 有効測定範囲 range 1.5V - 100~120V 150V 195V 66V 300V 390V 165V 60Vレンジ 60 V Effective measurement 有効測定範囲 range 0.09V 0.6V Display 表示範囲 range 60V 78V 0.1V 1.0V 10V 100V 1000V 電流レンジ 入力電圧 Input Voltage 5000A レンジ Set the nominal voltage so that it does not exceed the selected voltage range. 5500A You can use a nominal voltage of 346 to 600 V in a 600 V voltage range. You can use a nominal voltage of 200 to 277 V 有効測定範囲 in a 300 V voltage range. You can use a nominal voltage of 100 to 120 V in a 150 V voltage range. 7.5A 50A 5000A 6500A
216 210 Appendix Current range 5000A レンジ A Effective measurement 有効測定範囲 range 5500A 7.5A 50A 550A 5000A 6500A 500A 500 レンジ A Effective measurement 有効測定範囲 range 0.75A 5A 500A 650A 1A 10A 100A 1000A 10000A 110A 100Aレンジ 100 A Effective measurement 有効測定範囲 range 150mA 1A 100A 130A 55A 50Aレンジ A Effective measurement 有効測定範囲 range 5Aレンジ 5 A 75mA 500mA 50A 65A 10mA 100mA 1A 10A 100A 5.5A Effective measurement 有効測定範囲 range 7.5mA 50mA 5A 6.5A 550mA 0.5Aレンジ 0.5 A Effective measurement 有効測定範囲 range 0.75mA 5mA 500mA 650mA 1mA 10mA 100mA 1A 10A 入力電流 Input Current
217 TIME PLOT Recording Method Appendix 211 TIME PLOT screen ---- RMS, HARMONICS SYSTEM_DF2[MAIN]_[RECORDING] Interval setting period 200 ms (50 Hz: 10 waveforms, 60 Hz: 12 waveforms) RMS value 1 RMS value 2 RMS value 3 RMS value N MAX RMS value AVE RMS value MIN RMS value Recording Recording Recording ex. when Interval:1min, N=300 MAX and MIN values only for harmonics and inter-harmonics TIME PLOT screen ---- VOLTAGE SYSTEM_DF2[MAIN]_[RECORDING] Interval setting period 200 ms (50 Hz: 10 waveforms, 60 Hz: 12 waveforms) U 1 U 3 U 5 U 23 U 25 U 27 U 29 U 47 U 49 U 51 U 53 U 71 U 2 U 4 U 24 U 26 U 28 U 48 U 50 U 52 U 72 U U U N-23 N-21 N-19 U U N-22 N-20 U N-1 U N Voltage RMS value is calculated for one waveform shifted over half a wave. Recording MAX U NIN U Recording ex. when Interval: 1min, N=7200 (Example) 24 calculated values U exist within 200 ms at 60 Hz: 12 cycles.
218 212 Appendix Event Waveform Recording Method TIME PLOT screen ---- RMS, HARMONICS (Event setting -power and harmonics) SYSTEM_DF2[MAIN]_[RECORDING] Interval setting period 200 ms (50 Hz: 10 waveforms, 60 Hz: 12 waveforms) RMS calculation EVENT occur RMS calculation RMS calculation Event waveform recording period 50 Hz: 14 waveforms 60 Hz: 16 waveforms Displayed as event waveforms are 200 ms to which are added the two preceding waveforms and the following two waveforms. TIME PLOT screen ---- VOLTAGE (Event setting-voltage) SYSTEM_DF2[MAIN]_[RECORDING] Interval setting period 200 ms (50 Hz: 10 waveforms, 60 Hz: 12 waveforms) EVE U 1 U 3 U 5 U 23 U 25 U 29 U 47 U 49 U 51 U 53 U 71 NT U 2 U 4 U 24 U 26 U 28 U 48 U 50 U 52 U 72 U U U N-23 N-21 N-19 U U N-22 N-20 U N-1 U N Event waveform recording period 50 Hz: 14 waveforms 60 Hz: 16 waveforms Displayed as event waveforms are 200 ms to which are added the two preceding waveforms and the following two waveforms.

219 Appendix Detecting Anomalies and Phenomena Due to Drops in Power Quality 213 Troubles due to drops in power quality: Interruptions in the reception transformer and malfunctions in the terminal control device The light flickers. Sometimes the device does not work correctly. Light bulbs burn out more quickly. The reactor's condenser overheats. The OA device malfunctions. Sometimes the electrical overload, reverse phase, or missing phase relays malfunction. Detecting phenomena Power quality Waveform display Phenomenon Malfunction Transient overvoltage (impulse) Occurs due to phenomena such as lightning, breaker point damage, or closure on the circuit breaker or relay. Often occurs when there is a radical change in voltage or when the peak voltage is high. Close to the source of the break, the device s power is damaged because of exceptionally high voltages and this may cause the device to reset. Voltage dip (SAG) A momentary voltage drop occurs caused by large rush currents in the load, such as starting-up a motor. A drop in voltage may cause the device to stop operating or reset. Voltage swell (SURGE) Occurs when power lines subject to lightning strikes or heavy loads are opened and closed, causing the voltage to surge momentarily. A surge in voltage may cause the device s power to be damaged or the device to reset. Flicker Blast furnaces, arc welders, and thyristor control loads cause flicker, and voltage impulses occur regularly during single and multiple cycles. Because this phenomenon reoccurs regularly, it may cause the light to flicker or the device to malfunction. Instantaneous interruption Harmonics Circuit breaker trips occur, mainly caused by accidents at power companies (such as stops in power transmission because of lightning strikes) or short circuits, and the power supply stops momentarily or for an indefinite time. Many device power sources now use semiconductor control devices and harmonics occur because of distorted voltage or current waveforms. Recently, due to the spread of UPS (uninterruptible power sources), most of these problems can be fixed using a computer, but this may cause the device to stop operating due to an instantaneous interruption or to reset. When harmonic components become too large, they can cause serious accidents, such as overheating the motor transformer or burning out the reactor connected to the phase advance capacitor. Unbalance factor When the load of the specified phase becomes too heavy due to fluctuations in loads connected to each power line phases, or when operating an uneven device, the voltage and current waveforms become distorted, causing voltage drops Voltage imbalance, reverse phaseto-neutral voltage, and harmonics may cause accidents such as uneven motor rotation, 3E breaker trips, and overload heating in the transformer.
PowerMonic. FAQs [2/12]
![PowerMonic. FAQs [2/12]](/thumbs/86/94869864.jpg "PowerMonic. FAQs [2/12]") PowerMonic FAQs [2/12] Table of Contents FAQ 1. Why do I need to connect Phase A?... 2 FAQ 2. What is the purpose of the internal battery in a PowerMonic?... 2 FAQ 3. What power does a PowerMonic draw
PowerMonic FAQs [2/12] Table of Contents FAQ 1. Why do I need to connect Phase A?... 2 FAQ 2. What is the purpose of the internal battery in a PowerMonic?... 2 FAQ 3. What power does a PowerMonic draw
User Manual Power and Harmonics Analyzer Model PQ3350
 User Manual Power and Harmonics Analyzer Model PQ3350 Additional User Manual Translations available at www.extech.com EN 61010-2-032 CAT III 600V Pollution Degree 2 Definition of Symbols: Caution: Refer
Manual Supplement. This supplement contains information necessary to ensure the accuracy of the above manual.
 Manual Title: Supplement Issue: 7 CD Part Number: 4822 872 3093x Issue Date: 1/19 Print Date: January 2012 Page Count: 9 Revision/Date: 1, 6/12 This supplement contains information necessary to ensure
G4500. Portable Power Quality Analyser. Energy Efficiency through power quality
 G4500 Portable Power Quality Analyser Energy Efficiency through power quality The BlackBox portable series power quality analyser takes power quality monitoring to a whole new level by using the revolutionary
We ve got the best technology to fit your power monitoring needs. Scenario works on all!
 Version 1.21 Beta Release Reliable Power Meters 400 Blossom Hill Road Los Gatos, CA 95032 408-358-5100 Fax 408-358-4420 www.reliablemeters.com Scenario-Compatible RPM s Scenario software lets you build
User Manual. Power and Harmonics Analyzer Model PQ3350
 User Manual Power and Harmonics Analyzer Model PQ3350 EN 61010-2-032 CAT III 600V Pollution Degree 2 Definition of Symbols: Caution: Refer to Accompanying Documents Caution: Risk of Electric Shock Double
DIGITAL INSTRUMENTS S.R.L. SPM-ETH (Synchro Phasor Meter over ETH)
") DIGITAL INSTRUMENTS S.R.L. SPM-ETH (Synchro Phasor Meter over ETH) SPM-ETH (Synchro Phasor Meter over ETH) Digital Instruments 1 ver the years, an awareness of the criticality of the Power Grid and Orelated
DIGITAL INSTRUMENTS S.R.L. SPM-ETH (Synchro Phasor Meter over ETH) SPM-ETH (Synchro Phasor Meter over ETH) Digital Instruments 1 ver the years, an awareness of the criticality of the Power Grid and Orelated
Operating Instructions
 Operating Instructions HAEFELY TEST AG KIT Measurement Software Version 1.0 KIT / En Date Version Responsable Changes / Reasons February 2015 1.0 Initial version WARNING Introduction i Before operating
PQ-Box 100 Quick Start Instructions
 PQ-Box 100 Quick Start Instructions These instructions are provided for the purpose on providing a quick start to PQ-Box 100 installation and operation. Please refer to the user handbook for full details.
Full Disclosure Monitoring
 Full Disclosure Monitoring Power Quality Application Note Full Disclosure monitoring is the ability to measure all aspects of power quality, on every voltage cycle, and record them in appropriate detail
MCR3 POWER EQUIPMENT. Microprocessor Controlled Constant Current Regulator. Compliance with Standards. Uses. Features
 Microprocessor Controlled Constant Current Regulator Compliance with Standards FAA: ICAO: IEC: 61822 CENELEC: AC 150/5345-10 (current edition), L-828, L-829. Aerodrome Design Manual Part 5, para. 3.2 (current
MICROPROCESSOR-BASED METERING EQUIPMENT SECTION SECTION 16901
 MICROPROCESSOR-BASED METERING EQUIPMENT PART 2 PRODUCTS 2.01 MANUFACTURERS A. Eaton products B. C. The listing of specific manufacturers above does not imply acceptance of their products that do not meet
LED control gear Compact dimming. Uconverter LCAI 2x38 W 0500 K013 one4all ECO series. Ordering data
 Product description Dimmable built-in for LED Constant current (with 2 adjustable output channels) Designed for outdoor and street luminaire Output power 2 x 38 W Suitable for mains voltage peaks (burst/surge)
Manual PCE-830 power anlayser
 www.pce-indsutrial-needs.com Tursdale Technical Services Ltd Unit N12B Tursdale Business Park Co. Durham DH6 5PG United Kingdom Phone: +44 ( 0 ) 191 377 3398 Fax: +44 ( 0 ) 191 377 3357 info@tursdaletechnicalservices.co.uk
Copyright 2014 ZES ZIMMER Electronic Systems GmbH. LMG600 Series Introduction
 LMG600 Series Introduction ZES ZIMMER The Touchstone in Power Analysis Precision in Power is the guideline of. ZES ZIMMER is a German high-tech company specialized in developing, manufacturing and distribution
GFT channel Time Interval Meter
 Key Features Five-channel Time-Interval Meter: One Start and four Stops - 13 picosecond resolution - < 50 picosecond RMS jitter - > 100 second range - 10 MHz sample rate per channel Common GATE input Input
Quick Start. RSHS1000 Series Handheld Digital Oscilloscope
 Quick Start RSHS1000 Series Handheld Digital Oscilloscope General Safety Summary Carefully read the following safety precautions to avoid personal injury and prevent damage to the instrument or any products
Be sure to run the vehicle engine while using this unit to avoid battery exhaustion.
 CAUTION: TO REDUCE THE RISK OF ELECTRIC SHOCK DO NOT REMOVE COVER (OR BACK) NO USER-SERVICEABLE PARTS INSIDE REFER SERVICING TO QUALIFIED SERVICE PERSONNE; Please Read all of these instructions regarding
Certificate of Calibration
 Certificate of Calibration We hereby certify that this product has been calibrated and found to be in accordance with the applicable SPECIFICATIONS and STANDARDS. Accuracies of the standard equipment used
SC26 Magnetic Field Cancelling System
 SPICER CONSULTING SYSTEM SC26 SC26 Magnetic Field Cancelling System Makes the ambient magnetic field OK for electron beam tools in 300 mm wafer fabs Real time, wideband cancelling from DC to > 9 khz fields
T5, T8, TC-L. PC T5 PRO lp W V 50/60/0 Hz, HO. Electronic ballasts Linear lamps T5, T8 and compact lamps TC-L
 T, T8, TC-L Electronic ballasts PC T PRO lp 80 W 0 0 V 0/0/0 Hz, HO L D,1 0, 1 side fixing feature side fixing feature ø,1 defined lamp warm start is 1. s constant light output independent of fluctuations
AMIQ-K2 Program for Transferring Various-Format I/Q Data to AMIQ. Products: AMIQ, SMIQ
 Products: AMIQ, SMIQ AMIQ-K2 Program for Transferring Various-Format I/Q Data to AMIQ The software AMIQ-K2 enables you to read, convert, and transfer various-format I/Q data files to AMIQ format. AMIQ-K2
SC24 Magnetic Field Cancelling System
 SPICER CONSULTING SYSTEM SC24 SC24 Magnetic Field Cancelling System Makes the ambient magnetic field OK for the electron microscope Adapts to field changes within 100 µs Touch screen intelligent user interface
OPERATING INSTRUCTIONS
 OPERATING INSTRUCTIONS MATRIX SYSTEM SX-2000 SERIES Thank you for purchasing TOA's Matrix System. Please carefully follow the instructions in this manual to ensure long, trouble-free use of your equipment.
multi-function meters
 multi-function meters eclipse 2 eclipse 7 installation and operating manual 1 GENERAL DESCRIPTION 2 INSTALLATION 3 WIRING INFORMATION 4 2 ECLIPSE 2 METERS 2.1 PROGRAMMING THE METER 5 2.2 INFORMATION 6
SC24 Magnetic Field Cancelling System
 SPICER CONSULTING SYSTEM SC24 SC24 Magnetic Field Cancelling System Makes the ambient magnetic field OK for the electron microscope Adapts to field changes within 100 µs Touch screen intelligent user interface
Part names (continued) Remote control
 Remote control") Introduction Part names (continued) Remote control (1) STANDBY ( 25) (1) (2) ON ( 25) (3) (3) ID - 1 / 2 / 3 / 4 s ( 18) (4) (4) COMPUTER 1 ( 27) (7) (5) COMPUTER 2 * (8) (6) COMPUTER 3 * (10) (13) (7)
Introduction Part names (continued) Remote control (1) STANDBY ( 25) (1) (2) ON ( 25) (3) (3) ID - 1 / 2 / 3 / 4 s ( 18) (4) (4) COMPUTER 1 ( 27) (7) (5) COMPUTER 2 * (8) (6) COMPUTER 3 * (10) (13) (7)
MICROMASTER Encoder Module
 MICROMASTER Encoder Module Operating Instructions Issue 01/02 User Documentation Foreword Issue 01/02 1 Foreword Qualified Personnel For the purpose of this Instruction Manual and product labels, a Qualified
PRINCIPLES AND APPLICATIONS
 GENERATION & NETWORK Digital Automation Measuring and Control Devices AMS7000 PROCOM The optimum operation of an electrical network depends particularly on the reliability and the availability of the protection,
2 MHz Lock-In Amplifier
 2 MHz Lock-In Amplifier SR865 2 MHz dual phase lock-in amplifier SR865 2 MHz Lock-In Amplifier 1 mhz to 2 MHz frequency range Dual reference mode Low-noise current and voltage inputs Touchscreen data display
WELDING CONTROL UNIT: TE 450 USER MANUAL
 j WELDING CONTROL UNIT: TE 450 USER MANUAL RELEASE SOFTWARE No. 1.50 DOCUMENT NUMBER: MAN 4097 EDITION: MARCH 1998 This page is left blank intentionally. 2 / 34 TABLE OF CONTENTS SUBJECTS PAGE WELDING
DT9857E. Key Features: Dynamic Signal Analyzer for Sound and Vibration Analysis Expandable to 64 Channels
 DT9857E Dynamic Signal Analyzer for Sound and Vibration Analysis Expandable to 64 Channels The DT9857E is a high accuracy dynamic signal acquisition module for noise, vibration, and acoustic measurements
Fluke 430 Series Three-Phase Power Quality Analyzers
 Fluke 430 Series Three-Phase Power Quality Analyzers Pinpoint power problems faster, safer and in greater detail Technical Data The Fluke 434 and 433 three-phase power quality analyzers help you locate,
1.2 General Description
 Note: It is suggested that the foldout at the back of the manual be extended when using this manual. The FOLDOUT, a front view of the AM-48, defines the numbers of the switches which are used to identify
Clamp 200 A AC/DC (+ V AC/DC + Ω)
") PCE-DC1 Clamp meter 200 A AC/DC & Freq. LC display 3 2/3 digits, with backlight measures AC / DC current, AC voltage & frequency Hold function / DC A zero reset function tests voltage without contact automatic
PCE-DC1 Clamp meter 200 A AC/DC & Freq. LC display 3 2/3 digits, with backlight measures AC / DC current, AC voltage & frequency Hold function / DC A zero reset function tests voltage without contact automatic
PA9PLUS Portable Power Quality Analyzer
 PA9PLUS A ruggedized, full-featured instrument measuring to worldwide power quality standards (EN50160, IEC61000-4-15, IEEE1159/519) Trends voltage, current, imbalance, power, energy, events, flicker (PST/PLT),
Operating Instructions
 CNTX Contrast sensor Operating Instructions CAUTIONS AND WARNINGS SET-UP DISTANCE ADJUSTMENT: As a general rule, the sensor should be fixed at a 15 to 20 angle from directly perpendicular to the target
I/A Series Hardware Fiber Optic LAN Converter
 I/A Series Hardware PSS 21H-7F3 B4 The provides bidirectional conversion between coaxial and fiber optic media. The converter is compatible with existing I/A Series system hardware, utilizes industry standard
POWER MONITORS ENERIUM RANGE. Minimize your energy consumption and optimize your installation
 POWER MONITORS ENERIUM RANGE Minimize your energy consumption and optimize your installation From 0.2s critical electricity metering to the collection of metering data on all utilities Electrical feeder
MachineryMate 800 operating guide Handheld vibration meter
 MachineryMate 800 operating guide Handheld vibration meter Wilcoxon Sensing Technologies 20511 Seneca Meadows Parkway, Germantown MD 20876, USA Amphenol (Maryland), Inc d/b/a Wilcoxon Sensing Technologies
SignalTap Plus System Analyzer
 SignalTap Plus System Analyzer June 2000, ver. 1 Data Sheet Features Simultaneous internal programmable logic device (PLD) and external (board-level) logic analysis 32-channel external logic analyzer 166
Portable Performance for Debug and Validation
 WaveJet 300A Oscilloscopes 100 MHz 500 MHz Portable Performance for Debug and Validation A UNIQUE TOOLSET FOR PORTABLE OSCILLOSCOPES Key Features 100 MHz, 200 MHz, 350 MHz and 500 MHz bandwidths Sample
Noise Detector ND-1 Operating Manual
 Noise Detector ND-1 Operating Manual SPECTRADYNAMICS, INC 1849 Cherry St. Unit 2 Louisville, CO 80027 Phone: (303) 665-1852 Fax: (303) 604-6088 Table of Contents ND-1 Description...... 3 Safety and Preparation
Advanced Test Equipment Rentals ATEC (2832)
") Established 1981 Advanced Test Equipment Rentals www.atecorp.com 800-404-ATEC (2832) Test All Products Operating from AC Power Voltage ranges up to 400 V RMS, L-N Standard 135/270 V or optional ranges
Established 1981 Advanced Test Equipment Rentals www.atecorp.com 800-404-ATEC (2832) Test All Products Operating from AC Power Voltage ranges up to 400 V RMS, L-N Standard 135/270 V or optional ranges
C200H-AD002/DA002 Analog I/O Units Operation Guide
 C200H-AD002/DA002 Analog I/O Units Operation Guide Revised September 1995 Notice: OMRON products are manufactured for use according to proper procedures by a qualified operator and only for the purposes
Dimming actuators GDA-4K KNX GDA-8K KNX
 Dimming actuators GDA-4K KNX GDA-8K KNX GDA-4K KNX 108394 GDA-8K KNX 108395 Updated: May-17 (Subject to changes) Page 1 of 67 Contents 1 FUNCTIONAL CHARACTERISTICS... 4 1.1 OPERATION... 5 2 TECHNICAL DATA...
ME EN 363 ELEMENTARY INSTRUMENTATION Lab: Basic Lab Instruments and Data Acquisition
 ME EN 363 ELEMENTARY INSTRUMENTATION Lab: Basic Lab Instruments and Data Acquisition INTRODUCTION Many sensors produce continuous voltage signals. In this lab, you will learn about some common methods
User Manual CC DC 24 V 5A. Universal Control Unit UC-1-E. General Information SET. Universal Control Unit UC-1 Of Central Lubrication PAUSE CONTACT
 Universal Control Unit UC-1-E User Manual General Information Universal Control Unit UC-1 Of Central Lubrication CC DC 24 V 5A / M 15 SL /MK 31 M Z 30 General Information Contents Universal Control Unit
F250. Advanced algorithm enables ultra high speed and maximum flexibility. High-performance Vision Sensor. Features
 High-performance Vision Sensor Advanced algorithm enables ultra high speed and maximum flexibility Features Inspection and positioning that was difficult with previous vision sensors is now surprisingly
Oscilloscope Guide Tektronix TDS3034B & TDS3052B
 Tektronix TDS3034B & TDS3052B Version 2008-Jan-1 Dept. of Electrical & Computer Engineering Portland State University Copyright 2008 Portland State University 1 Basic Information This guide provides basic
# Voltage Performance Monitor Instruction Manual. 99 Washington Street Melrose, MA Fax TestEquipmentDepot.
 99 Washington Street Melrose, MA 02176 Fax 781-665-0780 TestEquipmentDepot.com #61-830 IMPORTANT SAFETY INFORMATION Voltage Performance Monitor Instruction Manual Safety: This tester should only be used
RIGOL. Quick Guide DSA800E. DSA800E Series Spectrum Analyzer RIGOL TECHNOLOGIES, INC. All Rights Reserved.
 RIGOL Quick Guide 2016 RIGOL TECHNOLOGIES, INC. All Rights Reserved. DSA800E DSA800E Series Spectrum Analyzer General Inspection 1. Inspect the shipping container for damage If your shipping container
Signal Stability Analyser
 Signal Stability Analyser o Real Time Phase or Frequency Display o Real Time Data, Allan Variance and Phase Noise Plots o 1MHz to 65MHz medium resolution (12.5ps) o 5MHz and 10MHz high resolution (50fs)
clipping; yellow LED lights when limiting action occurs. Input Section Features
 ELX-1A Rack-Mount Mic/Line Mixer Four inputs, one output in a single rack space Very-highery-high-quality audio performance High reliability Extensive filtering circuitry and shielding protect against
SNG-2150C User s Guide
 SNG-2150C User s Guide Avcom of Virginia SNG-2150C User s Guide 7730 Whitepine Road Revision 001 Richmond, VA 23237 USA GENERAL SAFETY If one or more components of your earth station are connected to 120
The DataView PowerPad III Control Panel
 Setting Up a Recording Session in the DataView PowerPad III Control Panel By Mike Van Dunk The DataView PowerPad III Control Panel is designed for working with AEMC PowerPad III Power Quality Analyzers,
Getting started with
 Getting started with Electricity consumption monitoring single phase for homes and some smaller light commercial premises OVERVIEW: The OWL Intuition-e electricity monitoring system comprises of three
Simple all-in-one design style with front stereo speakers and natural ventilation system
 LMD-B170 17-inch cost-effective, lightweight basic grade Full HD LCD monitor for versatile use Overview Lightweight and slim Full HD (1920 x 1080) LMD-B Series monitor with an excellent cost-performance
EMS DATA ACQUISITION AND MANAGEMENT (LVDAM-EMS) MODEL 9062-C
 MODEL 9062-C") A Electric Power / Controls 2 kw EMS DATA ACQUISITION AND MANAGEMENT (LVDAM-EMS) MODEL 9062-C GENERAL DESCRIPTION The Lab-Volt Data Acquisition and Management for Electromechanical Systems (LVDAM-EMS),
A Electric Power / Controls 2 kw EMS DATA ACQUISITION AND MANAGEMENT (LVDAM-EMS) MODEL 9062-C GENERAL DESCRIPTION The Lab-Volt Data Acquisition and Management for Electromechanical Systems (LVDAM-EMS),
COLOR TFT LCD MONITOR. Manual
 COLOR TFT LCD MONITOR Manual Safety defended: Properly maintains your system to be possible to guarantee its service life and to reduce the damage risk. It should avoid the damp and exceeding temperature
USER MANUAL. 27 Full HD Widescreen LED Monitor L270E
 USER MANUAL 27 Full HD Widescreen LED Monitor L270E TABLE OF CONTENTS 1 Getting Started 2 Control Panel/ Back Panel 3 On Screen Display 4 Technical Specs 5 Care & Maintenance 6 Troubleshooting 7 Safety
Getting Started with the LabVIEW Sound and Vibration Toolkit
 1 Getting Started with the LabVIEW Sound and Vibration Toolkit This tutorial is designed to introduce you to some of the sound and vibration analysis capabilities in the industry-leading software tool
COLOR TFT LCD MONITOR WITH MULTI-TOUCH FUNCTION Manual
 COLOR TFT LCD MONITOR WITH MULTI-TOUCH FUNCTION Manual DEAR CUSTOMERS Thank you for choosing our TFT LCD (liquid crystal display) monitor. This product employs integrate circuits, low power consumption,
HOME GUARD USER MANUAL
 HOME GUARD USER MANUAL CONTENTS 1. SAFETY PRECAUTIONS...2 2. INTRODUCTION...3 3. FEATURES...4 4. ACCESSORIES...5 5. INSTALLATION...6 6. NAME and FUNCTION of EACH PART...7 6.1 Front Pannel...7 6.2 Monitoring
RSSL1:1-KuXER. Outdoor Unit (ODU) Ku Ext Ref LNB Redundancy System with external 10 MHz Reference System. Mux/Tee. Coax cable
 Ku Ext Ref LNB Redundancy System with external 10 MHz Reference System. Mux/Tee. Coax cable") RSSL1:1-KuXER Ku Ext Ref LNB Redundancy System with external 10 MHz Reference System Outdoor Unit (ODU) Waveguide Switch & Status LNB 1 Coax cable Interface Terminal LNB 2 Indoor Unit Outdoor Unit Indoor
RSSL1:1-KuXER Ku Ext Ref LNB Redundancy System with external 10 MHz Reference System Outdoor Unit (ODU) Waveguide Switch & Status LNB 1 Coax cable Interface Terminal LNB 2 Indoor Unit Outdoor Unit Indoor
SigPlay User s Guide
 SigPlay User s Guide . . SigPlay32 User's Guide? Version 3.4 Copyright? 2001 TDT. All rights reserved. No part of this manual may be reproduced or transmitted in any form or by any means, electronic or
Hybrid Chart Recorder 250 mm (10")
") Hybrid Chart Recorder 250 mm (10") RD5100 Series U High Speed Scanning at 36 Points/Sec and High-Speed Recording U High Accuracy of 0.05% U Various Industrial Values Can be Measured at the Same Time with
Hybrid Chart Recorder 250 mm (10") RD5100 Series U High Speed Scanning at 36 Points/Sec and High-Speed Recording U High Accuracy of 0.05% U Various Industrial Values Can be Measured at the Same Time with
LED control gear Compact fixed output
 Driver LC 40W 900mA fixc SR SNC ESSENCE series Product description Independent fixed output LED Driver Constant current LED Driver Output current 900 ma Max. output power 39 W Nominal life-time up to 50,000
Special Applications Modules
 (IC697HSC700) datasheet Features 59 1 IC697HSC700 a45425 Single slot module Five selectable counter types 12 single-ended or differential inputs TTL, Non-TTL and Magnetic Pickup input thresholds Four positive
ORM0022 EHPC210 Universal Controller Operation Manual Revision 1. EHPC210 Universal Controller. Operation Manual
 ORM0022 EHPC210 Universal Controller Operation Manual Revision 1 EHPC210 Universal Controller Operation Manual Associated Documentation... 4 Electrical Interface... 4 Power Supply... 4 Solenoid Outputs...
HYL-080D1750G358. Constant current LED driver DALI Dimmable. LED Driver. Product description. Benefits. Interfaces.
 Linear / area dimming Constant current LED driver DALI Dimmable Product description Dimmable built-in constant current LED Driver Adjustable output current between 1,050 and 1,750mA via DIP switch Max.
ORDERING Page 6 BASLER RELAY STANDARDS, DIMENSIONS, ACCESSORIES Request bulletin SDA
 BE1-59NC CAPACITOR NEUTRAL OVERVOLTAGE RELAY The BE1-59NC Capacitor Neutral Overvoltage Relay provides sensitive protection for capacitor banks. ADDITIONAL INFORMATION INSTRUCTION MANUAL ADVANTAGES Helps
Oscilloscopes, logic analyzers ScopeLogicDAQ
 Oscilloscopes, logic analyzers ScopeLogicDAQ ScopeLogicDAQ 2.0 is a comprehensive measurement system used for data acquisition. The device includes a twochannel digital oscilloscope and a logic analyser
Network Disk Recorder WJ-ND200
 Network Disk Recorder WJ-ND200 Network Disk Recorder Operating Instructions Model No. WJ-ND200 ERROR MIRROR TIMER HDD1 REC LINK /ACT OPERATE HDD2 ALARM SUSPEND ALARM BUZZER STOP Before attempting to connect
LED Driver Linear / area fixed output
 Driver LC 10W 350mA fixc lp SNC2 ESSENCE series Product description Fixed output built-in LED Driver Constant current LED Driver Output current 350 ma Max. output power 10.2 W Up to 80 % efficiency For
Analog Dual-Standard Waveform Monitor
 Test Equipment Depot - 800.517.8431-99 Washington Street Melrose, MA 02176 - TestEquipmentDepot.com Analog Dual-Standard Waveform Monitor 1741C Datasheet Additional Analysis Features Timing Display for
Experiment 13 Sampling and reconstruction
 Experiment 13 Sampling and reconstruction Preliminary discussion So far, the experiments in this manual have concentrated on communications systems that transmit analog signals. However, digital transmission
NanoGiant Oscilloscope/Function-Generator Program. Getting Started
 Getting Started Page 1 of 17 NanoGiant Oscilloscope/Function-Generator Program Getting Started This NanoGiant Oscilloscope program gives you a small impression of the capabilities of the NanoGiant multi-purpose
K3NX Process Meter OPERATION MANUAL
 Cat.No. N90 E1 1 K3NX Process Meter OPERATION MANUAL K3NX Process Meter Operation Manual Produced January 1998 Notice: OMRON products are manufactured for use according to proper procedures by a qualified
MULTIMIX 8/4 DIGITAL AUDIO-PROCESSING
 MULTIMIX 8/4 DIGITAL AUDIO-PROCESSING Designed and Manufactured by ITEC Tontechnik und Industrieelektronik GesmbH 8200 Laßnitzthal 300 Austria / Europe MULTIMIX 8/4 DIGITAL Aim The most important aim of
EDL8 Race Dash Manual Engine Management Systems
 Engine Management Systems EDL8 Race Dash Manual Engine Management Systems Page 1 EDL8 Race Dash Page 2 EMS Computers Pty Ltd Unit 9 / 171 Power St Glendenning NSW, 2761 Australia Phone.: +612 9675 1414
PicoScope 4000 Automotive PC Oscilloscopes
 PicoScope 4000 Automotive PC Oscilloscopes User's Manual ps4000a.en-1 Copyright 2008 Pico Technology Ltd. All rights reserved. Contents I Contents 1 Introduction...1 1 Overview...1...1 2 Minimum PC requirements...2
Quick Reference Guide
 Multimedia Projector Quick Reference Guide MODEL 103-011100-01 Projection lens is optional. English Use this book as a reference guide when setting up the projector. For detailed information about installation,
AES-402 Automatic Digital Audio Switcher/DA/Digital to Analog Converter
 Broadcast Devices, Inc. AES-402 Automatic Digital Audio Switcher/DA/Digital to Analog Converter Technical Reference Manual Broadcast Devices, Inc. Tel. (914) 737-5032 Fax. (914) 736-6916 World Wide Web:
BUREAU OF ENERGY EFFICIENCY
 Date: 26 th May, 2016 Schedule No.: 11 Color Televisions 1. Scope This schedule specifies the energy labeling requirements for color televisions with native resolution upto 1920 X 1080 pixels, of CRT,
REMOTE I/O R30 SERIES. PC CONFIGURATOR SOFTWARE Model: R30CFG Ver Users Manual
 REMOTE I/O R30 SERIES PC CONFIGURATOR SOFTWARE Model: R30CFG Ver. 1.13 Users Manual 5-2-55, Minamitsumori, Nishinari-ku, Osaka 557-0063 JAPAN Tel: +81-6-6659-8201 Fax: +81-6-6659-8510 http://www.m-system.co.jp/
CATV & DOCSIS3.0 Meter / Analyzer. Purchase from:
 EN CATV & DOCSIS3.0 Meter / Analyzer Overview Introducing the H30. New from Televes, a go-to meter designed with the needs of a Cable TV operator in mind. The H30 is a light weight, rugged unit, packed
P XGA TFT Monitor. User s Manual
 P6151 15 XGA TFT Monitor User s Manual Disclaimers This manual has been carefully checked and believed to contain accurate information. Axiomtek Co., Ltd. assumes no responsibility for any infringements
LED Driver Compact fixed output
 Driver LC 45W 1050mA fixc C SNC ESSENCE series Product description Fixed output built-in LED Driver Constant current LED Driver Output current 1,050 ma output power 45 W Nominal life-time up to 50,000
Integrated Remote Commander
 3-244-192-12 (1) Integrated Remote Commander Operating Instructions RM-VL1000 2002 Sony Corporation WARNING To prevent fire or shock hazard, do not expose the unit to rain or moisture. To avoid electrical
E X P E R I M E N T 1
 E X P E R I M E N T 1 Getting to Know Data Studio Produced by the Physics Staff at Collin College Copyright Collin College Physics Department. All Rights Reserved. University Physics, Exp 1: Getting to
RD RACK MOUNT DIMMER OWNERS MANUAL VERSION /09/2011
 RD - 122 RACK MOUNT DIMMER OWNERS MANUAL VERSION 1.3 03/09/2011 Page 2 of 14 TABLE OF CONTENTS UNIT DESCRIPTION AND FUNCTIONS 3 POWER REQUIREMENTS 3 INSTALLATION 3 PLACEMENT 3 POWER CONNECTIONS 3 OUTPUT
Major Differences Between the DT9847 Series Modules
 DT9847 Series Dynamic Signal Analyzer for USB With Low THD and Wide Dynamic Range The DT9847 Series are high-accuracy, dynamic signal acquisition modules designed for sound and vibration applications.
HD-CM HORIZON DIGITAL CABLE METER
 HD-CM OFF! Max RF i/p = +17dBm 75Ω Max AC/DC i/p = 120Vrms MENU INPUT ON HORIZON DIGITAL CABLE METER Horizon Global Electronics Ltd. Unit 3, West Side Flex Meadow Harlow, Essex CM19 5SR Phone: +44(0) 1279
Multifunction Digital Timer
 Multifunction Digital Timer 72 x72 mm Timer with Easy-to-use Functions Nine output modes accommodate a wide variety of applications. All parameters set by scroll-through menus accessed from the front panel.
Electronic Panel Meters DIGEM Preference Program Process control, automation & laboratory uses Class 0.01 to 1 Current, Voltage, Frequency,
 Electronic Panel Meters DIGEM Preference Program Process control, automation & laboratory uses Class 0.01 to 1 Current, Voltage, Frequency, Temperature, RPM, Pressure, etc. LED/ LCD displays 1999 to 99999
R&S SLx8000 Family of UHF/VHF Transmitters Efficient solutions for analog and digital broadcasting standards
 Broadcasting Data Sheet 02.01 R&S SLx8000 Family of UHF/VHF Transmitters Efficient solutions for analog and digital broadcasting standards R&S SLx8000 Family of UHF/VHF Transmitters At a glance The UHF/VHF
Contact-Type Digital Displacement Sensor. HG-S Series. User's Manual WUME-HGS panasonic.net/id/pidsx/global
 Contact-Type Digital Displacement Sensor HG-S Series User's Manual WUME-HGS-4 2017.1 panasonic.net/id/pidsx/global (MEMO) 2 Panasonic Industrial Devices SUNX Co., Ltd. 2017 Thank you for purchasing an
SingMai Electronics SM06. Advanced Composite Video Interface: HD-SDI to acvi converter module. User Manual. Revision 0.
 SM06 Advanced Composite Video Interface: HD-SDI to acvi converter module User Manual Revision 0.4 1 st May 2017 Page 1 of 26 Revision History Date Revisions Version 17-07-2016 First Draft. 0.1 28-08-2016
SmartCrystal Cinema Neo
 Model VPSP-11100 www.volfoni.com 1 SUMMARY SUMMARY... 2 I. PRODUCT OVERVIEW... 3 II. REQUIREMENTS... 3 III. SMARTCRYSTAL CINEMA NEO FEATURES... 5 A. General specifications... 5 B. Technical specifications...