The One Penny Whiteboard
|
|
|
- Lewis Freeman
- 6 years ago
- Views:
Transcription
1 The One Penny Whiteboard Ongoing, in the moment assessments may be the most powerful tool teachers have for improving student performance. For students to get better at anything, they need lots of quick rigorous practice, spaced over time, with immediate feedback. The One Penny Whiteboards can do just that.
2 To add the One Penny White Board to your teaching repertoire, just purchase some sheet protectors and white board markers (see the following slides). Next, find something that will erase the whiteboards (tissues, napkins, socks, or felt). Finally, fill each sheet protector (or have students do it) with 1 or 2 sheets of card stock paper to give it more weight and stability.
3
4
5 On Amazon, markers can be found as low as $0.63 each. (That s not even a bulk discount. Consider low odor for students who are sensitive to smells.)

6 I like the heavy-weight model.

7 On Amazon, Avery protectors can be found as low as $0.09 each.
8 One Penny Whiteboards and The Templates The One Penny Whiteboards have advantages over traditional whiteboards because they are light, portable, and able to contain a template. (A template is any paper you slide into the sheet protector). Students find templates helpful because they can work on top of the image (number line, graph paper, hundreds chart ) without having to draw it first. For more templates go to
9 Using the One Penny Whiteboards There are many ways to use these whiteboards. One way is to pose a question, and then let the students work on them for a bit. Then say, Check your neighbor s answer, fix if necessary, then hold them up. This gets more students involved and allows for more eyes and feedback on the work.
10 Using the One Penny Whiteboards Group Game One way to use the whiteboards is to pose a challenge and make the session into a kind of game with a scoring system. For example, make each question worth 5 possible points. Everyone gets it right: 5 points Most everyone (4 fifths): 4 points More than half (3 fifths): 3 points Slightly less than half (2 fifths): 2 points A small number of students (1 fifth): 1 point Challenge your class to get to 50 points. Remember students should check their neighbor s work before holding up the whiteboard. This way it is cooperative and competitive.
11 Using the One Penny Whiteboards Without Partners Another way to use the whiteboards is for students to work on their own. Then, when students hold up the boards, use a class list to keep track who is struggling. After you can follow up later with individualized instruction.
12 Keep the Pace Brisk and Celebrate Mistakes However you decide to use the One Penny Whiteboards, keep it moving! You don t have to wait for everyone to complete a perfect answer. Have students work with the problem a bit, check it, and even if a couple kids are still working, give another question. They will work more quickly with a second chance. Anytime there is an issue, clarify and then pose another similar problem. Celebrate mistakes. Without them, there is no learning. Hold up mistakes and say, Now, here is an excellent mistake one we can all learn from. What mistake is this? Why is this tricky? How do we fix it?
13 The Questions Are Everything! The questions you ask are critical. Without rigorous questions, there will be no rigorous practice or thinking. On the other hand, if the questions are too hard, students will be frustrated. They key is to jump back and forth from less rigor to more rigor. Also, use the models written by students who have the correct answer to show others. Once one person gets it, they all can get it.
14 Questions When posing questions for the One Penny Whiteboard, keep several things in mind: 1. Mix low and high level questions 2. Mix the strands (it may be possible to ask about fractions, geometry, and measurement on the same template) 3. Mix in math and academic vocabulary (Calculate the area use an expression determine the approximate difference) 4. Mix verbal and written questions (project the written questions onto a screen to build reading skills) 5. Consider how much ink the answer will require and how much time it will take a student to answer (You don t want to waste valuable ink and you want to keep things moving.) 6. To increase rigor you can: work backwards, use variables, ask what if, make multi-step problems, analyze a mistake, ask for another method, or ask students to briefly show why it works
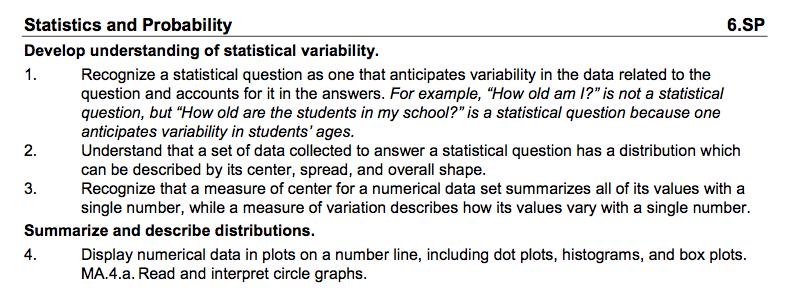
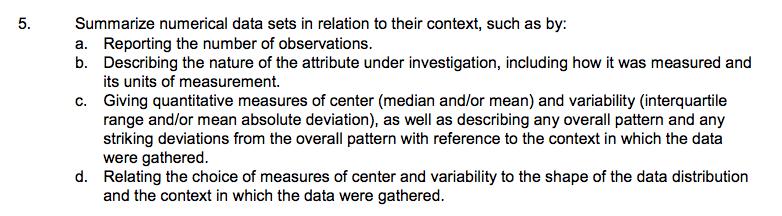
15 Examples What follows are some sample questions that address some concepts and skills indentified beginning in Grade 6 SP 4-5. There are many other concepts within this strand. This is only a sample. Each of these questions can be solved on the One Penny Whiteboard. To mix things up, you can have students chant out answers in choral fashion for some rapid fire questions. You can also have students hold up fingers to show which answer is correct. Remember, to ask verbal follow-ups to individual students: Why does that rule work? How do you know you are right? Is there another way? Why is this wrong?
16
17 Teachers: Print the next slide and then have students insert it into their whiteboards.
18
19 Type One Writing: On a sheet of paper, write down 3 or more possible questions that might be asked about the graphic below.
20 Type 1 1. What is the line plot showing? 2. How many studios in sample? 3. What method did they use to get this data? Is it random? 4. What is the range? (Spread, variation) 5. What is the mode? 6. What is the median? (measure of center) 7. What is the mean? (measure of center) 8. What studio sizes would you need to add to raise the mean to 1200 sq. feet? 9. How would the median be affected by adding a 1400 square foot studio to the data? 10. Is there an outlier? What is the shape of the data? 11. What fraction is above 1200 sq. feet? 12. What is the inter-quartile range? Mean absolute deviation? 13. Make a bar graph, stem and leaf graph, histogram, circle graph, or box plot from this data.
21 Solve the following problems on your whiteboard then check with your partner. On my signal, hold up your whiteboards. Then I will show the answer and the reason why
22 Circle the mode. What does the term mode mean? Raise your hand: What does the mode mean in this situation? If you were an architect how might you use this data? Mode is most frequently occurring number in the sample sq feet it the mode for this sample.
23 The mode means the most frequent size of the studios. In this sample, the most common studio size is 1000 square feet. If an architect was hired to plan a building with a number of studios, he or she might want to know what studio sizes were most common. Often the common sizes are most popular with artists. You can think of classroom sizes as a comparison. What are the most popular sizes for classrooms? Too small not good too large too cold, not intimate
24 Add studios to this graph so that the mode will change to 1300 feet. Add studios to this graph so that there are two modes 800 square feet and 1100 square feet. X X X X X X X
25 You own these studios. Each month the 10 artists, who each rent a studio, give you a rent check for their studio space. You charge $2 per square foot. How much will you receive for the largest space? Show your work. Rate per sq. ft * size of studio = amount collected $2/per square ft * 1500 sq ft. = $3000
26 You own these studios. Every month each of the 10 artists give you a rent check for the studio. You charge $2 per square foot. How much will you receive in total for the two smallest spaces? Show your work. Rate per sq. ft * size of studio * studios = amount collected $2/per square ft * 800 sq ft * 2 studios = $3200
27 Assuming the studios are rectangular, what are the likely dimensions of the largest studio? L * w = area L * w = 1500 sq. ft Two of many possibilities: 50ft * 30ft = 1500 sq ft. (square-ish) or 75 ft by 20 feet (long narrow)
28 What are the likely dimensions of the smallest studio? L * w = area L * w = 800 sq. ft 40ft * 20ft = 800 sq. ft (square-ish) Or 50 ft by 16 ft (long and narrow) 80 ft by 10 ft (really long and narrow)

29 What is the range for studio size? Range = maximum minimum R = R = 700 sq. ft
30 Eliminate the studio that measures 1500 sq. feet. What is the range now? Show your work Range = maximum minimum R = R = 500 sq. ft
31 As the owner of the building, is it good to have a large range of studio sizes available for rent? Turn to your neighbor, explain your answer briefly. Make a few notes on your whiteboard.
32 A large range might be good because you could accommodate the needs of different artists. If someone needs a large space and can afford it, you can offer a large space of 1500 feet. Someone else might be looking for a small space because they have a limited budget. If you have a large range of space sizes, then you can have more to offer. Having a small range might be advantageous also. For example, converting the large studio into two smaller ones might make sense if there was a great demand for small studios. So, in some situations, it might make sense to have a smaller range of studios, but only if you knew the demand and knew the large spaces would go unrented.
33 Find the median of the studio sizes. Show your work = 1050 range of studios is 1050 sq. feet
34 Another way to see it 10 points 2 = 5 5 points above 5 points below. 50% of data 50% of data 1050
35 What fraction of the studios are above 1050? What fraction of the studios are below 1050? What % of the studios are below 1050? Below? 5/10 =1/2 5/10 =1/2 50% 50% 1050
36 Eliminate the studio with 1500 square feet. What is the new median? 1000 square feet is the new median. 50% of data equal or above 1000 and 50% equal or below 1000 square feet.

37 Eliminate the studio with 1500 square feet. And the two studios of 800 feet. What is the new median? 1100 square feet is the new median. 50% of data equal or above 1100 and 50% equal or below 1100 square feet.
38 The median is Add two studios that won t change the median area. Or Add a studio any above as long as you add one below the median. Or add studios on the median! X X X X X X 1050
39 What fraction of studios are greater than 1200 sq. feet? What percent? 2/10 = 20/100 = 20% 2/10
40 What fraction of studios are less than 1200 sq. feet? What percent? 7/10 = 20/100 = 70% 7/10
41 What fraction of studios are greater than 1000 sq. feet but less than 1300 square feet? (1000< X < 1300) 3/10 What percent? 3/10 = 30/100 = 30%
42 Make a statement on your white board, that has an answer of 80% (8/10 = 4/5) of the studios. Is this correct? 80% of studios that are less than or equal to 1300 feet. No. 80% of studios that are less than 1300 feet.
43 Make a statement on your white board, that has an answer of 10% of the studios.


44 Only three studios had more area than Maria s studio. Circle the area of Maria s studio. Maria s studio
45 Only two studios were smaller than Joe s studio. Circle the area of Joe s studio. Joe s studio
46 Only studios are greater/smaller than mine. Make up your own question. Raise your hand.
47 Find the mean area of the studios. The sum of the studio areas is 10,800 sq. feet Show your work Mean = Sum of data/# of data points 10800/10 = 1080 Mean = 1080 sq. ft
48 Eliminate the 1,300 and 1,500 studios. Find the mean area of the remaining studios. Mean = Sum of data/# of data points [(2(800) + 3(1000) + 2(1100) ](1/8) = 1000 Mean = 1000 sq. ft
49 If the mean is 1,080 sq. feet add 2 studios that won t change the mean. Mean = 1080 one solution: Add 1100 (20 higher) and 1060 (20 less) X X
50 If you had a group of 10 studios with a mean of 1300 square feet. What would be the sum of the areas? 1300 * 10 studios = 13,000
51 If you had a group of 10 studios with a mean of 800 square feet. What would be the sum of the areas? 800 * 10 studios = 8,000
52 If you had a group of 11 studios with a mean of 800 square feet. What would be the sum of the areas? 800 * 11 studios = 8,800
53 Here you have a group of 10 studios with a mean of 1080 square feet. What is the sum of the areas? 1080 * 10 studios = 10,800
54 If you wanted to add 1 studio and lower the mean for 11 studios to What size studio would you add? 1000 * 11 studios = 11,000 new total. 10,800 now. 11,000 10,800 = 200 add a 200 sq. ft studio
55 4000 Imagine there a new studio added to this sample. It was 4000 square feet. Which would it affect more... the mean or the median? Why? Old Median = 1050 Old mean = 10800/10 = 1080 New Median = 1100 New mean = = 14,800 Change in median = 50 14,800/ 11 = Change in mean = X
NAA ENHANCING THE QUALITY OF MARKING PROJECT: THE EFFECT OF SAMPLE SIZE ON INCREASED PRECISION IN DETECTING ERRANT MARKING
 NAA ENHANCING THE QUALITY OF MARKING PROJECT: THE EFFECT OF SAMPLE SIZE ON INCREASED PRECISION IN DETECTING ERRANT MARKING Mudhaffar Al-Bayatti and Ben Jones February 00 This report was commissioned by
Algebra I Module 2 Lessons 1 19
 Eureka Math 2015 2016 Algebra I Module 2 Lessons 1 19 Eureka Math, Published by the non-profit Great Minds. Copyright 2015 Great Minds. No part of this work may be reproduced, distributed, modified, sold,
MATH 214 (NOTES) Math 214 Al Nosedal. Department of Mathematics Indiana University of Pennsylvania. MATH 214 (NOTES) p. 1/3
 Math 214 Al Nosedal. Department of Mathematics Indiana University of Pennsylvania. MATH 214 (NOTES) p. 1/3") MATH 214 (NOTES) Math 214 Al Nosedal Department of Mathematics Indiana University of Pennsylvania MATH 214 (NOTES) p. 1/3 CHAPTER 1 DATA AND STATISTICS MATH 214 (NOTES) p. 2/3 Definitions. Statistics is
MATH 214 (NOTES) Math 214 Al Nosedal Department of Mathematics Indiana University of Pennsylvania MATH 214 (NOTES) p. 1/3 CHAPTER 1 DATA AND STATISTICS MATH 214 (NOTES) p. 2/3 Definitions. Statistics is
Chapter 5. Describing Distributions Numerically. Finding the Center: The Median. Spread: Home on the Range. Finding the Center: The Median (cont.
 Chapter 5 Describing Distributions Numerically Copyright 2007 Pearson Education, Inc. Publishing as Pearson Addison-Wesley Copyright 2007 Pearson Education, Inc. Publishing as Pearson Addison-Wesley Slide
Math 7 /Unit 07 Practice Test: Collecting, Displaying and Analyzing Data
 Math 7 /Unit 07 Practice Test: Collecting, Displaying and Analyzing Data Name: Date: Define the terms below and give an example. 1. mode 2. range 3. median 4. mean 5. Which data display would be used to
Homework Packet Week #5 All problems with answers or work are examples.
 Lesson 8.1 Construct the graphical display for each given data set. Describe the distribution of the data. 1. Construct a box-and-whisker plot to display the number of miles from school that a number of
6 th Grade Semester 2 Review 1) It cost me $18 to make a lamp, but I m selling it for $45. What was the percent of increase in price?
 It cost me $18 to make a lamp, but I m selling it for $45. What was the percent of increase in price?") 6 th Grade Semester 2 Review 1) It cost me $18 to make a lamp, but I m selling it for $45. What was the percent of increase in price? 2) Tom's weekly salary changed from $240 to $288. What was the percent
6 th Grade Semester 2 Review 1) It cost me $18 to make a lamp, but I m selling it for $45. What was the percent of increase in price? 2) Tom's weekly salary changed from $240 to $288. What was the percent
Dot Plots and Distributions
 EXTENSION Dot Plots and Distributions A dot plot is a data representation that uses a number line and x s, dots, or other symbols to show frequency. Dot plots are sometimes called line plots. E X A M P
MATH& 146 Lesson 11. Section 1.6 Categorical Data
 MATH& 146 Lesson 11 Section 1.6 Categorical Data 1 Frequency The first step to organizing categorical data is to count the number of data values there are in each category of interest. We can organize
Lesson 7: Measuring Variability for Skewed Distributions (Interquartile Range)
") : Measuring Variability for Skewed Distributions (Interquartile Range) Student Outcomes Students explain why a median is a better description of a typical value for a skewed distribution. Students calculate
: Measuring Variability for Skewed Distributions (Interquartile Range) Student Outcomes Students explain why a median is a better description of a typical value for a skewed distribution. Students calculate
Graphical Displays of Univariate Data
 . Chapter 1 Graphical Displays of Univariate Data Topic 2 covers sorting data and constructing Stemplots and Dotplots, Topic 3 Histograms, and Topic 4 Frequency Plots. (Note: Boxplots are a graphical display
SEVENTH GRADE. Revised June Billings Public Schools Correlation and Pacing Guide Math - McDougal Littell Middle School Math 2004
 SEVENTH GRADE June 2010 Billings Public Schools Correlation and Guide Math - McDougal Littell Middle School Math 2004 (Chapter Order: 1, 6, 2, 4, 5, 13, 3, 7, 8, 9, 10, 11, 12 Chapter 1 Number Sense, Patterns,
AP Statistics Sampling. Sampling Exercise (adapted from a document from the NCSSM Leadership Institute, July 2000).
.") AP Statistics Sampling Name Sampling Exercise (adapted from a document from the NCSSM Leadership Institute, July 2000). Problem: A farmer has just cleared a field for corn that can be divided into 100
AP Statistics Sampling Name Sampling Exercise (adapted from a document from the NCSSM Leadership Institute, July 2000). Problem: A farmer has just cleared a field for corn that can be divided into 100
Frequencies. Chapter 2. Descriptive statistics and charts
 An analyst usually does not concentrate on each individual data values but would like to have a whole picture of how the variables distributed. In this chapter, we will introduce some tools to tabulate
Jumpstarters for Math
 Jumpstarters for Math Short Daily Warm-ups for the Classroom By CINDY BARDEN COPYRIGHT 2005 Mark Twain Media, Inc. ISBN 10-digit: 1-58037-297-X 13-digit: 978-1-58037-297-8 Printing No. CD-404023 Mark Twain
SPIRE MATHS Stimulating, Practical, Interesting, Relevant, Enjoyable Maths For All
 Ratio and proportion TYPE: Main OBJECTIVE(S): Understand the relationship between ratio and proportion; use ratio notation, reduce a ratio to its simplest form and divide a quantity into two parts in a
Bite Size Brownies. Designed by: Jonathan Thompson George Mason University, COMPLETE Math
 Bite Size Brownies Designed by: Jonathan Thompson George Mason University, COMPLETE Math The Task Mr. Brown E. Pan recently opened a new business making brownies called The Brown E. Pan. On his first day
Measuring Variability for Skewed Distributions
 Measuring Variability for Skewed Distributions Skewed Data and its Measure of Center Consider the following scenario. A television game show, Fact or Fiction, was canceled after nine shows. Many people
COMP Test on Psychology 320 Check on Mastery of Prerequisites
 COMP Test on Psychology 320 Check on Mastery of Prerequisites This test is designed to provide you and your instructor with information on your mastery of the basic content of Psychology 320. The results
Why t? TEACHER NOTES MATH NSPIRED. Math Objectives. Vocabulary. About the Lesson
 Math Objectives Students will recognize that when the population standard deviation is unknown, it must be estimated from the sample in order to calculate a standardized test statistic. Students will recognize
UNIVERSITY OF MASSACHUSETTS Department of Biostatistics and Epidemiology BioEpi 540W - Introduction to Biostatistics Fall 2002
 1 UNIVERSITY OF MASSACHUSETTS Department of Biostatistics and Epidemiology BioEpi 540W - Introduction to Biostatistics Fall 2002 Exercises Unit 2 Descriptive Statistics Tables and Graphs Due: Monday September
Collecting Data Name:
 Collecting Data Name: Gary tried out for the college baseball team and had received information about his performance. In a letter mailed to his home, he found these recordings. Pitch speeds: 83, 84, 88,
Distribution of Data and the Empirical Rule
 302360_File_B.qxd 7/7/03 7:18 AM Page 1 Distribution of Data and the Empirical Rule 1 Distribution of Data and the Empirical Rule Stem-and-Leaf Diagrams Frequency Distributions and Histograms Normal Distributions
Lesson 7: Measuring Variability for Skewed Distributions (Interquartile Range)
") : Measuring Variability for Skewed Distributions (Interquartile Range) Exploratory Challenge 1: Skewed Data and its Measure of Center Consider the following scenario. A television game show, Fact or Fiction,
: Measuring Variability for Skewed Distributions (Interquartile Range) Exploratory Challenge 1: Skewed Data and its Measure of Center Consider the following scenario. A television game show, Fact or Fiction,
What is Statistics? 13.1 What is Statistics? Statistics
 13.1 What is Statistics? What is Statistics? The collection of all outcomes, responses, measurements, or counts that are of interest. A portion or subset of the population. Statistics Is the science of
THANK YOU FOR YOUR PURCHASE!
 THANK YOU FOR YOUR PURCHASE! The resources included in this purchase were designed and created by me. I hope that you find this resource helpful in your classroom. Please feel free to contact me with any
Chapter 3. Averages and Variation
 Chapter 3 Averages and Variation Understandable Statistics Ninth Edition By Brase and Brase Prepared by Yixun Shi Bloomsburg University of Pennsylvania Measures of Central Tendency We use the term average
Statistics for Engineers
 Statistics for Engineers ChE 4C3 and 6C3 Kevin Dunn, 2013 kevin.dunn@mcmaster.ca http://learnche.mcmaster.ca/4c3 Overall revision number: 19 (January 2013) 1 Copyright, sharing, and attribution notice
Comparing Distributions of Univariate Data
 . Chapter 3 Comparing Distributions of Univariate Data Topic 9 covers comparing data and constructing multiple univariate plots. Topic 9 Multiple Univariate Plots Example: Building heights in Philadelphia,
Unit Four Answer Keys
 Multiplication, Division & Fractions Unit Four Unit Four Answer Keys Session Blacklines A.., Unit Four Pre-Assessment Responses will vary. example example a b Sketches will vary. Example: a, Sketches will
Creating Color Combos
 THE 2016 ROSENTHAL PRIZE for Innovation in Math Teaching Creating Color Combos Visual Modeling of Equivalent Ratios Traci Jackson Lesson Plan Grades 5-6 Table of Contents Creating Color Combos: Visual
BPS 7th Grade Pre-Algebra Revised summer 2014 Year at a Glance Unit Standards Practices Days
 BPS 7th Grade Pre-Algebra Revised summer 2014 Year at a Glance Unit Standards Practices Days 1 All Operations with Integers 7.NS.1, 7.NS.2, 7.NS.3 1,4,6,8 7 2 All Operations with Rational Numbers 7.NS.1c,
McRuffy Press Fourth Grade Color Math Test 7
 McRuffy Press Fourth Grade Color Math Test 7 Materials: Test pages (Resource pack, 3 sheets) Test Directions Page :. Problem solving: Solve the problems. 2. Fractions to decimals: Change the fractions
Uses of Fractions. Fractions
 Uses of The numbers,,,, and are all fractions. A fraction is written with two whole numbers that are separated by a fraction bar. The top number is called the numerator. The bottom number is called the
Chapter 4. Displaying Quantitative Data. Copyright 2007 Pearson Education, Inc. Publishing as Pearson Addison-Wesley
 Chapter 4 Displaying Quantitative Data Copyright 2007 Pearson Education, Inc. Publishing as Pearson Addison-Wesley Dealing With a Lot of Numbers Summarizing the data will help us when we look at large
Overview. Teacher s Manual and reproductions of student worksheets to support the following lesson objective:
 Overview Lesson Plan #1 Title: Ace it! Lesson Nine Attached Supporting Documents for Plan #1: Teacher s Manual and reproductions of student worksheets to support the following lesson objective: Find products
Display Dilemma. Display Dilemma. 1 of 12. Copyright 2008, Exemplars, Inc. All rights reserved.
 I visited friends in New York City during the summer. They took me to this HUGE Wal-Mart store. There was a display of cookie boxes that I could not believe! The display was in a pyramid shape with at
Comparing Fractions on Number Lines
 s e s s i o n. B Comparing Fractions on Number Lines Math Focus Points Representing fractions on a number line Comparing fractions Identifying equivalent fractions Today s Plan Discussion Comparing Halves,
ANALYSING DIFFERENCES BETWEEN THE INPUT IMPEDANCES OF FIVE CLARINETS OF DIFFERENT MAKES
 ANALYSING DIFFERENCES BETWEEN THE INPUT IMPEDANCES OF FIVE CLARINETS OF DIFFERENT MAKES P Kowal Acoustics Research Group, Open University D Sharp Acoustics Research Group, Open University S Taherzadeh
STAT 113: Statistics and Society Ellen Gundlach, Purdue University. (Chapters refer to Moore and Notz, Statistics: Concepts and Controversies, 8e)
") STAT 113: Statistics and Society Ellen Gundlach, Purdue University (Chapters refer to Moore and Notz, Statistics: Concepts and Controversies, 8e) Learning Objectives for Exam 1: Unit 1, Part 1: Population
STAT 113: Statistics and Society Ellen Gundlach, Purdue University (Chapters refer to Moore and Notz, Statistics: Concepts and Controversies, 8e) Learning Objectives for Exam 1: Unit 1, Part 1: Population
AskDrCallahan Calculus 1 Teacher s Guide
 AskDrCallahan Calculus 1 Teacher s Guide 3rd Edition rev 080108 Dale Callahan, Ph.D., P.E. Lea Callahan, MSEE, P.E. Copyright 2008, AskDrCallahan, LLC v3-r080108 www.askdrcallahan.com 2 Welcome to AskDrCallahan
Math: Fractions and Decimals 105
 Math: Fractions and Decimals 105 Many students face fractions with trepidation; they re too hard, I don t understand. If this is you, there is no better tool to bring yourself back up to speed than a tape
Box Plots. So that I can: look at large amount of data in condensed form.
 LESSON 5 Box Plots LEARNING OBJECTIVES Today I am: creating box plots. So that I can: look at large amount of data in condensed form. I ll know I have it when I can: make observations about the data based
Estimation of inter-rater reliability
 Estimation of inter-rater reliability January 2013 Note: This report is best printed in colour so that the graphs are clear. Vikas Dhawan & Tom Bramley ARD Research Division Cambridge Assessment Ofqual/13/5260
Delta College Middle School Math Competition Practice Test A 2018
 Delta College Middle School Math Competition Practice Test A 208 ) In the Noveo music group there are 4 times as many flutes as there are bassoons. The number of clarinets is 8 more than triple the number
Histograms and Frequency Polygons are statistical graphs used to illustrate frequency distributions.
 Number of Families II. Statistical Graphs section 3.2 Histograms and Frequency Polygons are statistical graphs used to illustrate frequency distributions. Example: Construct a histogram for the frequency
An Introduction to Printing with the Espresso Book Machine
 An Introduction to Printing with the Espresso Book Machine Steven V. Potter Library Director & CEO Libraries have always been about sharing stories. Through a new initiative, The Story Center at Mid-Continent
Visual Art Department Indian Hill Exempted Village School District
 Visual Art Department Indian Hill Exempted Village School District Curriculum Outline Grades K - 4 Standard I: Historical, Cultural, and Social Contexts Benchmark A: Recognize and describe visual art forms
Reading Music-ABC s, 123 s, Do Re Mi s [6th grade]
![Reading Music-ABC s, 123 s, Do Re Mi s [6th grade]](/thumbs/74/70355435.jpg "Reading Music-ABC s, 123 s, Do Re Mi s [6th grade]") Trinity University Digital Commons @ Trinity Understanding by Design: Complete Collection Understanding by Design 9-11-2009 Reading Music-ABC s, 123 s, Do Re Mi s [6th grade] Jessica Koppe Trinity University
Trinity University Digital Commons @ Trinity Understanding by Design: Complete Collection Understanding by Design 9-11-2009 Reading Music-ABC s, 123 s, Do Re Mi s [6th grade] Jessica Koppe Trinity University
Trimester 2 5 th Grade Name: Answer Key
 Trimester 2 th Grade Name: Answer Key..NBT.7 Fiona hiked along a trail in Glacier National Park that is 7.2 miles long. It took her hours to hike. What was her average speed per hour? 7.2 / =.3 (miles
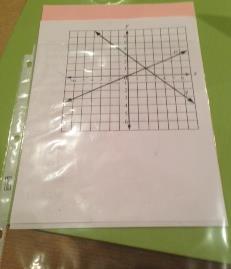
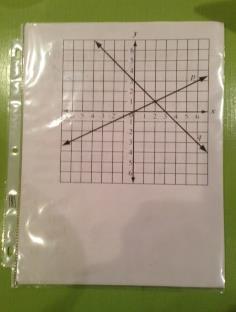
Math 81 Graphing. Cartesian Coordinate System Plotting Ordered Pairs (x, y) (x is horizontal, y is vertical) center is (0,0) Quadrants:
 (x is horizontal, y is vertical) center is (0,0) Quadrants:") Math 81 Graphing Cartesian Coordinate System Plotting Ordered Pairs (x, y) (x is horizontal, y is vertical) center is (0,0) Ex 1. Plot and indicate which quadrant they re in. A (0,2) B (3, 5) C (-2, -4)
Math 81 Graphing Cartesian Coordinate System Plotting Ordered Pairs (x, y) (x is horizontal, y is vertical) center is (0,0) Ex 1. Plot and indicate which quadrant they re in. A (0,2) B (3, 5) C (-2, -4)
How can you determine the amount of cardboard used to make a cereal box? List at least two different methods.
 Activity Start Thinking! For use before Activity How can you determine the amount of cardboard used to make a cereal box? List at least two different methods. Activity Warm Up For use before Activity Evaluate
Lesson 1. Grade Level(s)/Type of Ensemble: 8 th Grade Band. Central Focus: Compound Meter
/Type of Ensemble: 8 th Grade Band. Central Focus: Compound Meter") Lesson 1 Grade Level(s)/Type of Ensemble: 8 th Grade Band Central Focus: Compound Meter Musical concepts to be taught/reinforced during this lesson: Time signatures, meter, simple meter, compound meter,
Lesson 1 Grade Level(s)/Type of Ensemble: 8 th Grade Band Central Focus: Compound Meter Musical concepts to be taught/reinforced during this lesson: Time signatures, meter, simple meter, compound meter,
Mobile Math Teachers Circle The Return of the iclicker
 Mobile Math Teachers Circle The Return of the iclicker June 20, 2016 1. Dr. Spock asked his class to solve a percent problem, Julia set up the proportion: 4/5 = x/100. She then cross-multiplied to solve
(1) + 1(0.1) + 7(0.001)
 + 1(0.1) + 7(0.001)") Name: Quarterly 1 Study Guide The first quarterly test covers information from Modules 1, 2, and 3. If you complete this study guide and turn it in on Tuesday, you will receive 5 bonus points on your Quarterly
Name: Quarterly 1 Study Guide The first quarterly test covers information from Modules 1, 2, and 3. If you complete this study guide and turn it in on Tuesday, you will receive 5 bonus points on your Quarterly
8.3. Start Thinking! Warm Up. Find the area of the triangle Activity. Activity. 4 m. 14 in. 7 m. 9 in. 12 yd. 11 yd. 1 mm. 5.
 Activity Start Thinking! For use before Activity You know how to find the area of squares, rectangles, triangles, trapezoids, and parallelograms. Describe three different methods you could use to estimate
Chapter 1 Midterm Review
 Name: Class: Date: Chapter 1 Midterm Review Multiple Choice Identify the choice that best completes the statement or answers the question. 1. A survey typically records many variables of interest to the
Walk-around Graphing Activity: Cubed Roots Level 1
 Walk-around Graphing Activity: Cubed Roots Level 1 By Caryn White Table of Contents Copy Right Informations:... 2 Instructions... Version A... 4 Absent Student Version... 14 Blank Graph... 16 Student Answer
Open Number Line Mats
 Open Number Line Mats Congratulations on your purchase of these Really Good Stuff Open Number Line Mats a versatile and open-ended tool for solving a variety of addition and subtraction problems. This
Chapter 27. Inferences for Regression. Remembering Regression. An Example: Body Fat and Waist Size. Remembering Regression (cont.)
") Chapter 27 Inferences for Regression Copyright 2007 Pearson Education, Inc. Publishing as Pearson Addison-Wesley Slide 27-1 Copyright 2007 Pearson Education, Inc. Publishing as Pearson Addison-Wesley An
Chapter 27 Inferences for Regression Copyright 2007 Pearson Education, Inc. Publishing as Pearson Addison-Wesley Slide 27-1 Copyright 2007 Pearson Education, Inc. Publishing as Pearson Addison-Wesley An
Record your answers and work on the separate answer sheet provided.
 MATH 106 FINAL EXAMINATION This is an open-book exam. You may refer to your text and other course materials as you work on the exam, and you may use a calculator. You must complete the exam individually.
Community Meeting October 30, 2013
 Community Meeting October 30, 2013 Who We Are The mission of Falmouth Memorial Library is to enrich the community by providing resources and services that foster a love of reading and inspire imagination,
Comparing Areas of Rectangles
 Activity Overview In this activity, students discover the relationship between a change in the dimensions of a rectangle and the change in the corresponding area. Topic: Problem Solving Understand measurable
Version : 27 June General Certificate of Secondary Education June Foundation Unit 1. Final. Mark Scheme
 Version : 27 June 202 General Certificate of Secondary Education June 202 Mathematics Foundation Unit 4360F Final Mark Scheme Mark schemes are prepared by the Principal Examiner and considered, together
MATH BOOKMAKING IDEAS TO FLIP, FLAP, AND FOLD
 MATH BOOKMAKING IDEAS TO FLIP, FLAP, AND FOLD CONTRIBUTING WRITERS Karen Bauer, Jan Brennan, Rosa Drew, Ronda Howley, Heidi Meyer, Tiffani Mugurassa, and Brenda Wyma EDITOR Alaska Hults ILLUSTRATOR Jane
B291B. MATHEMATICS B (MEI) Paper 1 Section B (Foundation Tier) GENERAL CERTIFICATE OF SECONDARY EDUCATION. Friday 9 January 2009 Morning
 Paper 1 Section B (Foundation Tier) GENERAL CERTIFICATE OF SECONDARY EDUCATION. Friday 9 January 2009 Morning") F GENERAL CERTIFICATE OF SECONDARY EDUCATION MATHEMATICS B (MEI) Paper 1 Section B (Foundation Tier) B291B *CUP/T62437* Candidates answer on the question paper OCR Supplied Materials: None Other Materials
F GENERAL CERTIFICATE OF SECONDARY EDUCATION MATHEMATICS B (MEI) Paper 1 Section B (Foundation Tier) B291B *CUP/T62437* Candidates answer on the question paper OCR Supplied Materials: None Other Materials
Parent s Guide. Questions and Answers
 Parent s Guide Questions and Answers Name ATOS Book Levels (ZPD Range) UG Upper Grades 9 12 MG Middle Grades 4 8 LG Lower Grades K 3 Interest Level (check one) 12 11 10 9 8 7 6 5 4 3 2 1 K MG+ Middle Grades
M T W TH F Math TI-30X2S calculators Reading 3 Ring Binder Reading NWEA
 M T W TH F 4 5 6 Math TI-30X2S calculators Reading 3 Ring Binder 11 Brainstorm Genre Writing 18 Affixes see affix button Setting/Lit Techniques sheet p. 20 All Summer in a Day by Ray Bradbury Finish Inferencing
EOC FINAL REVIEW Name Due Date
 1. The line has endpoints L(-8, -2) and N(4, 2) and midpoint M. What is the equation of the line perpendicular to and passing through M? A. B. Y= C. Y= D. Y= 3x + 6 2. A rectangle has vertices at (-5,3),
Maths-Whizz Investigations Paper-Back Book
 Paper-Back Book are new features of our Teachers Resource to help you get the most from our award-winning software and offer new and imaginative ways to explore mathematical problem-solving with real-world
Display Size Matters Selecting the Right Display Size for Classrooms
 Display Size Matters Selecting the Right Display Size for Classrooms 100" Display 65" Display Contents Key Factors for Selecting the Right Display 3 The 4/6/8 Rule 4 Classroom Configurations 5 THE FINDINGS:
Version : 1.0: klm. General Certificate of Secondary Education November Higher Unit 1. Final. Mark Scheme
 Version : 1.0: 11.10 klm General Certificate of Secondary Education November 2010 Mathematics Higher Unit 1 43601H Final Mark Scheme Mark schemes are prepared by the Principal Examiner and considered,
Practice Task: The Sieve of Eratosthenes
 Practice Task: The Sieve of Eratosthenes STANDARDS FOR MATHEMATICAL CONTENT MCC4.OA.4 Find all factor pairs for a whole number in the range 1 100. Recognize that a whole number is a multiple of each of
Units Standards Practices Days
 BPS 7 th Grade Regular Math Revised Summer 2014 Year at a Glance Units Standards Practices Days 1. Rational # s Operations: Add & Subtract 2. Rational # s Operations: Multiply & Divide 3. Simplifying Expressions
Starting a Booktalk Club: Success in Just 12 Weeks!
 Starting a Booktalk Club: Success in Just 12 Weeks! It s wonderful that you re interested in starting a booktalk club at your school! Before you even begin, you may want to familiarize yourself with some
Math and Music Developed by Megan Martinez and Alex Barnett in conjunction with Ilene Kanoff
 Math and Music Developed by Megan Martinez and Alex Barnett in conjunction with Ilene Kanoff For questions or comments, feel free to contact Megan Martinez at megan.ann.martinez [at] gmail.com Overview
Rounding Foldable Download or Read Online ebook rounding foldable in PDF Format From The Best User Guide Database
 Free PDF ebook Download: Download or Read Online ebook rounding foldable in PDF Format From The Best User Guide Database Nov 25, 2013 - Make this to help you organize information about decimals. Begin
Normalization Methods for Two-Color Microarray Data
 Normalization Methods for Two-Color Microarray Data 1/13/2009 Copyright 2009 Dan Nettleton What is Normalization? Normalization describes the process of removing (or minimizing) non-biological variation
Chapter 6. Normal Distributions
 Chapter 6 Normal Distributions Understandable Statistics Ninth Edition By Brase and Brase Prepared by Yixun Shi Bloomsburg University of Pennsylvania Edited by José Neville Díaz Caraballo University of
Correlation to the Common Core State Standards
 Correlation to the Common Core State Standards Go Math! 2011 Grade 4 Common Core is a trademark of the National Governors Association Center for Best Practices and the Council of Chief State School Officers.
bottom _G3U2W4_ indd 1 2/19/10 4:24 PM
 bottom Routine for Lesson Vocabulary Introduce He is at the bottom of the well. The bottom is the lowest part. Let s say the word together: bottom. Demonstrate The shoes are in the bottom of my closet.
Blueline, Linefree, Accuracy Ratio, & Moving Absolute Mean Ratio Charts
 INTRODUCTION This instruction manual describes for users of the Excel Standard Celeration Template(s) the features of each page or worksheet in the template, allowing the user to set up and generate charts
9.2 Data Distributions and Outliers
 Name Class Date 9.2 Data Distributions and Outliers Essential Question: What statistics are most affected by outliers, and what shapes can data distributions have? Eplore Using Dot Plots to Display Data
Astronomy Lab - Lab Notebook and Scaling
 Astronomy Lab - Lab Notebook and Scaling In this lab, we will first set up your lab notebook and then practice scaling. Please read this so you know what we will be doing. BEFORE YOU COME TO THIS LAB:
CPSC 121: Models of Computation. Module 1: Propositional Logic
 CPSC 121: Models of Computation Module 1: Propositional Logic Module 1: Propositional Logic By the start of the class, you should be able to: Translate back and forth between simple natural language statements
Workshops for Everyone
 Workshops for Everyone Broadway 101: This is the perfect introduction to Broadway, basic theatre, and creativity skills for students recently introduced to Broadway and theatre in general. Explore Broadway
Michigan Arts Education Instructional and Assessment Program Michigan Assessment Consortium. MUSIC Assessment
 Michigan Arts Education Instructional and Assessment Program Michigan Assessment Consortium MUSIC Assessment Performance Task M.T304 You Be the Judge: Creating and Applying Criteria to Performance Grades
Table of Contents. Introduction...v. About the CD-ROM...vi. Standards Correlations... vii. Ratios and Proportional Relationships...
 Table of Contents Introduction...v About the CD-ROM...vi Standards Correlations... vii Ratios and Proportional Relationships... 1 The Number System... 10 Expressions and Equations... 23 Geometry... 27
Browsing News and Talk Video on a Consumer Electronics Platform Using Face Detection
 Browsing News and Talk Video on a Consumer Electronics Platform Using Face Detection Kadir A. Peker, Ajay Divakaran, Tom Lanning Mitsubishi Electric Research Laboratories, Cambridge, MA, USA {peker,ajayd,}@merl.com
EXPLORING DISTRIBUTIONS
 CHAPTER 2 EXPLORING DISTRIBUTIONS 18 16 14 12 Frequency 1 8 6 4 2 54 56 58 6 62 64 66 68 7 72 74 Female Heights What does the distribution of female heights look like? Statistics gives you the tools to
Custom-Written Show Choir Music
 Custom-Written Show Choir Music GET EXACTLY WHAT YOU WANT by Anita Cracauer Custom-Written Music continued Are you tired of searching for a song that fits your show theme, communicates your particular
Highlight and Shadow for Stage Makeup Design: Theatre Foundations IV Session Design by Colin Anderson
 Highlight and Shadow for Stage Makeup Design: Theatre Foundations IV Session Design by Colin Anderson LEARNING OBJECTIVES Content Standards Utah Theatre Foundations IV: Standard 3 Objective 1a o Plan design
Leicester-Shire Schools Music Service Unit 3 Rhythm Year 3
 Leicester-Shire Schools Music Service Unit 3 Rhythm Year 3 In this unit, children get to experience of a lot of creating and performing parts in small groups. They will also explore how rhythms can be
MINNEHAHA COUNTY ON-SITE WASTEWATER TREATMENT SITE EVALUATION WORKSHEET Form #1. Land Owner. Legal Description
 MINNEHAHA COUNTY ON-SITE WASTE TREATMENT SITE EVALUATION WORKSHEET Form #1 Land Owner Legal Description Type of Structure (check one): Residence Commercial Industrial Accessory Building Other If Residence:
9 th 12 th Grade School Supplies
 9 th 12 th Grade School Supplies AP Statistics A notebook or binder to take notes and hold papers. This may be used with other subjects. TI-84 Plus graphics calculator (MANDATORY) Book cover For AP Stats,
Navigate to the Journal Profile page
 Navigate to the Journal Profile page You can reach the journal profile page of any journal covered in Journal Citation Reports by: 1. Using the Master Search box. Enter full titles, title keywords, abbreviations,
TITLE of Project: Leaf Prints for Kinder
 TITLE of Project: Leaf Prints for Kinder MEDIUM: tempera BIG IDEA: Beautiful Nature ESSENTIAL QUESTION: Can art be created from things around us? MATERIALS: colored construction paper 9X12 ; brayer; tempera
DIVERSITYTRENDS LLC SEMINAR/TRAINING AGREEMENT
 2002 CONSULTING/SPEAKING AGREEMENT Page 1 of 3 DIVERSITYTRENDS LLC SEMINAR/TRAINING AGREEMENT (Local or Travel Included) This is an agreement between DiversityTrends LLC (Consultant) and [Client Name]
UY Upper Years Ages 14 and above. MY+ Middle Years Plus Ages 12 and above. MY Middle Years Ages LY Lower Years Ages 5 8.
 Name ATOS Book Levels (ZPD Range) UY Upper Years Ages 14 and above MY Middle Years Ages 9 13 LY Lower Years Ages 5 8 Interest Level (tick one) 18 17 16 15 14 13 12 11 10 9 8 7 6 5 MY+ Middle Years Plus
North Carolina Standard Course of Study - Mathematics
 A Correlation of To the North Carolina Standard Course of Study - Mathematics Grade 4 A Correlation of, Grade 4 Units Unit 1 - Arrays, Factors, and Multiplicative Comparison Unit 2 - Generating and Representing