SpectraPlotterMap 12 User Guide
|
|
|
- Hubert Morrison
- 6 years ago
- Views:
Transcription


1 SpectraPlotterMap 12 User Guide UG Sep 14, 2016 SpectraPlotterMap version 12, included in Radial Suite Release 8, displays two and three dimensional plots of power spectra generated by the SeaSonde. The power spectrum is a visual representation of the sea echo received by the SeaSonde which is used to evaluate the quality and the nature of the signal. SpectraPlotterMap 12 supports Cross Spectra version 6 files, which contain more meta data than prior versions and embedded first order limit lines. SpectraPlotterMap 12 generates spectral plots for the two loop antennas and the vertical antenna (previously referred to as the monopole or the dipole). Buttons on the main window allow easy access to the information, range slice, doppler slice, and first order windows. SpectralPlotterMap 12 adds keyboard-controlled zoom capabilities with enhanced pixelation, font size control, and Portable Document Format (PDF) export for clean graphics. SpectraPlotterMap Features Graphically enhanced power spectra plots Manipulate font size of graphic labels and export to PDF format for high quality report and scientific study figures Navigate data with multiple keyboard short cut options Activate and deactivate spectra for one, two, or three antenna elements new toolbar buttons
2 Basics Open a cross spectra (spectra) file by: Open SpectraPlotterMap and follow the prompt to drop a spectra file onto the window with tray icon Drag and drop the spectra file on the SpectraPlotterMap icon Drag and drop the spectra file into the SpectraPlotterMap window Open SpectraPlotterMap, select main menu File->Open and locate spectra file Once a SpectraPlotterMap session has been initiated, double click spectra file to launch it into SpectraPlotterMap Spectra data will appear in the main window of SpectraPlotterMap. The example used throughout this Guide is from the BML1 site located in Bodega Bay, California, United States CSS_BML1_16_04_14_1000.cs -80 Vertical (A3) Range (km) ± Radial Current Velocity (cm/s) Main SpectraPlotterMap Window Spectra Color Map The Spectra Color Map is the power received from the three antenna elements over range and Doppler. The vertical axis is range (radial distance) from the site. The horizontal axis is sea-echo Doppler represented here as radial current velocity. The left half is echo from Bragg waves moving towards the site while the right half is from Bragg waves moving away from the site. Both Bragg waves are shown here as current velocity moving towards (positive) and away from (negative) the site. Each dot in the plot represents a single range cell and doppler bin whose power is plotted as color. The power in dbm is represented by color based on the scale on the right which is adjustable for best contrast of the spectra.

3 SpectraPlotterMap s enhanced main window features a new toolbar that provides access to all spectra data. The three buttons in the upper left corner control the plots that appear in the Spectra Color Map. Spectra for loop 1 (A1), loop 2 (A2), and the vertical antenna (A3) can be viewed together as shown below or removed from view by toggling the toolbar buttons. The Information, Range Slice, Doppler slice, and First Order Settings windows can be opened with their respective buttons in the upper right corner. Range can be expressed as distance or as range cells which are the discrete processing distances. The range nearest the SeaSonde contain the warmest intensity colors (yellow and green in this example) because their signal is strongest. The signal tends to decrease with increasing distance from the SeaSonde, as reflected in the progressing cooling of intensity coloration from cyan to blue to dark purple. Clicking in the body of any of the three panels in the Spectra Color Map will add a cursor (small black rectangle indicated below by the large red arrow) to select a single range cell and Doppler bin. The Range Slice, Doppler Slice, and Information windows all track this cursor; the up and down arrow keys will
4 move the cursor around the Spectra Color Map and within the Range Slice, Doppler Slice, and Information windows. Here, the cursor is located at radial current velocity cm/s and range cell three. For the vertical antenna, which we focus on for this example, range cell three has a power of approximately -80 dbm, given its orange coloring. cursor cursor cursor


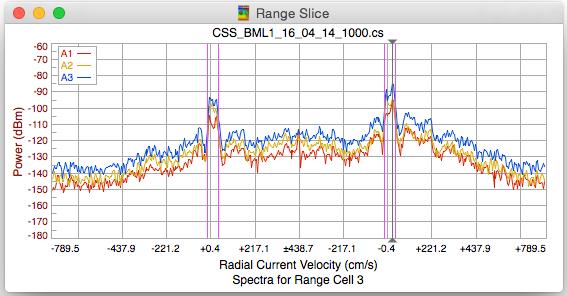
5 Range Slice The Range Slice is a plot of power versus Doppler for a selected range cell. This plot is useful for looking at first and second order for a single range cell The vertical grey line at power -84 dbm and frequency cm/s is consistent with the coordinates of the cursor in the Spectra Color Map. The Range Slice plot for range cell three plots data along this horizontal conceptual red horizontal line:
 Doppler bin.")
 plots data along this vertical conceptual red horizontal line, looking to its left.")
6 Doppler Slice The Doppler Slice is a plot of power versus range for a Doppler bin. This plot is useful for examining how first order Bragg echo decays in range and where bistatic echoes show up by looking at the DC (zero velocity) Doppler bin The vertical grey line at power -84 dbm and range cell three is consistent with the coordinates of the cursor in the Spectra Color Map. The Doppler Slice plot for Doppler bin 352 (radial velocity cm/s) plots data along this vertical conceptual red horizontal line, looking to its left. Note the peak of the Doppler Slice is on the far left side of the graph, which is where it falls on the conceptual red line in the Spectra Color Map: Radial velocity cm/s equals Doppler bin

7 Information Information window is a text box with meta data describing the spectra file and SeaSonde site parameters in the first section, the active range cell in the second section, and the active Doppler bin in the third section. The Information window will appear when you click the Info button. The selected range cell is shown as range cell three, and the selected Doppler bin is bin 352 (same as above example). Left Bragg and Right Bragg have Bragg indices in terms of Doppler bin, where the Bragg index occurs at a current velocity of zero.
8 First Order Settings Introduction Radials, waves, and ellipticals require accurately determining the first order region in the sea echo for optimal processing. The First Order Settings dialog adjusts the parameters that define how the first order determination algorithm operates. Changing these settings requires a fair amount of skill; please, contact CODAR support to obtain the best settings. The help notes on the right hand panel of the dialog provide a summary of each parameter and recommendations for settings. Hover over a parameter with your mouse to see these help notes. The first order lines delineate the boundary of the first order region, which is the portion of the spectrum used to generate radial velocities. The first order is also used to normalize the second order for waves computations, where overestimating the first order region is preferable to underestimating it for computational stability. Elements of first order line settings for waves, therefore, might be looser than they are for radials. Elements of first order settings for elliptical calculations might also differ from radial settings because of their geometric complexity. If you wish to adjust first order lines for waves or ellipticals, first define them for radials, because two of the seven parameters are shared. Default first order line parameters are first established in the default settings of SeaSondeRadialSiteSetup and are documented in the RadialConfigs file. The range cells selected to be processed (the processing range cells) are also identified in SeaSondeRadialSiteSetup. The first range cell, for example, is typically not processed, and the second range cell is seldom processed. The processed first order lines are white in the Color Spectra Map and blue in the Range Slice plot. These processed first order lines are the result of the first order determination made by radial processing. The processed first order lines will not plot if they are missing from the cross spectra.

9 Selecting Show Determined First Order will display results of an immediate rough approximation of first order line placement if the settings in the First Order Settings window are applied to the processing spectra. The determined first order lines are plotted in pink in the Color Spectra Map and Range Slice
10 plot. In this example, Radial BML1 appears in the dropdown in the upper left, indicating that the first order settings used to generate radials (and not waves or ellipticals) are active in the dialog. Processing Range appears in the dropdown in the upper right indicating that default settings were applied to all of the range cells that were selected to be processed. Here we show the First Order Settings window and the resulting approximation of first order lines for the vertical antenna. If the estimation of the first order needs adjustment, the parameters within First Order Settings can be modified. All these parameters below can be adjusted to see what might happen to the first order and do not take effect until you click the Save button which will then update the RadialConfigs folder and will be applied to any future radial, elliptical, and wave processing. Clicking Revert button will reload this dialog with the RadialConfigs settings. Quitting without doing Save button will leave the RadialConfigs untouched.
11
12 First Order Setting Parameters These seven adjustable first order line parameters are labeled below. The first four parameters are required and create the determined first order lines. The remaining three, optional parameters are used to narrow them if necessary. Maximum Velocity Doppler Smoothing Signal to Noise Peak Power Dropoff Null Below Peak Power Reject Distant Bragg Reject Noise/Ionospheric Maximum Velocity establishes a threshold beyond which velocities are excluded from the first order. The maximum radial velocity expected to occur at a given site should be entered. If this setting is too high, then non-bragg data may be incorporated into the first order yielding an overestimated radial velocity. If it is too low, then first order data may be omitted and radial velocities will be underestimated. Maximum Velocity effectively establishes a maximum allowable first order width which is equal to +/- the maximum velocity. The Doppler Smoothing factor is applied to remove irregular, jagged edges from the sea echo which might obscure the true boundary of the first order. The degree of smoothing is proportional to the number of points indicated by Doppler Smoothing. Smoothing aids in a later step, where the algorithm estimates the location of the low point (null) between the first order and either the second order or the noise floor. The image below on the left shows an example of the actual nulls represented by black dots for the spectra plotted in blue (A3). If the spectra are not smoothed sufficiently (Doppler Smoothing set too low), many jagged edges will remain. The algorithm will choose a null that is actually inside the first order, and the first order will be more narrow than it should be. This is represented in the middle image below. If the spectra have been over-smoothed (Doppler Smoothing set too high), too many points will be removed, the actual null between the first and second orders will disappear,
13 and portions of the second order will be incorporated. The first order will be wider than it should be. An example of this shown in the image to the right. Nulls Nulls with not enough smoothing Nulls with too much After the Doppler are smoothed, the algorithm moves down from the peak power and within the width generated by the maximum velocity to locate the first order limits within the smoothed Doppler. To confine this search, First Order Settings provide two thresholds. Signal to Noise limits the lower end of the search with the noise floor. If the algorithm hits the noise floor, defined in db, then it will stop its search and set limits. The descent from peak power is also confined by Peak Power Dropoff, expressed in db. If the algorithm reaches this distance, then first order limits are set. If this threshold is set too large, the algorithm may ascend too far down and incorporate data that is non-bragg. If set too low, the algorithm may stop while still inside the first order and omit portions of it. The more conservative of Signal to Noise and Peak Power Dropoff will prevail; if the Peak Power Dropoff limit is reached before the noise floor, then limits are set at that point. If the noise floor is reached before the Peak Power Dropoff value, then limits are set at the noise floor. At this point, the first order lines have been set and the remaining optional First Order Settings may be initiated to tighten the first order lines if they appear too broad. Null Below Peak Power addresses conditions in which the second order signal is very close to the first order signal. This can occur in the presence of high, short waves that are just slightly longer in period and wavelength than Bragg waves. If the Null Below Peak Power box is checked, first order limits will stop at the first null that is beyond the minimum specified quantity below peak power in db. Null Below Peak Power will have no effect if set higher than the Peak Power Dropoff, which would trip before the Null Below Peak Power value is met. This parameter was left unchecked for the positive Bragg shown on the left, while Null Below Peak Power was checked and given a value of 6 db for the
14 example on the right, which shows a slightly narrower first order region at about mid-range. Checking the Reject Distant Bragg box will prevent the misallocation of short bursts of energy, such as those associated with ships, as first order Bragg signal. A distance check prevents this error, as illustrated in the example below. Here, the determined first order lines deviate to the left from an otherwise reasonable delineation to include a high intensity region. The Bragg index, located at current velocity zero, is marked below along with the left and right first order lines for this range cell. The width of the erroneous first order region is called out. If this smaller t h e width is t h a n distance between either first order line and the Bragg index, than the selection will be rejected because it is too far away to reasonably constitute the first order.
 Bragg for this range cell will not be processed into future radials.")
15 Clearly, the selected first order width is smaller than distance d1 (right first order line and the Bragg index) and distance d2 (left first order line and the Bragg index), so the selected first order for this range cell is rejected which means that the positive(right) Bragg for this range cell will not be processed into future radials. If the negative(left) Bragg is also rejected, then there won't be any radial vectors for the range cell, which is good because they're likely invalid. When tripped, all the doppler bins for Bragg half will be plotted much darker as an indicator unless the menu item Power -> Grey Doppler for Rejected Bragg is unchecked. Reject Noise/Ionospheric rejects Bragg when the total non-bragg power within a given range cell is greater than the power within the first order. This prevents inclusion of contaminated data at times and locations where significant noise is expected. Just like Reject Distance Bragg above, when tripped, there won t be any future radials for that range cell and Bragg half and all the doppler bins for Bragg half will be plotted much darker unless the menu item Power -> Grey Doppler for Rejected Bragg is unchecked. When checked, Blackout shows an estimate of the regions in the spectral plot that would be rejected if the settings in the First Order Settings window were implemented. The drop down menu allows selection of all or specific tests. This is very useful in understanding how First Order Settings might impact the region in the Spectra Color Map identified as first order. The menu item Power -> Adjust Blackout Opaque provides a scale for adjusting the opaqueness of the blackout, where 100% is fully black and 0% is barely visible. This example shows the effects of a 70% setting.
16 Blackout can also show where SpectraAverager had decided to leave out data from the averaged spectra due to ships and interference by flagging the vertical antenna (A3) with a negative value. Tailoring First Order Settings to Seasonal and Spatial Variation When adjusting the First Order Settings, do not try to perfect them for a single file, rather, establish reasonable first order lines for a given set of files. Scroll forward (backward) through a folder of files using the <command> (<command> ;) keyboard shortcut and observe the processed and determined first order lines. Try to make adjustments that are loose enough as to benefit, or at least not hinder, the other spectra files. Because environmental conditions change over time, checking back periodically to evaluate the performance of your settings is recommended. If seasonal conditions create predictable changes in the first order region, you can develop First Order Settings for two or more different seasons and manually enter them at the appropriate time. If your site contains a region with distinct features that influence the Bragg region like an enclosed bay or channel, establishing first order settings for one or more groups of range cells allows you optimize your site. For example, a shallow, nearshore area in an otherwise deep region may benefit from having unique first order settings. An area with significant river inflow may also warrant its own first order settings. SpectraPlotter Map allows the creation of different settings for distinct groups of range cells.
17 Click the + button next to Processing Range to add a sub-group of range cells. Select a sub-group in the dropdown and edit the range cell numbers in the box below. If you require range cells that lie outside of the group of processing range cells, click the Go to Site Setup button. This will launch SeaSondeRadialSetup and allow you to adjust the radial processing range. In the First Order Settings window, select the sub-group of range cells you wish to edit, enter the desired settings, and save these settings. While you can create up to 32 sub-groups, adding just one sub-group, if at all, is more typical. To adjust first order line settings for waves, use the dropdown menu under Show Determined First Order to select the wave option. The parameters that apply to wave processing will be editable, those that do not apply will be greyed out. To adjust first order line settings for ellipticals, use the same dropdown to select the elliptical option and modify the editable parameters. Settings for waves and ellipticals requires advanced skill; please, contact CODAR support to obtain the best settings for your site(s). Saving First Order Settings After you have made the desired adjustments, click the Save button to save them. If you wish to undo them and see the original settings, click the Revert button. Saving the settings will effect all future radial, elliptical and wave processing.

18 SpectraPlotterMap Menu Find version information about SpectraPlotterMap under SpectraPlotterMap- >About SpectraPlotterMap. Hide SpectraPlotterMap will remove SpectraPlotterMap from view, Hide Others hides all other open applications, and Show All brings them back into view. Quit SpectraPlotterMap closes the application. Main Menu The application has eight pulldown menus: File, Edit, Doppler, Power, Graph, Zoom, View, and Window. Keyboard shortcuts are shown to the right of each item, for example, <command> O is the shortcut to open a file. File Menu Files and file navigation are managed under the File menu. Spectra files can be opened from the main menu under File->Open. Next Spectra File (Previous Spectra File) and its keyboard shortcut <command> and <command> ; uploads the next and previous spectra file in the folder where the currently active spectra resides.

19 File->Close closes the active window. File->Save Image saves the main window image as a PDF or PNG file. The infinite resolution PDF format provides figures for scientific studies and reports of publishable quality. File->Page Setup provides a dialog with printer settings. File->Print opens a Print dialog with multiple options, including sending the main window image to a printer, a PDF file, or to the body of an . File->First Order Settings opens up the dialog with parameters that define how the first order line algorithm operates. See First Order Settings section above for details. File->Movie Maker opens a dialog for making movies comprised of a series of sequential frames from Spectra Color Map, Doppler Slice, or Range Slice. Movie Maker consists of these parameters: Destination - Click the button to navigate to the folder where your movie will be saved, or type it in the adjacent window. Time Frame - indicate the time frame to be included. Select Entire Folder to include content from all spectral files in the folder that contains your active file. Resolution - select a low or high resolution option. Codec - specify the desired file format and frames per second (FPS). Graph - select the content of your movie. Click Make Movie to generate a *.mov file, and click Close to close out. Doppler Menu The Doppler menu and keyboard shortcuts manipulate the Doppler and Range Slice.


20 Doppler -> Movie Power Up makes an upward shift in the values of the vertical axes in the Doppler and Range Slice. This shifts the vertical placement of data down. Doppler -> Movie Power Down makes an downward shift in the values of the vertical axes in the Doppler and Range Slice. This shifts the vertical placement of data up. Doppler -> Spread Antennas 40dB spreads power data for each antenna element in the Doppler and Range Slice by 40 db for legibility. Instead of adding a unique vertical axis for each antenna, it provides a formula with the relative position of each dataset. For the actual power of A2, for example, add 20 db to the plotted power since 20 db were subtracted to shift it downward. An original Range Slice is shown on the left, and an adjusted plot is on the right: Doppler -> Smooth Doppler toggles Doppler smoothing in the Range Slice as set by next menu item. Doppler -> Smooth Doppler by opens a smoothing factor dialog which sets
 that jumps up a couple of db where the doppler cell was flagged by SpectraAverager as")
21 the degree of smoothing applied to the Range Slice as shown below. Plot A3 Flagged toggles display of pink data line across the last horizontal graticule (-200 in above plot) that jumps up a couple of db where the doppler cell was flagged by SpectraAverager as having some of the source spectra omitted from the average due to ship or interference. Plot Freshness toggles display of a blue data line across the last horizontal graticule (-200 in above plot) that drops to the graph edge (-210) as an indication by SpectraAverager that data does not contain any newer (fresh) spectra in the average. Plot Suppression toggles display of orange data line across the last horizontal graticule (-200 in above plot) that drop to the graph edge (-210) as an indication by SeaSondeAcquisition where stripe suppression was applied.
22 Power Menu The Power menu and keyboard shortcuts manipulate the Spectra Color Map. If the default settings do not reveal enough detail about an area of interest, like the peak power region of the first order, the Power menu provides the means to modify how the data are plotted. Some of its features also impact the appearance of the Doppler and Range Slice. Power -> Move Signal Levels Up makes an upward shift in all values of the Spectra Color Map color bar, which shifts the colors plotted in the map down towards cooler tones. It also makes an upward shift in the values of the vertical axes in the Doppler and Range Slice. This shifts the vertical placement of data down. Power -> Move Signal Levels Down makes a downward shift in all values of the Spectra Color Map color bar, which shifts the colors plotted in the map up towards warmer tones. It also makes an downward shift in the values of the vertical axes in the Doppler and Range Slice. This shifts the vertical placement of data up. Power -> Move Maximum Up raises the highest value of the Spectra Color Map color bar and the Spectra Color Map. It has the same impact on the Doppler and Range Slice as Move Signal Levels Up.
23 Power -> Move Maximum Down lowers the highest value of the Spectra Color Map color bar and the Spectra Color Map. It has the same impact on the Doppler and Range Slice as Move Signal Levels Down. Power -> Move Threshold Up increases the mid-range value of color bar and opens up the spectrum of values plotted beneath it. It has no impact on the Doppler and Range Slice. Power -> Move Threshold Down decreases the mid-range value of color bar and opens up the spectrum of values plotted above it. It has no impact on the Doppler and Range Slice. Power -> Move Noise Floor Up raises the noise floor of the Spectra Color Map; increases the lowest intensity value plotted so that more of the map s noise region is effectively blacked out. Power -> Move Noise Floor Down lowers the noise floor of the Spectra Color Map; decreases the lowest intensity value plotted so that gradation is enhanced in the map s noise region. Power -> Move Selected Cell Left moves the cursor to the left (see below for toggling the cursor on). Power -> Move Selected Cell Right moves the cursor to the right (see below for toggling the cursor on). Power -> Move Selected Cell Up moves the cursor to the up (see below for toggling the cursor on). Power -> Move Selected Cell Down moves the cursor to the down (see below for toggling the cursor on). Power -> Set Default Signal Levels undoes above commands that change intensity levels in the color bar and Spectra Color Map plot and reverts to original settings. Power -> Outline Selected Grey Cell toggles the cursor on if a cell is selected in the Spectra Color Map. Power -> Gray Doppler for Rejected Bragg shows the results of the Reject Distant Bragg and the Reject Noise/Ionospheric tests by coloring the rejected range cells dark gray in the Spectra Color Map. These two tests must be checked in the First Order Settings window for this feature to display. Power -> Gray First Order for Rejected Bragg shows the results of the Reject
24 Distant Bragg and the Reject Noise/Ionospheric tests by coloring the first order lines in a paler pink than the accepted first order region in the Spectra Color Map. These two tests must be checked in the First Order Settings window for this feature to display. Power -> Bound First Order replaces the continuous first order line with its vertical elements only. Power -> Adjust Black Out Opaque adjusts the opaqueness of the black out portion of the Spectra Color Map when Blackout is checked. Selecting 100% hides the underlying data, whereas lowering it allows it to bleed through. Power -> Loop 1 toggles the appearance of the loop 1 plot in the Spectra Color Map. Power -> Loop 2 toggles the appearance of the loop 2 plot in the Spectra Color Map. Power -> Vertical toggles the appearance of the vertical antenna plot in the Spectra Color Map.
25 Graph Menu The Graph menu controls font size of axes and the variables that are plotted. Graph -> Font Bigger increases the font size of all three plots. Graph -> Font Smaller decreases the font size of all three plots. Graph -> Set Default Font Size applies the default font size of all three plots. Graph -> Toggle Range Units cycles through available options for range units (displayed on the horizontal axis of the Doppler Slice and on the vertical axis of the Spectra Color Map). Graph -> Range Cells sets the units of range in terms of range cell. Graph -> Range Kilometers sets the units of range in terms of kilometers. Graph -> Range Miles sets the units of range in terms of miles. Graph -> Range Nautical Miles sets the units of range in terms of nautical miles. Graph -> Toggle Doppler Units cycles through available options for Doppler. units (displayed on the horizontal axis of the Range Slice and on the horizontal axis of the Spectra Color Map).
26 Graph -> Doppler Bins from DC sets the units of Doppler in terms of Doppler bins from DC (zero Doppler). Graph -> Doppler Bins Index sets the units of Doppler in terms of Doppler bin index. Graph -> Doppler Radial Velocity cm/s sets the units of Doppler in terms of radial current velocity in centimeters per second. Graph -> Doppler Target Velocity m/s sets the units of Doppler in terms of Doppler velocity in meters per second. Graph -> Doppler Target Velocity mph sets the units of Doppler in terms of Doppler velocity in miles per hour. Graph -> Doppler Hz sets the units of Doppler in terms hertz. Zoom Menu The zoom window controls the size of the Spectra Color Map window. The Info, Doppler Slice, and Range Slice windows can be adjusted by right selecting a corner and dragging the mouse. The Spectra Color Map window, however, is comprised of pixels that can t be adjusted as freely. Zoom -> Zoom In Range/Doppler increases both dimensions of the Spectra Color Map window. Zoom -> Zoom Out Range/Doppler decreases both dimensions of the Spectra Color Map window. Zoom -> Zoom In Range increases the vertical dimension of the Spectra Color Map window.
27 Zoom -> Zoom Out Range increases the vertical dimension of the Spectra Color Map window. Zoom -> Zoom In Doppler increases the horizontal dimension of the Spectra Color Map window. Zoom -> Zoom Out Doppler increases the horizontal dimension of the Spectra Color Map window. Zoom -> Zoom To Default returns the Spectra Color Map window to its original state. View Menu View -> Hide Toolbar toggles the appearance of the toolbar in Spectra Color Map.
28 Window Menu The Window menu controls which windows are active and how they appear. Pressing the option key before the Minimize or Zoom commands applies them to all open windows. Bring All to Front and Arrange in Front provides a quick way to locate your open SpectraPlotterMap windows. The Spectra Information, Spectra Color Map, Range Slice, and Doppler Slice can be activated and deactivated with this menu. See above sections on these windows for details about their content. The active spectra file is shown at the bottom of this menu.
29 Revision History First Draft Sep 14, 2016 Copyright and Disclaimer This document is copyrighted(c) by CODAR Ocean Sensors, Ltd and cannot be copied or reproduced in all or partial without expressed written consent by CODAR Ocean Sensors, Ltd.
E X P E R I M E N T 1
 E X P E R I M E N T 1 Getting to Know Data Studio Produced by the Physics Staff at Collin College Copyright Collin College Physics Department. All Rights Reserved. University Physics, Exp 1: Getting to
Processing data with Mestrelab Mnova
 Processing data with Mestrelab Mnova This exercise has three parts: a 1D 1 H spectrum to baseline correct, integrate, peak-pick, and plot; a 2D spectrum to plot with a 1 H spectrum as a projection; and
MestReNova A quick Guide. Adjust signal intensity Use scroll wheel. Zoomen Z
 MestReNova A quick Guide page 1 MNova is a program to analyze 1D- and 2D NMR data. Start of MNova Start All Programs Chemie NMR MNova The MNova Menu 1. 2. Create expanded regions Adjust signal intensity
PS User Guide Series Seismic-Data Display
 PS User Guide Series 2015 Seismic-Data Display Prepared By Choon B. Park, Ph.D. January 2015 Table of Contents Page 1. File 2 2. Data 2 2.1 Resample 3 3. Edit 4 3.1 Export Data 4 3.2 Cut/Append Records
SEM- EDS Instruction Manual
 SEM- EDS Instruction Manual Double-click on the Spirit icon ( ) on the desktop to start the software program. I. X-ray Functions Access the basic X-ray acquisition, display and analysis functions through
The BAT WAVE ANALYZER project
 The BAT WAVE ANALYZER project Conditions of Use The Bat Wave Analyzer program is free for personal use and can be redistributed provided it is not changed in any way, and no fee is requested. The Bat Wave
MIE 402: WORKSHOP ON DATA ACQUISITION AND SIGNAL PROCESSING Spring 2003
 MIE 402: WORKSHOP ON DATA ACQUISITION AND SIGNAL PROCESSING Spring 2003 OBJECTIVE To become familiar with state-of-the-art digital data acquisition hardware and software. To explore common data acquisition
Linkage 3.6. User s Guide
 Linkage 3.6 User s Guide David Rector Friday, December 01, 2017 Table of Contents Table of Contents... 2 Release Notes (Recently New and Changed Stuff)... 3 Installation... 3 Running the Linkage Program...
GS122-2L. About the speakers:
 Dan Leighton DL Consulting Andrea Bell GS122-2L A growing number of utilities are adapting Autodesk Utility Design (AUD) as their primary design tool for electrical utilities. You will learn the basics
Standard Operating Procedure of nanoir2-s
 Standard Operating Procedure of nanoir2-s The Anasys nanoir2 system is the AFM-based nanoscale infrared (IR) spectrometer, which has a patented technique based on photothermal induced resonance (PTIR),
MestReNova Manual for Chem 201/202. October, 2015.
 1. Introduction to 1-D NMR Data Processing with MestReNova The MestReNova program can do all of the routine NMR data processing needed for Chem 201 and 202 and will be available through the Reed downloads
Reference. TDS7000 Series Digital Phosphor Oscilloscopes
 Reference TDS7000 Series Digital Phosphor Oscilloscopes 07-070-00 0707000 To Use the Front Panel You can use the dedicated, front-panel knobs and buttons to do the most common operations. Turn INTENSITY
Lab experience 1: Introduction to LabView
 Lab experience 1: Introduction to LabView LabView is software for the real-time acquisition, processing and visualization of measured data. A LabView program is called a Virtual Instrument (VI) because
PulseCounter Neutron & Gamma Spectrometry Software Manual
 PulseCounter Neutron & Gamma Spectrometry Software Manual MAXIMUS ENERGY CORPORATION Written by Dr. Max I. Fomitchev-Zamilov Web: maximus.energy TABLE OF CONTENTS 0. GENERAL INFORMATION 1. DEFAULT SCREEN
Linrad On-Screen Controls K1JT
 Linrad On-Screen Controls K1JT Main (Startup) Menu A = Weak signal CW B = Normal CW C = Meteor scatter CW D = SSB E = FM F = AM G = QRSS CW H = TX test I = Soundcard test mode J = Analog hardware tune
Precision DeEsser Users Guide
 Precision DeEsser Users Guide Metric Halo $Revision: 1670 $ Publication date $Date: 2012-05-01 13:50:00-0400 (Tue, 01 May 2012) $ Copyright 2012 Metric Halo. MH Production Bundle, ChannelStrip 3, Character,
Please feel free to download the Demo application software from analogarts.com to help you follow this seminar.
 Hello, welcome to Analog Arts spectrum analyzer tutorial. Please feel free to download the Demo application software from analogarts.com to help you follow this seminar. For this presentation, we use a
Exercise #1: Create and Revise a Smart Group
 EndNote X7 Advanced: Hands-On for CDPH Sheldon Margen Public Health Library, UC Berkeley Exercise #1: Create and Revise a Smart Group Objective: Learn how to create and revise Smart Groups to automate
Technical Specifications
 1 Contents INTRODUCTION...3 ABOUT THIS LAB...3 IMPORTANCE OF THE MODULE...3 APPLYING IMAGE ENHANCEMENTS...4 Adjusting Toolbar Enhancement...4 EDITING A LOOKUP TABLE...5 Trace-editing the LUT...6 Comparing
PHY221 Lab 1 Discovering Motion: Introduction to Logger Pro and the Motion Detector; Motion with Constant Velocity
 PHY221 Lab 1 Discovering Motion: Introduction to Logger Pro and the Motion Detector; Motion with Constant Velocity Print Your Name Print Your Partners' Names Instructions August 31, 2016 Before lab, read
BEAMAGE 3.0 KEY FEATURES BEAM DIAGNOSTICS PRELIMINARY AVAILABLE MODEL MAIN FUNCTIONS. CMOS Beam Profiling Camera
 PRELIMINARY POWER DETECTORS ENERGY DETECTORS MONITORS SPECIAL PRODUCTS OEM DETECTORS THZ DETECTORS PHOTO DETECTORS HIGH POWER DETECTORS CMOS Beam Profiling Camera AVAILABLE MODEL Beamage 3.0 (⅔ in CMOS
WAVES H-EQ HYBRID EQUALIZER USER GUIDE
 WAVES H-EQ HYBRID EQUALIZER USER GUIDE TABLE OF CONTENTS CHAPTER 1 INTRODUCTION...3 1.1 WELCOME...3 1.2 PRODUCT OVERVIEW...3 1.3 CONCEPTS AND TERMINOLOGY...4 1.4 COMPONENTS...7 CHAPTER 2 QUICK START GUIDE...8
MultiSpec Tutorial: Visualizing Growing Degree Day (GDD) Images. In this tutorial, the MultiSpec image processing software will be used to:
 Images. In this tutorial, the MultiSpec image processing software will be used to:") MultiSpec Tutorial: Background: This tutorial illustrates how MultiSpec can me used for handling and analysis of general geospatial images. The image data used in this example is not multispectral data
MultiSpec Tutorial: Background: This tutorial illustrates how MultiSpec can me used for handling and analysis of general geospatial images. The image data used in this example is not multispectral data
Film-Tech. The information contained in this Adobe Acrobat pdf file is provided at your own risk and good judgment.
 Film-Tech The information contained in this Adobe Acrobat pdf file is provided at your own risk and good judgment. These manuals are designed to facilitate the exchange of information related to cinema
Getting Started. Connect green audio output of SpikerBox/SpikerShield using green cable to your headphones input on iphone/ipad.
 Getting Started First thing you should do is to connect your iphone or ipad to SpikerBox with a green smartphone cable. Green cable comes with designators on each end of the cable ( Smartphone and SpikerBox
For the SIA. Applications of Propagation Delay & Skew tool. Introduction. Theory of Operation. Propagation Delay & Skew Tool
 For the SIA Applications of Propagation Delay & Skew tool Determine signal propagation delay time Detect skewing between channels on rising or falling edges Create histograms of different edge relationships
Cisco Spectrum Expert Software Overview
 CHAPTER 5 If your computer has an 802.11 interface, it should be enabled in order to detect Wi-Fi devices. If you are connected to an AP or ad-hoc network through the 802.11 interface, you will occasionally
The Measurement Tools and What They Do
 2 The Measurement Tools The Measurement Tools and What They Do JITTERWIZARD The JitterWizard is a unique capability of the JitterPro package that performs the requisite scope setup chores while simplifying
WAVES Cobalt Saphira. User Guide
 WAVES Cobalt Saphira TABLE OF CONTENTS Chapter 1 Introduction... 3 1.1 Welcome... 3 1.2 Product Overview... 3 1.3 Components... 5 Chapter 2 Quick Start Guide... 6 Chapter 3 Interface and Controls... 7
Chapter 4 Working with Bands
 Chapter 4 Working with Bands Introduction This chapter explains how to create band areas; insert, move, and copy band lines; and specify and modify band line properties. This information is presented in
Dektak Step by Step Instructions:
 Dektak Step by Step Instructions: Before Using the Equipment SIGN IN THE LOG BOOK Part 1: Setup 1. Turn on the switch at the back of the dektak machine. Then start up the computer. 2. Place the sample
Experiment: Real Forces acting on a Falling Body
 Phy 201: Fundamentals of Physics I Lab 1 Experiment: Real Forces acting on a Falling Body Objectives: o Observe and record the motion of a falling body o Use video analysis to analyze the motion of a falling
1 Ver.mob Brief guide
 1 Ver.mob 14.02.2017 Brief guide 2 Contents Introduction... 3 Main features... 3 Hardware and software requirements... 3 The installation of the program... 3 Description of the main Windows of the program...
imso-104 Manual Revised August 5, 2011
 imso-104 Manual Revised August 5, 2011 Section 1 Getting Started SAFETY 1.10 Quickstart Guide 1.20 SAFETY 1.30 Compatibility 1.31 Hardware 1.32 Software Section 2 How it works 2.10 Menus 2.20 Analog Channel
McIDAS-V Tutorial Using HYDRA to Interrogate Hyperspectral Data updated September 2015 (software version 1.5)
") McIDAS-V Tutorial Using HYDRA to Interrogate Hyperspectral Data updated September 2015 (software version 1.5) McIDAS-V is a free, open source, visualization and data analysis software package that is the
McIDAS-V Tutorial Using HYDRA to Interrogate Hyperspectral Data updated September 2015 (software version 1.5) McIDAS-V is a free, open source, visualization and data analysis software package that is the
Camtasia for Mac. Create Your First Video Guide. Release 1.1. February TechSmith Corporation. All rights reserved.
 Camtasia for Mac Create Your First Video Guide Release 1.1 February 2009 2009 TechSmith Corporation. All rights reserved. Contents Contents Planning your video... 1 Should I record my entire screen or
SIDRA INTERSECTION 8.0 UPDATE HISTORY
 Akcelik & Associates Pty Ltd PO Box 1075G, Greythorn, Vic 3104 AUSTRALIA ABN 79 088 889 687 For all technical support, sales support and general enquiries: support.sidrasolutions.com SIDRA INTERSECTION
J.M. Stewart Corporation 2201 Cantu Ct., Suite 218 Sarasota, FL Stewartsigns.com
 DataMax INDOOR LED MESSAGE CENTER OWNER S MANUAL QUICK START J.M. Stewart Corporation 2201 Cantu Ct., Suite 218 Sarasota, FL 34232 800-237-3928 Stewartsigns.com J.M. Stewart Corporation Indoor LED Message
NENS 230 Assignment #2 Data Import, Manipulation, and Basic Plotting
 NENS 230 Assignment #2 Data Import, Manipulation, and Basic Plotting Compound Action Potential Due: Tuesday, October 6th, 2015 Goals Become comfortable reading data into Matlab from several common formats
Multiband Noise Reduction Component for PurePath Studio Portable Audio Devices
 Multiband Noise Reduction Component for PurePath Studio Portable Audio Devices Audio Converters ABSTRACT This application note describes the features, operating procedures and control capabilities of a
BrainMaster tm System Type 2E Module & BMT Software for Windows tm. Display Screens for Master.exe
 BrainMaster tm System Type 2E Module & BMT Software for Windows tm Display Screens for Master.exe 1995-2004 BrainMaster Technologies, Inc., All Rights Reserved BrainMaster and From the Decade of the Brain
Analyzing and Saving a Signal
 Analyzing and Saving a Signal Approximate Time You can complete this exercise in approximately 45 minutes. Background LabVIEW includes a set of Express VIs that help you analyze signals. This chapter teaches
Quick reference guide
 Quick reference guide Manufactured by: Esaote Europe B.V. Philipsweg 1 6227 AJ Maastricht The Netherlands Tel. +31 (43) 382 4600 Fax +31 (43) 382 4601 Internet: www.esaote.com Email: international.sales@esaote.com
GLog Users Manual.
 GLog Users Manual GLog is copyright 2000 Scott Technical Instruments It may be copied freely provided that it remains unmodified, and this manual is distributed with it. www.scottech.net Introduction GLog
Topic: Instructional David G. Thomas December 23, 2015
 Procedure to Setup a 3ɸ Linear Motor This is a guide to configure a 3ɸ linear motor using either analog or digital encoder feedback with an Elmo Gold Line drive. Topic: Instructional David G. Thomas December
DIGITAL PERSONAL STUDIO Version 1.30 Addendum
 DIGITAL PERSONAL STUDIO Version 1.30 Addendum Contents V1.30 FEATURES...1 AK.SYS TRACKVIEW...2 INSTALLING AK.SYS TRACKVIEW...2 USING AK.SYS TRACKVIEW...3 METERS...4 IN / OUT TIMES...5 TIMECODE DISPLAY...5
KRAMER ELECTRONICS LTD. USER MANUAL
 KRAMER ELECTRONICS LTD. USER MANUAL MODEL: Projection Curved Screen Blend Guide How to blend projection images on a curved screen using the Warp Generator version K-1.4 Introduction The guide describes
MachineryMate 800 operating guide Handheld vibration meter
 MachineryMate 800 operating guide Handheld vibration meter Wilcoxon Sensing Technologies 20511 Seneca Meadows Parkway, Germantown MD 20876, USA Amphenol (Maryland), Inc d/b/a Wilcoxon Sensing Technologies
Spectrum Analyser Basics
 Hands-On Learning Spectrum Analyser Basics Peter D. Hiscocks Syscomp Electronic Design Limited Email: phiscock@ee.ryerson.ca June 28, 2014 Introduction Figure 1: GUI Startup Screen In a previous exercise,
EASY-MCS. Multichannel Scaler. Profiling Counting Rates up to 150 MHz with 15 ppm Time Resolution.
 Multichannel Scaler Profiling Counting Rates up to 150 MHz with 15 ppm Time Resolution. The ideal solution for: Time-resolved single-photon counting Phosphorescence lifetime spectrometry Atmospheric and
User Manual VM700T Video Measurement Set Option 30 Component Measurements
 User Manual VM700T Video Measurement Set Option 30 Component Measurements 070-9654-01 Test Equipment Depot - 800.517.8431-99 Washington Street Melrose, MA 02176 - FAX 781.665.0780 - TestEquipmentDepot.com
Eventide Inc. One Alsan Way Little Ferry, NJ
 Copyright 2015, Eventide Inc. P/N: 141257, Rev 2 Eventide is a registered trademark of Eventide Inc. AAX and Pro Tools are trademarks of Avid Technology. Names and logos are used with permission. Audio
EDL8 Race Dash Manual Engine Management Systems
 Engine Management Systems EDL8 Race Dash Manual Engine Management Systems Page 1 EDL8 Race Dash Page 2 EMS Computers Pty Ltd Unit 9 / 171 Power St Glendenning NSW, 2761 Australia Phone.: +612 9675 1414
Source/Receiver (SR) Setup
 Setup") PS User Guide Series 2015 Source/Receiver (SR) Setup For 1-D and 2-D Vs Profiling Prepared By Choon B. Park, Ph.D. January 2015 Table of Contents Page 1. Overview 2 2. Source/Receiver (SR) Setup Main Menu
PS User Guide Series 2015 Source/Receiver (SR) Setup For 1-D and 2-D Vs Profiling Prepared By Choon B. Park, Ph.D. January 2015 Table of Contents Page 1. Overview 2 2. Source/Receiver (SR) Setup Main Menu
User's Guide SISII. Sound Editor STC-S521. User s Guide
 User's Guide SISII Sound Editor STC-S521 User s Guide ABSTRACT Thank you for purchasing SIS II Sound Editor! We hope that our software will improve the quality of your tasks accomplishment. IKARLab. Before
White Paper JBL s LSR Principle, RMC (Room Mode Correction) and the Monitoring Environment by John Eargle. Introduction and Background:
 and the Monitoring Environment by John Eargle. Introduction and Background:") White Paper JBL s LSR Principle, RMC (Room Mode Correction) and the Monitoring Environment by John Eargle Introduction and Background: Although a loudspeaker may measure flat on-axis under anechoic conditions,
White Paper JBL s LSR Principle, RMC (Room Mode Correction) and the Monitoring Environment by John Eargle Introduction and Background: Although a loudspeaker may measure flat on-axis under anechoic conditions,
SOUND LABORATORY LING123: SOUND AND COMMUNICATION
 SOUND LABORATORY LING123: SOUND AND COMMUNICATION In this assignment you will be using the Praat program to analyze two recordings: (1) the advertisement call of the North American bullfrog; and (2) the
Blueline, Linefree, Accuracy Ratio, & Moving Absolute Mean Ratio Charts
 INTRODUCTION This instruction manual describes for users of the Excel Standard Celeration Template(s) the features of each page or worksheet in the template, allowing the user to set up and generate charts
Agilent DSO5014A Oscilloscope Tutorial
 Contents UNIVERSITY OF CALIFORNIA AT BERKELEY College of Engineering Department of Electrical Engineering and Computer Sciences EE105 Lab Experiments Agilent DSO5014A Oscilloscope Tutorial 1 Introduction
Quick Start for TrueRTA (v3.5) on Windows XP (and earlier)
 on Windows XP (and earlier)") Skip directly to the section that covers your version of Windows (XP and earlier, Vista or Windows 7) Quick Start for TrueRTA (v3.5) on Windows XP (and earlier) Here are step-by-step instructions to get
Skip directly to the section that covers your version of Windows (XP and earlier, Vista or Windows 7) Quick Start for TrueRTA (v3.5) on Windows XP (and earlier) Here are step-by-step instructions to get
D-901 PC SOFTWARE Version 3
 INSTRUCTION MANUAL D-901 PC SOFTWARE Version 3 Please follow the instructions in this manual to obtain the optimum results from this unit. We also recommend that you keep this manual handy for future reference.
TL-2900 AMMONIA & NITRATE ANALYZER DUAL CHANNEL
 TL-2900 AMMONIA & NITRATE ANALYZER DUAL CHANNEL DATA ACQUISITION SYSTEM V.15.4 INSTRUCTION MANUAL Timberline Instruments, LLC 1880 S. Flatiron Ct., Unit I Boulder, Colorado 80301 Ph: (303) 440-8779 Fx:
VivoSense. User Manual Galvanic Skin Response (GSR) Analysis Module. VivoSense, Inc. Newport Beach, CA, USA Tel. (858) , Fax.
 Analysis Module. VivoSense, Inc. Newport Beach, CA, USA Tel. (858) , Fax.") VivoSense User Manual Galvanic Skin Response (GSR) Analysis VivoSense Version 3.1 VivoSense, Inc. Newport Beach, CA, USA Tel. (858) 876-8486, Fax. (248) 692-0980 Email: info@vivosense.com; Web: www.vivosense.com
VivoSense User Manual Galvanic Skin Response (GSR) Analysis VivoSense Version 3.1 VivoSense, Inc. Newport Beach, CA, USA Tel. (858) 876-8486, Fax. (248) 692-0980 Email: info@vivosense.com; Web: www.vivosense.com
TechNote: MuraTool CA: 1 2/9/00. Figure 1: High contrast fringe ring mura on a microdisplay
 Mura: The Japanese word for blemish has been widely adopted by the display industry to describe almost all irregular luminosity variation defects in liquid crystal displays. Mura defects are caused by
Getting Started with the LabVIEW Sound and Vibration Toolkit
 1 Getting Started with the LabVIEW Sound and Vibration Toolkit This tutorial is designed to introduce you to some of the sound and vibration analysis capabilities in the industry-leading software tool
CHEMISTRY SEMESTER ONE
 APPENDIX A USING THE SPECTROMETER FOR AN EMISSION SPECTROSCOPY NANSLO REMOTE WEB-BASED SCIENCE LAB ACTIVITY The following provides information how to use the spectrometer controls for the Emission Spectroscopy
Discreet Logic Inc., All Rights Reserved. This documentation contains proprietary information of Discreet Logic Inc. and its subsidiaries.
 Discreet Logic Inc., 1996-2000. All Rights Reserved. This documentation contains proprietary information of Discreet Logic Inc. and its subsidiaries. No part of this documentation may be reproduced, stored
MAutoPitch. Presets button. Left arrow button. Right arrow button. Randomize button. Save button. Panic button. Settings button
 MAutoPitch Presets button Presets button shows a window with all available presets. A preset can be loaded from the preset window by double-clicking on it, using the arrow buttons or by using a combination
CHAPTER 7 BASIC GRAPHICS, EVENTS AND GLOBAL DATA
 VERSION 1 BASIC GRAPHICS, EVENTS AND GLOBAL DATA CHAPTER 7 BASIC GRAPHICS, EVENTS, AND GLOBAL DATA In this chapter, the graphics features of TouchDevelop are introduced and then combined with scripts when
spiff manual version 1.0 oeksound spiff adaptive transient processor User Manual
 oeksound spiff adaptive transient processor User Manual 1 of 9 Thank you for using spiff! spiff is an adaptive transient tool that cuts or boosts only the frequencies that make up the transient material,
Thought Technology Ltd Belgrave Avenue, Montreal, QC H4A 2L8 Canada
 Thought Technology Ltd. 2180 Belgrave Avenue, Montreal, QC H4A 2L8 Canada Tel: (800) 361-3651 ٠ (514) 489-8251 Fax: (514) 489-8255 E-mail: _Hmail@thoughttechnology.com Webpage: _Hhttp://www.thoughttechnology.com
Dave Jones Design Phone: (607) Lake St., Owego, NY USA
 Lake St., Owego, NY USA") Manual v1.00a June 1, 2016 for firmware vers. 2.00 Dave Jones Design Phone: (607) 687-5740 34 Lake St., Owego, NY 13827 USA www.jonesvideo.com O Tool Plus - User Manual Main mode NOTE: New modules are
Manual v1.00a June 1, 2016 for firmware vers. 2.00 Dave Jones Design Phone: (607) 687-5740 34 Lake St., Owego, NY 13827 USA www.jonesvideo.com O Tool Plus - User Manual Main mode NOTE: New modules are
Chapter 40: MIDI Tool
 MIDI Tool 40-1 40: MIDI Tool MIDI Tool What it does This tool lets you edit the actual MIDI data that Finale stores with your music key velocities (how hard each note was struck), Start and Stop Times
SmartScore Quick Tour
 SmartScore Quick Tour Installation With the packaged CD, you will be able to install SmartScore an unlimited number of times onto your computer. Application files should not be copied to other computers.
PicoScope 6 Training Manual
 PicoScope 6 Training Manual DO226 PicoScope 6 Training Manual r2.docx Copyright 2014 Pico Technology CONTENTS 1 Quick guide to PicoScope 6... 1 1.1 The PicoScope way... 1 1.2 Signal view... 2 1.3 Timebase...
USER MANUAL FOR DDT 2D. Introduction. Installation. Getting Started. Danley Design Tool 2d. Welcome to the Danley Design Tool 2D program.
 USER MANUAL FOR DDT 2D ( VERSION 1.8) Welcome to the Danley Design Tool 2D program. Introduction DDT2D is a very powerful tool that lets the user visualize how sound propagates from loudspeakers, including
PicoScope. User guide. Copyright 2005 Pico Technology Limited. All rights reserved. PSW044 v1.5
 PicoScope User guide I PicoScope User Guide Table of Contents 1 Introduction...3...3 1 What is PicoScope?...3 2 Why use PicoScope?...4 3 Screen layout...4 4 Display area...5 5 Customisation...5 6 Exporting
SNG-2150C User s Guide
 SNG-2150C User s Guide Avcom of Virginia SNG-2150C User s Guide 7730 Whitepine Road Revision 001 Richmond, VA 23237 USA GENERAL SAFETY If one or more components of your earth station are connected to 120
Reason Overview3. Reason Overview
 Reason Overview3 In this chapter we ll take a quick look around the Reason interface and get an overview of what working in Reason will be like. If Reason is your first music studio, chances are the interface
BVS Indoor Forecaster Predictive RF In-Building Survey Analysis for CW Signals
 BVS Indoor Forecaster Predictive RF In-Building Survey Analysis for CW Signals User Manual Version 1.5 Version 120607 Copyright!2010, Berkeley Varitronics Systems, Inc. All Rights Reserved Table of Contents
WiPry User Manual. 2.4 GHz Wireless Troubleshooting
 WiPry User Manual 2.4 GHz Wireless Troubleshooting 1 Table of Contents Section 1 Getting Started 1.10 Quickstart Guide 1.20 Compatibility Section 2 How WiPry Works 2.10 Basics 2.11 Screen Layout 2.12 Color
Field Test 2. Installation and operation manual OPDAQ Installation and operation manual
 Field Test 2 Installation and operation manual OPDAQ 17.08.25 Installation and operation manual January 2016 How to get copies of OpDAQ technical publications: 53, St-Germain Ouest Rimouski, Québec Canada
VideoClock. Quick Start
 VideoClock Quick Start Connect Limitimer, thetimeprompt, or PerfectCue to the dongle and the dongle to the USB port. (Note: Both the dongle and software are matched to the respective device. Do not mix.
-1GUIDE FOR THE PRACTICAL USE OF NUBES
 -1GUIDE FOR THE PRACTICAL USE OF NUBES 1. 2. 3. 4. 5. 6. 7. Grib visualisation. Use of the scatter plots Extreme enhancement for imagery Display of AVHRR Transects Programming products IASI profiles 1.
USB Mini Spectrum Analyzer User s Guide TSA5G35
 USB Mini Spectrum Analyzer User s Guide TSA5G35 Triarchy Technologies, Corp. Page 1 of 21 USB Mini Spectrum Analyzer User s Guide Copyright Notice Copyright 2011 Triarchy Technologies, Corp. All rights
Table of Contents Introduction
 Page 1/9 Waveforms 2015 tutorial 3-Jan-18 Table of Contents Introduction Introduction to DAD/NAD and Waveforms 2015... 2 Digital Functions Static I/O... 2 LEDs... 2 Buttons... 2 Switches... 2 Pattern Generator...
Formatting Dissertations or Theses for UMass Amherst with MacWord 2008
 January 2015 Formatting Dissertations or Theses for UMass Amherst with MacWord 2008 Getting started make your life easy (or easier at least) 1. Read the Graduate School s Guidelines and follow their rules.
A few quick notes about the use of Spectran V2
 A few quick notes about the use of Spectran V2 The full fledged help file of Spectran is not ready yet, but many have asked for some sort of help. This document tries to explain in a quick-and-dirty way
User s Manual. Log Scale (/LG) GX10/GX20/GP10/GP20/GM10 IM 04L51B01-06EN. 3rd Edition
 GX10/GX20/GP10/GP20/GM10 IM 04L51B01-06EN. 3rd Edition") User s Manual Model GX10/GX20/GP10/GP20/GM10 Log Scale (/LG) 3rd Edition Introduction Thank you for purchasing the SMARTDAC+ Series GX10/GX20/GP10/GP20/GM10 (hereafter referred to as the recorder, GX,
User s Manual Model GX10/GX20/GP10/GP20/GM10 Log Scale (/LG) 3rd Edition Introduction Thank you for purchasing the SMARTDAC+ Series GX10/GX20/GP10/GP20/GM10 (hereafter referred to as the recorder, GX,
Introduction To LabVIEW and the DSP Board
 EE-289, DIGITAL SIGNAL PROCESSING LAB November 2005 Introduction To LabVIEW and the DSP Board 1 Overview The purpose of this lab is to familiarize you with the DSP development system by looking at sampling,
Advanced Techniques for Spurious Measurements with R&S FSW-K50 White Paper
 Advanced Techniques for Spurious Measurements with R&S FSW-K50 White Paper Products: ı ı R&S FSW R&S FSW-K50 Spurious emission search with spectrum analyzers is one of the most demanding measurements in
Tutorial 3 Normalize step-cycles, average waveform amplitude and the Layout program
 Tutorial 3 Normalize step-cycles, average waveform amplitude and the Layout program Step cycles are defined usually by choosing a recorded ENG waveform that shows long lasting, continuos, consistently
APA Research Paper Chapter 2 Supplement
 Microsoft Office Word 00 Appendix D APA Research Paper Chapter Supplement Project Research Paper Based on APA Documentation Style As described in Chapter, two popular documentation styles for research
Capstone screen shows live video with sync to force and velocity data. Try it! Download a FREE 60-day trial at pasco.com/capstone
 Capstone screen shows live video with sync to force and velocity data. Try it! Download a FREE 60-day trial at pasco.com/capstone If you use these PSCO USB interfaces in your lab, it s time for PSCO Capstone
Defining and Labeling Circuits and Electrical Phasing in PLS-CADD
 610 N. Whitney Way, Suite 160 Madison, WI 53705 Phone: 608.238.2171 Fax: 608.238.9241 Email:info@powline.com URL: http://www.powline.com Defining and Labeling Circuits and Electrical Phasing in PLS-CADD
v. 8.0 GMS 8.0 Tutorial MODFLOW Grid Approach Build a MODFLOW model on a 3D grid Prerequisite Tutorials None Time minutes
 v. 8.0 GMS 8.0 Tutorial Build a MODFLOW model on a 3D grid Objectives The grid approach to MODFLOW pre-processing is described in this tutorial. In most cases, the conceptual model approach is more powerful
Guide to Analysing Full Spectrum/Frequency Division Bat Calls with Audacity (v.2.0.5) by Thomas Foxley
 by Thomas Foxley") Guide to Analysing Full Spectrum/Frequency Division Bat Calls with Audacity (v.2.0.5) by Thomas Foxley Contents Getting Started Setting Up the Sound File Noise Removal Finding All the Bat Calls Call Analysis
Guide to Analysing Full Spectrum/Frequency Division Bat Calls with Audacity (v.2.0.5) by Thomas Foxley Contents Getting Started Setting Up the Sound File Noise Removal Finding All the Bat Calls Call Analysis
CIE CIE
 U S E R M A N U A L Table of Contents Welcome to ColorFacts... 4 Installing ColorFacts... 5 Checking for ColorFacts Updates... 5 ColorFacts Registration... 6 ColorFacts Dongle... 6 Uninstalling ColorFacts...
9070 Smart Vibration Meter Instruction Manual
 9070 Smart Vibration Meter Instruction Manual Overall machine and bearing conditions: vibration values are displayed with color coded alarm levels for ISO values and Bearing Damage (BDU). Easy vibration
Noise. CHEM 411L Instrumental Analysis Laboratory Revision 2.0
 CHEM 411L Instrumental Analysis Laboratory Revision 2.0 Noise In this laboratory exercise we will determine the Signal-to-Noise (S/N) ratio for an IR spectrum of Air using a Thermo Nicolet Avatar 360 Fourier