REPORT DOCUMENTATION PAGE
|
|
|
- Scot Page
- 5 years ago
- Views:
Transcription
1
2 REPORT DOCUMENTATION PAGE Form Approved OMB No Public reporting burden for this collection of information is estimated to average 1 hour per response, including the time for reviewing instructions, searching existing data sources, gathering and maintaining the data needed, and completing and reviewing this collection of information. Send comments regarding this burden estimate or any other aspect of this collection of information, including suggestions for reducing this burden to Department of Defense, Washington Headquarters Services, Directorate for Information Operations and Reports ( ), 1215 Jefferson Davis Highway, Suite 1204, Arlington, VA Respondents should be aware that notwithstanding any other provision of law, no person shall be subject to any penalty for failing to comply with a collection of information if it does not display a currently valid OMB control number. PLEASE DO NOT RETURN YOUR FORM TO THE ABOVE ADDRESS. 1. REPORT DATE 01 Jun REPORT TYPE Technical Paper 4. TITLE AND SUBTITLE Science of Test Measurement Accuracy - Data Sampling and Filter Selection during Data Acquisition 3. DATES COVERED (From - To) 5a. CONTRACT NUMBER 5b. GRANT NUMBER 5c. PROGRAM ELEMENT NUMBER 6. AUTHOR(S) David S. Kidman 5d. PROJECT NUMBER 5e. TASK NUMBER 5f. WORK UNIT NUMBER 7. PERFORMING ORGANIZATION NAME(S) AND ADDRESS(ES) AND ADDRESS(ES) Air Force Test Center 412 Test Wing, 312 TENG/773TS/ENFP 8. PERFORMING ORGANIZATION REPORT NUMBER 412TW-PA SPONSORING / MONITORING AGENCY NAME(S) AND ADDRESS(ES) N/A 10. SPONSOR/MONITOR S ACRONYM(S) N/A 11. SPONSOR/MONITOR S REPORT NUMBER(S) 12. DISTRIBUTION / AVAILABILITY STATEMENT Approved for public release A: distribution is unlimited. 13. SUPPLEMENTARY NOTES CA: Air Force Test Center Edwards AFB CA CC: ABSTRACT Know how to specify our instrumentation requirements, especially the sample rates? We all know about the Nyquist frequency and choosing sample rates that are at least twice the Nyquist to prevent aliasing. But did you know that your data may contain high frequency content that can alias down and muddle the frequencies you care about? Once the aliased signal is digitized it can never be recovered. Your data might be ruined! Your instrumentation engineers know about this, and that is why they added anti-aliasing filters to your data acquisition system. What is an anti-alias filter? I don t know, but I m sure my instrumentation engineer knows exactly what I need! Wrong. Your instrumentation engineer DOESN T know what you need and probably chose a 6-pole butterworth filter with a specific cutoff because that s what they used last time. To achieve quality measurements with accurate magnitude and frequency content, the test must start by using comprehensive signal processing principles during initial data acquisition (e.g., correct data sample rates and anti-alias filter selection). To achieve quality measurements, the discipline engineer must verify proper data sampling and filtering principles have been applied during the data acquisition process. Example of how to determine sample rate and filter selection during data acquisition are provided. 15. SUBJECT TERMS data acquisition, Nyquist frequency, sampling rate, aliasing, filtering, butterworth, chebyshev, Bessel, PSD and Bode plots 16. SECURITY CLASSIFICATION OF: Unclassified a. REPORT Unclassified b. ABSTRACT Unclassified 17. LIMITATION OF ABSTRACT 18. NUMBER OF PAGES c. THIS PAGE Unclassified None 32 19a. NAME OF RESPONSIBLE PERSON 412 TENG/EN (Tech Pubs) 19b. TELEPHONE NUMBER (include area code) Standard Form 298 (Rev. 8-98) Prescribed by ANSI Std. Z39.18
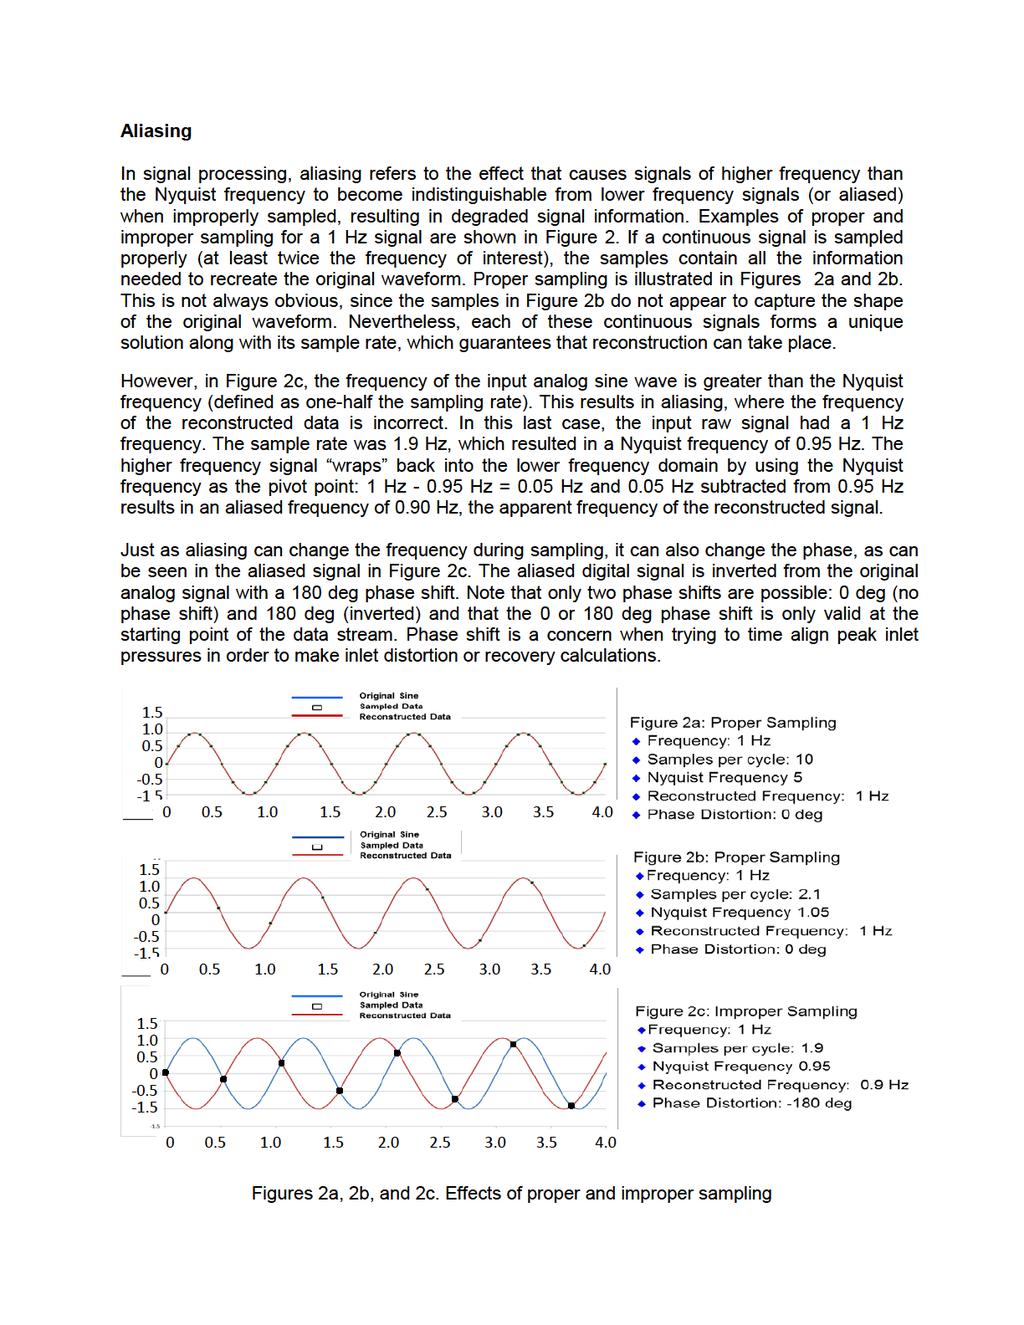
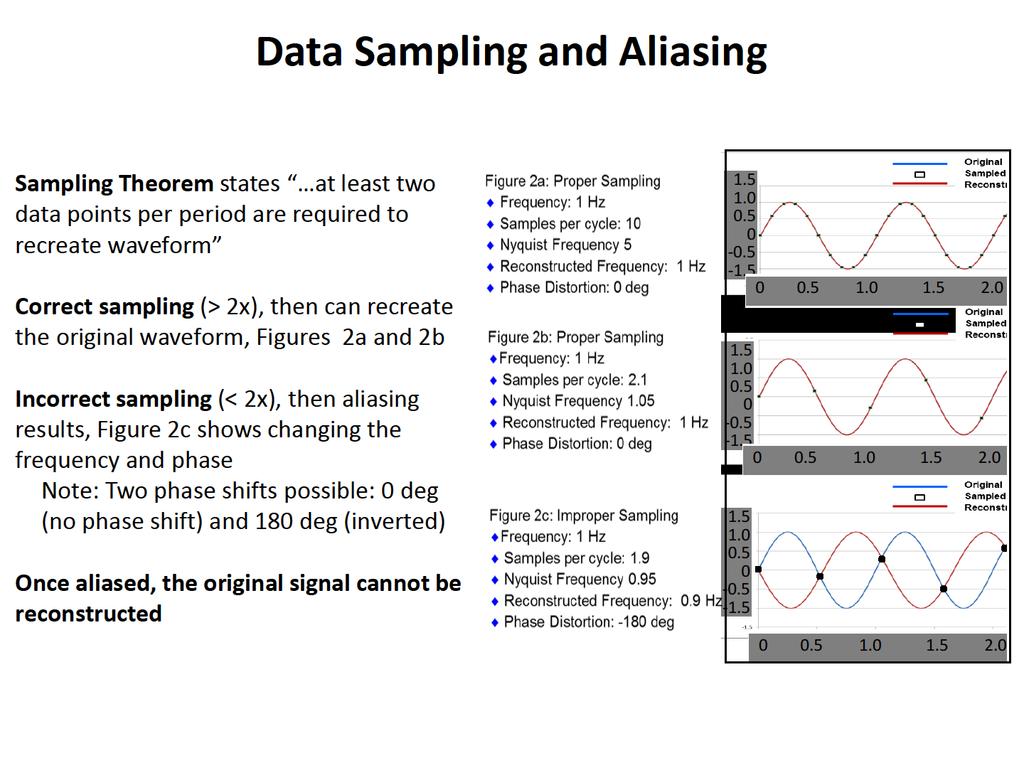
3 MEASUREMENT ACCURACY Section xx: Data Sampling and Filter Selection during Data Acquisition References: 1) S. W. Smith, Digital Signal Processing A Practical Guide for Engineers and Scientists, ) Nyquist Sampling Theorem appeared as early as 1959 in a book from his former employer, Bell Labs. Members of the Technical Staff of Bell Telephone Laboratories (1959). Transmission Systems for Communications. AT&T. pp (Vol.2). 3) C. E. Shannon, "Communication in the presence of noise", Proc. Institute of Radio Engineers, vol. 37, no. 1, pp , Jan Reprint as classic paper in: Proc. IEEE, vol. 86, no. 2, (Feb. 1998) Background In order to achieve quality pressure measurements with accurate magnitude and frequency content, the test must start by using comprehensive signal processing principles during initial data acquisition (e.g., correct data sample rates and anti-alias filter selection). Pressure measurements typically originate from steady state or dynamic pressure transducers as analog information. However, since most post-test data systems are digital, the analog signals must be converted to digital data prior to being recorded for storage and analysis. This analog-to-digital conversion process can be accomplished in many ways. This section will outline the most common and recommended approach in which the data are first anti-alias filtered and then digitally sampled based on frequencies of interest. Basic concepts associated with data sampling, aliasing, Nyquist frequency, and filter selection will be covered. Specific examples showing correct and incorrect approaches for determining sample rate and filter selection are also provided. Data Sampling Recognize that Sampling Theorem (Reference 3) states that least two data points per period are required to resolve the waveform of any analog signal. As a result, the maximum frequency that can be resolved from a data recording is one half of the data sampling frequency. For example: if your data recording system is sampling data at 1200Hz, then the maximum frequency that can be isolated from the analog signal is 600 Hz. This maximum resolvable frequency is called the Nyquist frequency. If the raw analog signal contains information content at frequencies above the Nyquist frequency, then the sampled signal will essentially map that higher frequency content information into the lower frequency domain through a process called aliasing. Aliasing has the undesirable effect of misrepresenting the true frequency content of the raw signal in the sampled data. Note that if the raw signal does not have information content at frequencies that are higher than the Nyquist frequency, then aliasing of the raw data signal will not occur. This knowledge provides an opportunity to eliminate the possibility of aliasing by using a low-pass filter to remove high frequency content on the analog data signal prior to digitally sampling the data. These concepts are discussed in more detail below. Proper sampling is achieved if you can reconstruct the meaningful content of the original analog signal from the sampled data, then you have sampled the raw signal correctly. The data sampling rate to correctly reconstruct the magnitude and frequency is at least twice the highest


4 frequency of interest. Additionally to avoid aliasing, the data acquisition systems must also using a low-pass filter to limit signal bandwidth above one-half of the sampling rate. Once aliasing has corrupted the information, the original signal cannot be reconstructed. Figure 1 shows a typical analog filter arrangement which is used prior to the analog-to-digital converter (A/D). Figure 1.Typical anti-aliasing filter used in digital signal processing (Ref 1). The only other way to avoid aliasing is to significantly oversample. However, the downside of oversampling is the increased cost in terms of providing bandwidth, storage and analysis of large data files. This is particularly true when there are many signals all with high bandwidth requirements (e.g., engine inlet rake data). Most data acquisition systems can easily accommodate large throughput (high sampling rates combined with a large number of channels). However, as throughput requirements increase data system costs rise exponentially. As a general rule, effort spent to limit the amount of data is well spent since it reduces overall cost. Establishing Sampling Rate To establish an appropriate sampling rate for data acquisition, the disciple engineer must understand system operating characteristics, test objectives and analysis approach. Clear test objectives and a fundamental understanding of the physical system help identify the appropriate sampling rate. For an aerodynamic assessment of inlet distortion on the engine compression system, flow field disturbances with persistence on the order of one rotor revolution may be considered important. There may also be a need to time correlate up to 40 independent pressures across the AIP. If data is used to evaluate aero-mechanical impacts, there may be a need to evaluate higher frequencies but have no need to time correlate with other pressures. For an aerodynamic assessment of inlet distortion on the engine compression system, flow field disturbances that have persistence on the order of one rotor revolution may be considered important. However, if the data is to be used to evaluate aero-mechanical interactions, there may be a need to evaluate higher recording frequencies. A clear set of test objectives and a fundamental understanding of the physical system help to identify the appropriate sampling rate for the system and test of interest. It is important to note that uncertainty in system operating characteristics (engine surge sensitivity, expected fan speed, or inlet distortion characteristic) may lead to a requirement of data oversampling until better system understanding is available. The level of data oversampling (possibly 20 percent) should be commensurate the maturity of system understanding. Some general observations about sampling rate are provided here with more detail provided in the example calculation section that follows. Discipline engineer must verify proper data sampling and filtering principles have been applied during the data acquisition process
5
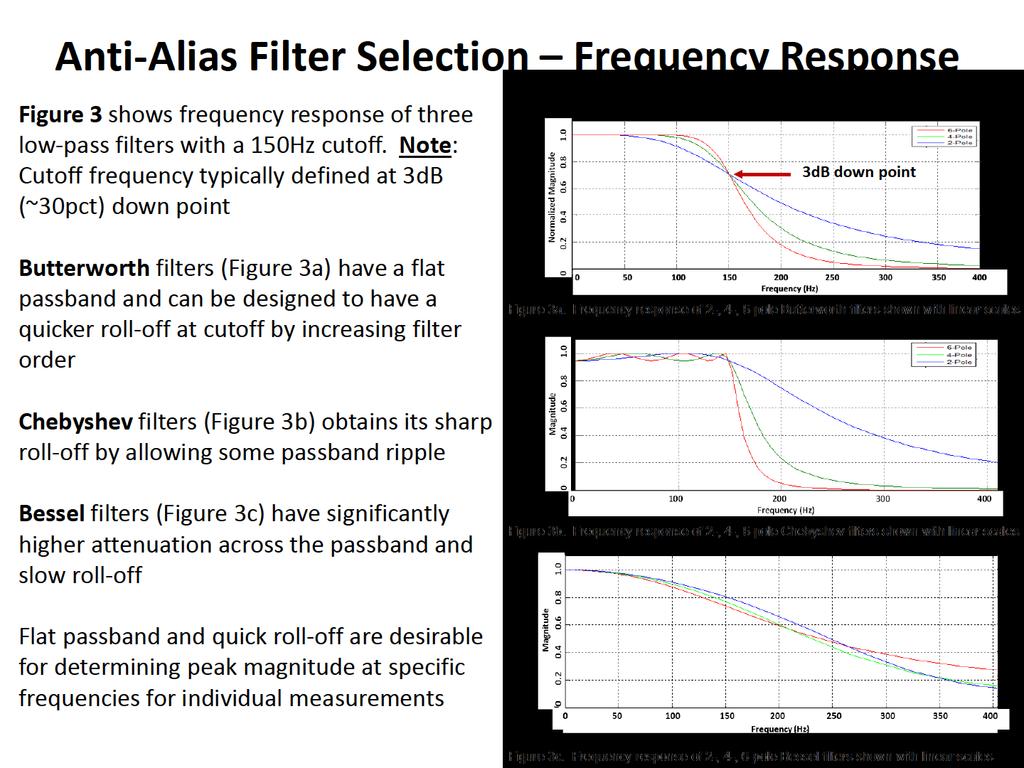
6 Nyquist frequency The Nyquist frequency is the highest frequency that can be resolved from the raw signal at the chosen sample rate. The Nyquist frequency is defined as one-half the sample rate. This is known as the Nyquist sampling theorem, after the author of 1940s papers on the topic (Ref 2 and 3). The Nyquist sampling theorem indicates that a continuous signal can be properly sampled only if it does not contain frequency components above one-half of the sampling rate. Anti-Alias Filter Selection Analog filtering is a critical portion of the typical data acquisition system which is designed to remove higher frequency information (above Nyquist) from the raw data signal to prevent undesirable aliasing of that information into the frequency range of interest. If a low-pass analog filter is not used, signals higher than half the sampling rate will be aliased into the observable frequency domain in the sampled digital data. Once a signal is aliased during the digitization process, it is impossible to differentiate between correctly resolved original signal content occurring in the observable frequency domain and undesirable higher frequency data that has been aliased into the observable frequency domain. The characteristic of every digitized signal depends on the type of anti-alias filter used when it was acquired. If the nature of the anti-alias filter is not understood, the nature of the digital signal cannot be understood. Analog filters typically used during data acquisition include the Butterworth, Chebyshev and Bessel. Each of these filters is designed to optimize a different performance characteristic (e.g., low pass-band attenuation, sharp roll-off, or constant group delay). Figure 3 shows the frequency response of the three low-pass filters with a 150Hz cutoff frequency. The Butterworth filter (Figure 3a) can be designed to have a quicker roll-off above the cutoff frequency by increasing the filter order (related to number of poles) without allowing ripple in the passband frequency range. The Chebyshev filter (Figure 3b) obtains its excellent sharp roll-off characteristic by allowing passband ripple. In comparison, the Bessel filter (Figure 3c) has no ripple in the passband, but roll-off at the cutoff frequency is far slower than the Butterworth or Chebyshev. Additionally, the Bessel filter suffers from significantly higher attenuation across the passband. Flat passband and quick roll-off are desirable for determining an individual peak pressures or stress
7
8
9
10
11
12
13
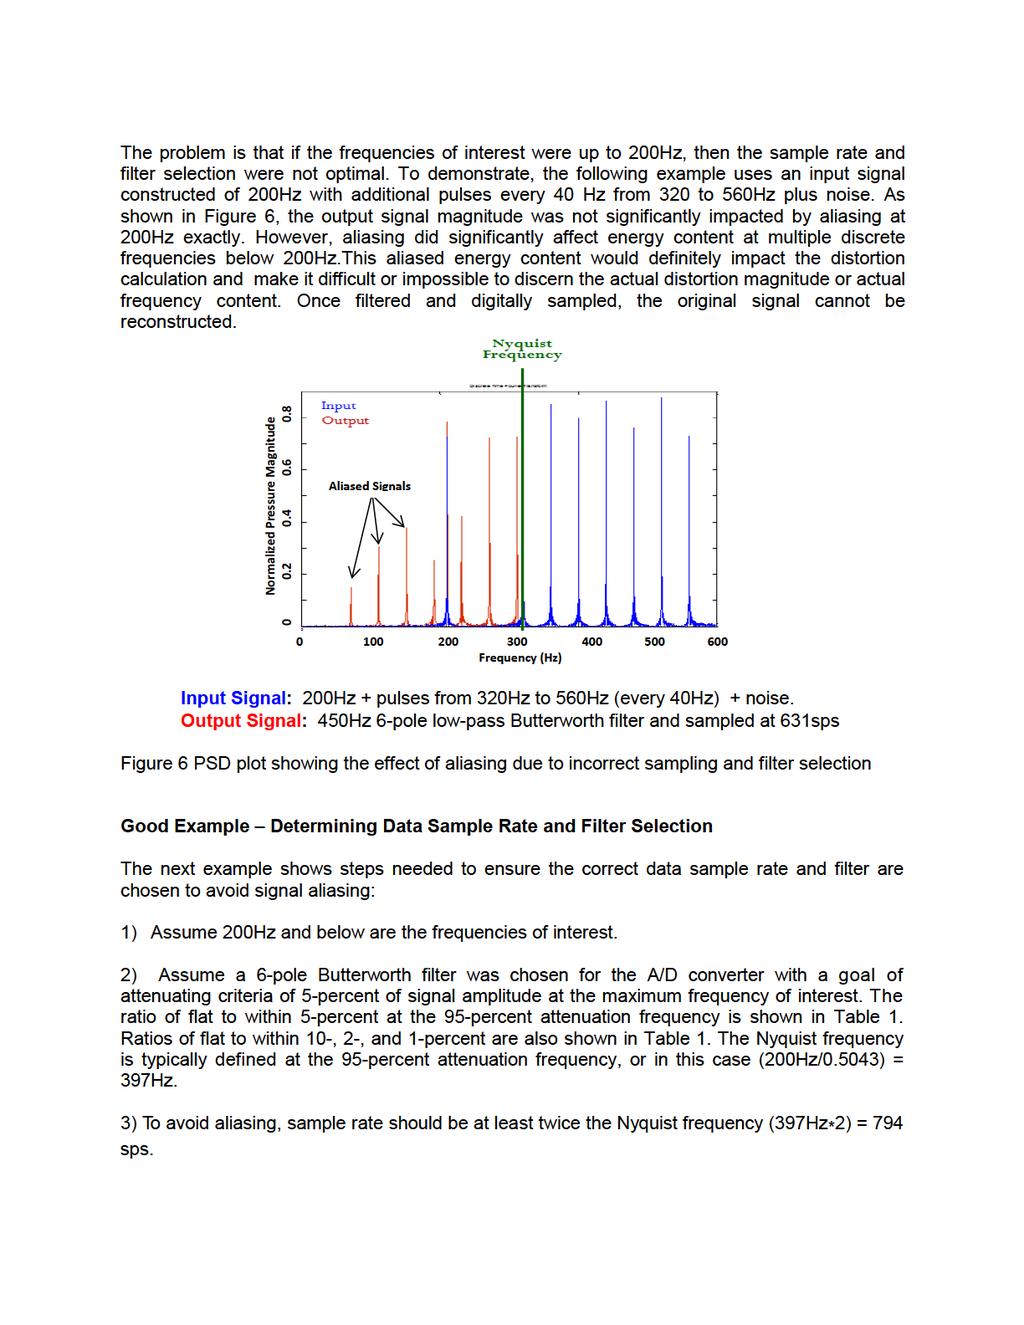
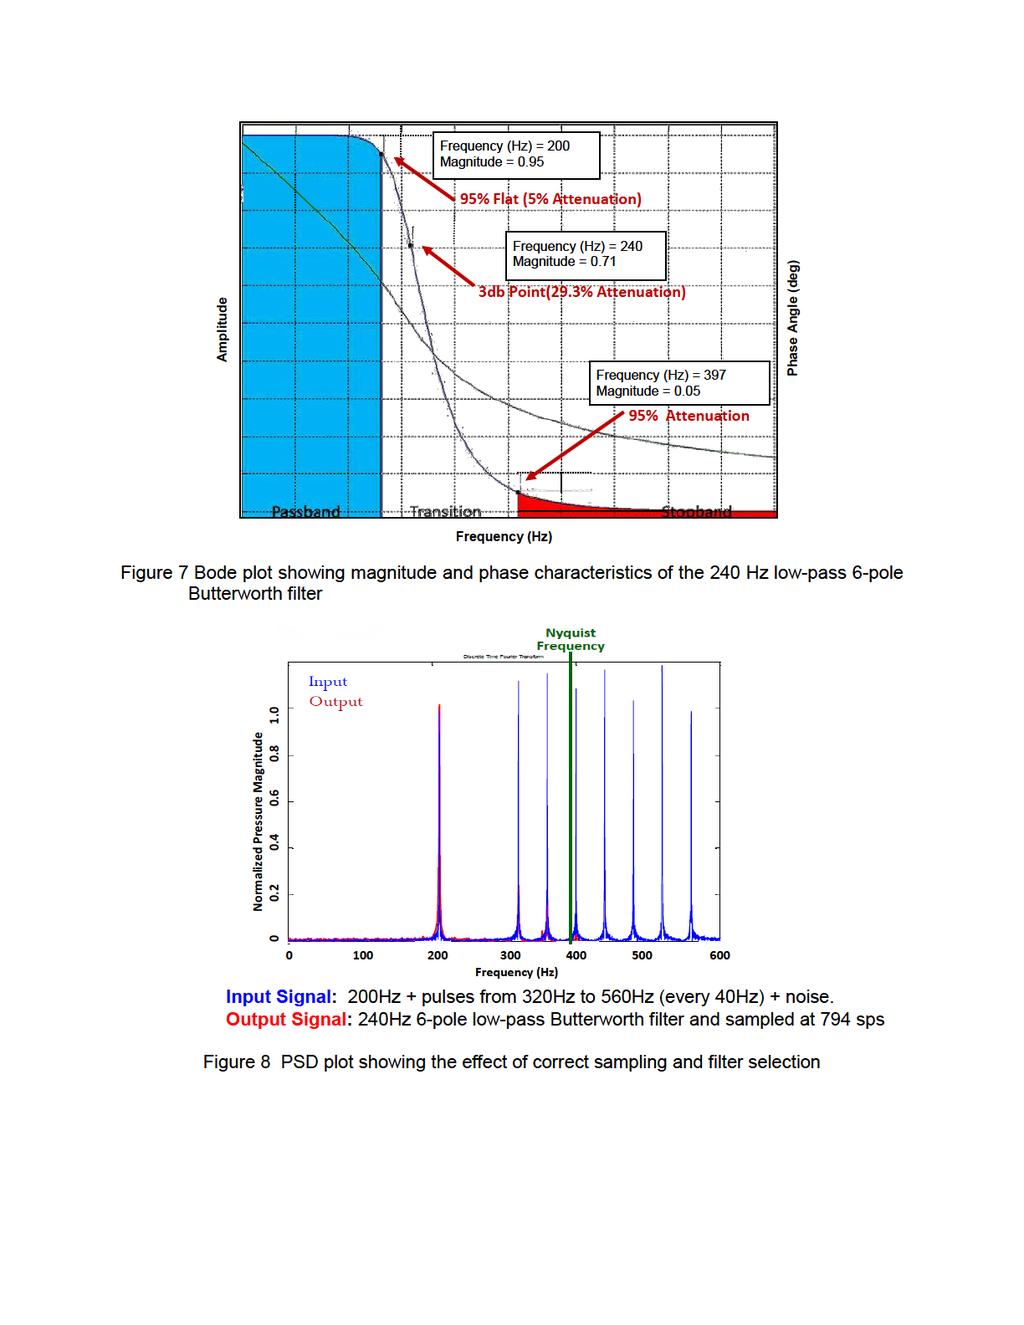
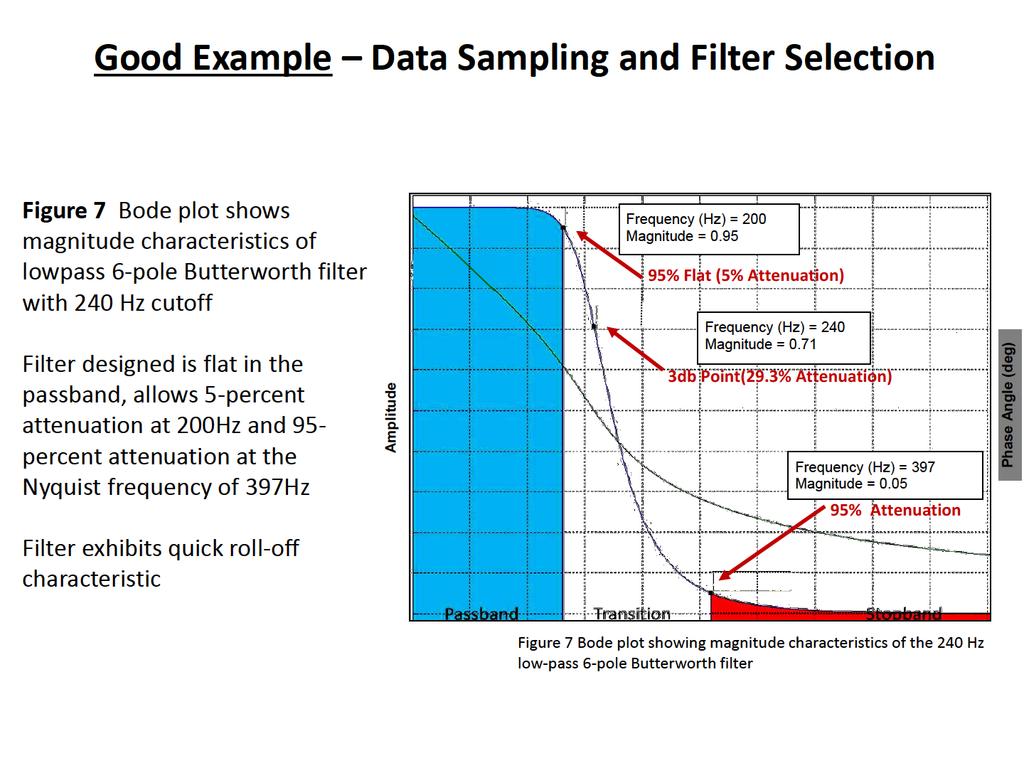
14 In summary, to achieve quality pressure measurements with accurate magnitude and frequency resolution, the discipline engineer must understand system operating characteristics, test objectives and analysis approach. Additionally, the discipline engineer must verify proper data sampling and filtering principles have been applied during the data acquisition process. Our example focused on the process of determining sample rate and filter selection for determining peak pressures up to the frequency of interest and did not attempt to control or account for time distortion. We were able to ensure a maximum of 5-percent attenuation for frequencies of interest up to 200Hz. The Nyquist frequency was determined to be of 397Hz (using 95-percent attenuation) and the minimum data sample rate was determined to be 794 Hz. Using a low-pass 6-pole Butterworth filter, cutoff was determined to be 240Hz at the 3dB down point. Prior to filter implementation, it is highly recommended to view filter characteristics on both Bode and PSD plots.


15 SCIENCE OF TEST Measurement Accuracy - Data Sampling and Filter Selection during Data Acquisition David Kidman Air Force Test Center 412 th Test Wing, Propulsion Integration Flight Edwards AFB CA, david.kidman@us.af.mil Pending Public Release
16 Outline Background Data acquisition concepts Test Requirements Data sampling, Aliasing and Nyquist frequency Filter selection for A/D conversion Examples showing correct and incorrect data sampling and filtering
17 Background Measurements start analog but converted to digital prior to being recorded Quality data (Accurate magnitude and Frequency content) starts with careful attention to setup of data acquisition system (e.g. data sample rates and anti-alias filter selection) If acquisition setup is not understood, then recorded signal can not be understood!
18 Understanding Requirements Discipline Engineer Responsibilities: 1) Ultimately responsible for data quality for evaluating system under test 2) Guide instro setup by understanding system operating characteristics, test objectives and analysis approach -- If data is used to determine aero-mechanical impacts, analysis may emphasize accurate magnitude and frequency but less concerned with time correlation -- If data is used for inlet distortion impact on engine stability, need accurate magnitudes and frequency but analysis emphasizes time correlation of 40 independent pressures 3) Verify proper techniques (data sampling and A/D filtering) were applied Uncertainty in system operation may require additional frequency content ( 20 percent) until better system understanding is available
19
20 Aliasing If analog signal contains information above Nyquist, the digitized signal will alias higher frequency content into the lower frequency domain Aliasing can be avoided by removing higher frequency content from analog signal prior to digitizing by using a low-pass filter Typical anti-alias filters used during data acquisition include the Butterworth, Chebyshev and Bessel. Each designed to optimize a different performance characteristic (e.g. pass-band flatness, quick roll-off, or low phase distortion)
21
 and Chebyshev (Figure 4b) both exhibit good response characteristic but higher-order")
22 Anti-Alias Filter Selection Step Response Figure 4 shows the step response for same three filters with a 150-Hz cutoff. Fast response to step input shows how filter would respond to rapidly changing values Butterworth (Figure 4a) and Chebyshev (Figure 4b) both exhibit good response characteristic but higher-order tends to overshoot, leading to over-estimate Bessel filter (Figure 4c) is quickest to respond and doesn t overshoot, probably making it a better choice for rapidly changing magnitudes
23
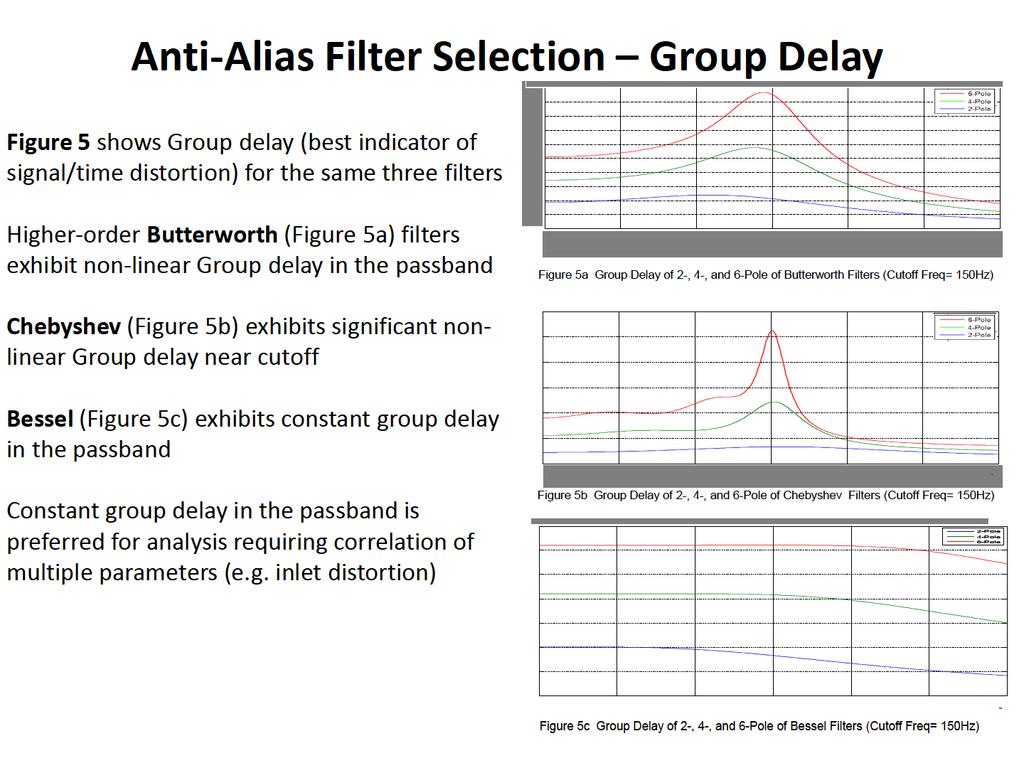
24 Takeaway Most common filters used in data acquisition include the Butterworth, Chebyshev and Bessel, each having their own strengths and weaknesses Butterworth optimizes the passband flatness but has some ripple to step input and has non-linear group delay in higher order filters Chebyshev optimizes quickness in roll-off but is slowest to respond to rapid changes, has most ripple and has significant non-linear group delay in higher order filters Bessel optimizes quickness to respond, has no passband ripple and has constant group delay and but suffers from poor passband flatness and slow roll-off Ultimately, selection of the anti-alias filter depends on test objectives and analysis goals - Engine inlet analysis places an emphasis on eliminating time distortion and quickness to respond to rapidly changing conditions, probably making the Bessel the best choice for anti-alias during the A/D conversion - Accurate magnitudes of individual measurements at specific frequency, flat passband and quickness in roll-off are most important making Butterworth the best choice
25 Good and Bad Examples Data Sampling and Filter Selection Assume test objective is to acquire accurate pressure magnitude from individual transducer with frequencies of interest up to 200 Hz Note: Since example is for single transducer, no attempt to control time distortion
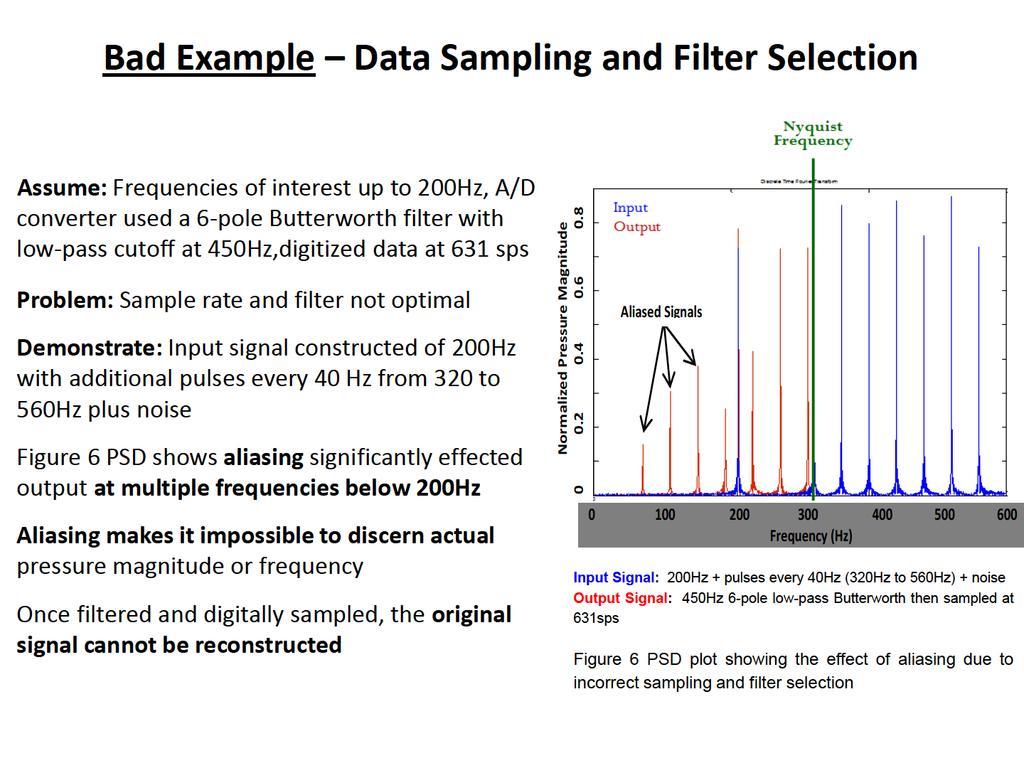
26

 = (200Hz/0.")
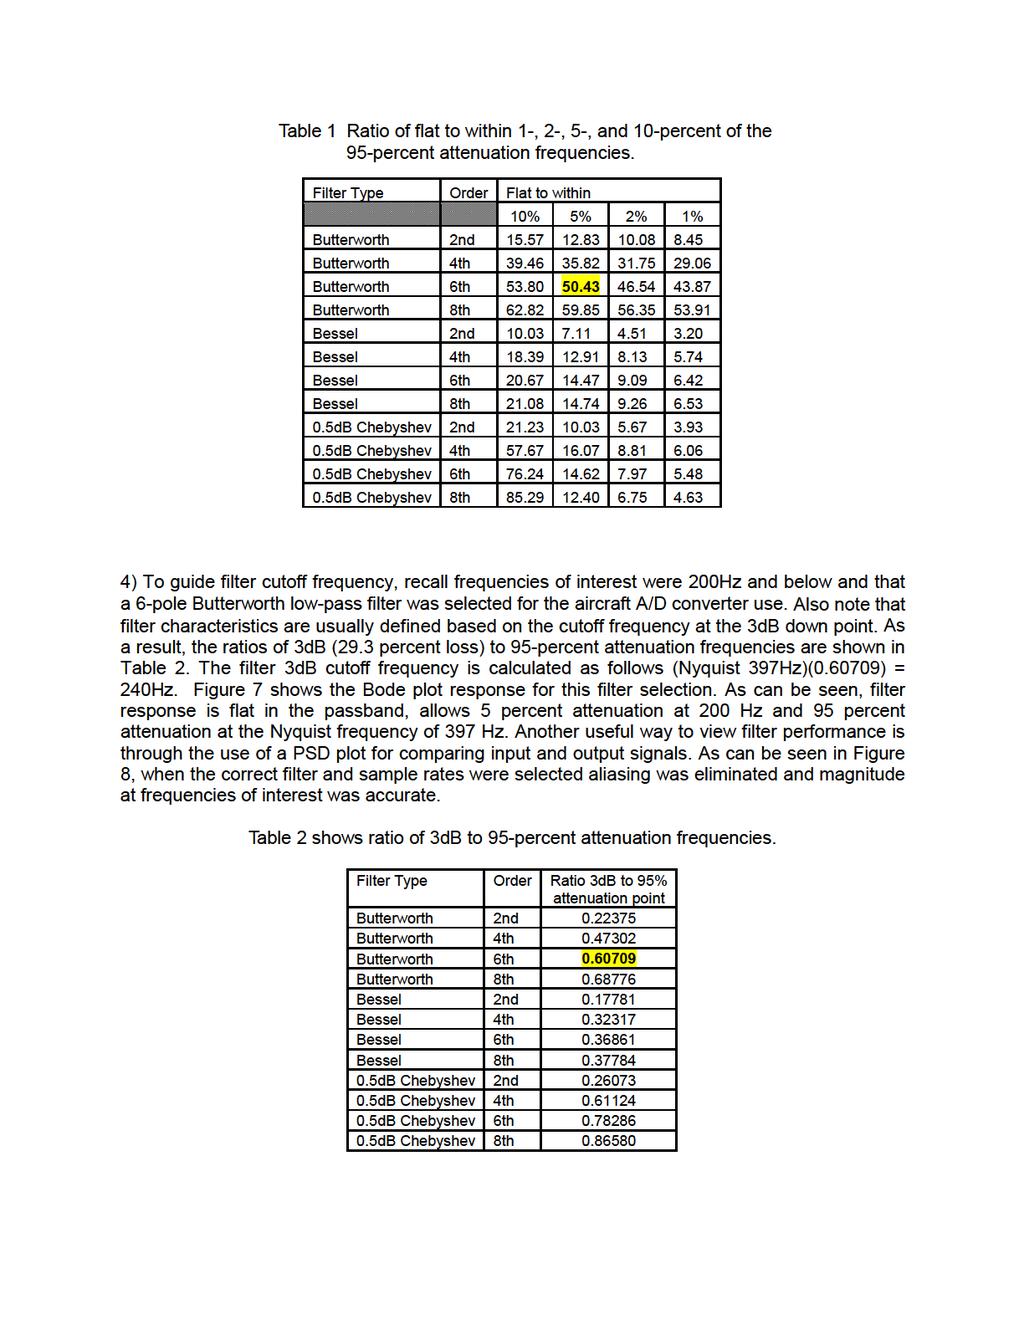
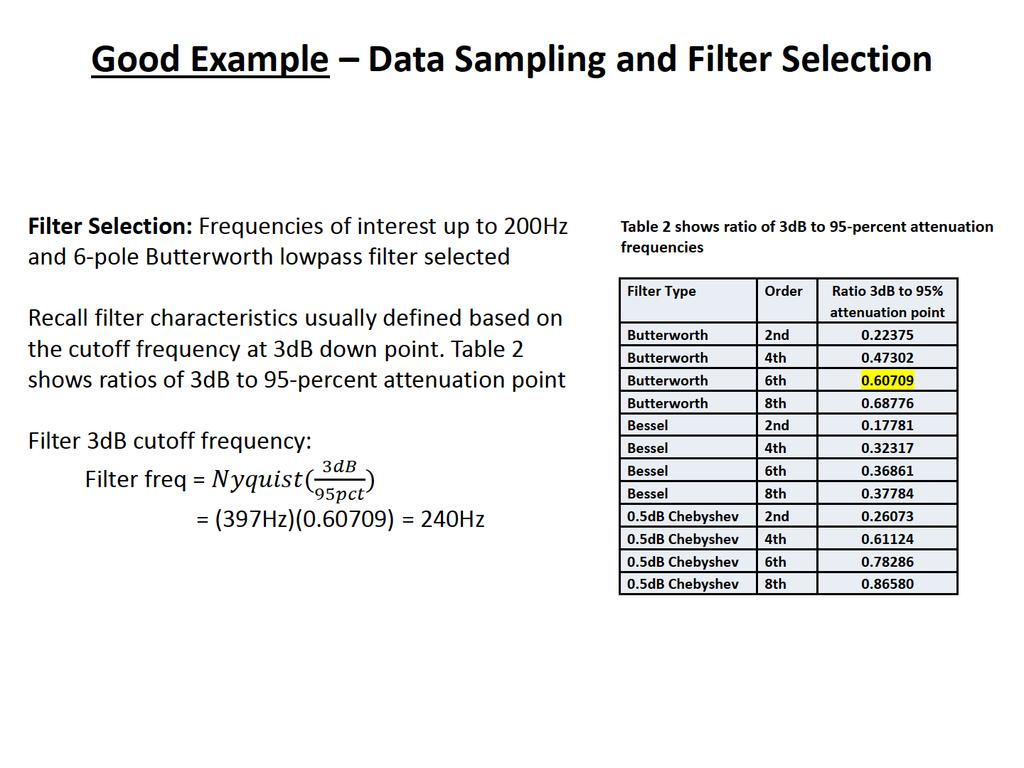
27 Good Example Data Sampling and Filter Selection Assume: Frequencies of interest up to 200Hz, A/D converter uses 6-pole Butterworth with max attenuation of 5-percent at 200Hz Table 1 Ratio of flat to within 1-, 2-, 5-, and 10- percent with 95-percent attenuation at ω=1 Data Sample Rate Selection: Table 1 shows ratio of flat to within 5-percent at the 95-percent attenuation frequency Nyquist = FFFFFFFF RRRRRRRR/( 5pppppp 95pppppp ) = (200Hz/0.5043) = 397Hz To avoid aliasing, sample rate should be at least twice the Nyquist frequency Sample Rate = (397Hz*2) = 794 sps
28
29
30
31 Summary Discipline Engineers: 1) Ultimately responsible for data quality for evaluating system under test 2) Guide instro setup by understanding system operating characteristics, test objectives and analysis approach 3) Verify proper data acquisition techniques were applied Recommend: Use both Bode and PSD plots to evaluate filter and sample rate effects prior to implementation Reference: The Scientist and Engineer's Guide to Digital Signal Processing, by Steven W. Smith, Ph.D.
32 Questions???
UNITED STATES AIR FORCE RESEARCH LABORATORY
 AFRL-HE-AZ-SR-2002-0005 UNITED STATES AIR FORCE RESEARCH LABORATORY IMAGE GENERATOR REQUIREMENTS FOR DRIVING THE 5120 x 4096 PIXEL ULTRA HIGH-RESOLUTION LASER PROJECTOR Ben L. Surber L-3 Communications
TEST WIRE FOR HIGH VOLTAGE POWER SUPPLY CROWBAR SYSTEM
 TEST WIRE FOR HIGH VOLTAGE POWER SUPPLY CROWBAR SYSTEM Joseph T. Bradley III and Michael Collins Los Alamos National Laboratory, LANSCE-5, M.S. H827, P.O. Box 1663 Los Alamos, NM 87545 John M. Gahl, University
RATE-ADAPTIVE VIDEO CODING (RAVC)
") AFRL-RI-RS-TR-2008-140 Final Technical Report May 2008 RATE-ADAPTIVE VIDEO CODING (RAVC) FastVDO LLC APPROVED FOR PUBLIC RELEASE; DISTRIBUTION UNLIMITED. STINFO COPY AIR FORCE RESEARCH LABORATORY INFORMATION
AFRL-RI-RS-TR-2008-140 Final Technical Report May 2008 RATE-ADAPTIVE VIDEO CODING (RAVC) FastVDO LLC APPROVED FOR PUBLIC RELEASE; DISTRIBUTION UNLIMITED. STINFO COPY AIR FORCE RESEARCH LABORATORY INFORMATION
A Comparison of the Temporal Characteristics of LCS, LCoS, Laser, And CRT Projectors
 AFRL-HE-AZ-TM-2006-0001 A Comparison of the Temporal Characteristics of LCS, LCoS, Laser, And CRT Projectors George A. Geri Link Simulation and Training 6030 South Kent Street Mesa, AZ 85212 William D.
Techniques for Extending Real-Time Oscilloscope Bandwidth
 Techniques for Extending Real-Time Oscilloscope Bandwidth Over the past decade, data communication rates have increased by a factor well over 10X. Data rates that were once 1Gb/sec and below are now routinely
Search Strategies for a Wide-Field Electro-Optic Sensor
 Search Strategies for a Wide-Field Electro-Optic Sensor R. Lambour, E. Pearce, R. Sayer 21 Space Control Conference 4 April 21 This work sponsored by the Air Force under Air Force Contract F19628--C-2.
Calibrate, Characterize and Emulate Systems Using RFXpress in AWG Series
 Calibrate, Characterize and Emulate Systems Using RFXpress in AWG Series Introduction System designers and device manufacturers so long have been using one set of instruments for creating digitally modulated
Processing the Output of TOSOM
 Processing the Output of TOSOM William Jackson, Dan Hicks, Jack Reed Survivability Technology Area US Army RDECOM TARDEC Warren, Michigan 48397-5000 ABSTRACT The Threat Oriented Survivability Optimization
HIGH VOLTAGE SWITCH PERFORMANCE OF THE EIMAC X-2159 TETRODE ABSTRACT
 HIGH VOLTAGE SWITCH PERFORMANCE OF THE EIMAC X-2159 TETRODE by Bobby R. Gray High Power Component & Effects Section Techniques Branch Surveillance Division Rome Air Development Center Griffiss Air Force
PREPARED FOR: U.S. Army Medical Research and Materiel Command Fort Detrick, Maryland
 AWARD NUMBER: W81XWH-13-1-0491 TITLE: Default, Cognitive, and Affective Brain Networks in Human Tinnitus PRINCIPAL INVESTIGATOR: Jennifer R. Melcher, PhD CONTRACTING ORGANIZATION: Massachusetts Eye and
Getting Started with the LabVIEW Sound and Vibration Toolkit
 1 Getting Started with the LabVIEW Sound and Vibration Toolkit This tutorial is designed to introduce you to some of the sound and vibration analysis capabilities in the industry-leading software tool
AFRL-RY-WP-TR
 AFRL-RY-WP-TR-2017-0172 SIGNAL PROCESSING UTILIZING RADIO FREQUENCY PHOTONICS Preetpaul S. Devgan RF/EO Subsystems Branch Aerospace Components & Subsystems Division SEPTEMBER 2017 Final Report See additional
Applying LaPO 4 Phosphor via Spinning for BetaPhotovoltaic Devices
 ARL-TR-7269 JUN 2015 US Army Research Laboratory Applying LaPO 4 Phosphor via Spinning for BetaPhotovoltaic Devices by Muhammad R Khan, Joshua R Smith, Kevin Kirchner, and Kenneth A Jones Approved for
RADIOGRAPHIC PERFORMANCE OF CYGNUS 1 AND THE FEBETRON 705
 RADIOGRAPHIC PERFORMANCE OF CYGNUS 1 AND THE FEBETRON 705 E. Rose ξ, R. Carlson, J. Smith Los Alamos National Laboratory, PO Box 1663, Mail Stop P-947 Los Alamos, NM 87545, USA Abstract Spot sizes are
A Look-up-table Approach to Inverting Remotely Sensed Ocean Color Data
 A Look-up-table Approach to Inverting Remotely Sensed Ocean Color Data W. Paul Bissett Florida Environmental Research Institute 4807 Bayshore Blvd. Suite 101 Tampa, FL 33611 phone: (813) 837-3374 x102
Continued Development of the Look-up-table (LUT) Methodology for Interpretation of Remotely Sensed Ocean
 Methodology for Interpretation of Remotely Sensed Ocean") Continued Development of the Look-up-table (LUT) Methodology for Interpretation of Remotely Sensed Ocean Curtis D. Mobley Sequoia Scientific, Inc. 2700 Richards Road, Suite 107 Bellevue, WA 98005 phone:
Continued Development of the Look-up-table (LUT) Methodology for Interpretation of Remotely Sensed Ocean Curtis D. Mobley Sequoia Scientific, Inc. 2700 Richards Road, Suite 107 Bellevue, WA 98005 phone:
Interface Practices Subcommittee SCTE STANDARD SCTE Measurement Procedure for Noise Power Ratio
 Interface Practices Subcommittee SCTE STANDARD SCTE 119 2018 Measurement Procedure for Noise Power Ratio NOTICE The Society of Cable Telecommunications Engineers (SCTE) / International Society of Broadband
The State of Remote Scientific Visualization Providing Local Graphics Performance to Remote ARL MSRC Users
 The State of Remote Scientific Visualization Providing Local Graphics Performance to Remote ARL MSRC Users by John M. Vines and Claude Sandroff ARL-TR-3635 September 2005 Approved for public release; distribution
An Introduction to the Spectral Dynamics Rotating Machinery Analysis (RMA) package For PUMA and COUGAR
 package For PUMA and COUGAR") An Introduction to the Spectral Dynamics Rotating Machinery Analysis (RMA) package For PUMA and COUGAR Introduction: The RMA package is a PC-based system which operates with PUMA and COUGAR hardware to
An Introduction to the Spectral Dynamics Rotating Machinery Analysis (RMA) package For PUMA and COUGAR Introduction: The RMA package is a PC-based system which operates with PUMA and COUGAR hardware to
ENGINEERING COMMITTEE
 ENGINEERING COMMITTEE Interface Practices Subcommittee SCTE STANDARD SCTE 45 2017 Test Method for Group Delay NOTICE The Society of Cable Telecommunications Engineers (SCTE) Standards and Operational Practices
Dynamic Performance Requirements for Phasor Meausrement Units
 Dynamic Performance Requirements for Phasor Meausrement Units 2010 February NAPSI Meeting Dmitry Kosterev Transmission Planning Bonneville Power Administration dnkosterev@bpa.gov Slide 1 BPA Plans for
International Journal of Engineering Research-Online A Peer Reviewed International Journal
 RESEARCH ARTICLE ISSN: 2321-7758 VLSI IMPLEMENTATION OF SERIES INTEGRATOR COMPOSITE FILTERS FOR SIGNAL PROCESSING MURALI KRISHNA BATHULA Research scholar, ECE Department, UCEK, JNTU Kakinada ABSTRACT The
Application Note Component Video Filtering Using the ML6420/ML6421
 April 1998 Application Note 42035 Component Video Filtering Using the ML6420/ML6421 INTRODUCTION This Application Note provides the video design engineer with practical circuit examples of Micro Linear
Realizing Waveform Characteristics up to a Digitizer s Full Bandwidth Increasing the effective sampling rate when measuring repetitive signals
 Realizing Waveform Characteristics up to a Digitizer s Full Bandwidth Increasing the effective sampling rate when measuring repetitive signals By Jean Dassonville Agilent Technologies Introduction The
Sensor Development for the imote2 Smart Sensor Platform
 Sensor Development for the imote2 Smart Sensor Platform March 7, 2008 2008 Introduction Aging infrastructure requires cost effective and timely inspection and maintenance practices The condition of a structure
DELTA MODULATION AND DPCM CODING OF COLOR SIGNALS
 DELTA MODULATION AND DPCM CODING OF COLOR SIGNALS Item Type text; Proceedings Authors Habibi, A. Publisher International Foundation for Telemetering Journal International Telemetering Conference Proceedings
Advances in Telemetry Capability as Demonstrated on an Affordable Precision Mortar
 Advances in Telemetry Capability as Demonstrated on an Affordable Precision Mortar by Michael L. Don ARL-RP-378 June 2012 A reprint from Proceedings of the International Telemetry Conference, Las Vegas,
Module 8 : Numerical Relaying I : Fundamentals
 Module 8 : Numerical Relaying I : Fundamentals Lecture 28 : Sampling Theorem Objectives In this lecture, you will review the following concepts from signal processing: Role of DSP in relaying. Sampling
NanoGiant Oscilloscope/Function-Generator Program. Getting Started
 Getting Started Page 1 of 17 NanoGiant Oscilloscope/Function-Generator Program Getting Started This NanoGiant Oscilloscope program gives you a small impression of the capabilities of the NanoGiant multi-purpose
Suverna Sengar 1, Partha Pratim Bhattacharya 2
 ISSN : 225-321 Vol. 2 Issue 2, Feb.212, pp.222-228 Performance Evaluation of Cascaded Integrator-Comb (CIC) Filter Suverna Sengar 1, Partha Pratim Bhattacharya 2 Department of Electronics and Communication
ni.com Digital Signal Processing for Every Application
 Digital Signal Processing for Every Application Digital Signal Processing is Everywhere High-Volume Image Processing Production Test Structural Sound Health and Vibration Monitoring RF WiMAX, and Microwave
Scanning A/D Converters, Waveform Digitizers, and Oscilloscopes
 Scanning A/D Converters, Waveform Digitizers, and Oscilloscopes Scanning A/Ds, waveform digitizers and oscilloscopes all digitize analog signals. In all three instrument types, the purpose is to capture
LabView Exercises: Part II
 Physics 3100 Electronics, Fall 2008, Digital Circuits 1 LabView Exercises: Part II The working VIs should be handed in to the TA at the end of the lab. Using LabView for Calculations and Simulations LabView
ECE438 - Laboratory 4: Sampling and Reconstruction of Continuous-Time Signals
 Purdue University: ECE438 - Digital Signal Processing with Applications 1 ECE438 - Laboratory 4: Sampling and Reconstruction of Continuous-Time Signals October 6, 2010 1 Introduction It is often desired
Area-Efficient Decimation Filter with 50/60 Hz Power-Line Noise Suppression for ΔΣ A/D Converters
 SICE Journal of Control, Measurement, and System Integration, Vol. 10, No. 3, pp. 165 169, May 2017 Special Issue on SICE Annual Conference 2016 Area-Efficient Decimation Filter with 50/60 Hz Power-Line
technical note flicker measurement display & lighting measurement
 technical note flicker measurement display & lighting measurement Contents 1 Introduction... 3 1.1 Flicker... 3 1.2 Flicker images for LCD displays... 3 1.3 Causes of flicker... 3 2 Measuring high and
An Introduction to the Sampling Theorem
 An Introduction to the Sampling Theorem An Introduction to the Sampling Theorem With rapid advancement in data acquistion technology (i.e. analog-to-digital and digital-to-analog converters) and the explosive
#PS168 - Analysis of Intraventricular Pressure Wave Data (LVP Analysis)
") BIOPAC Systems, Inc. 42 Aero Camino Goleta, Ca 93117 Ph (805)685-0066 Fax (805)685-0067 www.biopac.com info@biopac.com #PS168 - Analysis of Intraventricular Pressure Wave Data (LVP Analysis) The Biopac
BIOPAC Systems, Inc. 42 Aero Camino Goleta, Ca 93117 Ph (805)685-0066 Fax (805)685-0067 www.biopac.com info@biopac.com #PS168 - Analysis of Intraventricular Pressure Wave Data (LVP Analysis) The Biopac
A review on the design and improvement techniques of comb filters
 A review on the design and improvement techniques of comb filters Naina Kathuria Naina Kathuria, M. Tech Student Electronics &Communication, JMIT, Radaur ABSTRACT Comb filters are basically the decimation
2 MHz Lock-In Amplifier
 2 MHz Lock-In Amplifier SR865 2 MHz dual phase lock-in amplifier SR865 2 MHz Lock-In Amplifier 1 mhz to 2 MHz frequency range Dual reference mode Low-noise current and voltage inputs Touchscreen data display
Benefits of the R&S RTO Oscilloscope's Digital Trigger. <Application Note> Products: R&S RTO Digital Oscilloscope
 Benefits of the R&S RTO Oscilloscope's Digital Trigger Application Note Products: R&S RTO Digital Oscilloscope The trigger is a key element of an oscilloscope. It captures specific signal events for detailed
Interface Practices Subcommittee SCTE STANDARD SCTE Composite Distortion Measurements (CSO & CTB)
") Interface Practices Subcommittee SCTE STANDARD Composite Distortion Measurements (CSO & CTB) NOTICE The Society of Cable Telecommunications Engineers (SCTE) / International Society of Broadband Experts
Interface Practices Subcommittee SCTE STANDARD Composite Distortion Measurements (CSO & CTB) NOTICE The Society of Cable Telecommunications Engineers (SCTE) / International Society of Broadband Experts
Digital Signal. Continuous. Continuous. amplitude. amplitude. Discrete-time Signal. Analog Signal. Discrete. Continuous. time. time.
 Discrete amplitude Continuous amplitude Continuous amplitude Digital Signal Analog Signal Discrete-time Signal Continuous time Discrete time Digital Signal Discrete time 1 Digital Signal contd. Analog
ENGINEERING COMMITTEE Interface Practices Subcommittee AMERICAN NATIONAL STANDARD ANSI/SCTE Composite Distortion Measurements (CSO & CTB)
") ENGINEERING COMMITTEE Interface Practices Subcommittee AMERICAN NATIONAL STANDARD ANSI/SCTE 06 2009 Composite Distortion Measurements (CSO & CTB) NOTICE The Society of Cable Telecommunications Engineers
ENGINEERING COMMITTEE Interface Practices Subcommittee AMERICAN NATIONAL STANDARD ANSI/SCTE 06 2009 Composite Distortion Measurements (CSO & CTB) NOTICE The Society of Cable Telecommunications Engineers
Laboratory 5: DSP - Digital Signal Processing
 Laboratory 5: DSP - Digital Signal Processing OBJECTIVES - Familiarize the students with Digital Signal Processing using software tools on the treatment of audio signals. - To study the time domain and
Professor Laurence S. Dooley. School of Computing and Communications Milton Keynes, UK
 Professor Laurence S. Dooley School of Computing and Communications Milton Keynes, UK The Song of the Talking Wire 1904 Henry Farny painting Communications It s an analogue world Our world is continuous
Digital Representation
 Chapter three c0003 Digital Representation CHAPTER OUTLINE Antialiasing...12 Sampling...12 Quantization...13 Binary Values...13 A-D... 14 D-A...15 Bit Reduction...15 Lossless Packing...16 Lower f s and
The Effect of Time-Domain Interpolation on Response Spectral Calculations. David M. Boore
 The Effect of Time-Domain Interpolation on Response Spectral Calculations David M. Boore This note confirms Norm Abrahamson s finding that the straight line interpolation between sampled points used in
DIGITAL COMMUNICATION
 10EC61 DIGITAL COMMUNICATION UNIT 3 OUTLINE Waveform coding techniques (continued), DPCM, DM, applications. Base-Band Shaping for Data Transmission Discrete PAM signals, power spectra of discrete PAM signals.
4 MHz Lock-In Amplifier
 4 MHz Lock-In Amplifier SR865A 4 MHz dual phase lock-in amplifier SR865A 4 MHz Lock-In Amplifier 1 mhz to 4 MHz frequency range Low-noise current and voltage inputs Touchscreen data display - large numeric
Major Differences Between the DT9847 Series Modules
 DT9847 Series Dynamic Signal Analyzer for USB With Low THD and Wide Dynamic Range The DT9847 Series are high-accuracy, dynamic signal acquisition modules designed for sound and vibration applications.
MIE 402: WORKSHOP ON DATA ACQUISITION AND SIGNAL PROCESSING Spring 2003
 MIE 402: WORKSHOP ON DATA ACQUISITION AND SIGNAL PROCESSING Spring 2003 OBJECTIVE To become familiar with state-of-the-art digital data acquisition hardware and software. To explore common data acquisition
Clock Jitter Cancelation in Coherent Data Converter Testing
 Clock Jitter Cancelation in Coherent Data Converter Testing Kars Schaapman, Applicos Introduction The constantly increasing sample rate and resolution of modern data converters makes the test and characterization
4-Channel Video Filter for RGB and CVBS Video
 19-2951; Rev 2; 2/7 4-Channel Video Filter for RGB and CVBS Video General Description The 4-channel, buffered video reconstruction filter is ideal for anti-aliasing and DAC-smoothing video applications
Digital Audio: Some Myths and Realities
 1 Digital Audio: Some Myths and Realities By Robert Orban Chief Engineer Orban Inc. November 9, 1999, rev 1 11/30/99 I am going to talk today about some myths and realities regarding digital audio. I have
4-Channel Video Reconstruction Filter
 19-2948; Rev 1; 1/5 EVALUATION KIT AVAILABLE 4-Channel Video Reconstruction Filter General Description The 4-channel, buffered video reconstruction filter is ideal for anti-aliasing and DAC-smoothing video
ENGINEERING COMMITTEE Interface Practices Subcommittee SCTE STANDARD SCTE
 ENGINEERING COMMITTEE Interface Practices Subcommittee SCTE STANDARD Test Method for Reverse Path (Upstream) Intermodulation Using Two Carriers NOTICE The Society of Cable Telecommunications Engineers
4. TITLE AND SUBTITLE 5a. CONTRACT NUMBER. 6. AUTHOR(S) 5d. PROJECT NUMBER
 5d. PROJECT NUMBER") REPORT DOCUMENTATION PAGE Form Approved OMB No. 0704-0188 Public reporting burden for this collection of information is estimated to average 1 hour per response, including the time for reviewing instructions,
REPORT DOCUMENTATION PAGE Form Approved OMB No. 0704-0188 Public reporting burden for this collection of information is estimated to average 1 hour per response, including the time for reviewing instructions,
SUBSYSTEMS FOR DATA ACQUISITION #39. Analog-to-Digital Converter (ADC) Function Card
 Function Card") SUBSYSTEMS FOR DATA ACQUISITION #39 Analog-to-Digital Converter (ADC) Function Card Project Scope Design an ADC function card for an IEEE 488 interface box built by Dr. Robert Kolbas. ADC card will add
SUBSYSTEMS FOR DATA ACQUISITION #39 Analog-to-Digital Converter (ADC) Function Card Project Scope Design an ADC function card for an IEEE 488 interface box built by Dr. Robert Kolbas. ADC card will add
Spectrum Analyser Basics
 Hands-On Learning Spectrum Analyser Basics Peter D. Hiscocks Syscomp Electronic Design Limited Email: phiscock@ee.ryerson.ca June 28, 2014 Introduction Figure 1: GUI Startup Screen In a previous exercise,
Adaptive Resampling - Transforming From the Time to the Angle Domain
 Adaptive Resampling - Transforming From the Time to the Angle Domain Jason R. Blough, Ph.D. Assistant Professor Mechanical Engineering-Engineering Mechanics Department Michigan Technological University
UNIVERSAL SPATIAL UP-SCALER WITH NONLINEAR EDGE ENHANCEMENT
 UNIVERSAL SPATIAL UP-SCALER WITH NONLINEAR EDGE ENHANCEMENT Stefan Schiemenz, Christian Hentschel Brandenburg University of Technology, Cottbus, Germany ABSTRACT Spatial image resizing is an important
10:15-11 am Digital signal processing
 1 10:15-11 am Digital signal processing Data Conversion & Sampling Sampled Data Systems Data Converters Analog to Digital converters (A/D ) Digital to Analog converters (D/A) with Zero Order Hold Signal
HP 71910A and 71910P Wide Bandwidth Receiver Technical Specifications
 HP 71910A and 71910P Wide Bandwidth Receiver Technical Specifications 100 Hz to 26.5 GHz The HP 71910A/P is a receiver for monitoring signals from 100 Hz to 26.5 GHz. It provides a cost effective combination
Development of an oscilloscope based TDP metric
 Development of an oscilloscope based TDP metric IEEE 2015 Greg LeCheminant Supporters Jonathan King Finisar Ali Ghiasi Ghiasi Quantum 2015 Page 2 Understanding the basic instrumentation issues Equivalent-time
Improving the accuracy of EMI emissions testing. James Young Rohde & Schwarz
 Improving the accuracy of EMI emissions testing James Young Rohde & Schwarz Q&A Who uses what for EMI? Spectrum Analyzers (SA) Test Receivers (TR) CISPR, MIL-STD or Automotive? Software or front panel?
ECE 5765 Modern Communication Fall 2005, UMD Experiment 10: PRBS Messages, Eye Patterns & Noise Simulation using PRBS
 ECE 5765 Modern Communication Fall 2005, UMD Experiment 10: PRBS Messages, Eye Patterns & Noise Simulation using PRBS modules basic: SEQUENCE GENERATOR, TUNEABLE LPF, ADDER, BUFFER AMPLIFIER extra basic:
Multirate Digital Signal Processing
 Multirate Digital Signal Processing Contents 1) What is multirate DSP? 2) Downsampling and Decimation 3) Upsampling and Interpolation 4) FIR filters 5) IIR filters a) Direct form filter b) Cascaded form
Department of Electrical & Electronic Engineering Imperial College of Science, Technology and Medicine. Project: Real-Time Speech Enhancement
 Department of Electrical & Electronic Engineering Imperial College of Science, Technology and Medicine Project: Real-Time Speech Enhancement Introduction Telephones are increasingly being used in noisy
Signal Processing. Case Study - 3. It s Too Loud. Hardware. Sound Levels
 Case Study - 3 Signal Processing Lisa Simpson: Would you guys turn that down! Homer Simpson: Sweetie, if we didn't turn it down for the cops, what chance do you have? "The Simpsons" Little Big Mom (2000)
Experiment 13 Sampling and reconstruction
 Experiment 13 Sampling and reconstruction Preliminary discussion So far, the experiments in this manual have concentrated on communications systems that transmit analog signals. However, digital transmission
Introduction to Data Conversion and Processing
 Introduction to Data Conversion and Processing The proliferation of digital computing and signal processing in electronic systems is often described as "the world is becoming more digital every day." Compared
1 Introduction to PSQM
 A Technical White Paper on Sage s PSQM Test Renshou Dai August 7, 2000 1 Introduction to PSQM 1.1 What is PSQM test? PSQM stands for Perceptual Speech Quality Measure. It is an ITU-T P.861 [1] recommended
Appendix D. UW DigiScope User s Manual. Willis J. Tompkins and Annie Foong
 Appendix D UW DigiScope User s Manual Willis J. Tompkins and Annie Foong UW DigiScope is a program that gives the user a range of basic functions typical of a digital oscilloscope. Included are such features
Data Converter Overview: DACs and ADCs. Dr. Paul Hasler and Dr. Philip Allen
 Data Converter Overview: DACs and ADCs Dr. Paul Hasler and Dr. Philip Allen The need for Data Converters ANALOG SIGNAL (Speech, Images, Sensors, Radar, etc.) PRE-PROCESSING (Filtering and analog to digital
Analog Arts SA985 SA975 SA935 SA915 Product Specifications
 Analog Arts SA985 SA975 SA935 SA915 Product Specifications Oscilloscope/ Spectrum Analyzer/ Data Recorder Model SA985 SA975 SA935 SA915 Oscilloscope (Typical by Design) Bandwidth (Max at probe tip) [1]
PREPARED FOR: U.S. Army Medical Research and Materiel Command Fort Detrick, Maryland
 AWARD NUMBER: W81XWH-14-2-0180 TITLE: Development of a Device for Objective Assessment of Tinnitus in Humans PRINCIPAL INVESTIGATOR: Jeremy G. Turner, PhD CONTRACTING ORGANIZATION: OtoScience Labs, LLC
On Figure of Merit in PAM4 Optical Transmitter Evaluation, Particularly TDECQ
 On Figure of Merit in PAM4 Optical Transmitter Evaluation, Particularly TDECQ Pavel Zivny, Tektronix V1.0 On Figure of Merit in PAM4 Optical Transmitter Evaluation, Particularly TDECQ A brief presentation
Precise Digital Integration of Fast Analogue Signals using a 12-bit Oscilloscope
 EUROPEAN ORGANIZATION FOR NUCLEAR RESEARCH CERN BEAMS DEPARTMENT CERN-BE-2014-002 BI Precise Digital Integration of Fast Analogue Signals using a 12-bit Oscilloscope M. Gasior; M. Krupa CERN Geneva/CH
Introduction: Overview. EECE 2510 Circuits and Signals: Biomedical Applications. ECG Circuit 2 Analog Filtering and A/D Conversion
 EECE 2510 Circuits and Signals: Biomedical Applications ECG Circuit 2 Analog Filtering and A/D Conversion Introduction: Now that you have your basic instrumentation amplifier circuit running, in Lab ECG1,
RF MEMS IMPROVEMENT PROGRAM
 AFRL-SN-RS-TR-2005-62 Final Technical Report March 2005 RF MEMS IMPROVEMENT PROGRAM L-3 Government Services, Inc. Sponsored by Defense Advanced Research Projects Agency DARPA Order No. M606 APPROVED FOR
CAP240 First semester 1430/1431. Sheet 4
 King Saud University College of Computer and Information Sciences Department of Information Technology CAP240 First semester 1430/1431 Sheet 4 Multiple choice Questions 1-Unipolar, bipolar, and polar encoding
Analog Input & Output
 EEL 4744C: Microprocessor Applications Lecture 10 Part 1 Analog Input & Output Dr. Tao Li 1 Read Assignment M&M: Chapter 11 Dr. Tao Li 2 To process continuous signals as functions of time Advantages free
How advances in digitizer technologies improve measurement accuracy
 How advances in digitizer technologies improve measurement accuracy Impacts of oscilloscope signal integrity Oscilloscopes Page 2 By choosing an oscilloscope with superior signal integrity you get the
DVM-3000 Series 12 Bit DIGITAL VIDEO, AUDIO and 8 CHANNEL BI-DIRECTIONAL DATA FIBER OPTIC MULTIPLEXER for SURVEILLANCE and TRANSPORTATION
 DVM-3000 Series 12 Bit DIGITAL VIDEO, AUDIO and 8 CHANNEL BI-DIRECTIONAL FIBER OPTIC MULTIPLEXER for SURVEILLANCE and TRANSPORTATION Exceeds RS-250C Short-haul and Broadcast Video specifications. 12 Bit
QUICK START GUIDE FOR DEMONSTRATION CIRCUIT /12/14 BIT 10 TO 105 MSPS ADC
 LTC2280, LTC2282, LTC2284, LTC2286, LTC2287, LTC2288 LTC2289, LTC2290, LTC2291, LTC2292, LTC2293, LTC2294, LTC2295, LTC2296, LTC2297, LTC2298 or LTC2299 DESCRIPTION Demonstration circuit 851 supports a
Agilent 81600B Tunable Laser Source Family
 Agilent 81600B Tunable Laser Source Family Technical Specifications August 2007 The Agilent 81600B Tunable Laser Source Family offers the full wavelength range from 1260 nm to 1640 nm with the minimum
Technical Data. HF Tuner WJ-9119 WATKINS-JOHNSON. Features
 May 1996 Technical Data WATKINS-JOHNSON HF Tuner WJ-9119 WJ designed the WJ-9119 HF Tuner for applications requiring maximum dynamic range. The tuner specifically interfaces with the Hewlett-Packard E1430A
Fig. 1. Hawk switch/load vacuum section in the standard configuration.
 PLASMA OPENING SWITCH EXPERIMENTS ON HAWK WITH AN E-BEAM DIODE LOAD P.J. Goodrich,* J.R. Boller, R.J. Commisso, D.O. Hinshelwood,* J.C. Kellogg, B.V. Weber Pulsed Power Physics Branch, Plasma Physics Division
Real-time QC in HCHP seismic acquisition Ning Hongxiao, Wei Guowei and Wang Qiucheng, BGP, CNPC
 Chengdu China Ning Hongxiao, Wei Guowei and Wang Qiucheng, BGP, CNPC Summary High channel count and high productivity bring huge challenges to the QC activities in the high-density and high-productivity
Investigation of Digital Signal Processing of High-speed DACs Signals for Settling Time Testing
 Universal Journal of Electrical and Electronic Engineering 4(2): 67-72, 2016 DOI: 10.13189/ujeee.2016.040204 http://www.hrpub.org Investigation of Digital Signal Processing of High-speed DACs Signals for
Digital Lock-In Amplifiers SR850 DSP lock-in amplifier with graphical display
 Digital Lock-In Amplifiers SR850 DSP lock-in amplifier with graphical display SR850 DSP Lock-In Amplifier 1 mhz to 102.4 khz frequency range >100 db dynamic reserve 0.001 degree phase resolution Time constants
Agilent 81600B Tunable Laser Source Family Technical Specifications August New model: nm, low SSE output!
 New model: 1260 1375 nm, low SSE output! Agilent Tunable Laser Source Family Technical Specifications August 2004 The Agilent Tunable Laser Source Family offers the from 1260 nm to 1640 nm with the minimum
Iterative Direct DPD White Paper
 Iterative Direct DPD White Paper Products: ı ı R&S FSW-K18D R&S FPS-K18D Digital pre-distortion (DPD) is a common method to linearize the output signal of a power amplifier (PA), which is being operated
Analog Reconstruction Filter for HDTV Using the THS8133, THS8134, THS8135, THS8200
 Application Report SLAA135 September 21 Analog Reconstruction Filter for HDTV Using the THS8133, THS8134, THS8135, THS82 Karl Renner Digital Audio Video Department ABSTRACT The THS8133, THS8134, THS8135,
Lab 1 Introduction to the Software Development Environment and Signal Sampling
 ECEn 487 Digital Signal Processing Laboratory Lab 1 Introduction to the Software Development Environment and Signal Sampling Due Dates This is a three week lab. All TA check off must be completed before
Converters Series Tri-Band Frequency Converters. Back to Multiband. Specifications Upconverters Downconverters Phase Noise Options Rear Panel
 R Back to Multiband Converters 9700 Series Tri-Band Frequency Converters 9700 SERIES TRI-BAND FREQUENCY CONVERTERS The MITEQ frequency converters are designed for advanced satellite communication systems
Proposed reference equalizer change in Clause 124 (TDECQ/SECQ. methodologies).
.") Proposed reference equalizer change in Clause 124 (TDECQ/SECQ methodologies). 25th April 2017 P802.3bs SMF ad hoc Atul Gupta, Macom Marco Mazzini, Cisco Introduction In mazzini_01a_0317_smf, some concerns
Proposed reference equalizer change in Clause 124 (TDECQ/SECQ methodologies). 25th April 2017 P802.3bs SMF ad hoc Atul Gupta, Macom Marco Mazzini, Cisco Introduction In mazzini_01a_0317_smf, some concerns
Measuring with digital storage oscilloscopes
 Markus Reil, Rainer Wagner 2.2016 1MAA265-1e Educational note Measuring with digital storage oscilloscopes Educational note Products: ı R&S HMO1002 This educational note covers the theory and practice
TSG 90 PATHFINDER NTSC Signal Generator
 Service Manual TSG 90 PATHFINDER NTSC Signal Generator 070-8706-01 Warning The servicing instructions are for use by qualified personnel only. To avoid personal injury, do not perform any servicing unless