MEDIA NATIONS: UK Published 18 July 2018
|
|
|
- Moris Todd
- 5 years ago
- Views:
Transcription


1 MEDIA NATIONS: UK 2018 Published 18 July 2018

2 About this document This is Ofcom s first annual Media Nations report. The report reviews key trends in the television and audiovisual sector as well as the radio and audio sector. Accompanying it is a data report which provides interactive access to an extensive range of data. In these reports we provide data and analysis on traditional broadcast television and radio services, and look at the take-up and impact of subscription on-demand and streaming services. The Media Nations report is a reference publication for industry, stakeholders, academics and consumers. It provides context to the work Ofcom undertakes in looking after the interests of people in the markets we regulate. In addition to the UK-wide report and the interactive report, there are separate reports for Northern Ireland, Scotland and Wales. 2
3 Contents About this document... 2 Executive summary... 4 Introduction... 9 TV services and devices TV and AV consumption TV and AV revenues TV and AV output and spend Satisfaction with and perceptions of TV The local TV sector The UK radio landscape Consumption and use of radio and audio services Radio revenues
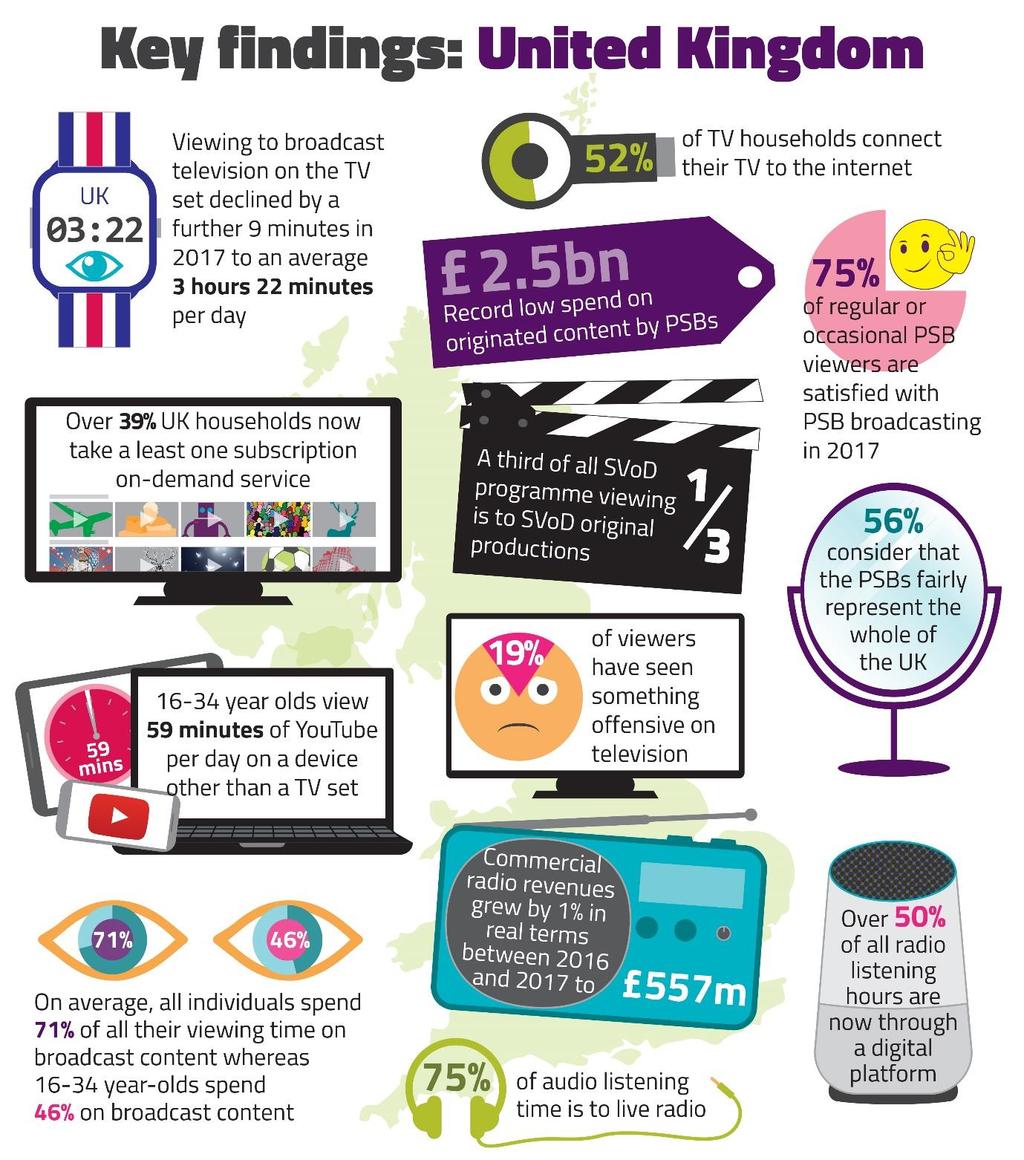
4 Executive summary Take-up of superfast broadband and connected televisions is changing how people watch television programmes Across all devices, people s total TV and audiovisual daily viewing in 2017 was 5 hours 1 minute. Broadcast TV made up 71% of this; the remaining 29% was non-broadcast content such as YouTube and subscription on-demand services such as Netflix and Amazon Prime Video. Viewing of broadcast television on the TV set fell by nine minutes (4.2%) in 2017 to an average 3 hours 22 minutes per day. This means there has been a total decline of 38 minutes (15.7%) since However, time spent using the TV set overall remains constant as viewing of nonbroadcast content increases. Non-broadcast content (including subscription on-demand services such as Netflix, and YouTube viewing) makes up 42 mins (17%) of the 4 hours 9 minutes of total TV and AV content watched per day on a TV set - enabled by superfast broadband and an increase in use of connected televisions. The change in viewing habits is driven by younger viewers, who watch more nonbroadcast than broadcast content. In 2017, 16-34s watched an average of 2 hours 37 minutes of non-broadcast content a day, across all devices (including 59 mins of YouTube on PCs/phones/tablets), and 2 hrs 11 mins of broadcast content. The profile of broadcast TV viewers continues to get older; older consumers broadcast viewing on the TV set has remained steady and over-54s now contribute more than half of all broadcast television viewing in the UK. The rise of online video is changing the picture for the TV industry The rapid take-up of subscription on-demand services means there are now more subscriptions to Netflix, Amazon and NOW TV than there are to traditional pay-tv services. According to BARB Establishment Survey data, the number of pay-tv subscriptions in the UK in Q totalled 15.1 million, whereas the total number of subscriptions to Netflix, Amazon and NOW TV was 15.4 million. However, this figure includes subscriptions to multiple on-demand services within one household: 11.1 million households (39.3%) have at least one of either Netflix, Amazon or NOW TV. 4
5 The high level of investment in original content is a key driver. More than a third of Netflix (38%) subscribers cite to watch original series made by the provider as a reason for signing up (up from 30% in Q1 2017). Consequently, online audiovisual revenues grew by 25% year on year in real terms, to 2.26bn in Subscription on-demand revenue represents the largest annual growth (up by 35% in real terms to 895m in 2017), while online advertiser-funded video generated over 1bn for the first time (up 25% year on year). About 30% of this was from broadcast video on-demand players such as All 4 and ITV Hub. In contrast, TV advertising income declined by 7% in real terms, year on year, to 3.9bn in The commercial public service broadcasters (PSBs) had the largest decline; down 9%to 2bn in 2017, with their non-psb portfolio channels also falling, by 3% to 773m. However, television advertising revenues have grown by 0.4% per year on average over the last five years. The downturn in 2017 may be largely due to cyclical changes in the wider economy but the risks of structural decline appear to be growing as TV viewing falls and online video advertising encroaches on traditional broadcast TV advertising revenue. Growth in pay-tv subscription revenues has been muted. Following a period of sustained growth, in 2017 traditional pay-tv subscription revenues dropped by 2.7% in real terms year on year to 6.4bn. Audiences continue to watch and value public service broadcasting, especially news, children s programming and UK-made programmes Satisfaction with PSB broadcasting overall is in line with recent years, with 75% of viewers claiming to be either very or quite satisfied (77% in 2016). And PSBs have maintained their share of broadcast viewing; half (51%) of all broadcast viewing on the TV is to the main five PSB channels (unchanged since 2016). Public service broadcasters remain a trusted source of news in the digital age. Providing news programmes which are trustworthy continues to be considered the most important PSB purpose by regular viewers (84% in 2017 vs. 86% in 2016). Children s PSB programming is rated highly for importance and delivery. More than eight in ten (83%) parents/carers of children who regularly watch children s PSB channels rated the provision of PSB children s programming as important. A similar proportion (81%) said that PSB channels deliver on providing a wide range of high-quality, UK-made programmes for children. Showing new programmes made in the UK remains important to a clear majority (78%) of regular PSB viewers. But on-demand original content has also helped drive up subscriptions to video-on-demand services, despite only a small proportion of this programming being UKmade (subscription on-demand originals make up a third of all viewing of subscription ondemand services, although they account for less than 10% of all catalogue titles). 5
6 But there are risks to the PSB system which we will continue to monitor PSBs are investing less money in UK-made content. The latest broadcasters figures submitted to Ofcom reveal that spend on first-run UK network originations, for the PSBs combined, is at a record low. The 2.5bn spent by the main five PSB channels and the BBC portfolio channels in 2017 represents a 28% fall (or just under 1bn) in real terms from the 2004 peak of 3.4bn. However, a large proportion of the decline in spend on first-run originated spend has been mitigated by an increase in third-party funding, such as coproduction arrangements, deficit funding from production companies and tax credits. First-run, UK-made network programming, as a proportion of total network spend, remained broadly consistent at 89% in 2017, compared to 89% in 2016 and 86% in 2014 for the PSB and BBC portfolio channels combined. Spend on some PSB genres is at a record low. PSBs investment in new UK children s programming has continued the decline seen in recent years, falling by a further 18% in real terms in 2017 to 70m. Spend on original UK comedy is down by 5% in real terms since 2016 to 90m (also reaching a new low) and spend on first-run UK-made drama fell by 7% to 307m. However, these figures should be considered in the context of the general increase in third-party funding mentioned above. Portraying the nations and regions fairly to the rest of the UK is the lowest-scoring statement in terms of delivery against the purposes and characteristics. Our survey of people s attitudes to the PSBs found that only 56% rated portraying the nations and regions fairly to the rest of the UK as 7 or higher on a scale of While the PSBs are allocating more of their content budgets to network programmes made outside London, spend on programmes made in the nations specifically for the nations declined by 3% in real terms to 275m in The viability of local TV services remains uncertain Many local TV services continue to face challenges in generating revenue. As in 2016 and 2015, expenditure by local TV services in 2017 was far greater than the income they generated. Expenditure for the sector as a whole in 2017 was 20m compared to an income of 10.4m. Digital listening is transforming the radio landscape More than half of all radio listening hours are now through a digital platform. This is driven by several factors: almost two-thirds of households now have a DAB set; smart speakers are a convenient way to listen to radio at home; DAB coverage now stands at 90% of the UK; and there has been an increase in the number of national commercial stations available. However, digital listening is not uniform across the UK or by demographic. For example, listeners in Berkshire have the highest proportion of digital listening, at 60%, but in the Borders, Northern Ireland and parts of Wales, listening through a digital platform accounts for only a third of all time spent listening to radio (35%). Younger people are more likely than 6
7 those aged over 65 to listen digitally (52% of hours vs. 43%). Two thirds of in-car listening is via analogue. Other online audio services are also becoming more popular. Music streaming services like Spotify and Apple Music are increasing their reach, offering music on demand these account for 8% of all audio listening, and 29% among year -olds. Music industry revenues from streaming exceeded physical sales for the first time in Podcasts are also gaining in popularity as more content providers seek to offer bespoke content or repackage previously-broadcast content. But radio continues to be resilient Despite the increase in competition for audio time, radio continues to maintain its reach of nine in ten adults in the UK. Three-quarters of all audio listening is to live radio, and although this drops to 36% for year-olds, it is still the audio source with the highest proportion of listening hours. National commercial radio in particular is thriving, benefiting from the wider reach offered by digital platforms, and is one of the only radio sectors to increase its number of year-old listeners. Commercial revenues rose by 1% in real terms to 557m in
8 8

9 Introduction This is Ofcom s first Media Nations report, which we intend to publish annually to track developments in how UK audiences are served. Published alongside this report is a data report comprising a wide range of interactive charts. The reports review current trends in the television and audiovisual sector (TV and AV) as well as the radio and audio industry. They provide data and analysis on traditional broadcast television and radio services, and consider the take-up and impact of subscription-on-demand and streaming services. The Media Nations report enables the reader to find information relating to the TV and audiovisual (AV) sector, and the radio and audio industries, in the same place; it replaces Ofcom s previously published PSB Annual Report and Digital Radio Report. It includes separate reports for Scotland, Northern Ireland and Wales, which (together with our Connected Nations reports, focusing on the telecoms sector) replace the individual nations reports that were previously published as part of our annual Communications Market Report. The report provides updates on several datasets, including bespoke data collected directly from licensed television and radio broadcasters (for output, spend and revenue), Ofcom s proprietary consumer research (for audience opinions), and BARB and RAJAR (for audience consumption). It should be noted that our regulatory powers do not permit us to collect data directly from online video-on-demand and video-sharing services (such as ITV Player, Netflix, Amazon Prime Video and YouTube) for research purposes, and therefore we rely predominately on third-party sources for information relating to these services. For TV and AV, the report looks specifically at what television broadcasters and on-demand services are spending on programmes, the amount of different types of programmes they show and the extent to which audiences are watching broadcast versus non-broadcast television. The report also provides information about how audiences rate the television public service broadcasters against a range of specific purposes and characteristics, as well as their attitudes towards broadcast TV standards in general. The report also provides an update on developments in the local TV sector. For radio and audio, the report looks at the availability of radio stations in the UK via a range of different platforms, including analogue, DAB and digital broadcast networks. The report also provides and overview of the key developments within the wider audio market, including who is listening, how they are listening and what they are listening to. We publish this report to support Ofcom s regulatory goal to research markets constantly and to remain at the forefront of technological understanding. It also addresses the requirement to 9
10 undertake and make public our consumer research (as set out in Sections 14 and 15 of the Communications Act 2003). It also meets the requirements on Ofcom under Section 358 of the Communications Act 2003 to publish an annual factual and statistical report on the TV and radio sector. 10

11 TV services and devices Chapter overview This chapter examines the take-up of digital TV platforms, as well as the use of video-on-demand services such as BBC iplayer, Netflix and Amazon Prime Video. It looks at the reasons for subscribing to different subscription video-on-demand services, as well as the impact of these services on traditional pay-tv services. For the purposes of this report, the following terms are used when referring to on-demand and streaming services: VoD video on demand SVoD subscription video on demand BVoD broadcaster video on demand Includes paid-for subscription video on demand (e.g. Netflix and Amazon Prime Video), free broadcaster video-on-demand services (e.g. BBC iplayer, 4oD) as well as online video content from services such as YouTube and Facebook (excluding short-form video clips). Paid-for subscription video-on-demand services such as Netflix, Amazon Prime Video and NOW TV. While these services offer more than just video on demand (e.g. streaming, linear pay-tv channels, as well as content to own or rent) they are categorised as SVoD in this report for ease of reference. Free video-on-demand services from the major broadcasters, including BBC iplayer, ITV Hub, All4, My5 (as above, these services offer more than just on-demand but are referred to as BVoD for ease of reference in this report). Digital terrestrial is the most common way to receive TV According to BARB s Establishment Survey, in the first quarter of % of UK homes had a working TV set. This figure has remained relatively stable since 2012 when it was only slightly higher at 96.3%. The remaining 4.6% homes without a TV set either do not use a television, or choose to watch audiovisual content using another device, or the television is permanently out of order. 1 1 BARB Establishment Survey Q Q
12 Homes that only have digital terrestrial TV (DTT) make up the biggest proportion of all UK homes, totalling 11.3 million homes or 39.8% of all households, an increase of 2.3% since After a slight dip in 2013 and 2014, the increase in digital terrestrial in recent years may have been driven in part by consumers moving away from traditional pay-tv platforms in favour of combining a free-toair DTT service with online SVoD services, such as Netflix and Amazon Prime Video. The proportion of homes with pay-satellite TV (pay DSAT), has declined marginally from 33.6% of homes in 2012 to 30.4% in Q1 2018, while digital cable services (DCAB) have experienced a similar marginal decrease: from 15.7% of homes in 2012 to 14.9% in Q The proportion of homes with free-to-view satellite services has remained stable (6.4% in Q and 6.7% in Q4 2012). The proportion of homes that have internet protocol television (IPTV) only (any one of BT TV, TalkTalk TV, Plusnet TV, or a standalone YouView box, and do not also have satellite, cable or other service) has increased from 1.7% in 2012 to 6.3% of households in Q Figure 1: Platform take-up, households (millions) Analogue terrestrial only Hybrid IPTV and digital terrestrial only Digital terrestrial only Digital cable Free-to-view digital satellite Pay digital satellite Analogue cable Source: BARB Establishment Survey. Household level data. All TV sets in home included so there may be platform overlaps. Notes: Data points are based on Q4 of each year until 2018, when it is Q1. BARB changed its methodology on the definition of a TV-set-owning household in Q In Q the claimed usage element was removed, which led to an increase in the TV set homes population. *Digital switchover was completed across the UK in October Data from 2013 therefore refer to TV households as a % of all households. Digital terrestrial TV only = receives digital TV through an aerial and not through DSAT/DCAB or other platforms. Hybrid IPTV digital terrestrial only = receives digital terrestrial TV through any of BT TV/TalkTalk TV/YouView/Plusnet TV and not DSAT/DCAB/other platforms. Rapid take-up of subscription video-on-demand services The major SVoD services all had rapid growth in subscriber numbers in 2017 and the first quarter of Amazon Prime Video had slightly larger year-on-year growth than Netflix, up by 32.7% to 2 BARB Establishment survey Q Q BARB Establishment Survey Q

13 reach 4.8 million subscribers in Q However, Netflix remains by far the most popular SVoD service, and in Q it was in 9.1 million UK households (a 32.2% increase since Q1 2017)4. The rapid take-up of SVoD has resulted in the total number of subscriptions to Netflix, Amazon and NOW TV exceeding subscriptions to traditional pay-tv services for the first time. According to BARB Establishment Survey data, the number of pay-tv subscriptions in the UK in Q totalled 15.1 million5, whereas the total number of subscriptions to Netflix, Amazon or NOW TV reached 15.4 million6. However, this figure includes subscriptions to multiple SVoD services within one household: 11.1 million households (39.3%) have at least one of either Netflix, Amazon or NOW TV.7 Figure 2: Take-up of subscription on-demand services Source: BARB Establishment Survey Q Q Further, the proportion of UK adults using any SVoD service is now almost on a par with those using any free PSB BVoD service (35% for PSB broadcaster services vs. 34% for any SVoD service in H1 2018). This is also reflected in the use of individual VoD services, with almost as many people now claiming to use Netflix (28%) as BBC iplayer (33%). The rapid increase in subscribers to Amazon (the second most popular SVoD service in the UK) means a similar proportion of adults now use this service as use ITV Hub/STV Player (the second most popular BVoD service) at 12% and 16% of UK adults respectively. Adults are also turning to other online streaming services for VoD services, with 17% of UK adults using YouTube to watch TV or films online.8 Smart TVs and streaming media players are driving growth in VoD consumption The growth in connected devices, coupled with more people having access to faster broadband speeds, has helped fuel the growth in video on demand. Eighty per cent of homes have a fixed 4 BARB Establishment Survey Q Pay-TV subscriptions includes the number of Sky (excluding NOW TV), Virgin TV, BT TV, TalkTalk TV and YouView households. It includes those who access their TV via one of these platforms but are not paying for additional channels. 6 Includes multiple SVoD subscriptions within one household and may include those on a free trial. 7 Source: BARB Establishment Survey Q Source: Ofcom Technology Tracker H
 now have an internetenabled smartphone, with most of these (85%) having a 4G service (up 9pp since H1 2017), while 58% of households have a tablet device.")
14 broadband connection, and in November % of these were superfast (i.e. with download speeds of 30Mbit/s or higher. 9 More than three-quarters of adults (78%) now have an internetenabled smartphone, with most of these (85%) having a 4G service (up 9pp since H1 2017), while 58% of households have a tablet device. 10 However, television sets have grown faster than any other device as a way of accessing VoD, with 67% (18 minutes) of all VoD viewing in 2017 via a TV set. 11 Among those with a TV in the household, 52% of households in H had a broadband-connected smart TV or a TV connected to the internet via another device such as a set-top box, games console, laptop or streaming media stick through which they can access video-on-demand services. 12 The most popular way of connecting a TV to the internet is by using a smart TV. Almost half (44%) of TV households have a smart TV, of which the majority (83%) are connected to their home broadband service. A fifth (20%) of those with a TV in the household have used a games console to connect their TV to the internet to watch something on the TV screen. 13 Internet-connected dongles or boxes (such as the NOW TV set-top box, Roku, Google Chrome, Amazon Fire TV stick, Amazon Fire TV and Apple TV) are also becoming increasingly popular, with around one on ten (11%) households using them to access VoD services (up from 5% in H1 2016). The increasing popularity of plug-in media sticks may be driven partly by the fact that they enable consumers to access VoD services without going through a pay-tv platform. 14 Figure 3: Household take-up of devices Source: Ofcom Technology Tracker. Data from Q1 of each year , then H Base: All adults aged 16+ (2018 n=3730). Significance testing: Arrows indicate any significant differences at the 95% confidence level between UK 2017 and UK Note: The question wording for DVD Player and DVR was changed in Q1 9 Source: Ofcom UK Home Broadband Performance Report Source: Ofcom Technology Tracker H Source: Ofcom Total AV measurement using BARB/BARB TV Player reports (census data)/touchpoints/comscore see detailed methodology section 12 Source: Ofcom Technology Tracker H Source: Ofcom Technology Tracker H Source: Ofcom Technology Tracker H
15 2009 so data are not directly comparable with previous years. *Internet-connected dongle or set-top box includes NOW TV set-top box, Roku, Google Chrome, Amazon Fire TV stick, Amazon Fire TV, Apple TV. Access to original and exclusive content is a key reason for subscribing to SVoD The high level of investment in original content by Netflix and Amazon Prime Video (see chapter on TV and AV output and spend) is driving subscriptions, with more than a third of Netflix (38%) subscribers in Q citing to watch original series made by the provider as a reason for signing up, up from 30% in Q And 32% of Netflix users, and 20% of Amazon Prime Video users, chose to watch exclusive content not available elsewhere as a reason for subscribing (up 12pp and 0pp respectively since Q1 2017). However, the most common reason for subscribing to Amazon Prime Video is still to obtain free shipping, although this has declined in importance; the number of people citing this as a reason has fallen from 71% in Q to 51% in Q1 2018, indicating that the Prime Video service is driving an increasing number of subscriptions in its own right. This is further illustrated by the fact that signing up in order to take advantage of a free trial has also declined across all services, down by 11pp for Amazon Prime Video (29% to 18%), 17pp for Netflix (35% to 18%) and 14pp for NOW TV (44% to 24%). An increasing proportion of respondents claim to have taken an SVoD service because they consider it to be cheaper than a pay-tv subscription. More than a quarter (28%) of NOW TV users stated that they used NOW TV as it was cheaper than pay TV, up 12 percentage points from 16% in Q1 2017, driven in particular by year-olds (19% in Q to 30% in Q1 2018). Similar increases were found for Netflix (12% to 21%) and Amazon Prime Video (9% to 10%). Figure 4: Selected reasons for using Netflix, Amazon Prime Video and NOW TV Source: GfK SVoD Tracker, Q Notes: EW1: Reasons for signing up for/ using service. Base: Netflix users (n=2596), Amazon Prime Video users (n=1896), NOW TV users (n=776). Note: Users include those who either subscribe to or are trialling each service and use it at least once a fortnight. Free shipping is not available as part of Netflix or NOW TV s service. To watch original series made by provider not asked of NOW TV users. 15
.")
16 Half of SVoD users subscribe to more than one service Increasing numbers of SVoD subscribers in the UK are using more than one SVoD service, with 51% of SVoD subscribers taking two or more services in Q (up from 47% in 2017). By far the most popular combination of services is subscribing to both Netflix and Amazon Prime Video, with almost a third (29%) of SVoD users in Q claiming to take this combination. A smaller proportion (7%) claim to take both Netflix and NOW TV, while 12% of users claim to subscribe to all three services (Netflix, Amazon Prime Video and NOW TV), up from 10% in Q As fragmentation of the market continues and new SVoD services are launched (such as the new sports streaming service described below) subscribing to multiple SVoD services may become more common. Figure 5: Proportion of SVoD users who subscribe to multiple services, 2017 vs Source: GfK SVoD Tracker, Q and Q January-March. Notes: RS2 Services used. Base: all respondents, 2017:2398, 2018:3324. The majority of SVoD subscribers also have a traditional pay-tv service The rapid increase in take-up of SVoD services is allowing consumers greater freedom to watch the content they want when they want, but for many SVoD is complementary to a traditional pay-tv subscription (e.g. Sky or Virgin TV). In Q1 2018, 71% of those with an SVoD subscription also had a pay-tv service approximately the same proportion as the previous year (72% in Q1 2017). 16 The high degree of overlap may be because traditional pay-tv services offer content that Netflix and Amazon Prime Video do not, such as exclusive sports content. While Netflix has not made exclusive 15 Source: GfK SVoD Tracker, Q and Q1 2018, Notes: RS2 Services used 16 Source: GfK SVoD Tracker, Q and Q1 2018, Notes: P7: Services currently have 16
17 live sports part of its overall content strategy, Amazon Prime Video and other SVoD and social media sites have been more active in this area. However, their investment in UK sport content rights remains small compared to pay-tv providers such as Sky and BT. 17
18 SVoD and social media platforms are acquiring sports rights Amazon Prime Video recently secured the rights to broadcast 20 live English Premier League matches per season in the UK from 2019 in a three-year deal. And in April 2018, Amazon agreed a 30m exclusive five-year deal for UK rights to the US Open tennis tournament (adding to the 50m already paid for the ATP World Tour). DAZN, a live, ad-free and on-demand sports streaming service, launched in August Based in London, DAZN is currently only available in Germany, Austria, Switzerland, Canada and Japan. In May 2018 DAZN agreed to an eight-year, 736m deal with Matchroom Boxing. It also has exclusive rights to air the Premier League in Germany, while in Japan traditional TV rights to the J-League football have been bought by DAZN in an exclusive ten-year streaming deal. Facebook Watch, at the time of writing, has not launched in the UK, although it has been available in the US since August Facebook Watch includes live sports and other sports-related content. Programming includes community and discussion features, allowing viewers to comment during games and interact with each other, using emojis or a chat window. SVoD subscribers are more likely to downgrade their pay-tv subscription than cancel it altogether Thirty-six per cent of SVoD subscribers claim to have dropped a premium aspect of pay-tv (sometimes known as cord shaving ) while 14% say they have stopped paying for it altogether ( cord cutting ). 17 To minimise the impact of cord shaving and cord cutting, pay-tv providers may look to offer SVoD services inside rather than outside the pay-tv platform. Sky has announced deals with both Netflix and Spotify which would allow it to offer these services as part of a bundle through its pay-tv platform (see further detail below). And in May 2018 BT announced a deal with Amazon Prime Video, which will enable BT TV customers to access Amazon Prime Video through its YouView settop box from June Sky and Netflix European partnership In March 2018 Sky announced its new partnership with Netflix, which will put Netflix content on the Sky Q platform. In addition, Sky will release a new bundle that will include a Sky Q and Netflix subscriptions. The price of this bundle has yet to be announced, but it will be available in the UK and Ireland sometime in This deal is the first of its kind for both companies, due to the structure of the billing relationship. In this agreement a Netflix subscription will be sold through a Sky package rather than as a separate service (as it is with BT s YouView and Virgin Media boxes). Netflix will also be added to NOW TV streaming sticks and boxes (but not the app), maintaining Netflix s integrity in the SVoD space. For both companies, the main benefit is acquisition and retention of subscribers. By including Netflix in the Sky Q ecosystem, Sky hopes to reduce the number of subscribers who are substituting to lower-cost or free TV platforms, and overlaying SVoD subscriptions to top up their content offering. 17 Source: GfK Viewscape
19 For Netflix, the deal introduces the element of stability of a pay-tv subscription. Customers are tied in to longer than 30-day contracts and are less likely to cancel month to month. One of the unique features of this deal is the search and recommendation integration of Netflix content on the Sky Q platform, allowing Netflix content to be recommended to users based on their Sky viewing. Platforms and content aggregators increasingly use algorithms to promote content, driven by a mix of viewer behaviour and editorial or commercial incentives. We will explore how these changes affect the discoverability of PSB content in our upcoming review of the prominence of PSB content. 19

20 TV and AV consumption Chapter overview This chapter examines trends in television and audiovisual (AV) consumption, including viewing of non-broadcast TV services such as Netflix and YouTube. It examines the role of traditional broadcast TV in the context of the wider audiovisual market, as well as changes in viewing, by channels and genres. Many different TV and video-on-demand services are competing for viewers UK audiences in 2017 had a rich choice of different ways of finding and watching video content. Data from a compilation of industry sources show how varied these choices are (see methodology annex for more information about the total AV consumption methodology). Of the 5 hours 11 minutes average video content that individuals watched per day, 71% originated from broadcast TV, and 58% was watched live on the TV set. However, there are several other large contributors to this total viewing, both on and off the TV set. YouTube, on devices other than the TV set, is the largest measurable type of mainly non-broadcast viewing, averaging almost half an hour per day across the population. This is significantly larger than subscription video-on-demand (SVoD) viewing (18 minutes) but is more diverse as a category, as it includes music videos, short clips, some long-form content, how to videos, vlogging and other video formats. Another large block of viewing on the TV set (12 minutes) is mainly YouTube, but also includes unidentifiable content that is likely to include piracy and pay-per-view content from subscription providers. The data for year olds show that, overall, they watch a similar amount of video content to other age groups (4 hours 48 minutes a day), but there are significant differences in what they watch. The majority of their viewing (54%) does not originate from broadcast TV and, compared to all individuals, much more of their viewing is on devices other than the TV set (34%). They spend an average of 59 minutes a day watching YouTube on devices other than the TV, although a large proportion of this is music videos so may not be active watching. 20
/touchpoints/comscore see detailed methodology section of how the sources are used to construct a total estimated view of video watched.")
21 Figure 6: Total audiovisual viewing time spent per day, all adults vs s: 2017 Source: Ofcom/BARB/BARB TV Player (census data)/touchpoints/comscore see detailed methodology section of how the sources are used to construct a total estimated view of video watched. 18 minutes of SVoD are consumed on average each day per person Watching SVoD on the TV set is measured at 18 minutes a day per person, but higher, at 30 minutes, for those aged This content competes directly with broadcaster-derived content, as it is primarily television series and films. Most of the content viewed on SVoD is not available from UK broadcasters, either because it is exclusive to the SVoD service, or because it is archive content no longer available from broadcast players. Average viewing figures for broadcaster video-on-demand (BVoD) services like iplayer and ITV Hub are half those for SVoD. The lower share of viewing for BVoD suggests that these services are still used primarily by audiences to catch up on missed programmes already broadcast on TV, while SVoD s increasing viewing share is driven in part by the growing number of SVoD originals available and audiences bingeing on multiple episodes of programmes. This is reflected in the fact that 61% of Netflix subscribers say they use the service every day/most days. 19 Games consoles still feature as a prominent part of the total video picture. Much of this is gaming, but part of the 11 minutes per day will be other types of content, using the console to connect with the internet. Total time spent using the TV screen has barely changed Looking at all viewing on the television set as measured by BARB, and not just broadcast TV, TV screen time declined by just two minutes in 2017, with other forms of television use offsetting most of the loss to broadcast TV viewing. 18 These figures will be much higher when calculated only for those who have access to an SVoD subscription. 19 GfK SVoD Tracker Q1 2018, Notes: RS3+RS3X SVoD platform frequency of use. 21
22 BARB measurement includes a category of unmatched viewing, which is viewing on the TV screen of anything beyond linear broadcasting or catch-up to broadcast programmes within 28 days. Between 2014 and 2017, the amount of unmatched viewing increased from 27 minutes per person per day, to 42 minutes. This viewing includes archive recordings and VoD programming, pay-perview rental films, games console use, and watching SVoD services. 20 Figure 7: Average daily minutes, per person, of total TV screen time Total TV screen time Unmatched viewing* Time-shifted: 8-28 days Time-shifted: up to 7 days Live viewing Industry standard BARB measurement is up to 7 days Source: BARB. All individuals 4+, network, total TV. Average minutes of viewing/day. *Note: Unmatched viewing = TV in use but content cannot be audio-matched or otherwise identified. Includes gaming, viewing of DVDs/box sets/archives, SVoD, time-shifted viewing beyond 28 days, apps on smart TVs and navigating EPG guides where there is no in-picture broadcast content. Audio-matched digital radio stations are excluded. Unmatched viewing has been reported by BARB since July The TV set is both the home of broadcast TV and a place to watch non-broadcast content The TV set is the home of broadcast TV, and live TV still accounts for almost three hours (58%) of all TV and AV content viewed. The only significant part of broadcast-derived content viewed outside the TV set is BVoD such as iplayer and ITV Hub, which is watched on other devices at an average of three minutes per day. However, with more than half of UK TV households now having a television set connected to the internet, non-broadcaster services are available on the TV set: in total these accounted for an average of 40 minutes of daily viewing on the TV set in Source: BARB. Network, all individuals (4+). Network. 22

23 Figure 8: Total TV and AV consumption per day across all devices, all individuals: 2017 Source: Ofcom/BARB/BARB TV Player (census data)/touchpoints 2017/ComScore see detailed methodology section of how the sources are used to construct a total estimated view of video watched YouTube makes up the highest proportion of non-broadcast viewing among 16-34s For the overall population, non-broadcast video sources comprise less than a third of total viewing (approximately an hour and a half of five hours in total). However, this is markedly different among young adults (16-34) whose consumption of non-broadcast sources is now greater than their broadcast-derived consumption. This young adult group watches a similar mix of non-broadcast sources as the total population, but the total amount viewed is almost double. They watch SVoD for half an hour a day on average, but the largest chunk is YouTube, which they watch for more than an hour a day on average (59 minutes on devices other than the TV set, plus a significant proportion of the 19 minutes of other video on the TV set). 23
/touchpoints 2017/ComScore see detailed methodology section of how the sources are used to construct a total estimated view of")
24 Figure 9: Minutes spent watching non-broadcast content across all devices, all individuals vs year-olds: 2017 Source: Ofcom/BARB/BARB TV Player (census data)/touchpoints 2017/ComScore see detailed methodology section of how the sources are used to construct a total estimated view of video watched Viewing of broadcast TV continues to decline This section uses data provided by the Broadcasters Audience Research Board (BARB), a panel of approximately 5,100 homes across the UK providing the official broadcast TV measurement for the industry. This includes all viewing of broadcast TV through a television set, and via any device attached to the set such as a computer, laptop or tablet. Unless otherwise stated, figures quoted are for seven-day consolidated viewing. Consolidated viewing includes viewing of programmes at the time they are broadcast on TV (live viewing) as well as from recordings on digital video recorders (DVRs) and through catch-up player services (e.g. apps on smart TVs) up to seven days after the first broadcast (time-shifted). See the methodology annex for more information. The amount of time spent viewing broadcast television on the TV in the UK has fallen for the sixth successive year. Between 2016 and 2017, viewing per person declined by 4.2% to 3 hours 22 minutes, down by nine minutes. This decline was driven mainly by younger audiences and has led to a widening gap by age. For example, in 2010 children spent half as long as over-64s watching broadcast TV. By 2017, viewing by over-64s had declined by a minute, while children s viewing had declined by more than an hour, so that over-64s were watching four times as much as children Source: BARB. All individuals (4+), network. Note: the number-of-hours calculations are made from minutes data to six decimal places so may not always fit with the rounding to whole minutes in the charts. 24
25 Average minutes of viewing per day Figure 10: Average total TV daily viewing by age (in minutes): All individuals (4+) Children (4-15) Source: BARB. Network. Over-54s contribute more than half of all broadcast television viewing Both for total viewing and for reach, children s and young adults declining viewing is driving overall changes in consumption behaviour. In 2017, 4.41 trillion minutes of broadcast television were watched by UK individuals, down from 4.59 trillion in 2016, a decline of 3.8%. Of this decline, reduced children s viewing accounted for 26.5%, and 16-24s accounted for 21%, so nearly half (47.5%) of all the decline in TV viewing levels is due to under-25s. And as we have an ageing population, this means that audiences for broadcast television are getting older; for the first time, over-54s (who make up 28% of the population of the UK) now contribute more than half of all broadcast television viewing. The decline in broadcast TV viewing on the TV set has continued into 2018 The decline in broadcast TV viewing on the TV set has continued into From January to June 2018 (H1 2018), overall viewing for all individuals was down by 4.9% on the same period in 2017, to an average of 3 hrs 16 minutes per person per day. The decline applied to all age groups. Adults aged had the biggest decline in viewing, down by 12% to 1 hr 51 minutes a day, and children are still the age group with the lowest level of viewing, at 1 hr 18 minutes a day. The fact that older people watch more TV remains true; the resilience of TV viewing by older people is slowing the overall decline in TV viewing at the all-individuals level. Nevertheless, viewing by over-54s fell by 2% in H Looking at each month separately, all-individuals overall viewing was down by 4.8% in January, 3.2% in February, flat in March (-0.1%), down by 3.9% in April, 9.3% in May and 8.3% in June. 25
26 Average weekly reach % Average minutes of viewing per day Figure 11: Average daily viewing (all individuals) by month: H Jan Feb Mar Apr May Jun Jul Aug Sep Oct Nov Dec Source: BARB. All individuals (4+), network. Broadcast TV still reaches large numbers but is declining, especially for younger age groups Broadcast television viewing, although down by 4.2% on the year, continued to hold its position as a mass-reach medium, with an average of 90.2% of individuals watching each week in But this was down from 91.5% in 2016, and as with average viewing times, the steepest declines were among children and young adults, while reach among age groups over 45 remained stable. Children s reach declined by 3.7pp to 82.5%, and 16-24s by 2.4pp to 78.2% between 2017 and Figure 12: Average weekly reach % of total TV, by age All individuals (4+) Children (4-15) Source: BARB. Network. Reach criteria: 15+ consecutive minutes, full weeks used. 22 Source: BARB. All individuals (4+), network. Reach criteria: 15+ consecutive minutes, full weeks used. Reach is a percentage of all TV households that has remained relatively stable. 26

27 Half of all TV viewing is to the main PSB channels Despite continued channel competition and proliferation within the UK (BARB reported on 342 channels in 2017, compared to 328 in 2016), the role and presence of the PSBs within household viewing has remained steady and continues to hold most of daily viewing; 50.9% of all broadcast viewing is to the main five PSB channels, a 0.1 percentage point decline since Including all their portfolio channels, the PSBs group viewing accounted for 70.3% of all broadcast viewing, up from 70.2% in BBC One and BBC Two performed worse than total average TV, with viewer minutes declining year on year by 5.1% and 5.5% respectively, driving a decline in overall share of 0.2pp and 0.1pp respectively. ITV and Channel 5 outperformed total TV with viewing minute declines of 3.5% and 2.1% respectively, driving a subsequent increase in share of 0.1pp across each channel. The increase in ITV network share is the first increase in channel share since 2013, the year after the London Olympics. Channel 4 s share remained unchanged in the year to 2017 for all individuals, and also for year olds, where the decline in TV viewing is most stark. Figure 13: Share of all broadcast viewing, by main PSBs: Source: BARB, TAM JICTAR and Ofcom estimates, individuals (4+). Network. New BARB panels introduced in 2002 and 2010, as a result, pre- and post-panel change data must be compared with caution (see dotted lines). Channel 4 includes S4C up to The main five PSB channels include viewing to their HD channel variants but exclude viewing to their +1 channels As with viewing levels to the PSBs, weekly reach also continued to decline in 2017; the main five PSB channels reach was down 2pp to 81% in BBC One had the largest year-on-year decline, from 72% weekly reach in 2016, to 69% in When we include all the PSB portfolio channels, weekly reach to all the PSBs declined slightly, from 88% to 87%. 27
28 Figure 14: Average weekly reach % of the PSB channels and portfolios PSBs and portfolios Average weekly reach % Main 5 BBC One ITV BBC Two Channel 4 33 Channel Source: BARB. All individuals (4+), network. Reach criteria: 15+ consecutive minutes, full weeks used. PSBs strengthen their VoD offerings in the light of decline in viewing to broadcast TV The PSBs have been addressing the change in viewing habits outlined above by transitioning their BVoD services from predominately catch-up services to services containing a larger back catalogue of original and acquired content. For instance, Channel 4 acquired all six seasons of 90s teen drama Dawson s Creek and has made them available on All 4 since November Netflix and Amazon have been making all episodes of a TV season available on the same day rather than releasing episodes on a weekly basis; this technique has helped to attract audiences. In July 2017 all the episodes of the series Top of the Lake: China Girl were made available on BBC iplayer after the BBC Two broadcast of the first episode. Other series have followed a similar release pattern, such as the recent BBC documentary Civilizations. The PSBs have also used SVoD services to increase viewing to their respective broadcast channels and VoD services. For instance, seasons 1-2 of crime drama Peaky Blinders were available on Netflix while season 4 was being broadcast on BBC Two in December 2017, and were available on BBC iplayer, while seasons 1-3 were also temporarily available on iplayer. This may have contributed to Peaky Blinders having the most requests on BBC iplayer in December 2017, at 327 million (17% yearon-year growth). Peaky Blinders was the 12 th most streamed show on Netflix in Q , the only PSB content to make the top 20 SVoD list. It subsequently became the fifth most-streamed show in Q after season 3 was made available in January. In May 2018 it was reported that the BBC, ITV and Channel 4 were in talks to create a joint streaming service in the UK. 23 GfK programme data 28
29 The top 20 channels reflect the older profile of broadcast TV Figure 14 plots the age and socio-economic (SEG) 24 profile of the 20 most-watched channels in 2017, relative to the 35+ age and ABC1 SEG profile of all viewers to total TV. It also shows the share of each channel, depicted by the size of the bubbles. The profile of a channel gives an indication of its target audience, and for commercial channels this is used to sell advertising. Reflecting the older profile of TV overall, most of the top 20 channels in 2017 had audiences that were older or the same as the average. This was particularly the case for those channels with the largest share of viewing, including BBC One, ITV and BBC Two. Apart from CBeebies (the dedicated children s channel for 0-6 year-olds from the BBC), the channel with the youngest profile was E4 (52.3% of its audience was aged under 35) while the channels with the oldest profile were ITV3 and Drama (for both, 95% of their audiences were aged 35+). Channels from the BBC, Sky and Channel 4 attracted higher proportions of ABC1 audiences than TV generally (46.5%). Of the top 20 most-watched channels, BBC Four had the biggest ABC1 profile, at 59.3%. Reflecting their greater reach, all the top 20 channels apart from Sky One and Sky Sports Main Event are available without a pay-tv subscription. Figure 15: Age and socio-economic audience profile of the 20 most-viewed channels: 2017 Source: BARB. Network. Based on the top 20 channels ranked by share, including individually reported +1 channels. Size of bubble relates to share among individuals 4+. Profile based on age: % 35+, SEG: % ABC1 (base all individuals (4+). Axes cross at the average age/social economic group profile of total TV. Includes HD variants where applicable and +1 variants. 24 A classification of household social status based on the occupation of the chief income earner. BARB reports the following social grades: AB: higher (A) or intermediate (B) managerial, administrative or professional; C1: supervisory or clerical and junior managerial, administrative or professional; C2: skilled manual workers; D: semi-skilled and unskilled workers; E: state pensioners, casual or lowest grade workers. 29
30 Proportion of viewing (%) Entertainment remains the most popular genre across total TV Since 2010, the split of viewing by genre across all channels has remained fairly consistent. Entertainment programming remains the most popular genre, accounting for 15% of viewing in This is followed by documentaries: other (this refers to documentaries other than science and natural history, which has a separate group, see genre definitions in methodology annex), national/international news; leisure interests and sports programming. 25 Entertainment programming was also the most-watched genre across the main five PSB channels grouped together, accounting for 19.7% of viewing - a greater share than across total TV. Representing 13.6% of viewing, national/international news programming was the second mostwatched genre on the main five PSB channels. Figure 16: Proportion of viewing by genre across total TV, all individuals 10% 12% 11% 13% 14% 15% 16% 17% 4% 4% 4% 4% 6% 4% 6% 6% 6% 6% 4% 7% 6% 5% 4% 6% 6% 5% 4% 8% 6% 5% 6% 5% 5% 4% 8% 7% 7% 7% 7% 7% 7% 9% 9% 11% 8% 10% 8% 9% 7% 10% 10% 10% 9% 9% 8% 8% 8% 8% 9% 8% 8% 8% 8% 8% 8% 8% 8% 8% 8% 8% 8% 8% 8% 11% 11% 11% 11% 11% 11% 11% 12% 14% 15% 15% 16% 15% 15% 15% 15% All other genres Comedy Childrens UK soaps Drama: other UK drama Source: BARB. All individuals (4+), all day. Network programming based on 4+ area filter. The all other genres category = music: contemporary, news: other, visual & performing arts, religion, music: other, weather, music: classical, education, party political broadcasts, current affairs: other, docs: sci & nat his, current affairs: pol/econ/social, UK films and BARB other /unspecified. See methodology annex for definitions against BARB genres. Broadcast TV can still bring in mass audiences, but the decreasing popularity of soaps is driving its overall decline Broadcast television is the only mass-market audiovisual medium which consistently attract millions of simultaneous viewers. But the size of audiences for the most popular programmes has been falling. In 2017, 64 programmes achieved a consolidated audience of more than 10 million viewers (seven-day consolidated viewing, including +1 channels), compared to 191 in The number of programmes with an audience of over 8 million fell from 634 in 2007 to 201 in Sport Films: other Leisure Interests Natl/intl news Docs: other Entertainment 25 Source: BARB. All individuals (4+), all day. Network. 30

31 Figure 17: TV programmes, by audience size: Source: BARB. All individuals (4+), network. Programme figures include HD and +1 channels where relevant. Looking at these declines by programme genre, we can see that the decreasing popularity of soaps is driving the overall decline. In 2007, 508 episodes of soaps achieved an audience of at least 8 million; in 2017, this figure was 63. This is even clearer when we look at individual episodes that attracted audiences over 10 million; in 2007 there were 172, by 2015, the last year in which such audiences were achieved, there were only four. In 2007 EastEnders, Coronation Street and Emmerdale averaged 8.7 million viewers between them; by 2017 this was down by 1.8 million, to 6.9 million. Apart from 2010, when audiences increased to 8.7 million from 8.0 million the previous year, there has been a steady decline in audience volumes. Entertainment shows have also had quite an impact on the overall numbers of mass audience programmes. In 2009 The X Factor had 17 episodes achieve an average audience of over 13 million and in 2010, 23 episodes. In 2017, however, not a single episode achieved more than 8 million. 31
32 Important national events in 2018 still attract big audiences Unsurprisingly, the royal wedding on 19 May 2018 attracted a huge audience. Across BBC One, ITV, Sky News and BBC News, it achieved a consolidated average audience of 12 million, an 85% share of viewing at that time. BBC One accounted for most of the viewing, gaining 63% share. It was a similar story for 16-34s, with a combined share of 81% across the coverage. Overall, BBC One s coverage averaged 8.9 million and peaked at 13.7 million, while ITV s coverage averaged 2.6 million and peaked at 3.8 million. The combined reach across all the channels was 24.7 million (41% of all individuals), 4 million (28%) of which was 16-34s. Overall numbers were lower than those watching the 2011 royal wedding, in terms of reach; the 2011 wedding achieved 34.2 million (60%) reach (all individuals) and 6.9 million (47%) 16-34s. However, the total share of viewing to the 2018 event was higher than the 82% in The FIFA World Cup games have also been pulling in large audiences, and England s progression has helped drive record viewing. At the time of writing this report (before the semi-finals), England s game against Columbia, on ITV, had achieved the largest audience of the tournament so far with 17.2 million and a 67% share of viewing at that time the largest average audience of any programme since the closing ceremony of the Olympic Games in Source: BARB. All individuals (4+), all day. Network. Reach criteria: 3+ consecutive minutes. HD and +1 channels included where appropriate. 32
33 TV and AV revenues Chapter overview This section looks at broadcast industry revenues over time, including changes in the sources of income, and by sector. It also provides commentary on revenues generated by online TV, including via subscriptions to video-on-demand services. Total broadcast commercial TV revenues declined by 3.5% to 11.1bn The UK commercial broadcasters (i.e. excluding the BBC licence fee and grants to S4C 27 ), generated 11.1bn in revenue during 2017, a decline of 3.5% on 2016 in real terms. However, over the last five years commercial revenues have grown by an average annual rate of 1.4%. The year-on-year decline in commercial revenues was driven by a fall in real terms (i.e. adjusted for inflation) in both net advertising revenues (NAR), down 7.5% year on year to 3.9bn in 2017, and income from pay-tv subscriptions, down 2.7% to 6.4bn in 2017 (both declines are described in further detail below). Revenue from other sources such as TV shopping, sponsorship and interactive services grew by 10.1% in 2017 in real terms to 898m as broadcasters continue to diversify from the traditional income sources of subscriptions and television advertising. 27 BBC income will be covered in the Communications Market Report 33
34 Figure 18: Total broadcast TV industry revenue, by source Source: Ofcom/broadcasters. Note: Figures expressed in real terms and replace previous Ofcom revenue data for TV industry, owing to restatements and improvements in methodologies. Subscription revenue includes Ofcom s estimates of Sky UK (including revenue attributed to NOW TV),Virgin TV, BT TV and TalkTalk TV subscriber revenue as well as, in previous years, that of ESPN and Top Up TV in the UK (Republic of Ireland revenue is excluded). It also excludes revenue generated by broadband and telephony. Other includes TV shopping, sponsorship, interactive (including premium-rate telephony services), programme sales. Totals may not equal the sum of the components due to rounding. Television advertising revenues were down 7.5% in 2017 TV advertising income in 2017 declined by 7.5% in real terms to 3.9bn, with all three categories of broadcaster (commercial PSBs, commercial PSB portfolio channels and non-psbs) seeing a decline since The net advertising revenue of commercial PSBs (which makes up about half of all commercial television advertising revenue), had the largest decline, down 9.3% to 2bn in In previous years commercial PSB broadcasters have been able to offset declines in ad revenue on their main PSB channels against increased revenues for their non-psb portfolio channels. However, this was not the case in 2017, as advertising revenue also declined for the non-psb portfolio channels, falling by 3.1% in real terms to 773m. But overall, television advertising revenues have grown by 0.4% per year on average over the last five years. While cyclical changes in the wider economy are likely to have affected overall television advertising revenues in 2017, further trend data is required to determine whether the decline was also driven by deeper structural change in the market, as online video advertising begins to encroach on traditional broadcast TV NAR. Furthermore, television advertising as a percentage of total display advertising expenditure has been stable over recent years at around 30%, according to WARC WARC is a firm which measures advertising spend. 34
; Commercial PSB portfolio channels include, where relevant, ITV2, ITV3, ITV4, CITV,")
35 Figure 19: TV net advertising revenues, by source Source: Ofcom/broadcasters. Note: Figures expressed are in real terms and replace previous data published by Ofcom. Commercial PSB channels comprise ITV, STV, UTV, ITV Breakfast, Channel 4, and Channel 5 (and their +1 channels); Commercial PSB portfolio channels include, where relevant, ITV2, ITV3, ITV4, CITV, ITVBe, ITV Encore, ITV Breakfast 2, E4, More 4, Film 4, 4Seven, Five USA, 5* and Spike (and their +1 channels). For previous years closed channels have also been included. Sponsorship revenue not included. Totals may not equal the sum of the components due to rounding. ITV Studios has helped ITV reduce its reliance on cyclical advertising revenues The main commercial UK broadcasters are generating record revenues from their production arms as they look to ensure that their businesses do not become too reliant on advertising revenue. ITV has navigated this shift particularly well; it generated more revenue from its non-nar (net advertising revenue) activities ( 1.9bn) than from NAR ( 1.7bn) for the first time in This shift can be mostly attributed to ITV Studios, which increased its revenues by 7% from June 2016 to 2017 on the success of hit UK shows like I m a Celebrity Get Me Out of Here and global formats like Come Dine with Me. In 2017, ITV Studios generated 43% of ITV s 3.66bn total revenue. Pay-TV subscription revenue declined 2.7% in real terms in 2017 The pay-tv platform operators in 2017 (Sky UK, Virgin TV, BT TV and TalkTalk TV) generated well over half (57%) of total commercial broadcast revenues, the same proportion as the previous year. However, the 6.4bn 29 generated by the platform operators in 2017 represented a 2.7% decline in real terms on the previous year, and the first decline following a period of sustained growth. 29 Subscription revenue includes Ofcom s estimates of Sky UK (including revenue attributed to NOW TV), Virgin TV, BT TV and TalkTalk TV subscriber revenue as well as, in previous years, that of ESPN and Top Up TV in the UK (Republic of Ireland revenue is excluded). It also excludes revenue generated by broadband and telephony. 35

36 Figure 20: Total TV industry revenue, by sector Source: Ofcom/broadcasters. Note: Figures are expressed in nominal terms and replace previous Ofcom revenue data for TV industry, owing to restatements and improvements in methodologies. The platform operators are Sky UK, Virgin TV, BT TV and TalkTalk TV as well as, in previous years, ESPN and Top Up TV in the UK (Republic of Ireland revenue is excluded). Sky UK revenue includes subscription revenue attributed to NOW TV. Commercial PSB channels comprise ITV/ITV Breakfast, STV, UTV, Channel 4, Channel 5. Commercial multichannels comprise all multichannels including the commercial PSB portfolio channels. Totals may not equal the sum of the components due to rounding. Broadcaster revenue raised from other sources increased by 10% in 2017 Television revenue raised from sources other than subscription income or advertising revenue increased by 10% in real terms in 2017 to total 898m. 30 Broadcasters revenues generated by programme sales 31 jumped by 116% in 2017 to 116m, as broadcasters look to become less reliant on the more cyclical advertising market and diversify into new revenue streams. Other revenues, which accounts for 28% of revenue in this category (including revenue streams from product placement, rights sales and commissioned productions for third parties) also increased, rising by 1% to 249m. Sponsorship revenues, which make up almost a quarter of revenue in this category, declined by 1% in real terms to 216m in 2017, driven in part by the decline in the wider TV advertising market, as noted above. Following a relatively flat 2014 and 2015, sponsorship revenues have grown by 2% on average per year over the last five years. 30 Excludes S4C grant 31 Programme sales is the revenue raised by the channel from the sale of its programmes to third parties, either content produced in-house or commissioned 36

37 Figure 21: Breakdown of other commercial TV channel revenue Source: Ofcom/broadcasters. Figures are expressed in real terms. TV shopping represents aggregate operating margin of products sold via television. Totals may not equal the sum of the components due to rounding. Owing to the nature of these revenue components, annual changes may be a function of a higher number of broadcaster returns being made by the time of writing, rather than material changes in the contributions that these revenue components are making to total industry income. Online audiovisual revenues grew by 25% in 2017 Online audiovisual revenues generated by subscriptions, online advertising, rental and retail grew by 25% year on year in real terms, to reach 2.26bn in Online advertiser-funded video, including services such as YouTube, the ITV Hub, All4 and My5, generated over 1bn for the first time in 2017, up 25% on the previous year. According to the IAB UK, just over two-thirds (69%) of online video advertising 32 spend is generated by non-broadcaster VoD services, while the remaining 31% is from broadcaster VoD services. Subscription revenue, from services such as Netflix and Amazon Prime Video, was the second-largest contributor to online audiovisual revenue in 2017, at 895m, and also represented the largest annual growth, 35% in real terms. Digital rental grew by 4% to reach 221m in Video ads played before, during or after the video content (known as pre-post roll). 37

 increased 2.5% year on year to reach a record high of 1.")

38 Figure 22: Online audiovisual revenues: Source: Ampere Analysis/ Zenith Media. Ad-funded video includes catch-up services, YouTube and other adfunded video spend. OTT Subscription includes Netflix, Amazon Prime Video, DisneyLife and NOW TV. Digital rental includes one-off pay-per-view of films and video but excludes sport. Digital retail is based on British Association of Screen Entertainment spend figures exclusive of VAT and covers download to own purchases. All figures are in real terms (2017 prices). UK cinema admissions have held up against competition from SVoD In the UK, box office revenues (excluding advertising and confectionary sales) increased 2.5% year on year to reach a record high of 1.3bn in Cinema admissions have remained relatively unchanged at around 170 million since 2002, suggesting that the cinema viewing experience is still very much something that UK audiences value and continue to support, despite the growth in SVoD. The story is different in the US, where cinemas ended 2017 with 1.23 billion tickets sold, down by 6.2% since Despite a strong Q driven by Star Wars: The Last Jedi, this was the lowest level of admissions since the early 1990s. In fact, since the 2002 peak, ticket sales in the US have declined by 341 million (22%). The decline in ticket sales in the US did not, however, stifle box office revenues, which topped $11bn ( 8.6bn) in 2017 for only the third time - held up by increased ticket prices (up over 50% since 2002). The rise of streaming services has been seen as a contributing factor to lower ticket sales in the US, where online video revenues (subscriptions, rental and download-to-own combined) have already eclipsed box office revenues (see chart below). 38

39 TV and AV output and spend Chapter overview This chapter examines output and spend on programming by UK broadcasters. It looks at spend and hours for first-run UK-originated programming and, where possible, breaks this down by channel and genre. The chapter then goes on to discuss the high-level of spend by the SVoD providers on originated content and the impact of this on commissioning for the PSBs. Total network programme spend across all broadcasters increased 0.5%, driven by the increased cost of sports rights Spend 33 in key genres 34 by channels broadcasting in the UK increased slightly, by 0.5% in real terms, to 7.5bn in But this growth was exclusively driven by the 10% rise in spend on sports channels in the multichannel sector; all other categories had year-on-year declines. The increase in spend by sports channels was driven predominantly by a rise in the cost of sports rights, as discussed later in this chapter. Looking at the PSB channels, the BBC portfolio channels had the biggest real-term decrease in spend by proportion (19%), although this was mainly because BBC Three moved to an online-only channel in BBC One had the next-largest real-term decline in spend (12%) bringing its 2017 spend on network programming almost level with ITV s. The decrease in overall BBC spend was due in part to lower licence fee revenues. Between 2010 and 2016 the licence fee was frozen, and as the economy grew during this period, the revenue generated from the licence fee fell in real terms. The licence fee is currently set to rise in line with inflation until Spend figures here do not represent the entire cost of programme production in the UK as they do not include third-party funding or the full cost of co-productions with overseas broadcasters. 34 Key genres comprise children s, entertainment, factual, leisure, films, music, news, sport 39
.")
40 Figure 23: Spend on network TV programmes Source: Ofcom/broadcasters. Note: Figures expressed in real terms. Does not include spend on nations and regions output. BBC portfolio channels includes BBC Three, BBC Four, BBC News, BBC Parliament, CBBC and CBeebies (but not BBC HD). Commercial PSB portfolios include ITV2, ITV3, ITV4, CITV, ITVBe, ITV Encore, E4, More4, Film4, 5*, 5USA and Spike. Other multichannels comprises seven key genres (children s, entertainment, factual, leisure, films, music, news). Programme spend comprises in-house productions, commissions from independents, acquired programmes and repeats (originations and acquisitions). Spend on UK-originated network content by the PSBs has fallen 28% in real terms since 2004 The combined spend on first-run UK-originated network content by the main five PSBs and BBC portfolio channels (for programming across the whole day) totalled 2.5bn in 2017, which represents a 28% decline (or just over 1bn) in real terms from the 2004 peak of 3.4bn. There are, however, several changes across the television industry that have contributed to reduce costs for new productions, including an increase in funding from third parties, as illustrated in Figure However, the vast majority of network content spend by the PSBs continues to be on UK-originated content PSB spend on first-run UK-originated content is influenced by cyclical sporting events. As 2016 was a big year for sport, including the Olympic and Paralympic games and the UEFA European football tournament, spend by the PSB channels has been compared in the following section to 2015, the most recent comparable year. The BBC portfolio channels have had the biggest real-terms proportional decline since 2015, with a collective 31% decrease to 137m, partly because 2017 was the first full year since BBC Three moved to online-only. Of the main five PSB channels, ITV had the largest decline in spend on first-run UK originations, down 10% since 2015 in real terms to 728m, while BBC One and BBC Two declined by 35 Other factors include a change in genre mix, gains in efficiency, and cheaper input costs compared with higher inflation. 40
41 2% (to 730m) and 3% ( 292m) respectively. Collectively therefore, spend on the BBC channels and ITV has declined by 8% ( 166m) since 2015 in real terms. Channel 5 has gradually increased its first-run UK-originated spend since its acquisition by Viacom in 2014, with spend increasing by 27% in real terms to 133m over this period its highest annual spend in real terms since Channel 4 also spent more in 2017, increasing its spend by 6% in real terms from 2015 to 440m. Despite the decline in absolute terms, spend on network first-run network programming as a proportion of total network spend (i.e. including acquired and repeated programmes) for the PSBs and BBC portfolio channels has remained broadly consistent, at 89% in 2017, compared to 89% in 2016 and 86% in Figure 24: PSB network spend on first-run UK originations, by channel ( m) 2,733 2, ,022 2, , ,308 3,365 3,430 3,373 3, , , ,796 2, ,037 1,048 1,025 1,001 1, ,711 2, ,533 2,607 2,585 2, , , , BBC One BBC Two ITV Channel 4 Channel 5 BBC portfolio Source: Ofcom/broadcasters. Note: figures are expressed in real terms. BBC portfolio figures include BBC Three, BBC Four, CBBC, CBeebies, BBC News and BBC Parliament. Figures do not include S4C, BBC Alba or BBC HD and nations /regions programming. Spend on first run UK-originated content, including nations and regions programming, has declined 20% ( 699m) since 2008 As noted above, the combined spend on first-run UK-originated network content by the main five PSBs and BBC portfolio channels totalled 2.5bn in The figure increases by a further 275m when PSB programming made specifically for the nations and regions by the BBC, ITV, STV and UTV is included (see Figure 24 and individual nations reports for further detail and breakdown). This represents a 20% decline since 2008 in real terms. In addition, S4C spent 62.9m on first-run Welsh language commissions broadcast in , while the Gaelic language service BBC Alba spent 15.4m on first-run UK-originated programming broadcast in Further detail on both can be found in the Wales and Scotland reports respectively. 41
42 Figure 25: PSB spend on first-run UK originations including nations and regions, by channel ( m 3, ,102 3, ,007 3, , ,900 2, , , BBC One BBC Two ITV Channel 4 Channel 5 BBC Portfolio Nations/Regions Source: Ofcom/broadcasters. Note: figures are expressed in real terms. BBC portfolio figures include BBC Three, BBC Four, CBBC, CBeebies, BBC News and BBC Parliament. Nations and regions figures include first-run UKoriginated spend on non-network content by ITV, STV, UTV and the BBC across the national and regional variants of BBC One and BBC Two. They do not include spend by S4C or on BBC Alba. Contributions from third parties is offsetting some of the decline in spend by the PSBs As Figure 25 below illustrates, contributions to the cost of production from third parties, including as part of a co-production arrangement, deficit funding from production companies and tax credits, is playing an increasingly important role in funding PSB original content, and has to some extent mitigated the decline in first-run originated spend among the PSBs themselves. The combined third-party funding for first-run UK-originated content across the BBC, Channel 4 and Channel 5 has more than doubled over the last ten years, from 147m in 2008 to 338m in (with a 19% increase from 2016 to 2017 alone). When third-party contributions are taken into consideration, overall spend on first-run originated content for these channels has declined only marginally (0.9%) since 2015 (the most recent comparable year, as 2016 was a big year for sport). 36 We do not have comparable data for ITV or the ITV Breakfast licence. 42


43 Figure 26: Network spend by BBC, Channel 4 and Channel 5 on first-run UK originations and thirdparty funding ( m) Source: Ofcom/broadcasters. Note: figures are expressed in real terms. Figures include: BBC One, BBC Two, BBC Three, BBC Four, CBBC, CBeebies, BBC News, BBC Parliament, Channel 4 and Channel 5. The analysis does not include ITV, ITV Breakfast, S4C, BBC Alba or BBC HD. Figures exclude nations /regions programming. Furthermore, while the bulk of PSB spend is on output for the PSB channels, the commercial PSB portfolio channels such as ITV2, More4 and 5Spike and the PSB online services (BBC iplayer, ITV Hub, All4 and My5) provide additional first-run UK originations to viewers. Spend on first-run UK originated content across these services has been increasing in recent years and stood at 156m in Much of the decline in UK-originated spend is on daytime programming Decreases in first-run spend on the daytime schedule has driven the overall decline in first-run spend in recent years. There was an 11% decline in real terms from to 585m in daytime, which represents a 38% real-terms decline from the 2004 peak of 941m. All channels except Channel 4 saw decreases since 2015, with BBC Two having the biggest real-terms proportional decline (down 17% to 48m). 37 As 2016 was a big year for sport, including the Olympic and Paralympic games and the UEFA European football tournament, spend has been compared to 2015, the most recent comparable year. 43
44 Figure 27: PSB network spend on first-run UK originations during daytime, by channel ( m) BBC1 BBC2 ITV C4 C5 BBC portfolio Source: Ofcom/broadcasters. Note: figures are expressed in real terms. BBC portfolio figures include BBC Three, BBC Four, CBBC, CBeebies, BBC News and BBC Parliament. Figures do not include S4C, BBC Alba or BBC HD and nations /regions programming. Spend on content broadcast during peak time across the PSB channels saw a slight drop of 5% from 2015 in real terms to 1.6bn. ITV reported a decrease in real terms of 9% to 542m, and BBC One saw a small real-terms decrease of 3% to 416m. Meanwhile, Channel 4 and Channel 5 reported real-terms increases in peak-time spend since 2015, up 4% to 300m and up 11% to 95m respectively. For both channels, real-terms peak-time spend was higher in 2017 than for the previous 20 years. Figure 28: PSB network spend on first-run UK originations during peak hours, by channel ( m) 1,561 1,582 1, , ,856 1,911 1,946 1,928 1,948 1, , ,729 1, ,688 1, ,659 1,657 1,687 1, , BBC1 BBC2 ITV C4 C5 BBC portfolio Source: Ofcom/broadcasters. Note: figures are expressed in real terms. BBC portfolio figures include BBC Three, BBC Four, CBBC, CBeebies, BBC News and BBC Parliament. Figures do not include S4C, BBC Alba or BBC HD and nations /regions programming. Drama and children s programming saw the largest declines in new UK spend in 2017 Looking at spend on individual genres by the PSBs combined, the most notable declines in first-run UK originated spend (excluding sport) in 2017 were for children s, comedy and drama programmes. Spend on children s programming continued the decline seen in recent years, falling by a further 44
45 18% in real terms to 70m in Spend on comedy was down by 5% in real terms since 2016, to 90m, while spend on first-run UK-originated drama declined by 7% to 307m. However, these figures do not take into consideration contributions to the cost of production from third parties, such as overseas broadcasters and independent production companies, under coproduction arrangements. Some genres saw small increases; entertainment rose 4% in real terms from 2016 to 411m. Figure 29: PSB network spend on first-run UK originations, by genre ( m) 3,308 3,365 3,430 3, ,022 2,881 2, , ,254 3, , ,796 2, ,711 2, ,533 2,607 2,585 2, , News and current affairs Arts and classical music Religion and ethics Education Factual Drama Soaps Entertainment Comedy Feature films Sports Children's Source: Ofcom/broadcasters. Note: figures are expressed in real terms. Figures include PSB services: BBC One, BBC Two, BBC Three, BBC Four, CBBC, CBeebies, BBC News, BBC Parliament, ITV, ITV Breakfast, Channel 4 and Channel 5. The analysis does not include S4C, BBC Alba or BBC HD. Figures exclude nations /regions programming. Before 2006, spend on soaps was included in drama and spend on comedy was included in entertainment. Increased spend in multichannel sector driven by inflation in sports rights The multichannel sector consists of all television channels, other than the PSB main and portfolio channels, that broadcast to the UK and are licensed by Ofcom. In 2017, the multichannel sector spent a total of 4.8bn in eight key genres 39, an increase of 6% in real terms since 2016, although this was driven by an increase in spend on sports programming. Programming for sports channels accounted for more than two-thirds (68%) of total content spend across the multichannel sector in the eight key genres shown in the figure below, up by 10% since Sky and BT were the biggest contributors to the increase in spend on sport, with rights to broadcast football matches making up the bulk of spend. In 2017, BT secured the rights to broadcast the UEFA Champions League and UEFA Europa League football matches for a combined total of 1.2bn, and Sky won the rights to broadcast the English Football League for 600m and the inaugural UEFA Nations League matches for 200m (combined package cost with ITV). Sports channels accounted for 43% of spend on UK programming overall, up from 40% in Ofcom is publishing a report into the UK provision of children s television content on 24 July Excludes spend in other genres such as shopping, religious, games and adult programming 45
46 Excluding sports channels, spend for the remaining key genres had a real-terms decline of 2% in Figure 30: Multichannel content spend in key genres 2,909m 266m 718m 1,642m 3,209m 300m 761m 1,890m 3,624m 302m 809m 2,252m 3,857m 320m 867m 2,404m 4,517m 349m 928m 2,973m 4,789m 332m 930m 3,269m Leisure Music Kids News Factual Movies Entertainment Sport Source: Ofcom/broadcasters. Note: Spend expressed in real terms. Excludes BBC portfolio channels but includes commercial PSB portfolio channels. The proportion of spend on first-run UK originations by the PSB channels that went to external producers was greater in 2017 than in 2012 In 2017, 50% of spend across all genres of first-run UK-originated content by the PSB channels (excluding spending for nations and regions programming) was on external commissions, compared to 45% in Excluding sport, which accounted for a substantial sum in 2012 with coverage of the London Olympics, the proportion spent on external commissions was stable at 56% in both 2012 and Of the 2.5bn total, 2.0bn can be attributed to five genres: factual, entertainment, sport, news and current affairs and drama. Out of these five genres, factual has had the largest increase in proportion of spend going to external producers over the last five years, rising from 64% in 2012 to 72% in Entertainment and comedy are two genres where a higher proportion of content is made externally, although both have increased their in-house production since

47 Figure 31: Relative share of spend on first-run UK originated content: in-house vs. external production Source: Ofcom/broadcasters. Note: Figures are expressed in real terms. Includes spend by the five main PSB channels and BBC portfolio channels on first-run originated content broadcast all day and excludes nations /regions output. The number of first-run hours broadcast by the PSB channels declined slightly between 2015 and 2017 While first-run spend has declined steeply since 2004 in real terms (see figure 31), the number of first-run hours broadcast by the PSBs combined has remained relatively stable since 2010 at around 32,000 hours. In 2017, the PSB channels broadcast 31,770 hours of first-run UK originations, a drop of 204 hours from 2015, the most recent comparable year due to the impact of major sporting events. However, 2017 was the first full year in which BBC Three was available online only, and the BBC portfolio channels (which include BBC Three) had a decline of 502 hours from First-run UK-originated hours of children s network programming declined by 15% from 2016 to 575 hours, 40 while drama had a 10% year-on-year decline to 399 hours, and comedy was down by 9% year on year to 171 hours. First-run UK originations accounted for 44% of all hours of network content broadcast on the PSB channels in 2017, compared to 46% in For a further breakdown by genre, see the data visualisation tool on our website. 47
48 Figure 32: PSB first-run UK-originated network hours, by channel 29,405 34,922 34,616 33,829 36,387 37,006 35,538 34,689 35,173 35,045 33,981 32,691 31,875 32,167 32,354 32,126 32,491 31,974 32,988 31,770 8,137 13,569 12,908 12,001 14,739 14,990 14,314 14,013 13,619 12,856 12,848 12,645 12,894 13,133 13,304 13,309 13,284 12,661 12,878 12,159 3,714 3,660 3,748 3,862 3,828 3,671 3,597 3,388 3,845 3,684 3,343 3,871 4,080 3,971 3,824 4,160 3,599 3,459 3,388 4,304 4,472 4,598 4,917 4,935 5,245 5,248 4,892 5,474 6,203 5,404 5,228 5,244 5,235 5,133 5,108 4,911 5,056 5,112 5,100 3,895 3,317 3,171 2,945 3,222 3,239 3,335 3,542 3,669 3,536 3,665 3,660 3,793 3,414 3,457 2,800 2,963 3,190 3,140 3,184 6,012 6,033 6,111 6,133 5,839 5,701 5,445 5,395 5,178 5,459 5,261 5,423 5,515 5,455 5,561 6,397 6,666 6,505 6,718 6,542 Source: Ofcom/broadcasters. Note: BBC portfolio figures include BBC Three, BBC Four, CBBC, CBeebies, BBC News and BBC Parliament. Figures do not include S4C, BBC Alba or BBC HD and nations /regions programming. First-run originations/acquisitions made up 15% of all hours broadcast in key genres on the non-psb channels in 2017 The multichannel sector consists of all the television channels, other than the PSB main and portfolio channels, that broadcast to the UK and are licensed by Ofcom. The figure below shows the number of hours broadcast in key genres in Of the 1.7 million hours broadcast by these channels in 2017, 15% were first-run originations or acquisitions, down 1pp compared to The highest proportions of first-run originations were on news (50%) and sport (43%) channels; by their nature, both genres broadcast significant quantities of live content. The figure below shows the number of hours broadcast in key genres in Figure 33: Total and first-run originated/acquired hours of output in key genres in the multichannel sector: ,307 3,609 2,796 1,419 1,841 1,594 1,571 1,702 1,773 2,061 2,064 3,194 2,939 3,010 3,089 3,305 2,941 2,965 2,789 3,079 2, Proportion of hours 100% 80% 60% 40% 20% 202, , ,246 72, , , ,497 BBC One BBC Two ITV Channel 4 Channel 5 BBC Portfolio 1,682, ,531 3,984 4, ,328 8,004 2,215 5,382 13% Entertainment 0% Total Hours First-run hours Source: Ofcom/broadcasters. Note: Broadcast hours exclude Sky Box Office and barker channels which promote TV content. First-run hours include first-run in-house, commissioned and acquired content. 98,947 70,232 59,860 Proportion of hours that were first-run 15% All 2% 2% 43% 50% 11% 2% 3% Music Movies Sport News Leisure Children's Factual 48
49 The commercial PSB portfolio channels and BBC iplayer contributed a further 2,483 hours of originated content in 2017 Through the commercial PSB portfolio channels and the BBC iplayer, there were an additional 2,483 hours of first-run UK originations available to viewers in The vast majority of these hours (84%) were sport, entertainment and music content. A further 35 hours were available on the ITV Hub, All4 and My5. Figure 34: Commercial PSB portfolio/bbc iplayer first-run UK originations: ,448 Sport Entertianment & Music Factual Children's Drama Current Affairs Education News Arts & Classical Music Source: Ofcom/broadcasters. The commercial PSB portfolio channels are CITV, ITV2, ITV3, ITV4, ITVBe, ITV Encore, 4Seven, E4, Film4, More4, 5USA, 5* and 5Spike. BBC iplayer figures include content that was made available exclusively online and not subsequently broadcast on a BBC TV channel in Netflix and Amazon continue to invest heavily in original content, although little is UK-made In 2018 Netflix is planning to spend 5bn 41 on content globally, while estimates suggest that Amazon Prime Video will spend approximately 3bn on content, compared to the combined network programme spend of 2.8bn for the PSBs in But the majority of SVoD spend is for content to play out in multiple countries over several years. Apple and Facebook are also each currently gearing up to offer original content: each has said that it will spend approximately 750m in 2018 on original content. Only a small proportion of SVoD spend is on programmes made in the UK. In March 2018, Netflix had 753 originals, of which 35 were UK-made, with the most notable production being The Crown, whereas Amazon only had five UK-made originals out of 174 original titles 43 Consequently, about 9% 41 Netflix Inc. Q earnings call 42 Ofcom PSB broadcaster returns Source: Ampere Analysis Number of Distinct Titles March 2018, originals have been classified where the primary parent production company is the SVoD platform on which the content is available in the case of NOW TV this will be Sky. 49
50 of Netflix s total catalogue hours were UK-produced original content, compared to 8% for Amazon Prime Video. Companies like Netflix and Amazon with large production budgets present challenges to the UK PSBs as they compete for viewers of high-end TV drama. However, they have also created opportunities for co-production partnerships, as outlined below. PSB and SVoD co-productions: two models The PSB holds exclusive UK broadcast rights. This model allows the PSB to exclusively show the production in the UK, with the SVoD provider showing it to the rest of the world. The recent eightpart drama The End of the F***ing World was produced using this model, following previous C4/Netflix success with Chewing Gum. Netflix is particularly keen on this model and has similar coproductions with the BBC, such as the upcoming Watership Down and 2018 s Troy: Fall of a City. For the PSB, this provides valuable and sometimes necessary additional funding. However, it may only be available to productions with global appeal, as opposed to content aimed mainly at UK audiences. An SVoD service can tap into the world-renowned talent of UK broadcasters and produce a high quality original, although this may have less impact on increasing its UK subscriber base. The PSB holds secondary UK broadcast rights. In this model, the PSB is a junior partner in the relationship, with the SVoD provider initially showing the production in all its territories, including the UK. The BBC and Amazon have entered into this relationship with the upcoming Good Omens, a six-part drama that will launch exclusively on Amazon in 2019 before being broadcast on BBC Two. The BBC and Amazon agreed a similar relationship for the final three series of Ripper Street, which were broadcast on the BBC over six months after first being made available on Amazon. The PSBs can continue showing high quality programming at a fraction of the cost of formal co-production, although its impact may be lessened if audiences have seen it elsewhere. For the SVoD service, the quality of content will be key to determining whether subscribers sign up to see it right away or wait until it is available on free-to-air TV. SVoD originations make up a third of all SVoD viewing Three-quarters (75%) of all SVoD viewing is spent watching TV programmes, with the remaining 25% spent watching films. For TV programmes, drama is the most popular genre, accounting for 70% of SVoD TV programme viewing. Despite making up less than 10% of all SVoD catalogue titles, SVoD originations accounted for more than a third (34%) of total minutes viewed across all SVoD services in Q (up 8pp since Q4 2016). Netflix TV original programming accounted for 42% of all the Netflix TV programme viewing time, with the remaining 58% spent on Netflix's acquired programmes. The top ten titles in Q were dominated by Netflix; four in ten shows were Netflix originals. But only five of the top 20 shows originated in the UK. Peaky Blinders was the only PSB-commissioned programme to make the top 20, having been in 12 th position in Q and rising to the top five in Q Source: GfK SVoD Programme data Q and Q
51 Figure 35: Top 20 SVoD programmes in the UK, Q Source: GfK programme data, Q January March. Notes: All users of Netflix, Amazon Prime Video and NOW TV at least once a fortnight. Rankings are based on total streams. UK-produced The Crown and The Grand Tour are among the most-watched programmes on SVoD 45 In 2017, UK-produced Netflix s The Crown and Amazon s The Grand Tour released their second seasons. The Crown achieved an average weekly reach of almost 2 million viewers in December 2017 while The Grand Tour achieved almost 1.5 million viewers. The Crown had a 77% increase in its reach for season 2 compared to season 1 in the first month of release, whereas The Grand Tour dipped slightly. In December 2016 The Grand Tour was viewed by 29% of all Amazon Prime users, while 22% of Amazon Prime users viewed the second season in December Seven in ten viewers of The Grand Tour are men whereas The Crown has a more balanced gender profile. Compared with other key Netflix titles, The Crown attracts an older audience (20% of its viewers are aged 55+ compared to 10% of viewers of Stranger Things, Netflix s second most viewed original in the UK). Millennials account for more than 50% of the audience for The Grand Tour. However, The Grand Tour may have been more successful in driving up subscriptions. Among those who signed up to Amazon to watch a specific show in December 2017 (13% of subscribers), half said that it was to watch The Grand Tour. At 8%, fewer Netflix subscribers stated The Crown as a reason to sign up in December Source: GfK SVoD tracker mini case studies
52 Satisfaction with and perceptions of TV Chapter overview This chapter examines TV audiences overall satisfaction with PSB channels, and their opinions on the importance and delivery of a range of purposes and characteristics 46 ; data are drawn from Ofcom s 2017 PSB tracker survey 47. The chapter then considers audience attitudes towards broadcasting standards, using data from Ofcom s 2017 cross-platform media tracker survey. The public service broadcasters are those providing Channel 3 services, Channel 4, Channel 5, S4C and the BBC. While all BBC public service television channels are PSB channels, only the main channels of each of the other public service broadcasters have this status. Three-quarters of adults are satisfied with PSB channels Audience satisfaction with PSB is broadly in line with recent years. Overall, three-quarters (75%) of regular or occasional viewers of any PSB channel claimed to be either very, or quite satisfied with PSB broadcasting. This compares with 77% in 2016 and 72% in Almost one in five (18%) were neither satisfied nor dissatisfied, while 7% claimed to be either very or quite dissatisfied. Of the three-quarters (75%) who were satisfied with PSB broadcasting, 22% said they were very satisfied and 53% said they were quite satisfied. The very satisfied figure is comparable to 23% in 2016 and 21% in Women (78%) were significantly 48 more satisfied than men (71%), and those living in London (80%) were significantly more satisfied than those living in Scotland (71%), the North West (69%) and Northern Ireland (69%). There were no significant differences by age, socio-economic group or 46 The statutory purposes and objectives of public service broadcasting are set out in section 264 of the Communications Act In Ofcom s first PSB Review, we built on these, following extensive research and consultation, creating a framework of PSB purposes and characteristics 47 For details on the methodology and questionnaire, please refer to the PSB tracker technical report on Ofcom s website 48 Throughout the Satisfaction with and perceptions of TV chapter, significantly has only been used to highlight any increase or decrease in scores that show statistically significant differences at the 95% confidence level for results compared within the current year, and at the 99% confidence level for results compared between years. For further details, please refer to the PSB tracker technical report on Ofcom s website 52
53 ethnicity. Despite watching less broadcast TV (see Figure 9 in TV and AV Consumption chapter), satisfaction among 16-34s who watch PSB channels has remained constant since 2016 at 76%, following an increase in 2015 from 69%. News programmes that are trustworthy remain the most important Figure 36 shows the PSB Purposes from 2015 to 2017 in terms of both importance and delivery. As in 2016, the most important purpose is considered to be purpose 1: Informing our understanding of the world and the most important individual statement is Its news programmes are trustworthy (84%). This is arguably becoming more important with the prevalence of fake news, particularly on social media sites; for example, 56% of year-olds claim to use social media sites, such as Facebook, Twitter, Snapchat and YouTube when finding out about news/news updates, which is second only to television (64%). 49 Regional news is also considered to be important, at 79% for PSB channels. The statement that the fewest perceive to be important relates to purpose 3: It shows high-quality soaps/dramas made in the UK (67%). This may reflect the wide choice of high-end drama often non-uk produced, available on SVoD services such as Netflix and Amazon (see Output and Spend chapter for further detail on SVoD investment in original content). 49 For further details, please refer to Children s and Parents Media Use and Attitudes 2017 on Ofcom s website data/assets/pdf_file/0020/108182/children-parents-media-use-attitudes pdf - Page
?")
54 Figure 36: Importance and delivery of PSB purposes: Source: Ofcom PSB tracker Q16 How would you rate ALL the following channels combined on this statement (on a scale of 1 to 10 where 10 is the highest score and 1 the lowest)? Q17 How important do you think it is, in general that all those TV channels combined do this on a scale of 1 to 10, where 10 means extremely important and 1 is not at all important? Summary % of respondents rating importance/delivery 7-10 out of 10. Base for importance: All (3147). Base for delivery: All respondents who watch any PSB channels regularly or occasionally (3098). PSB programmes helping me to understand what s going on in the world today is rated highest by audiences Audiences ratings of the delivery of PSB purposes are also broadly similar to in previous years. However, as with the ratings for importance, audience perceptions about delivery have declined slightly for most statements. The highest ratings for delivery related to purpose 1. Its programmes help me understand what is going on in the world today (72%) received the highest score across all the statements, as it did in 2016 and
55 As in previous years, the lowest-scoring statement for delivery was It portrays my region/scotland/northern Ireland/Wales fairly to the rest of the UK, with less than three in five rating this highly (56%). Figure 37 shows the findings for each of the PSB characteristics, in terms of both importance and delivery from 2015 to Showing well-made high-quality programmes is still perceived to be most important characteristic (84%) and also in terms of delivery (78%). Distinctiveness is still perceived to be the least important characteristic (70%) but has become more important over the past two years (from 63% in 2015 and 66% in 2016). Figure 37: Importance and delivery of PSB characteristics: Characteristic Statement Metric High quality It shows well-made high-quality programmes Importance 85% 87% 84% Delivery 74% 78% 78% Challenging It shows programmes that make me stop and think Importance 69% 74% 75% Original Innovative It shows new programmes made in the UK It shows programmes with new ideas and different approaches Importance 79% 80% 78% Delivery 65% 71% 69% Importance 74% 76% 77% Delivery 61% 65% 66% Distinctiveness The style of programmes is different to what I'd expect to see on other channels Importance 63% 66% 70% Delivery 52% 59% 61% Source: Ofcom PSB tracker Q16 How would you rate ALL the following channels combined on this statement (on a scale of 1 to 10 where 10 is the highest score and 1 the lowest)? Q17 How important do you think it is, in general that all those TV channels combined do this on a scale of 1 to 10, where 10 means extremely important and 1 is not at all important? Summary % of respondents rating importance/delivery 7-10 out of 10. Base for importance: All (3147). Base for delivery: All respondents who watch any PSB channels regularly or occasionally (3098). Portraying my region/nation fairly to the rest of the UK had the lowest delivery score for four of the PSB channels Figure 38 shows the highest and lowest delivery purpose or characteristic score for each PSB channel. With the exception of BBC Three 50, for all channels the highest delivery score was for the statement shows well-made, high-quality programmes. BBC Two also received the highest score for It shows interesting programmes about history, sciences or the arts (83%), while BBC Three s highest score was for shows different cultures within UK (69%). Portraying my region/nation fairly to the rest of the UK was the lowest delivery score for four of the PSB channels; BBC Two, BBC Three, Channel 4 and Channel 5. BBC One s lowest score was for the style of programmes is different to what I d expect to see on other channels (57%), while ITV s lowest score was for It shows interesting programmes about history, sciences or the arts (48%) was the first full year in which BBC Three was an online-only channel. 55
56 Figure 38: Highest and lowest delivery purpose or characteristic for the PSB channels Channel Highest delivery score Lowest delivery score Shows well-made, high-quality programmes (83%) Shows well-made, high-quality programmes & It shows interesting programmes about history, science or the arts (83%) Shows different kinds of cultures within UK (69%) Shows well-made, high-quality programmes (74%) Shows well-made, high-quality programmes (82%) Shows well-made, high-quality programmes (78%) Shows well-made, high-quality programmes (69%) The style of programmes is different to what I d expect to see on other channels (57%) It portrays my region/nation fairly to the rest of UK (47%) It portrays my region/nation fairly to the rest of UK (49%) It shows high-quality comedy made in the UK (37%) It shows interesting programmes about history, science or the arts (48%) It portrays my region/nation fairly to the rest of UK (39%) It portrays my region/nation fairly to the rest of UK (39%) Source: Ofcom PSB tracker Q15 How would you rate each channel individually on this statement, on a scale of 1 to 10 where 10 is the highest score and 1 the lowest? Summary % of respondents rating delivery 7-10 out of 10. Base: Self-reported regular viewers of BBC One (2207), BBC Two (1030), BBC Three (200), BBC Four (389), ITV (1884), Channel 4 (1232) and Channel 5 (867). There are differences by nation in delivery of regional news BBC One s Delivery of nations/regional news remained high across the nations, although there were differences by nation. Regular viewers in Northern Ireland (79%) and Scotland (78%) were more positive about BBC One s delivery than were those in England (75%) and in Wales (70%). Comparatively, ITV/STV/ITV Wales/UTV s delivery of nations/regional news ranged from 70% to 85%. As with BBC One s delivery, regular viewers in Scotland (85%) and Northern Ireland (80%) were more positive about STV and UTV s delivery of news programmes than were viewers of ITV in England (74%) and Wales (70%). Children s PSB programming rated highly for importance and delivery More than eight in ten (83%) parents/carers of children who regularly watch children s PSB channels rated the provision of PSB children s programming as important. A similar proportion (81%) considered that PSB channels deliver on providing a wide range of high-quality, UK-made programmes for children. Ratings for both importance and delivery were slightly lower than in 2016 (86% and 85% respectively). 56
57 Providing catch-up services is still important Three-quarters of respondents (75%) felt it was important that broadcasters provide catch-up services that allow viewers to watch previously broadcast programmes. This is comparable to 2016 (76%). Two-thirds (66%) felt that it was important that the BBC provides a website with high quality content that you can trust while 54% of respondents felt it was important that Channel 4 did the same. There was a high level of satisfaction with PSB online sites; 43% of respondents claimed to have used bbc.co.uk in the last month, and 87% of them claimed to be satisfied. Eleven per cent of respondents said they had used channel4.com in the last month, with 78% saying they were satisfied. The perceived quality of TV programmes has improved in the past year One in five (21%) television viewers feel that TV programmes have improved over the past year, up from 14% in Just over half (54%) say that programmes have remained the same and 22% say they have got worse. The increase in the proportion of viewers who feel that TV programmes have improved may be due in part to the increased choice now available to audiences. Video-on-demand (VoD) services from the major broadcasters, as well as Netflix, Amazon and NOW TV, have enabled consumers to watch more of the content they like (and less of the content they don t like), at a time convenient to them and via a range of different devices. This is reflected in the fact that among those television viewers who use VoD services, 24% felt TV programmes had improved over the past year, compared to 13% among those who said they didn t use VoD. However, this increase should be treated with caution due to changes in the survey methodology in 2017; further data is therefore required to see if this increase becomes an established trend. 57
.")
58 Figure 39: Attitudes towards TV programme standards Source: Ofcom cross-platform media tracker QB1 Do you feel that over the past year television programmes have improved, got worse or stayed about the same? Base: All with any TV sets (2,313). NB Base prior to 2014: All with TV but excluding those never watching. Significance testing shows any difference between 2016 and Dashed line to show where survey method changed. Older viewers are more likely to have seen something offensive on TV One of Ofcom s duties under The Communications Act 2003 is to ensure that people who watch television and listen to the radio are provided with appropriate protection from harmful or offensive material. The incidence of people finding something offensive on television has remained stable at 19% year on year, although over-64s are significantly more likely than all adults to say they have seen something offensive (28% vs. 19%). 58
. Prompted, single code.")

59 Figure 40: Overall % of those with a TV who have been offended by something on TV, by age Source: Ofcom cross-platform media tracker QF1 In the last 12 months, have you personally found anything on television to be offensive? Base: All with any TV sets (as indicated on chart). Prompted, single code. Significance testing shows any difference between 2016 and 2017, between any age group and all adults in 2017, between socio-economic groups, by gender and between parents and non-parents in Offensive language, sex, violence and discrimination cause most offence Offensive language, sex/sexual content, discrimination and violence are cited as causing the most offence by more than a third of respondents. This is followed by nakedness and anti-social behaviour, both mentioned by almost a quarter of respondents. Figure 41: Type of material on TV which offended: 2017 Source: Ofcom cross-platform media tracker QF2 What kind of things offended you? Base: All who said they d seen something offensive in the last 12 months (19% of adults with any TV sets) (435). CAPI unprompted/online prompted, multicode. Top reasons charted. (over 5%). 59
60 A third feel there is too much violence and swearing on TV Although a third of adults aged 16+ feel there is too much violence (34%) and too much swearing (33%) on TV, this has declined over time (from 43% and 40% in 2014 respectively). Adults aged 65+ are more likely to feel that there is too much of both. Around a quarter (26%) feel there is too much sex (down from 28% in 2014). Figure 42: Opinion on the amount of sex/ violence/ swearing on TV: % 7% 9% 4% 4% 4% The proportion who feel there is too much violence has declined steadily 55% over time 56% The proportion who feel there is too much swearing has declined over time and is consistent with % The proportion who feel there is too much sex has increased from 2016 but is generally consistent over time Don't know Too little The proportion who feel there is too much violence rises with increasing age and is higher among females than males 34% and non-parents than parents 33% The proportion who feel there is too much swearing rises with increasing age and is higher among non-parents than parents 26% The proportion who feel there is too much sex is highest among the 65+ age group and is higher among females than males An acceptable amount Too much Violence Swearing Sex Source: Ofcom cross-platform media tracker QF6 Do you think, in general, that there is too much, too little or an acceptable amount of each of the following on television? Sex? Violence? Swearing? Base: All with any TV sets in 2017 (2313). Prompted, single code. Switching channel is the most common reaction among those personally offended by something on television Almost half (47%) of those who saw something personally offensive on television in the last 12 months switched channels. A quarter (26%) discussed what they had seen with someone, about one in five (22%) switched off the TV, and 17% continued to watch. One in ten adults feel that sexually explicit programmes should never be shown on television, while a fifth (21%) feel that such programmes should only be allowed on paid-for / subscription channels with access restricted to over-18s (e.g. via a PIN). A similar proportion of adults (22%) feel that sexually explicit programmes should be allowed on free-to-air channels, but only accessible in the adult section of the EPG after 10pm. But 31% agreed with the statement: I think such things should be freely available on any channel after the 9pm watershed. When asked about violent programmes, almost half (46%) of adults feel that violent programmes should be allowed on any channel after the 9pm watershed. Almost one in five (18%) think that particularly violent programmes should never be shown on television, and a fifth (20%) feel that violent programmes should only be allowed on paid-for / subscription channels with access restricted to over-18s. 60

61 The local TV sector Chapter overview This section provides an update on the local TV sector. It provides data on the number of services available across the UK and the extent to which these are being watched. The chapter then goes on to discuss some of the challenges facing local TV broadcasters, including an analysis of their income and expenditure. There were 34 local TV channels on air in the UK in 2017 The local television sector has contributed new local programming to the UK media landscape. At the end of 2017, there were 34 local TV channels on air in the UK. Local TV was introduced by the Government in its 2011 Local Media Action Plan. A statutory framework was established in 2012 to enable local TV services to be introduced, 51 under which Ofcom was tasked with licensing individual services in locations around the UK, 52 and EPG providers were required to afford them appropriate prominence. The Government s local TV policy was aimed at establishing local TV on digital terrestrial television (DTT). However, channels can make themselves available on other platforms as well. In 2017, 24 of the 34 local TV channels were available on multiple platforms 53, compared to 17 of 21 channels in Whether or not a UK household can receive local TV depends on where they live and which TV platform they use. It is estimated that in April % of UK homes could receive a local TV service via DTT. It is not possible to quantify availability to satellite or cable households. 51 By means of the Local Digital Television Programme Services Order Licences have been awarded via a competitive process in which applicants propose programming commitments to reflect the type of service they plan to broadcast. To ensure that licensees deliver the services proposed in their licence applications, the programming commitments form part of the conditions of their licence. Licence obligations therefore vary by service, but typically include a number of hours of first-run and repeated local programming. 53 By this we mean services which were made available on other platforms in addition to Freeview, including Sky, Freesat, Virgin Media, internet simulcast services, and internet catch-up or on-demand. 61
 per week watched a local TV channel Seventeen of the 34 local TV stations on air in 2017 are measured by the UK s audience measurement system, BARB, so can be included in")
62 Figure 43: Map of local TV stations across the UK and their coverage Source: Ofcom/broadcasters In 2017, an average of 1.6 million households (6%) per week watched a local TV channel Seventeen of the 34 local TV stations on air in 2017 are measured by the UK s audience measurement system, BARB, so can be included in our analysis. See the methodology annex to this report for a list of these stations. 54 For these 17 local channels, a weekly average of 1.6 million homes across the UK watched at least three consecutive minutes, up by 12.7% since 2016, based on a like-for-like comparison of the 54 Note that 5 of these 17 channels stopped being measured on BARB halfway through 2017 (see methodology annex). 62
63 channels, where we have data for both years. The average household weekly reach varied across 2017, from a low of 1.1 million homes a week to more than 2 million homes a week. 55 Many local TV services continue to face challenges in generating income As in 2016 and 2015, spend by local TV services outweighed income in Expenditure for the sector as a whole in 2017 was 19.9m 57, while income for the sector as a whole was 10.4m 58, as shown in Figure 42 below. However, 13 of the 34 services in operation in 2017 made a profit, compared to 3 of the 21 services in operation in 2016, and one of the 20 services in Figure 44: Local TV income and expenditure, Sector income Sector expenditure 20m 18m 20m 9m 11m 10m Source: Ofcom/broadcasters Local TV services are funded primarily through a mix of advertising, BBC funding, other commercial and non-commercial income, and teleshopping. In 2017, advertising accounted for around half (51%) of local TV revenue, down by 5pp on the previous year in real terms. Other commercial revenue grew by 10pp to 18% of total income, and other non-commercial revenue had a slight increase of 1pp to 7% of total income. As in 2016, teleshopping accounted for less than 1% of revenue in Source: BARB. Individuals (4+), network. Reach criteria: 3+ consecutive minutes, full weeks used. 56 Analysis based on the income and expenditure declared by services to Ofcom for 2017 in their local return forms. The income figure excludes additional investments. 57 This data comes with certain caveats; 13 out of 34 channels said their reported costs were projected estimates for the year, with nine channels stating that certain outstanding charges had not been included in their figures. One channel noted that it had provided costs which did not solely apply to the channel, so its costs figure is likely to be an overestimate. 58 In our analysis, income figures do exclude additional funding from shareholders or external investors. Other caveats also apply: five channels said they had excluded revenue they had yet to receive for sub-letting airtime to other content providers, with one channel excluding ad-hoc BBC revenue that is yet to be finalised. 59 The increase in the number of individual services making a profit in 2017 occurred because a significant number of the new services that launched in 2017 operate at a the low end of the range of cost bases in the sector. 63
64 Figure 45: Local television revenue, by source % 56% 51% 29% 30% 24% 18% 11% 6% 7% 5% 0% 0% 2% 8% Advertising BBC Non-commercial income Teleshopping Other commercial revenue Source: Ofcom/broadcasters, includes all channels operating in the year. Many local TV services rely on public funding BBC funding accounted for around a quarter (24%) of local TV income in 2017, down by 6pp on the previous year. The income generated from the BBC comes from three sources: guaranteed funding for news items ( Newsfeed funding 61 ), the Digital Nation programme 62, and BBC commissions/other BBC funding. For the local TV sector as a whole, guaranteed BBC Newsfeed funding accounted for 68% of the revenue generated from the BBC in The two BBC funding streams that are specific to the local TV sector derive from the Government s decision to use licence fee money to fund local TV, for a limited period of time. These streams have either come to an end or will do soon: the Digital Nation programme finished on 31 March 2017 and the BBC Newsfeed funding finishes in 2020 at the latest. Twelve of the 28 services which signed up for the guaranteed BBC Newsfeed funding stopped receiving it in the course of 2017, and another five services will stop receiving it during 2018, although they will still be able to bid for commissions and participate in other competitive BBC initiatives. Nearly half (15 of 34) of all local TV services received more than 50% of their income from the BBC Digital Nation programme and/or BBC Newsfeed funding in However, the reliance on 60 The number of services was different each year. In 2015 there were 20 services, in 2016 there were 21, and in 2017 there were BBC Newsfeed funding is protected BBC funding for news items, if a service has opted to receive it. It ends when a service has been broadcasting for three years and must at the latest come to an end by 31 July Digital Nation was a showcase for reports from around the local TV sector. Eighty weekly episodes were acquired for online use by the BBC, whose fees were shared among stations that contributed to, or helped produce, the programme. The programme ran for 18 months and finished on 31 March The episodes are available online: 63 The other guaranteed BBC income stream, Digital Nation, accounted for an additional 13% of the income the sector received from the BBC 64
65 guaranteed BBC funding varies considerably: in 2017, across all services, guaranteed BBC funding accounted for 100% of total revenue for some services, and 0% for others. The local TV sector as a whole still faces challenges in generating sufficient income. To try to counter this, many channels have diversified their income sources. In 2017, 15 of the 34 channels sub-let an average of 2,549 hours airtime to other content providers, while 12 channels received income from sponsorship deals, and 12 channels received additional investment, including funding from parent companies and funding from grant prizes. Some local TV services continue to find their output commitments challenging The average volume of first-run local programming broadcast by a local TV service in 2017 was 1,205 hours (23 hours per week 64 ). This was down from 1,625 hours (31 hours per week) in 2016, and 1,732 hours (33 hours per week) in As we found in 2016, some local TV services have also found their programming commitments difficult to deliver. In 2017, several services submitted programming commitment change requests to Ofcom, of which six were allowed. 64 One service provided an estimate of its programming output for part of the year, as there was a change in ownership. 65
, DAB, 65 digital television broadcast networks, and also, in most, cases via the internet. We then look in more detail at funding for radio (in particular commercial radio).")
66 The UK radio landscape Chapter overview This chapter provides an overview of the availability of radio stations in the UK via a range of different platforms, including analogue (AM and FM transmissions), DAB, 65 digital television broadcast networks, and also, in most, cases via the internet. We then look in more detail at funding for radio (in particular commercial radio). There has been a shift away from stations broadcasting on AM frequencies As of March 2018, there were 286 local analogue commercial radio stations in the UK, of which 235 were broadcasting on FM and 51 on AM (MW) bands. There has continued to be a shift away from AM (MW) by some broadcasters in 2017, given the availability of services on FM and digital radio platforms which offer better sound quality, and the opportunity for broadcasters to reduce costs by stopping or reducing AM simulcasts. Following audience trials, the BBC confirmed the switch-off of 13 local radio AM transmitters from January Seven BBC local stations (Surrey, Sussex, Humberside, Kent, Lincolnshire, Nottingham and Wiltshire) stopped transmitting on AM completely, to rely on FM and DAB, while AM coverage on the BBC s Devon, Lancashire and Essex stations was reduced. In April 2018 Ofcom approved proposals from Absolute Radio to reduce by 5% the transmission coverage of its AM national commercial licence, while Aberdeen-based Northsound 2 ceased its AM service in April Conversely, Radio Caroline started AM transmissions in late 2017 in order to reproduce the AM service that it had originally broadcast on AM in the 1960s. The number of community radio stations grew by 14 to 255, as further licences have been issued and stations have been launched. Some community stations also simulcast on DAB, potentially allowing them to extend their audience beyond their analogue coverage area. 65 Digital audio broadcasting, a way of transmitting radio digitally rather than using analogue (e.g. FM or AM) 66
67 Figure 46: Analogue radio services: March 2018 AM FM AM/FM total Local commercial UK-wide commercial BBC UK-wide networks BBC local and nations Community radio stations Source: BBC / Ofcom. Figures above exclude BBC Radio 4 LW There has been continued growth in the number of DAB services available The total number of services broadcast on DAB grew from 435 in May 2017 to 453 in March 2018, reflecting the launch of new digital-only services, and the potential for stations to use DAB multiplexes to extend their existing reach. The flexible licensing regime for digital radio allows for the rapid entry and exit of DAB stations (allowing, for example, pop-up stations for special events or times of the year such as Christmas). This means that the number of services on DAB fluctuates over time. The adoption of more bandwidth-efficient DAB+ broadcasts has allowed a greater number of services to be carried on a multiplex and still maintain a given sound quality. DAB+ services are currently available on the Sound Digital UK-wide multiplex and on some local multiplexes. Figure 47: Digital radio services in the UK: March 2018 BBC UK-wide UK commercial 90% coverage (Digital One) UK Commercial 75% coverage (Sound Digital) Local commercial Number of multiplexes Number of services * Source: BBC / Ofcom. Note: *This figure refers to the number of programme services broadcast on local DAB multiplexes. Not all services will contain local content, and some services may be broadcast on a number of different multiplexes (but are counted for these purposes as individual services). 67
68 Small-scale DAB: An opportunity for even greater choice of local radio services on DAB Historically, the cost of carriage and the size of coverage areas offered by local DAB multiplexes made it unattractive for some smaller commercial stations and community radio services to broadcast on DAB. Following initial work carried out by an Ofcom engineer to use open source software and standard computing hardware as an alternative to more expensive dedicated DAB equipment, trials using this small-scale DAB technology were set up in 2015 in London, Manchester, Birmingham, Glasgow, Portsmouth, Cambridge, Brighton, Aldershot, Bristol and Norwich. The ten trial areas now carry around 140 different services, including some using DAB+, giving listeners in those areas an even wider choice of radio stations, including digital simulcasts of community radio stations as well as new radio stations which can offer a more localised service or more specialist music formats than stations available on the established local DAB multiplexes. Following the passage of the Broadcasting (Radio Multiplex Services) Act 2017, and a consultation in early 2018, DCMS is currently considering options for a permanent licensing regime for small-scale DAB. Coverage of DAB has grown over time and further build-out is planned, although there are still differences in coverage between the UK s nations While coverage of DAB services has grown over time, there continue to be significant differences in coverage between the nations of the UK. Availability of BBC, national and local DAB services is highest in England, where over 98% homes can receive the BBC UK-wide DAB services, compared to 87% of homes in Northern Ireland. Road coverage also varies considerably across the UK, reflecting differences in geographies and, in particular, mountainous terrain in parts of Scotland and Wales. In May 2018, Arqiva announced that coverage of the Sound Digital multiplex would be built out to an additional four million people in the north of Scotland, Wales, the South West and East Anglia

69 Figure 48: Coverage of DAB services: March 2018 Source: BBC, Arqiva, Ofcom Norway is the first country to have replaced national FM broadcasts with DAB services As radio listening moves to digital platforms there is the opportunity to switch off analogue services in the FM and AM bands in order to make the spectrum available for other purposes such as mobile broadband services. In 2017 Norway became the first country in the world to switch off national FM broadcasts, while in Italy, RAS, (the regional public broadcaster serving South Tyrol), started the switch-off of its analogue FM services at the end of In both these cases, a key driver for the switch was additional capacity to launch new services while rationalising transmitters in mountainous terrain. In 2017 Switzerland announced that the switch-off of FM broadcasts would start in In France, the availability of DAB has continued to increase as roll-out has continued on a city-by-city basis, reaching 19% of the population by the end of Further roll-out, to cities including Bordeaux and Toulouse, is planned, and in April 2018 the French broadcast regulator published an invitation for applications for services for these two cities. 67 The UK Government has not announced any plans for switching off analogue services in the UK. 67 See 69

 of all radio listening is now digital (DAB, online or through a TV set).")
 of households now have a DAB set.")
70 Consumption and use of radio and audio services Chapter overview This chapter provides an overview of the audio market, including who is listening, how they are listening and what they are listening to. For the first time, more than half of all radio listening is through a digital platform although this is not uniform across the UK The latest RAJAR 68 figures show that over half (50.9%) of all radio listening is now digital (DAB, online or through a TV set). Although listening online has had the biggest increase, at 8% since the last quarter and 17% over the previous 12 months, it still only accounts for less than 10% of all radio hours; listening through a DAB radio set contributes 37% of hours. Almost two-thirds (63.7%) of households now have a DAB set. Figure 49: Share of listening by platform: 2013 vs Total Digital 34.3% Total Analogue 65.7% Total Analogue 49.1% Total Digital 50.9% Source: RAJAR 68 Radio Joint Audience Research: the official body for measuring radio audiences in the UK 70
THE SVOD REPORT: CHARTING THE GROWTH IN SVOD SERVICES ACROSS THE UK 1 DAILY CONSOLIDATED TV VIEWING 2 UNMATCHED VIEWING
 1 THE REPORT: CHARTING THE GROWTH IN SERVICES ACROSS THE UK January 218 In the UK, television is still king. We are investing in ever larger sets; more than half of all UK households have a at least 4
FACTSHEET 4 Consumption of broadcast TV
 FACTSHEET 4 Consumption of broadcast TV Oxford Media Convention March 2017 1 This factsheet has been compiled by Ofcom and provides some background information to aid discussion at the 2017 Oxford Media
The Communications Market: Digital Progress Report
 The Communications Market: Digital Progress Report Digital TV, 2009 This is Ofcom s twenty-third Digital Progress Report covering developments in multichannel television. The data are the latest available
Public Service Broadcasting Annual Report 2011
 Public Service Broadcasting Annual Report 2011 Research Document Publication date: 21st July 2011 1 Public Service Broadcasting: Annual Report 2011 Executive summary Ofcom has a duty to assess the designated
Ofcom s Annual Report on the BBC: 2017/18. Annex 2: BBC Performance Report
 Ofcom s Annual Report on the BBC: 2017/18 Contents Section Overview 4 Core BBC audience metrics 8 Public purpose 1: news and current affairs 13 Public purpose 2: learning 35 Public purpose 3: creative,
BSAC Business Briefing. TV Consumption Trends in the Multi-Screen Era. October 2012
 BSAC Business Briefing TV Consumption Trends in the Multi-Screen Era October 2012 Traditional TV Viewing Is Holding Up Well Despite all the hype about social networking, over-the-top video services, smartphones,
THE SVOD REPORT CHARTING THE GROWTH IN SVOD SERVICES ACROSS THE UK 1 TOTAL TV: AVERAGE DAILY MINUTES
 1 THE SVOD REPORT CHARTING THE GROWTH IN SVOD SERVICES ACROSS THE UK January 219 A lot can change in a year. In 218, England had a football team that the public actually enjoyed watching and the Beast
MEDIA NATIONS: Wales Published 18 July 2018
 MEDIA NATIONS: Wales 2018 Published 18 July 2018 About this document This is Ofcom s first annual Media Nations: Wales report. The report reviews key trends in the television and audio-visual sector as
A quarterly review of population trends and changes in how people can watch television
 1 A quarterly review of population trends and changes in how people can watch television 217 Analysis by 2 CONTENTS 3 THE PRIMARY ROLE OF SECONDARY TV SETS Secondary TV sets are becoming increasingly important
Communications Market Report United Kingdom Published 3 August 2017
 Communications Market Report United Kingdom Published 3 August 2017 Angel of the North About this document The report contains statistics and analysis of the UK communications sector. It is a reference
Digital Day 2016 Overview of findings
 Digital Day 2016 Overview of findings Research Document Publication date: 5 th August 2016 About this document This document provides an overview of the core results from our 2016 Digital Day study, drawing
FILM ON DIGITAL VIDEO
 FILM ON DIGITAL VIDEO BFI RESEARCH AND STATISTICS PUBLISHED OCTOBER 2017 Digital video enables audiences to access films through a range of devices, anytime, anywhere. Revenues for on-demand services in
The Communications Market: Digital Progress Report
 The Communications Market: Digital Progress Report Digital TV, Q2 2007 This is the fifteenth Ofcom Digital Progress Report covering developments in digital television take-up. The data are the latest available
Northern Ireland: setting the scene
 Northern Ireland: setting the scene Key facts about Northern Ireland Figure Nation UK Population 1,779m (mid-2009 estimate); population is estimated to have risen by 5.6%, or 94,000 people, since 2001
D PSB Audience Impact. PSB Report 2011 Information pack June 2012
 D PSB Audience Impact PSB Report 2011 Information pack June 2012 Contents Page Background 2 Overview of PSB television 11 Nations and regions news 25 Individual PSB channel summaries 33 Overall satisfaction
PSB Annual Report 2015 PSB Audience Opinion Annex. Published July 2015
 PSB Annual Report 2015 PSB Audience Opinion Annex Published July 2015 Contents Page Background 2 Overview of PSB television 5 Overall satisfaction with PSB 19 Nations and regions news 29 Children s PSB
2 Television and audio-visual content Recent developments in Scotland
 2 Television and audio-visual content 2 2.1 Recent developments in Scottish Government In October 2011 the Scottish Government published its final progress report on the Scottish Broadcasting Commission
MEDIA NATIONS: Scotland Published 18 July 2018
 MEDIA NATIONS: Scotland 2018 Published 18 July 2018 About this document This is Ofcom s first annual Media Nations: Scotland report. The report reviews key trends in the television and audio-visual sector
Public service broadcasting in the digital age. Supporting PSB for the next decade and beyond
 Public service broadcasting in the digital age Supporting PSB for the next decade and beyond Publication Date: 8 March 2018 About this document Three years on from Ofcom s third review of public service
B - PSB Audience Impact. PSB Report 2013 Information pack August 2013
 B - PSB Audience Impact PSB Report 2013 Information pack August 2013 Contents Page Background 2 Overview of PSB television 11 Nations and regions news 27 Individual PSB channel summaries 35 Overall satisfaction
BBC Red Button: Service Review
 BBC Red Button: Service Review Quantitative audience research assessing the BBC Red Button service s delivery of the BBC s Public Purposes Prepared for: October 2010 Prepared by: Trevor Vagg, Kantar Media
BBC Television Services Review
 BBC Television Services Review Quantitative audience research assessing BBC One, BBC Two and BBC Four s delivery of the BBC s Public Purposes Prepared for: November 2010 Prepared by: Trevor Vagg and Sara
2. Television and audio visual
 2. Television and audio visual 0 Figure 2.1 Industry metrics UK television industry 2005 2006 2007 2008 2009 2010 Total TV industry revenue ( bn) 10.5 10.6 11.1 11.2 11.1 11.7 Proportion of revenue generated
Department for Culture, Media and Sport. The balance of payments between television platforms and public service broadcasters
 Response to consultation: Department for Culture, Media and Sport The balance of payments between television platforms and public service broadcasters 26 June 2015 1 [BLANK] 2 1. Introduction About Digital
The International Communications Market TV and audio-visual
 The International Communications Market 017 TV and audio-visual 84 Contents.1 TV and audio-visual: overview and key market developments 86.1.1 The UK in context 87.1. Key market development: Live TV is
TV Subscriptions and Licence Fees
 TV Subscriptions and Licence Fees The revision of the Federal Law on Radio and Television (RTVA) will direct more license fees to local radio and TV stations. Swiss TV providers are expanding their Replay-Functions.
Digital Television Update Q4 2004
 Digital Television Update Q4 2004 This is the fifth of Ofcom s Digital Television Update quarterly reports. As far as possible, data is based upon the latest figures provided by platform operators; however,
MEDIA NATIONS: Northern Ireland Published 18 July 2018
 MEDIA NATIONS: Northern Ireland 2018 Published 18 July 2018 About this document This is Ofcom s first annual Media Nations: Northern Ireland report. The report reviews key trends in the television and
The ABC and the changing media landscape
 The ABC and the changing media landscape 1 THE ABC AND THE MEDIA LANDSCAPE The Australian media is and always has been characterised by a mix of publicly-funded broadcasters and commercial media operators.
Communications Market Report Scotland Published 3 August 2017
 Communications Market Report Scotland Published 3 August 2017 The Kelpies Communications Market Report Main Contents Introduction 1 Setting the scene 2 1 Scotland s communications market 3 2 Television
PSB Review 2008 Research findings
 PSB Review 2008 Research findings Contents Introduction 2 Broadcaster output data 3 PAGE Broadcaster investment data 23 Audience viewing habits 27 Audience research summary 41 The purposes of TV 44 Role
AUSTRALIAN MULTI-SCREEN REPORT QUARTER
 AUSTRALIAN MULTI-SCREEN REPORT QUARTER 02 Australian viewing trends across multiple screens The edition of the Australian Multi-Screen Report provides the latest estimates of technologies present in Australian
GfK Briefing to BASE SVOD Content Consumption Tracking
 GfK Briefing to BASE SVOD Content Consumption Tracking March 17th 2016 GfK 2015 1 Typically, 72% of the population watches something live or as scheduled on the average day 72% Source: BARB Daily reach,
Media Nations. Annex 1: methodologies
 Media Nations Annex 1: methodologies Contents Section 1. Research survey methodologies 1 2. TV output and spend analysis 3 3. TV and AV consumption analysis 8 4. Listening analysis: RAJAR 13 1. Research
2016 Cord Cutter & Cord Never Study
 16 Cord Cutter & Cord Never Study Welcome to the Our builds on our 14 Cord Cutter Study by providing a focused look at both US consumers who opted out of subscription-based paid-tv service in the last
In accordance with the Trust s Syndication Policy for BBC on-demand content. 2
 BBC One This service licence describes the most important characteristics of BBC One, including how it contributes to the BBC s public purposes. Service Licences are the core of the BBC s governance system.
What Impact Will Over-the-Top Video Have on My Bottom Line
 What Impact Will Over-the-Top Video Have on My Bottom Line March 27, 2018 Doug Eidahl, VP Legal & Regulatory 2211 N. Minnesota St. Mitchell, SD 57301 The Changing CATV-Video Market 2 Recent Losses - Largest
Australian. video viewing report
 Australian video viewing report QUARTER 4 2 Introduction W elcome to the Australian Video Viewing Report spanning the year through. This issue builds on the continuing story of how Australians are embracing
Connected Life Market Watch:
 Connected Life Market Watch: Transitions in U.K. Consumer Video Entertainment Cisco Internet Business Solutions Group October 2010 Internet Business Solutions Group 1 Connected Life Market Watch Program:
AUSTRALIAN MULTI-SCREEN REPORT QUARTER
 AUSTRALIAN MULTI-SCREEN REPORT QUARTER 02 Australian viewing trends across multiple screens Since its introduction in Q4 2011, The Australian Multi- Screen Report has tracked the impact of digital technologies,
TV Subscriptions and Licence Fees
 TV Subscriptions and Licence Fees By mid-2015, UPC Cablecom had switched off analogue TV service completely in all of Switzerland. UPC Cablecom and Swisscom resist OTT competition by offering unlimited
BBC Trust service review The BBC s children s services
 BBC Trust service review The BBC s children s services September 2013 Getting the best out of the BBC for licence fee payers Contents Introduction 1 Executive Summary 5 Part 1: Context and Performance
Communications Market Report: Northern Ireland
 Communications Market Report: Northern Ireland Research Document Publication date: 19 August 2010 Introduction This is Ofcom s fifth annual review of communications markets in Northern Ireland. The report
Study on the audiovisual content viewing habits of Canadians in June 2014
 Study on the audiovisual content viewing habits of Canadians in 2014 June 2014 Table of contents Context, objectives and methodology 3 Summary of results 9 Detailed results 14 Audiovisual content viewing
Ofcom Core Switching Tracker 2018
 S1. CODE NATION FROM SAMPLE England 1 Scotland 2 Wales 3 Northern Ireland 4 S2. ENTER FULL POSTCODE TYPE IN: S3. ENTER SAMPLE POINT NUMBER FROM SAMPLE TYPE IN: 1 P a g e This study is being conducted on
The future of TV: It s blurred
 For Investment Professionals Follow us @LGIM #Fundamentals FUNDAMENTALS The future of TV: It s blurred Madeleine King was appointed Co-Head of Pan European Investment Grade Research in 2016 and is responsible
Communications Market Report: Scotland
 Communications Market Report: Research Document Publication date: 4 August 2016 Introduction This is Ofcom s 11th annual review of communications markets in, offering an overview of the take-up and use
Wales. BBC in the nations
 Wales The BBC s expenditure in Wales during /16 was 177.7 million across all services and platforms. Total expenditure represents an increase of 8.5 million on network content and 1.7 million on local
Communications Market Report
 Communications Market Report The Angel of the North Bitesize Published August 207 Introduction ofcom.org.uk The communications market report The communications market plays a crucial role in the lives
Purpose Remit Survey Autumn 2016
 Purpose Remit Survey 2016 UK Report A report by ICM on behalf of the BBC Trust Creston House, 10 Great Pulteney Street, London W1F 9NB enquiries@icmunlimited.com www.icmunlimited.com +44 020 7845 8300
BBC Trust Review of the BBC s Speech Radio Services
 BBC Trust Review of the BBC s Speech Radio Services Research Report February 2015 March 2015 A report by ICM on behalf of the BBC Trust Creston House, 10 Great Pulteney Street, London W1F 9NB enquiries@icmunlimited.com
The social and cultural purposes of television today.
 Equity response to Public Service Television for the 21st Century A Public Inquiry Equity is the UK based union representing over 39,000 creative workers. Our membership includes actors and other performers
AUSTRALIAN MULTI-SCREEN REPORT QUARTER
 AUSTRALIAN MULTI-SCREEN REPORT QUARTER 03 Australian viewing trends across multiple screens The Australian Multi-Screen Report shows Australian homes have more screens, channel and platform choices and
Response to Ofcom Consultation The future use of the 700MHz band. Response from Freesat. 29 August 2014
 Response to Ofcom Consultation The future use of the 700MHz band Response from Freesat 29 August 2014 1 1 About Freesat Freesat is a subscription free satellite and IP TV service offering digital television
DIGITAL SWITCHOVER & THE BBC S ROLE
 DIGITAL SWITCHOVER & THE BBC S ROLE Dr David Levy Controller, Public Policy BBC OXFORD UNIVERSITY, JULY 2006 1 2 What s special about Digital TV? Changing standards is relatively common Gas, Currencies
BBC Trust Changes to HD channels Assessment of significance
 BBC Trust Changes to HD channels Assessment of significance May 2012 Getting the best out of the BBC for licence fee payers Contents BBC Trust / Assessment of significance The Trust s decision 1 Background
Beyond Broadcast Innovative models of content delivery
 Beyond Broadcast Innovative models of content delivery Heiko Zysk, VP Governmental Relations & Head of European Affairs ProSiebenSat.1 Media AG January 2015 Page 1 TV dominates media consumption in Germany
49 ƒ. Communications Market Report: Scotland
 49 ƒ Communications Market Report: Research Document Publication date: 4 August Introduction This is Ofcom s sixth annual review of communications markets in, offering an overview of the take-up and use
Context The broadcast landscape
 Cynulliad Cenedlaethol Cymru / National Assembly for Wales Pwyllgor Diwylliant, y Gymraeg a Chyfathrebu / The Culture, Welsh Language and Communications Committee Dyfodol S4C / The Future of S4C CWLC(5)
AUSTRALIAN MULTI-SCREEN REPORT QUARTER
 AUSTRALIAN MULTI-SCREEN REPORT QUARTER 04 Australian viewing trends across multiple screens Over its history, the Australian Multi-Screen Report has documented take-up of new consumer technologies and
Communications Market Report: Northern Ireland
 Communications Market Report: Northern Ireland Research Document Publication date: 18 July Introduction Welcome to Ofcom s annual review of communications markets in Northern Ireland. This report gives
Ofcom and Digital UK Switchover Tracker Survey. Switchover Progress Report Q1 2007
 Ofcom and Digital UK Switchover Tracker Survey Switchover Progress Report Q1 2007 Publication Date: 8th May 2007 Contents Executive Summary 2 Chapter 1 The Q1 2007 Dashboards: 6 (1) By Regions (2) By Consumer
2 Television and audio-visual content Recent developments in Northern Ireland
 2 Television and audio-visual content 2 2.1 Recent developments in Northern Ireland NI Assembly given more oversight of the BBC The Northern Ireland Executive is being given more oversight of the BBC.
Communications Market Report: Northern Ireland
 Communications Market Report: Northern Ireland Research Document Publication date: 1 August 2013 Introduction Welcome to Ofcom s annual Communications Market Report for Northern Ireland. The report gives
ThinkNow Media How Streaming Services & Gaming Are Disrupting Traditional Media Consumption Habits Report
 ThinkNow Media How Streaming Services & Gaming Are Disrupting Traditional Media Consumption Habits 2018 Report 1 ThinkNow Media What is it? ThinkNow Media is a nationwide survey that looks at Americans
AUSTRALIAN MULTI-SCREEN REPORT QUARTER
 AUSTRALIAN MULTI-SCREEN REPORT QUARTER 0 AUSTRALIAN VIEWING TRENDS ACROSS MULTIPLE SCREENS The 0 edition of the Australian Multi- Screen Report updates household take-up of new technologies and the trends
Joint submission by BBC, ITV, Channel 4, Channel 5, S4C, Arqiva 1 and SDN to Culture Media and Sport Committee inquiry into Spectrum
 Joint submission by BBC, ITV, Channel 4, Channel 5, S4C, Arqiva 1 and SDN to Culture Media and Sport Committee inquiry into Spectrum 1. Introduction and summary The above-named organisations welcome the
Future of TV. Features and Benefits
 Future of TV This report assesses the future of TV in all its forms, encompassing content, technology, consumer appliances and devices, mobile devices, evolving media and broadcast business models, the
ThinkTV FACT PACK NEW ZEALAND JAN TO DEC 2017
 ThinkTV FACT PACK NEW ZEALAND JAN TO DEC 2017 TV Has Changed NEW ZEALAND Today s TV is a sensory experience enjoyed by over 3 million viewers every week. Powered by new technologies to make TV available
Architecting the new TV. Daniel Knapp, Director Advertising Research
 Architecting the new TV Daniel Knapp, Director Advertising Research Media trends have always sparked speculations and visions sometimes remarkably accurate How we will live in the year 2000 (German artist
BBC Three. Part l: Key characteristics of the service
 BBC Three This service licence describes the most important characteristics of BBC Three, including how it contributes to the BBC s public purposes. Service Licences are the core of the BBC s governance
Pulling the plug: Three-in-ten Canadians are forgoing home TV service in favour of online streaming
 Pulling the plug: Three-in-ten Canadians are forgoing home TV service in favour of online streaming Despite availability of skinny cable packages, most current subscribers say TV service is too expensive
CHANNEL 4 ANNUAL REPORT 2016 MAKING AN IMPACT
 72 CHANNEL 4 ANNUAL REPORT MAKING AN IMPACT continues to occupy a unique position in the broadcasting ecosystem. It is a mass-market channel that reaches large audiences every day, while also engaging
3. Television and audio-visual
 3. Television and audio-visual 3. Key Market Developments Figure 3.1 TV industry metrics UK FRA GER ITA USA CAN JPN AUS ESP NED SWE IRL POL BRA RUS IND CHN TV revenue ( bn) 11.3 10.4 11.0 8.1 94.0 4.0
TURNING DIGITAL. The Future Can't Wait. Annual Report XVI Edition
 TURNING DIGITAL The Future Can't Wait Annual Report XVI Edition October 2018 Billion Executive summary The TV market in 2017 The global TV market revenue in Western Europe reached 98.7 billion at the end
Lyrics Take Centre Stage In Streaming Music
 Lyrics Take Centre Stage A MIDiA Research White Paper Prepared For LyricFind Lyrics Take Centre Stage The 20,000 Foot View Streaming has driven many fundamental changes in music consumption and music fan
MID d ata data 2009 PSB Report 2010
 MID data 29 PSB Report 21 PSB Report 21 PSB Report 21 7 th July 21 PSB Spend PSB overall network programme spend Total 2.7b 2.8b 3.b 3.1b 3.3b 3.3b 3.4b 3.3b 3.2b 3.1b 3.b 2.8b m 3 3, 2, 1, 1.67b 1.7b
CONQUERING CONTENT EXCERPT OF FINDINGS
 CONQUERING CONTENT N O V E M B E R 2 0 1 5! EXCERPT OF FINDINGS 1 The proliferation of TV shows: a boon for TV viewers, a challenge for the industry More new shows: # of scripted original series (by year):
REVIEW OF THE MANDATORY DAYTIME PROTECTION RULES IN THE OFCOM BROADCASTING CODE
 OFCOM CONSULTATION REVIEW OF THE MANDATORY DAYTIME PROTECTION RULES IN THE OFCOM BROADCASTING CODE Introduction In principle, BT and EE welcome the proposed changes to the rules as they will allow for
Communications Market Report: England
 Communications Market Report: Research Document Publication date: 19 August 2010 Introduction This is Ofcom s fifth annual review of communications markets in. The report offers a detailed overview of
MAKING AN IMPACT METRICS CONTINUED
 74 CHANNEL 4 ANNUAL REPORT 2017 METRICS CONTINUED MAKING AN IMPACT occupies a unique position in the broadcasting ecosystem. It is a mass-market channel that reaches large audiences every day, including
Introduction slide 1 Digital Television 1. produced consumed New companies online continuation experimentation fragmenting reception dispersed
 Introduction slide 1 Digital Television 1. Digital systems of delivery are shaping how television is both produced and consumed New companies online The new media companies are a combination of both continuation
HOW AUSTRALIANS WATCH TV
 HOW AUSTRALIANS WATCH TV WATCHING TV ON ANY DEVICE IS OUR PREFERRED ENTERTAINMENT ACTIVITY Source: Deloitte Media Consumer Survey 2016. TECHNOLOGY MAKES TV AVAILABLE EVERYWHERE AND AT ANY TIME Australians
Looking Ahead: Viewing Canadian Feature Films on Multiple Platforms. July 2013
 Looking Ahead: Viewing Canadian Feature Films on Multiple Platforms July 2013 Looking Ahead: Viewing Canadian Feature Films on Multiple Platforms Her Majesty the Queen in Right of Canada (2013) Catalogue
Television, Internet and Mobile Usage in the U.S. A2/M2 Three Screen Report
 Television, Internet and Mobile Usage in the U.S. A2/M2 Three Screen Report VOLUME 5 2nd Quarter 2009 Viewership on the Rise as More Video Content Spans All Three Screens 57% of Internet Consumers Use
Public Service Broadcasting: Annual Report 2015 Annex Information Pack Methodologies
 Public Service Broadcasting: Annual Report 2015 Annex Information Pack Methodologies Annex Publication date: July 2015 Contents Annex Page 1 Methodologies 2 1.1 Output and spend data 2 1.2 Viewing figures
Viewers and Voters: Attitudes to television coverage of the 2005 General Election
 Viewers and Voters: Attitudes to television coverage of the 2005 General Election Research Study conducted by ICM Research on behalf of Ofcom Please note that figures for Five and Sky News in Table 2 (Perceptions
Ofcom s second public service broadcasting review Phase 2: preparing for the digital future - Response from Nickelodeon UK
 Ofcom s second public service broadcasting review Phase 2: preparing for the digital future - Response from Nickelodeon UK Nickelodeon UK Nickelodeon UK is the No. commercial children s TV network in the
FILM, TV & GAMES CONFERENCE 2015
 FILM, TV & GAMES CONFERENCE 2015 Sponsored by April 2015 at The Royal Institution Session 5: Movie Market Update Ben Keen, Chief Analyst & VP, Media, IHS This report summarises a session that took place
Window of Creative Competition for Television BBC Trust review
 Window of Creative Competition for Television BBC Trust review March 2013 Getting the best out of the BBC for licence fee payers Contents Window of Creative Competition for Television / BBC Trust review
The BBC s services: audiences in Scotland
 The BBC s services: audiences in Scotland Publication date: 29 March 2017 The BBC s services: audiences in Scotland About this document The operating licence for the BBC s UK public services will set the
Efficient, trusted, valued
 Efficient, trusted, valued Your ABC: Efficient, trusted, valued ABC Open Today, the ABC is better value for Australians than ever before. The ABC continues to adopt smarter ways of working and harness
Online community dialogue conducted in March Summary: evolving TV distribution models
 The Speed of Life* 2009 Consumer Intelligence Series TV viewership and on-demand programming Online community dialogue conducted in March 2009 Series overview Through PricewaterhouseCoopers ongoing consumer
Regional News. Summary Report
 Regional News Summary Report August 0 Prepared for: Prepared by: Holden Pearmain Research, St. George's Business Park, 1st Floor, Brooklands Road, Weybridge, Surrey, KT 0BG Tel: 02 0333 www.holdenpearmain.com
From Cloud to Consumer, TV Everywhere Business Realities
 From Cloud to Consumer, TV Everywhere Business Realities Guy Bisson, Research Director, Ampere Analysis ANGA Cable, June 2016 1 Ampere Analysis 2 Fundamental shifts in the TV economy over the last decade
The Future of Digital Terrestrial Television Enabling new services for viewers
 Ofcom The Future of Digital Terrestrial Television Enabling new services for viewers Ofcom Consumer Workshop 19 February 2008 Ofcom 1 Objectives of DTT consumer workshop To review the proposals outlined
Review of the mandatory daytime protection rules in the Ofcom Broadcasting Code. Consultation
 Review of the mandatory daytime protection rules in the Ofcom Broadcasting Code Consultation CONSULTATION: Publication Date: 14 March 2018 Closing Date for Responses: 9 May 2018 About this document The
BROADCAST. The following concepts help ensure the way we distribute revenue to members is equitable.
 BROADCAST Key concepts The following concepts help ensure the way we distribute revenue to members is equitable. Commercial licensee blanket revenues that cover more than one radio or TV station are divided
The Communications Market in Scotland. 2 TV and audio-visual content
 The Communications Market in 2 2 TV and audio-visual content 49 2.1 TV and audio-visual content 2.1.1 Recent developments in The Scottish Government and Scottish Broadcasting Commission In September 2009,
The Communications Market in England. 2 TV and audio-visual content
 The Communications Market in 2 2 TV and audio-visual content 45 2.1 TV and audio-visual content 2.1.1 Recent developments in HD and 3D TV Towards the end of 2009, Freeview started technical transmission