Citation Educational Researcher, 2010, v. 39 n. 5, p
|
|
|
- Everett Poole
- 5 years ago
- Views:
Transcription

1 Title Using Google scholar to estimate the impact of journal articles in education Author(s) van Aalst, J Citation Educational Researcher, 2010, v. 39 n. 5, p Issued Date 2010 URL Rights This work is licensed under a Creative Commons Attribution- NonCommercial-NoDerivatives 4.0 International License.; Educational Researcher. Copyright Sage Publications, Inc..
2 1 Using Google Scholar to Estimate the Impact of Journal articles in Education Jan van Aalst Provided via HKU Scholars Hub To appear in Educational Researcher, 39 (2010)
3 2 Abstract This article discusses the potential of Google Scholar as an alternative or complement to the Web of Science and Scopus for measuring the impact of journal articles in education. Three handbooks on research in science education, language education, and educational technology were used to identify a sample of 112 accomplished scholars. Google Scholar, Web of Science, and Scopus citations for 401 journal articles published by these authors during the five-year period were then analyzed. The findings illustrate the promise and pitfalls of using Google Scholar for characterizing the influence of research output, particularly in terms of differences between the three sub-fields in publication practices. A calibration of the growth of Google Scholar citations is also provided.
4 3 Using Google Scholar to Estimate the Impact of Journal Articles in Education Assessment of the quality and impact of research output is important to all academics. Early to mid-career academics depend on it for tenure and promotion reviews, journal editors for monitoring the influence of the journals they edit, and government bodies that oversee the performance of universities for university-wide research assessment exercises. The internationally preferred database used for demonstrating impact is the Web of Science database maintained by Thomson Reuters, although the European Research Index for the Humanities is also used. However, the Web of Science database includes only a small number of journals, over-representing journals from the US and the UK and excluding other forms of research output such as book chapters, books, and articles in languages other than English (Adler & Harzing, 2009). In conversations with education researchers it is often apparent that many do not think that the Web of Science database adequately characterizes the nature of scholarship in education, especially in subfields in which journals are not the most important publication venues. Some alternatives exist, including Scopus, a database of scholarly material published by Elsevier launched in In 2004, Google launched Google Scholar ( which uses a version of its search engine to query a database of scholarly documents available on the Web, including peer reviewed journal articles, books, book chapters, conference papers, and theses. Search results include links to full text documents, citation counts, ordered lists of citing documents, and hyperlinks to citing documents. In the library and information sciences there is considerable interest in Google Scholar as a research tool for analyzing the state of research in specific areas and identifying and locating important papers (Kousha & Thelwall, 2007; Meho & Yang, 2007; Noruzi, 2005). Among the advantages of Google Scholar are that it is freely
5 4 available on the Web and that it covers a wide range of scholarly materials. According SAGE (n.d.), Google and Google Scholar are the principal ways in which people will find your article online today. Between them they account for 60% of referral traffic to SAGE Journals Online ( 1). With an increasing trend toward open access journals, the ability to locate publications on the Web is expected to become more important. The possibility of using Google Scholar for assessing the impact of research output has been investigated less, and the goal of the study described here was to explore its potential for assessing the impact of journal articles in education. The rationale for the study was that if Google Scholar can yield a valid characterization of the influence of research output, then it will put a freely available and simple tool in the hands of early to mid-career researchers for assessing the influence of their research output. For example, a researcher who chooses to publish in a relatively new journal could use Google Scholar to analyze the influence of the journal and his or her own papers. However, as with the Web in general, there are concerns about the lack of review and moderation. Citation counts obtained from Google Scholar may exaggerate impact, and the citing documents may not be scholarly or peer reviewed. Information is thus needed about the nature of the documents that Google Scholar identifies as citing journal articles, and the growth rate of Google Scholar citations should be calibrated. In addition, it would be useful to have evidence of differences between subfields of education for such questions. This article first reviews the notion of an impact factor as used in Web of Science journal rankings and prior research on Google Scholar in the library and information sciences. Then presented is a case study of journal articles published by the first authors of chapters in international handbooks in science education, English language education, and educational technology. These subfields of education vary considerably in their publication practices, and
6 5 could reveal the potential benefits of Google Scholar compared to the Web of Science and Scopus. As explained in the methods section, the selected authors are assumed to have provided a sample of reasonably accomplished scholars, so that the patterns identified by the analysis can serve as a potential benchmark for junior academics in developing their publication profiles. The analysis consists of four parts, addressing the following questions for the three subfields. (1) To what extent do Google Scholar citations render a valid picture of the influence of specific journals? (2) What is the nature of the citing documents identified by Google Scholar? (3) How fast do Google Scholar citations grow? (4) How do Google Scholar citation counts compare with Web of Science and Scopus citation counts? Impact factors and their uses in assessing research output The Institute for Scientific Information (ISI) began publishing the impact factors of research journals in the 1960s, a service that has been taken over by Thomson Reuters. 1 Thomson Reuters is a company that provides scientific information to decision makers in a wide variety of fields of endeavor, including business, law, and academia. Only a small number of journals are indexed: in 2007, the Education and Educational Research category included 105 journals. Thomson Reuters defines a journal s ISI impact factor as the total number of current year citations from articles in its index to the articles published in the journal in the previous two years (Reuters, n.d.1). For example, in 2007 it reported an impact factor of for the Journal of Research in Science Teaching (JRST), which put it in 15th place among the 105 journals in the Education and Educational Research category. An impact factor of means that, on average, an article published in the journal in 2005 or 2006 was cited approximately once in a journal in the Web of Science in At universities where publication in the Web of Science is required, primarily in Europe and the Asia-Pacific region, academics who undergo reviews are often asked to report
7 6 the ISI impact factor and rank of the journals in which they publish, and the total number of citations of their own articles. In this regard, a researcher might claim in a review submission that an article published in JRST in 2007, with four citations in ISI journals in the first two years after publication, is performing well. ISI impact factors are low for applied fields such as education. In 2007, the median ISI impact factor of all journals in the Education and Education Research category was 0.548, similar to Business Finance (0.720), Electrical and Electronic Engineering (0.776), and Nursing (0.847), but substantially less than Experimental Psychology (1.515) and all of the natural sciences (1.259 to 2.402). In Education and Education Research, the highest impact factor was 3.0 and only 20 journals had impact factors of at least 1.0. Many of these journals aim for broad audiences, emphasize scientific studies, or publish review articles (e.g., American Educational Research Journal, 1.930; Scientific Studies of Reading, 2.676; Reviews of Educational Research, 2.600). However, many education researchers prefer to publish in journals with more specific audiences (e.g., in teaching subject areas, assessment, collaborative learning, or cultural studies), and some major areas of specialization within education lack journals with impact factors above 1.0. For teacher education, the highest impact factor in 2007 was (Teaching and Teacher Education), and for curriculum studies (Curriculum Inquiry). In contrast, in the Experimental Psychology category the highest impact factor in 2007 was 9.389, and there were 56 journals with impact factors of at least 1.0, which included many areas of psychology (e.g., emotion, cognition, memory, motor behavior, and child development). Although members of review panels are generally aware of differences between fields, education researchers would do well to consider how panel members from fields with high impact factors regard a publication in
8 7 a journal with an impact factor of 0.5. Clearly, if additional valid evidence of impact can be obtained it should be used in reviews of research output. Google Scholar may complement the Web of Science in several ways. First, in some areas of education such as language education, considerable emphasis is placed on the publication of new results in books and book chapters; citations to and from such works are not included in ISI impact factors. Second, the review and publication process tends to require more time for highimpact journals in education than for journals in the sciences. This can delay citations and lead to lower ISI impact factors. Third, the length of time required for publication leads researchers in some areas of education to communicate advances through peer reviewed conference papers, which are not always converted to journal articles. Thomson Reuters states that it has always included citations to journal articles from conference proceedings in its calculation of impact factors (Thomson Reuters, n.d.2, 3). However, it only began to do this for citations from conference proceedings published in books in 2008, and it does not provide impact factors for the conference proceedings themselves. Fourth, in education there are many citations in peer reviewed scholarly materials that are not included in the Web of Science, such as dissertations and course syllabi. These kinds of impact do not always influence research, but they can contribute to the development of educational practice. An idea learned from an article that becomes pivotal to a teacher s Master s thesis could have significant impact on her subsequent practice. An instructor s choice to select an article for discussion in a graduate seminar is a testimonial to its significance. These kinds of impact are not usually included in assessments of research output, but this is beginning to change. Although I am not suggesting that all forms of impact have equal value, Google Scholar may be able to provide data that can become the basis of the more comprehensive assessment of research output.
9 8 How Google Scholar works According to its corporate website, Google uses a variety of methods, including its PageRank algorithm, to examine the entire link structure of the web and determine which pages are most important (Google, 2009, 2). The PageRank algorithm (Brin & Page, 1998) evaluates the importance of web pages using a model that agrees with both commonsense and scientific notions of importance. A web page is considered important if it is linked to by many web pages that are also important, and if it has few outgoing links to web pages that are not considered important (Maslov & Redner, 2008). Extending this notion to research output, a paper is considered important if it builds on good research publications (cites important papers) and is cited extensively by influential rather than obscure papers. More formally, Google calculates the current PageRank of a Web document as the sum of its shares of the PageRanks of all the documents that link to it. For example, if document B has links to five documents including document A, then it contributes one-fifth of its PageRank to the PageRank of A. When Google updates PageRanks, the current values of all PageRanks are calculated from the most recent values, and this process is repeated until all PageRanks settle on steady state values (Craven, n.d.; Maslov & Redner, 2008). The changes in PageRank values during the updating process approximate a Markov chain, a process that has been studied extensively in mathematics. As a result, many mathematical properties of the process of calculating PageRanks have been investigated, including convergence, speed, and sensitivity to small changes in the Web structure (for extensive discussion, see Langville & Meyer, 2006). During a Web search, Google combines results based on PageRank with information about the relevance of web pages to the query (e.g., specific words in titles of documents, tags, and similar information).
10 9 Google Scholar applies these methods to a subset of the Web that it indexes as scholarly material. It presents search results in an order determined by PageRank and relevance to the search, and includes links to full text documents, the number of citing documents that it has indexed, and links to these; links to the citing documents are also presented in order of importance. The Web of Science and Scopus also provide citation counts, lists of citing documents, and links to full text documents, but base their analysis on citation counts alone rather than the importance of the citing documents. Thus, although the result screens of the Web of Science and Google Scholar interfaces are similar, substantially more information is embedded in Google Scholar results. Google Scholar uses its entire database to calculate the importance of all of its indexed documents and uses that information to rank papers. This makes Google Scholar potentially useful for identifying major contributions to a field. For example, Maslov and Redner (2008) used the PageRank algorithm on all of the journals sponsored by the American Physical Society in the period and identified many of the most influential contributions to physics during the period in the first 11 results, observing that the retrieved articles would be recognizable to almost all physicists, independent of their specialty (p ). It will be instructive to illustrate how well Google scholar identifies similar works in education. To this end I conducted three general searches on education, teaching, and learning, using the advanced settings to limit the searches to works indexed as being in the social sciences. The first 10 unique results for each search were retained, of which seven had more than 3,000 citations. For education, these results included two books by John Dewey and a handbook on case study research. For teaching, the results included two works by Lee Shulman, and for learning they included a book on social learning by Bandura and one on experiential learning
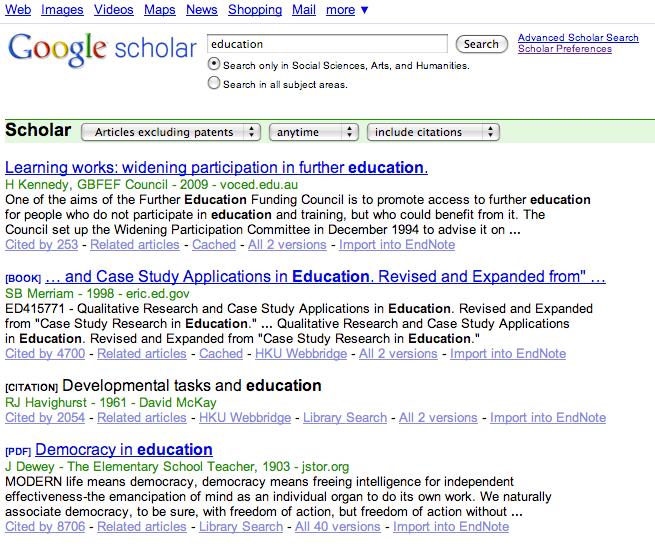
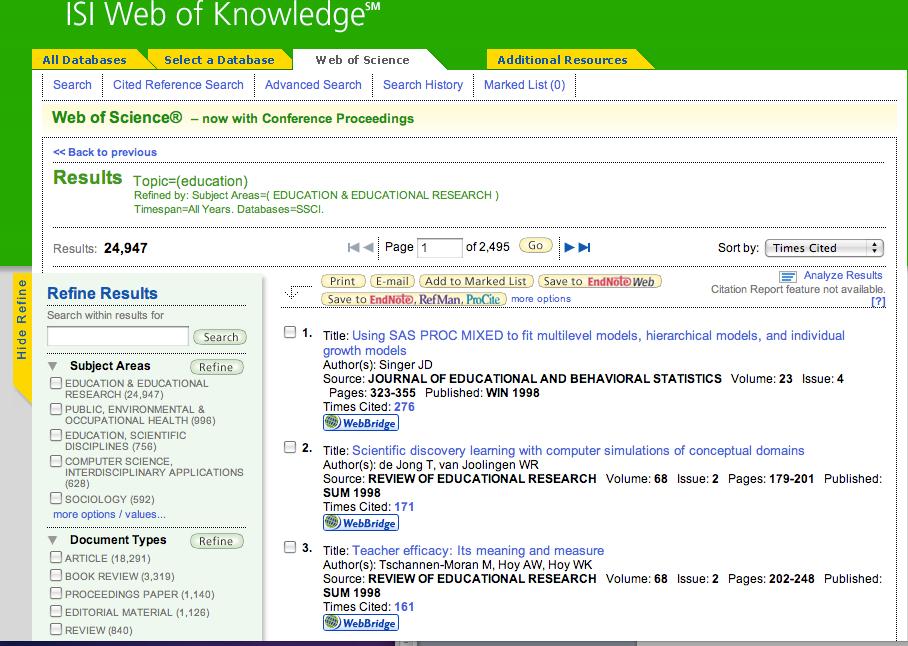
11 10 by Kolb. Relaxing the minimum number of Google Scholar citations to 2500, the works of John Biggs and Donald Schön were also retrieved. As in the physics example, these authors and the retrieved works are well known by education scholars, regardless of their specialization. Figure 1 (top panel) shows parts the Google Scholar search interface and a section of search results for one of the searches ( education, retrieved January 14, 2010). By default, Google Scholar provides the title and hyperlink to the document, the authors and publication year, information about the source, and the citation count, with a hyperlink to the citing documents. The information about the source includes a tag indicating the type of source, and usually the name and web site of the journal or publisher. For example, the tag [Citation] indicates that a result was taken from a reference to the stated work in a reference list, rather than the work itself. The Elementary School Teacher, 1903 jstor.org in the fourth result signals that the source was a journal and that the article was obtained from the JSTOR database. One can also elect to see a link to import a paper to a citation manager such as EndNote. However, full bibliographic results are not shown, one cannot search within results, and bibliographic details must be exported one paper at a time. The lower panel shows partial results for a similar search in the Web of Science. The search was limited to the Education and Education Research category in the Social Sciences Citation Index (SSCI). Here, the full bibliographic details are provided, it is possible to search within results, and a list of results can be exported to EndNote Web. Due to the more limited coverage of the SSCI database, the search results differ substantially from the Google Scholar results. [Insert Figure 1 about here.}
12 11 Prior Studies on Google Scholar A great deal of research attention has been paid in the library and information sciences to Google Scholar s adequacy as a database of scholarly materials. For example, how well does it cover scholarship in various fields, compared with the Web of Science, Scopus, and other databases? Another line of research consists of analyses of citations between the documents in its database. How does the influence of an article, scholar, or journal, as estimated by Google Scholar citations, compare with Web of Science citations? Both types of question are important for researchers in education. To date, there are few studies in education, but there are some useful studies in other fields. Early studies were critical of the coverage of scholarship provided by Google Scholar. For example, Noruzi (2005) searched for the word webometrics, which was introduced in an article in 2005, and then examined all subsequent articles that used the term. The original article had 47 citations in ISI journals that were not detected by Google Scholar (i.e., these journals were not indexed by Google), so Google Scholar was not comprehensive in its coverage of ISI articles. Jacsó (2005b) was more critical, and argued that in 2005 Google Scholar had not indexed millions of articles, noting that the stunning gaps give a false impression of the scholarly coverage of topics and lead to the omission of highly relevant articles by those who need more than just a few pertinent research documents (p. 1). He warned against a developing trend in which many researchers use Google Scholar as their only database: These days, when scientists, administrators, politicians and financial experts need to find comprehensive scholarly information many will turn to Google Scholar to discover only a fragment of the scholarly literature. (p. 3). Meho and Yang (2007) conducted a large-scale comparison of ISI, Scopus, and Google Scholar citations, examining the coverage of more than 1000 scholarly works by 15
13 12 faculty members of the School of Library and Information Science at Indiana University at Bloomington. They found rather small overlaps 59.2% between Scopus and ISI citations, and only 30.8% between ISI and Google Scholar citations. These findings confirm and extend Noruzi s (2005) earlier finding of incompleteness. However, even though gaps are likely to continue to exist, Google s coverage has improved since these early studies, for example by including Elsevier journals from Library and information scientists have also complained that Google Scholar provides much less information about the journals included in its database than other databases, and that the processing of results for further analysis is much more labor-intensive. For example, Meho and Yang (2007) conducted a large-scale comparison of citations using the Web of Science, Scopus, and Google Scholar. They noted that they required 3000 hours of processing for the Google Scholar data manually cleaning, formatting, standardizing, and entering data into EndNote (p. 12), and considered this a major disadvantage over the other databases, which only required a few hundred hours (100 h for ISI and 200 h for Scopus, p. 16). Google has recently added a tool for exporting data to citation managers including EndNote, but fields are limited to those that can be extracted from a paper s reference list entry (authors, title, journal, volume and issue), and do not include traditional metadata such as keywords and the abstract. Jacsó (2005a) complained that Google Scholar fails to incorporate the meticulously tagged metadata offered to it by journal publishers. Turning more specifically to citation analyses, Bauer and Bakkalbasi (2005) conducted a small case study that compared the citation counts provided by the Web of Science, Scopus, and Google Scholar for articles published in the Journal of the American Society for Information Science and Technology in 1985 and For 2000, they did not detect statistical differences
14 13 between the citation counts for the Web of Science and Scopus, but Google Scholar yielded significantly more citations (p <.001). Correlation coefficients between Google Scholar citations and the other two measures exceeded Kousha and Thelwall (2007) studied correlations between ISI citations, citations in Web pages to the URLs of open access articles, and Google Scholar citation counts. They found that correlations between ISI and URL citations were lower than those between ISI and Google Scholar across the disciplines they studied. However, correlation coefficients varied much between fields (e.g., biology, 0.83, and computing, 0.82, compared with education, psychology, and chemistry, all of which were around 0.55). Smith (2008) used data from the 2003/2004 Research Assessment Exercise conducted by New Zealand s Tertiary Education Commission to benchmark Google Scholar citation counts. In this exercise, academic staff members at the eight universities in New Zealand submitted portfolios from the previous six years, including publications, contributions to the research environment (e.g., editing journals), and evidence of peer esteem. Disciplinary experts graded the portfolios, and the grades were converted to quality scores. Smith found a very high correlation coefficient of 0.94 between the total quality scores for the eight universities and Google Scholar citations. (The total quality score for a university was the average quality score multiplied by the number of full-time equivalent faculty members at that university.) Finally, Meho and Yang (2008) found a very strong correlation of 0.98 between a union of ISI and Scopus citations and Google Scholar citations. As a result, the ranking of faculty members based on citations was not altered significantly when Google Scholar citations were added to the union of ISI and Scopus citations. In summary, these studies suggest that there are significant differences in the coverage of the three databases, which means that it would be advisable to use more than one database to assess the impact of research output particularly when assessing the research output of an individual
15 14 academic staff member. The strong correlations between Google Scholar citations, ISI citations, and the total quality measure in the research assessment suggest that Google scholar citations can provide an acceptable indicator of impact. Indeed, the correlation coefficients could be used as reliability coefficients to access the validity of Google Scholar citations. Meho and Yang (2007) conclude that the strong correlations render Google Scholar superfluous once ISI and Scopus citations have been used, but one could well turn their conclusion on its head. For example, although the Smith (2008) study was small scale, it suggests that Google Scholar citations could be a proxy for the much more expensive results from the research assessment exercise. Although the correlations are generally high across disciplines, the Kousha and Thelwall (2007) study indicates that they are lower for fields such as education, which suggests that Google Scholar citations could reveal aspects of impact not included in ISI citations for such fields. The remainder of this paper examines the extent to which these patterns are valid for scholarship in the three subfields of education, and explores the advantages Google Scholar may have in covering aspects of impact not covered by Web of Science and Scopus. Methods The data collection involved the selection of a suitable collection of journal articles (the cited articles) and the identification of documents that cite those articles (the citing documents). In establishing both collections, I utilized important information about Google Scholar that is often overlooked by critics: search results are ordered from most important to least important. Thus, the random selection of results is not a useful strategy for analyzing Google Scholar citations. Selecting documents from the first results focuses the study on influential papers and circumvents many problems. For example, Google Scholar often returns more than one version of a document (Jacsó, 2009), but most alternate versions are cited less than the main version, and
16 15 would therefore not be included in the citing documents collection. For the cited articles collection, a sample of scholarship was required that could serve as a benchmark for early to mid-career academic staff. On the assumption that an invitation to contribute a chapter to an international handbook is an indicator that a scholar is recognized for his or her contribution to a field, I selected the first author of all chapters in three handbooks one for each subfield and conducted Google Scholar searches for them, within the social sciences and the period (five years). The first five results from each search that were journal articles were included in the cited articles collection. Thus, the assumption was that the cited articles provided a sample of the best journal articles by accomplished authors. I made several checks to test this assumption (see Table 1). Web searches for official staff profiles at universities and, where available, vitae and other biographical notices, showed that by the end of 2009 (two years after the end of the study period), nearly all of the authors had reached the rank of Associate Professor, and more than 70% that of Professor. 2 I generated two additional measures of impact based on authors ISI publications from the beginning of their careers to the beginning of the study period: the Hirsch index (h index, Hirsch, 2005), and the number of ISI citations for the best-cited article. The h index is determined as follows. If one ranks an author s articles from most to least cited, the first h articles all have at least h citations, and the remaining articles less than h. Hirsch proposes the h index as a measure that combines productivity and the extent to which an author s publications are cited. In contrast, the number of citations of the best-cited article provides an indication of whether an author has at least one widely cited article. Medians for these two indicators are reported in Table 1. Overall, the statistics reported in Table 1 suggest that the cited authors provide an acceptable benchmark for this study. At least for those authors who underwent promotion reviews between
17 and 2009, the cited articles collection is consistent with the performance levels needed for promotion to Associate Professor and Professor, and the typical author had at least one well-cited ISI publication. However, there were substantial differences between the subfields in the extent to which authors relied on publications in journals particularly in ISI journals. This is revealed most clearly by the differences between the numbers of handbook chapters and cited authors, the ISI h indexes, and the citation counts for authors best-cited articles. One would expect an analysis of impact based on ISI data to be more satisfactory for science education than for the other two subfields. For each article in the cited article collection, up to the first 100 unique citing documents were selected for the citing documents collection. A scheme of six document types was used to classify these: article in ISI journal, article in non-isi journal, book/book chapter, thesis, conference paper, and web page. The Web of Science database was used to determine whether a journal was ISI-listed in 2007; information provided by Google Scholar, including the d.o.i., was used to determine the nature of citing documents; and no attempt was made to differentiate between books and book chapters. In many cases, I followed the link that Google Scholar provided to the citing document to verify the nature of that document. In total, there were 5,565 citing documents, of which 5,092 were coded using the six categories (91.5%). The remainder of the citing documents included PowerPoint presentation files, notices, and materials in foreign languages (particularly Russian, Chinese, and Arabic) for which the researcher could not identify the academic nature of the content. 3 As suggested earlier, it is likely that more data cleaning would be required if random sampling were used, at least for the most frequently cited authors. [Insert Table 1 about here] Influence of Journals
18 17 The plots in Figure 2 locate journals in the three subfields along two dimensions: the number of articles identified by Google Scholar that were published in each journal and the average number of Google Scholar citations of those articles. For simplicity, only journals for which at least two cited articles were retrieved are included in the plots. These plots provide a check on the face validity of the results from Google Scholar searches. Do they characterize the influence of journals in a way that agrees with researchers knowledge of a field? They may also be useful to researchers for deciding where to publish their work and developing their publication plans. The first dimension can be interpreted as an indication of a journal s market share; this can be influenced by many factors including whether the journal s intended audience is specialized or general, how long the journal has been publishing, how many papers per year it has space for, and the prestige associated with publishing in that journal. The second dimension the average number of Google Scholar citations per article is influenced by the quality of the papers, but can also be low if the journal began publishing recently. Specifically, if a journal began publishing during the study period, the citation numbers would necessarily be low. There would also be some distortions if Google Scholar did not index certain journals for part of the study period (it only began including Elsevier journals in 2007). The plots show that there were few journals with large market share; across the three subfields, only three journals had more than 10 articles. [Insert Figure 2 about here] Panel A (science education) shows that there were two journals with both large market share and Google Scholar citations: the Journal of Research in Science Teaching (JRST) and Science Education. Both are ISI journals that publish papers across a wide range of topics in science education, are widely regarded as the most influential journals in the field, and consistently have
19 18 high ISI impact factors (in 2007: 1.148, rank 15/105, and 0.936, rank 23/105, respectively). The International Journal of Science Education (IJSE) was next in terms of market share, but had fewer Google Scholar citations, consistent with its lower ISI impact factor (0.541, rank 55/105). One noteworthy journal is Science & Education, which focuses on the history, philosophy, and sociology (HPS) of science and its implications for science education. This is not an ISI journal, but it had a large number of Google Scholar citations per article; its small market share is consistent with its high degree of specialization. A researcher who works on the HPS of science could use the plot to justify why he or she publishes in this journal (high quality, but with a specialized audience). Research in Science Education (RISE) had a small market share, but the number of Google Scholar citations was considerably higher than its ISI impact factor of (rank 85/105) would suggest. Overall, the plot has good face validity: it correctly identifies what are widely regarded as the top few journals in science education, and ranks these similar to the ISI impact factors. Indeed, a linear regression analysis showed that there was a strong linear relationship between ISI impact factors and the combination of Google Scholar citations and market share, R 2 = Using the regression equation, one could estimate that the performance of Science & Education corresponds to an ISI impact factor of 0.498, similar to that of IJSE (slightly less). Two experts in science education were asked to comment on the plot, and both stated that it accurately represented the relative influence of the most important journals in science education. The results for English language education are shown in Panel B. Language education is a much larger subfield than science education and has more journals. There are many specialized journals, but no clear winners in terms of market share. The plot identifies quite a few high impact journals (5 with at least 20 citations per article). The top two journals in terms of Google
20 19 Scholar citations were in the TESOL Quarterly and Language Teaching, both of which were non-isi journals on the teaching of English in The next three journals were ISI journals in the Linguistics category: Modern Language Journal (impact factor 0.793, rank 25/55 in the category), Applied Linguistics (impact factor 1.178, rank 17/55), and Journal of Second Language Writing (impact factor 0.500, rank 36/55). Of the remaining journals in the plot, five were ISI journals in Linguistics and one an ISI journal in the Education and Educational Research category; the impact factors of these journals ranged from to All of the ISI journals with impact factors of at least 1.0 had at least 15 Google Scholar citations per article. This plot also has good face validity. However, for ISI journals the relationship between impact factors and the Google Scholar data is less clear than for science education. Two experts in language education said the plot provided a good depiction of the most important journals in English language education, although one noted the absence of Language Learning (an ISI journal, impact factor 0.417, rank 42/55 in linguistics), and suggested that the plot seemed to do a better job of capturing scholarship on the application of linguistics to English language education than the subfield of English language education as a whole. Finally, Panel C shows the results for educational technology. Of the four journals with the greatest influence in terms of Google Scholar citations and market share, three were ISI journals: JRST (impact factor 1.148, rank 15/105), Educational Technology Research and Development (ETRD; impact factor 0.270, rank 86/105), and American Educational Research Journal (impact factor 1.930, rank 6/105). These journals tend to publish rigorous studies that examine the intersection of cognition, context, and the use of educational technology. Although the use of technology is important, the primary emphasis in these studies is on cognition and learning outcomes. Examples are studies that examine computers as cognitive tools (Lajoie & Derry,
21 ), and the use of computers to support inquiry learning, particularly in science and mathematics. Increasingly, work in this area is characterized as belonging to the learning sciences. However, in the subfield of educational technology there are also many researchers who foreground the use of technology more, such as through the development and improvement of technology, the study of examples of the use of technology, and the study of the large-scale uptake of technology. Examples of journals in the plot that represent this focus are the British Journal of Educational Technology (ISI impact factor 0.574, rank 46/105) and TechTrends, both of which are considered important journals in the field. No linear relationship between ISI impact factors and the Google Scholar data was found. Two experts in educational technology agreed that the plot correctly characterizes important aspects of scholarship in this subfield. However, they noted that it did not include several important journals, including Computers & Education (impact factor 1.602, rank 8/105), Journal of the Learning Sciences (impact factor 1.571, rank 9/105) and Journal of Computer-Assisted Learning (impact factor 0.800, rank 29/105). Failure to detect these journals can be explained by the fact that the first journal was not indexed before 2007 and the small sample size for this subfield. Nature of citing documents The results of coding the citing documents are shown in Figure 3. There was a clear advantage to publishing in ISI journals in all three subfields. For science education and educational technology there were, on average, 2.3 times as many Google Scholar citations to an article published in an ISI journal than to an article published in a non-isi journal; for English language education this ratio was 1.7. Furthermore, publishing in an ISI journal was accompanied by greater Google Scholar citation counts in all document categories except
22 21 conference papers (for science education and English language education). However, although in English language education there was an overall advantage to publishing in ISI journals, it was not uniformly available to scholars in this subfield, as eight of the nine ISI journals identified were in linguistics. There were two substantial differences between the subfields. In English language education, journal articles received more Google Scholar citations from books and book chapters than in the other subfields, and in educational technology more conference papers fared the same. These results are mentioned frequently in conversations about impact factors by researchers from these subfields. Note that in total there were relatively few citations from Web pages (8.9%), so the vast majority of Google Scholar citations were from scholarly materials. [Insert Figure 3 about here] Growth in Google Scholar citations It would be useful for performance evaluations to have a rough indication of how quickly Google Scholar citations accumulate over time. Determining this would require a longitudinal study of citations. As a proxy to the growth in citations, I examined Google Scholar citation counts as a function of the number of years since a paper s publication. Thus, papers published in 2003 would generally be expected to have received more Google Scholar citations than papers published in 2005, but this does not show how citations to a specific paper developed. The results are thus suggestive and would require longitudinal study to verify. There were only minor differences between the subfields, and the results were combined to improve the statistics; they are shown in Figure 4. Three trends were tested linear, quadratic, and exponential; a linear trend with a slope of approximately 3.9 Google Scholar citations per year and vertical intercept
23 22 of -4.4 had the best fit (R 2 = 0.989). Thus, the average journal article received 7.3 Google Scholar citations three years after its publication, and 19.0 after six years. One could assume articles with substantially higher Google Scholar citations e.g., 60 after six years to be more influential. [Insert Figure 4 about here] Relationships between Google Scholar, ISI, and Scopus citations Meho and Yang (2007) concluded that Google Scholar citations did not significantly alter the ranking of academic staff members based on the union of ISI and Scopus citations. Therefore, I compared Google Scholar, ISI, and Scopus citation counts. The means and standard errors of the citation counts are shown in Table 2. As expected, the average citation counts for Google Scholar were several times larger than for ISI, Scopus, and the union of ISI and Scopus. This was also the case for the standard errors. However, it is interesting that there were only minor differences between the means for the three subfields for the Google Scholar data, with means ranging from 12.3 for science education to 13.1 for educational technology (Cohen s ds 0.3). In contrast, there were large gaps between the subfields for ISI citations, which were reduced only slightly when they were combined with Scopus citations (Cohen s ds 2.3 and 2.0, respectively). These results suggest that Google Scholar citations may provide a more equitable measure of impact across the subfields than ISI or Scopus citations, or their combination. Spearman correlation coefficients between Google Scholar citations and ISI citations were approximately 0.75 for all three subfields and were modified only slightly when ISI citations were combined with Scopus citations (range: 0.70 to 0.75). These values are much less than the very high value of 0.98 reported by Meho and Yang (2007), and suggest that the Google Scholar data are not redundant once ISI and Scopus citations
24 23 have been taken into account. As suggested by Figure 3, the additional information contained in the Google Scholar citations was not noise but impact in books/book chapters, theses, and conference papers. Conclusion and implications This article began with the observation that ISI impact factors for fields such as education are low compared to those in scientific fields, and that additional information about the influence of research output would be useful for the performance assessments of early to mid-career academics, as well as other assessments of research output. A case study was then presented in which Google Scholar was used for a citation analysis of journal articles in three subfields of education. The sample of cited articles was intended to provide a benchmark of scholarship by reasonably accomplished scholars. The majority of these authors had reached the rank of Professor by 2009, and the typical author had at least one article in an ISI publication that was cited extensively (see Table 1). The Google Scholar data had several advantages that were more or less independent of subfield. First, it provided an acceptable characterization of scholarship in the three subfields, at least in broad strokes. The analysis identified the most influential journals in each subfield, although it missed several of significance in educational technology. Plots such as those in Figure 1 could be useful to academic staff members for gauging the influence of journals that are not included in the Web of Science or have low ISI impact factors. Second, the rate at which Google Scholar citations accumulated was relatively low and approximately the same in each subfield. As a result, performance evaluations based on Google Scholar data may not involve excessively large numbers of citations. This finding also suggests that Google Scholar citations may provide a more equitable measure of impact across subfields than ISI citations, which do not
25 24 accumulate at similar rates (see Table 2). While ISI citation counts as indications of performance disadvantage scholars in English language education and educational technology relative to scholars in science education, Google Scholar citation counts do not. Third, the vast majority of Google Scholar citations were from peer reviewed journal articles, books and book chapters, theses, and conference papers. In no subfield was the percentage of citations from Web pages greater than 13%. Scholarship in science education was the most reliant on ISI publications, and ISI and Google Scholar citations provided similar pictures of the impact of journal articles. Although there were substantially more Google Scholar citations than ISI citations, Google Scholar citations ranked journals similarly to ISI citations. As a result, the Google Scholar and ISI data lead to the same recommendation for maximizing impact in science education publish in the journals with the greatest number of Google Scholar citations and greatest market share. Following Meho and Yang (2007), one could conclude that there is little advantage to using Google Scholar. However, one could also argue that Google Scholar does a satisfactory job assessing the impact of research output in science education. In addition, Google Scholar data could be used to interpret the influence of journals that are not included in the Web of Science. For example, I estimated the ISI impact factor for Science & Education, and suggested that it was similar to that of IJSE for In fields with a greater number of Web of Science journals, such as experimental psychology, the relationship between Google Scholar and ISI citation counts may be stronger and the need for estimating the impact of non-isi journals less pressing. In those fields, Google Scholar data would be redundant from an empirical perspective but would still have the advantage of being freely available on the Web.
26 25 For English language education and educational technology it was not possible to predict ISI impact factors from Google Scholar data, but the data revealed important aspects of scholarship in those subfields: the significance of publications in books and book chapters for English language education, and that of conference papers for educational technology. Researchers no longer need to rely on anecdotal evidence to argue that such publications are important in their subfields, but can support their arguments with empirical evidence. This was not possible before Google Scholar due to the lack of data for non-isi publications. The ability to make evidencebased arguments for the nature of scholarship in one s field is also particularly important for scholars who work in newly developing areas, before journals to serve those areas exists. Google Scholar data also open up the possibility of examining scholarship across areas of education, and beyond it. Education is often said to be a diverse field, but such statements rarely surpass the anecdotal. The ability to gauge the impact of journals not included in the Web of Science, or which have low ISI impact factors, is important in professional fields like education, where there is a need to document impact on policy and professional practice as well as research. In this respect, Goodyear et al. (2009) recently showed that Google Scholar data represented the importance of Educational Leadership and Phi Delta Kappan better than ISI impact factors, based on ratings of journals by experts in education. Although the study reported here showed that Google Scholar is a promising tool for assessing the impact of journal articles, it had several important limitations. As it was a smallscale and exploratory case study, no attempt was made to generalize beyond the data set (Schaffer & Serlin, 2004). It involved approximately 5,000 documents that cited journal articles published by 112 authors. In contrast, Meho and Yang (2007) studied approximately 10,000
27 26 documents, which cited the publications of 15 authors. The cut-off for including a journal in the plots in Figure 2 was low (two articles), thus the statistical errors in the means plotted in Figure 2 are relatively large for journals with small market shares. It would be useful to know whether the observed patterns persist in a large-scale study that would make a higher cut-off value possible (e.g., 10 articles). In addition, it would be useful to expand the sample of authors for educational technology to be able to capture more of the complexity of that subfield. I used the second edition of a handbook for this area published in 2004, which was a substantial update of the 1996 edition. However, a third and expanded edition was published in 2007, and many other handbooks focus on specific aspects of educational technology, such as e-learning, the use of information technology in K-12 education, and Web 2.0 technologies. These aspects of work in the subfield were not captured by the present analysis, but reflect a dramatic increase in research and development on educational technology in the last decade. It also is important to acknowledge that many information scientists have continued to be critical of the adequacy of Google Scholar as a tool for indexing scholarly materials. For example, Jacsó (2005b, 2009) argued that there are many errors in Google Scholar results, extensive duplication, and inflated citation counts, and that these result from the lack of use of metadata that publishers provide to Google. He demonstrates that an author search for the phantom author P. Login ( Please Login, an element on a Web form) yields many results that are shown as cited by legitimate papers, and argues that these citations remove citations from real authors. He also reports that an author search for his own name yielded 578 documents, but that 403 of these were taken from citations to his papers (these are identified as such by the [Citation] tag in Google Scholar). However, although the reader can easily verify that these problems exist, little is known about their scale relative to total Google Scholar database. Google
28 27 has somewhat different goals than Thomson Reuters, and is attempting to record the world s information and make it accessible to those who need it, which requires a balance between accuracy, search speed, and simplicity of use (Auletta, 2009). The important question is the extent to which errors lead to serious distortions and invalid judgments about impact. In the present study, few phantom results were found and any duplicate results were excluded from the analysis. The data cleaning required was not tedious or difficult, but this may not be the case without the decision to focus on the most important results from Google Scholar searches. Nevertheless, more research is required on the quality of Google Scholar data. In closing, given the subjectivity involved in sampling and the data cleaning issues, it would clearly be undesirable to expect individual researchers to conduct their own analyses of their subfields using Google scholar data. However, organizations such as the American Educational Research Association and national bodies overseeing universities could periodically conduct large-scale studies that would provide benchmarks for the interpretation of Google Scholar data, similar to how Thomson Reuters provides annual reports of citation data for the Web of Science. With some data cleaning to eliminate errors, it would then be feasible for individual researchers to use Google Scholar data to analyze their contributions to their fields. Acknowledgments The author is grateful to members of the Faculty of Education at the University of Hong Kong for stimulating discussions on how to measure the impact of research output, to six experts who commented on Figure 2, and to Li Dongyu for assistance with the data analysis. Constructive comments from three reviewers of a draft of the article are also gratefully acknowledged. Funding
29 28 This work was supported by a small grant from the Faculty Research Funding Scheme of the Faculty of Education at the University of Hong Kong. Notes 1 A variety of terms are used in the literature: Science Citation Index (SCI), Social Science Citation Index (SSCI), Web of Science, and Web of Knowledge. For simplicity, in this article ISI and Web of Science are treated as being synonymous with all of these terms. 2 Of the 118 authors for which Google Scholar returned at least one journal article, academic rank could be determined for 112. Two raters independently identified the academic ranks of all 112 authors, leading to an inter-rater reliability of 0.83 (Cohen s kappa). 3 A research assistant independently coded 200 citations. The inter-rater reliability was 0.96 (Cohen s kappa). 4 One can represent each point in Figure 2 with a vector; the length of that vector can be interpreted as an estimate of impact from the Google Scholar data. As Langville and Meyer (2006) explain, mathematicians use a variety of measures of vector length, including the 1-norm (sum of components) and the more familiar 2-norm (square root of the sum of the squares of the components). I used the 1-norm, which yielded slightly better results. The regression equation was ISI-impact factor = norm vector length. Substituting the Google Scholar data for IJSE data suggested an ISI impact factor of A linear relationship of this kind did not exist for the other two subfields. References Adler, N. J., & Harzing, A. W. (2009). When knowledge wins: Transcending the sense and nonsense of academic rankings. Academy of Management Learning & Education, 8(1), Auletta, K. (2009). Googled: The end of the world as we know it. New York, NY: Penguin Press.
30 Bauer, K., & Bakkalbasi, N. (2005). An examination of criterion counts in a new scholarly communication environment. D-Lib Magazine, 11(9). Retrieved from Brin, S., & Page, L. (1998). The anatomy of a large-scale hypertextual Web search engine. Computer Networks and ISDN Systems, 30, Craven, P. (n.d.). Google s PageRank explained, from Goodyear, r. K., Brewer, D. J., Symms-Gallagher, K., Tracey, T. J. G., Claiborn, C. D., Lichtenberg, J. W., et al. (2009). The intellectual foundations of education: Core journals and their impact on scholarship and practice. Educational Researcher, 38(9), Google (2009). Corporate information: Technology overview. Retrieved June 25, 2009, from Hirsch, J. (2005). An index to quantify an individual s scientific research output. Proceedings of the National Academy of Sciences of the United States of America, 102(46), Jacsó, P. (2005a). As we may search comparison of major features of the Web of Science, Scopus, and Google Scholar citation-based and citation-enhanced databases. Current Science, 89, Jacsó, P. (2005b). Google Scholar: The pros and the cons. Online Information Review, 29(2), Jacsó, P. (2009). Google Scholar s ghost authors, lost authors, and other problems: Why the popular tool can t be used to analyze the publishing performance and impact of researchers. Library Journal(9/24/2009). Kousha, K., & Thelwall, M. (2007). Google Scholar citations and Google Web/URL citations: A multi-discipline exploratory analysis. Journal of the American Society for Information Science and Technology, 58(7), Lajoie, S., & Derry, S. J. (1993). Computers as cognitive tools. Mahwah, NJ: Lawrence Erlbaum Associates. Langville, A. N., & Meyer, C. D. (2006). PageRank and beyond: The science of search engine rankings. Princeton, NJ: Princeton University Press. Maslov, S., & Redner, S. (2008). Promise and pitfalls of extending Google s PageRank algorithm to citation networks. The Journal of Neuroscience, 28, Meho, L. I., & Yang, K. (2007). Impact of data sources on citation counts and rankings of LIS faculty: Web of Science versus Scopus and Google Scholar. Journal of the American Society for Information Science and Technology, 58(13), Noruzi, A. (2005). Google Scholar: The new generation of citation indexes. Libri, 2005(55), Thomson Reuters (n.d.1). The Thomson Reuters impact factor. Retrieved July 2, 2009, from Thomson Reuters (n.d.2). Journal citations reports notices. Retrieved January 11, 2010, from Schaffer, D. W., & Serlin, R. C. (2004). What good are statistics that don t generalize? Educational Researcher, 33(9), Smith, A. G. (2008). Benchmarking Google Scholar with the New Zealand PBRF research assessment exercise. Scientometrics, 74(2),
31 30 Keywords: faculty development, research impact, Google Scholar Author note: JAN VAN AALST is an associate professor in the Faculty of Education, the University of Hong Kong, Pokfulum, Hong Kong, SAR, China; His main research interests are in classroom practices and assessment that involve computer-supported learning in science education. FIGURE 1. Sample search results from Google scholar and Web of Science (2 pages) FIGURE 2. Number of articles published and the average number of Google Scholar citations to them (3 pages) FIGURE 3. Average Google Scholar citations from ISI journals, non-isi journals, book chapter, thesis, conference paper, or web page, to articles published in non-isi and ISI journals (3 pages) FIGURE 4. Growth of Google Scholar citations
32 31
33 32
Lokman I. Meho and Kiduk Yang School of Library and Information Science Indiana University Bloomington, Indiana, USA
 Date : 27/07/2006 Multi-faceted Approach to Citation-based Quality Assessment for Knowledge Management Lokman I. Meho and Kiduk Yang School of Library and Information Science Indiana University Bloomington,
Embedding Librarians into the STEM Publication Process. Scientists and librarians both recognize the importance of peer-reviewed scholarly
 Embedding Librarians into the STEM Publication Process Anne Rauh and Linda Galloway Introduction Scientists and librarians both recognize the importance of peer-reviewed scholarly literature to increase
Bibliometric evaluation and international benchmarking of the UK s physics research
 An Institute of Physics report January 2012 Bibliometric evaluation and international benchmarking of the UK s physics research Summary report prepared for the Institute of Physics by Evidence, Thomson
Using Bibliometric Analyses for Evaluating Leading Journals and Top Researchers in SoTL
 Georgia Southern University Digital Commons@Georgia Southern SoTL Commons Conference SoTL Commons Conference Mar 26th, 2:00 PM - 2:45 PM Using Bibliometric Analyses for Evaluating Leading Journals and
USING THE UNISA LIBRARY S RESOURCES FOR E- visibility and NRF RATING. Mr. A. Tshikotshi Unisa Library
 USING THE UNISA LIBRARY S RESOURCES FOR E- visibility and NRF RATING Mr. A. Tshikotshi Unisa Library Presentation Outline 1. Outcomes 2. PL Duties 3.Databases and Tools 3.1. Scopus 3.2. Web of Science
What is bibliometrics?
 Bibliometrics as a tool for research evaluation Olessia Kirtchik, senior researcher Research Laboratory for Science and Technology Studies, HSE ISSEK What is bibliometrics? statistical analysis of scientific
1.1 What is CiteScore? Why don t you include articles-in-press in CiteScore? Why don t you include abstracts in CiteScore?
 June 2018 FAQs Contents 1. About CiteScore and its derivative metrics 4 1.1 What is CiteScore? 5 1.2 Why don t you include articles-in-press in CiteScore? 5 1.3 Why don t you include abstracts in CiteScore?
Where to present your results. V4 Seminars for Young Scientists on Publishing Techniques in the Field of Engineering Science
 Visegrad Grant No. 21730020 http://vinmes.eu/ V4 Seminars for Young Scientists on Publishing Techniques in the Field of Engineering Science Where to present your results Dr. Balázs Illés Budapest University
2013 Environmental Monitoring, Evaluation, and Protection (EMEP) Citation Analysis
 Citation Analysis") 2013 Environmental Monitoring, Evaluation, and Protection (EMEP) Citation Analysis Final Report Prepared for: The New York State Energy Research and Development Authority Albany, New York Patricia Gonzales
2013 Environmental Monitoring, Evaluation, and Protection (EMEP) Citation Analysis Final Report Prepared for: The New York State Energy Research and Development Authority Albany, New York Patricia Gonzales
Citation & Journal Impact Analysis
 Citation & Journal Impact Analysis Several University Library article databases may be used to gather citation data and journal impact factors. Find them at library.otago.ac.nz under Research. Citation
Impact Factors: Scientific Assessment by Numbers
 Impact Factors: Scientific Assessment by Numbers Nico Bruining, Erasmus MC, Impact Factors: Scientific Assessment by Numbers I have no disclosures Scientific Evaluation Parameters Since a couple of years
ISSN: ISO 9001:2008 Certified International Journal of Engineering Science and Innovative Technology (IJESIT) Volume 3, Issue 2, March 2014
 Volume 3, Issue 2, March 2014") Are Some Citations Better than Others? Measuring the Quality of Citations in Assessing Research Performance in Business and Management Evangelia A.E.C. Lipitakis, John C. Mingers Abstract The quality of
Are Some Citations Better than Others? Measuring the Quality of Citations in Assessing Research Performance in Business and Management Evangelia A.E.C. Lipitakis, John C. Mingers Abstract The quality of
A Citation Analysis of Articles Published in the Top-Ranking Tourism Journals ( )
") University of Massachusetts Amherst ScholarWorks@UMass Amherst Tourism Travel and Research Association: Advancing Tourism Research Globally 2012 ttra International Conference A Citation Analysis of Articles
University of Massachusetts Amherst ScholarWorks@UMass Amherst Tourism Travel and Research Association: Advancing Tourism Research Globally 2012 ttra International Conference A Citation Analysis of Articles
THE USE OF THOMSON REUTERS RESEARCH ANALYTIC RESOURCES IN ACADEMIC PERFORMANCE EVALUATION DR. EVANGELIA A.E.C. LIPITAKIS SEPTEMBER 2014
 THE USE OF THOMSON REUTERS RESEARCH ANALYTIC RESOURCES IN ACADEMIC PERFORMANCE EVALUATION DR. EVANGELIA A.E.C. LIPITAKIS SEPTEMBER 2014 Agenda Academic Research Performance Evaluation & Bibliometric Analysis
Keywords: Publications, Citation Impact, Scholarly Productivity, Scopus, Web of Science, Iran.
 International Journal of Information Science and Management A Comparison of Web of Science and Scopus for Iranian Publications and Citation Impact M. A. Erfanmanesh, Ph.D. University of Malaya, Malaysia
Citation analysis: Web of science, scopus. Masoud Mohammadi Golestan University of Medical Sciences Information Management and Research Network
 Citation analysis: Web of science, scopus Masoud Mohammadi Golestan University of Medical Sciences Information Management and Research Network Citation Analysis Citation analysis is the study of the impact
Introduction to Citation Metrics
 Introduction to Citation Metrics Library Tutorial for PC5198 Geok Kee slbtgk@nus.edu.sg 6 March 2014 1 Outline Searching in databases Introduction to citation metrics Journal metrics Author impact metrics
DISCOVERING JOURNALS Journal Selection & Evaluation
 DISCOVERING JOURNALS Journal Selection & Evaluation 28 January 2016 KOH AI PENG ACTING DEPUTY CHIEF LIBRARIAN SCImago to evaluate journals indexed in Scopus Journal Citation Reports (JCR) - to evaluate
Citation Analysis. Presented by: Rama R Ramakrishnan Librarian (Instructional Services) Engineering Librarian (Aerospace & Mechanical)
 Engineering Librarian (Aerospace & Mechanical)") Citation Analysis Presented by: Rama R Ramakrishnan Librarian (Instructional Services) Engineering Librarian (Aerospace & Mechanical) Learning outcomes At the end of this session: You will be able to navigate
Citation Analysis Presented by: Rama R Ramakrishnan Librarian (Instructional Services) Engineering Librarian (Aerospace & Mechanical) Learning outcomes At the end of this session: You will be able to navigate
Bibliometric analysis of the field of folksonomy research
 This is a preprint version of a published paper. For citing purposes please use: Ivanjko, Tomislav; Špiranec, Sonja. Bibliometric Analysis of the Field of Folksonomy Research // Proceedings of the 14th
The use of bibliometrics in the Italian Research Evaluation exercises
 The use of bibliometrics in the Italian Research Evaluation exercises Marco Malgarini ANVUR MLE on Performance-based Research Funding Systems (PRFS) Horizon 2020 Policy Support Facility Rome, March 13,
Journal Citation Reports on the Web. Don Sechler Customer Education Science and Scholarly Research
 Journal Citation Reports on the Web Don Sechler Customer Education Science and Scholarly Research don.sechler@thomsonreuters.com Introduction JCR distills citation trend data for over 10,000 journals from
Your research footprint:
 Your research footprint: tracking and enhancing scholarly impact Presenters: Marié Roux and Pieter du Plessis Authors: Lucia Schoombee (April 2014) and Marié Theron (March 2015) Outline Introduction Citations
EVALUATING THE IMPACT FACTOR: A CITATION STUDY FOR INFORMATION TECHNOLOGY JOURNALS
 EVALUATING THE IMPACT FACTOR: A CITATION STUDY FOR INFORMATION TECHNOLOGY JOURNALS Ms. Kara J. Gust, Michigan State University, gustk@msu.edu ABSTRACT Throughout the course of scholarly communication,
CITATION INDEX AND ANALYSIS DATABASES
 1. DESCRIPTION OF THE MODULE CITATION INDEX AND ANALYSIS DATABASES Subject Name Paper Name Module Name /Title Keywords Library and Information Science Information Sources in Social Science Citation Index
BIBLIOMETRIC REPORT. Bibliometric analysis of Mälardalen University. Final Report - updated. April 28 th, 2014
 BIBLIOMETRIC REPORT Bibliometric analysis of Mälardalen University Final Report - updated April 28 th, 2014 Bibliometric analysis of Mälardalen University Report for Mälardalen University Per Nyström PhD,
Comprehensive Citation Index for Research Networks
 This article has been accepted for publication in a future issue of this ournal, but has not been fully edited. Content may change prior to final publication. Comprehensive Citation Inde for Research Networks
NYU Scholars for Individual & Proxy Users:
 NYU Scholars for Individual & Proxy Users: A Technical and Editorial Guide This NYU Scholars technical and editorial reference guide is intended to assist individual users & designated faculty proxy users
Measuring Academic Impact
 Measuring Academic Impact Eugene Garfield Svetla Baykoucheva White Memorial Chemistry Library sbaykouc@umd.edu The Science Citation Index (SCI) The SCI was created by Eugene Garfield in the early 60s.
CITATION ANALYSES OF DOCTORAL DISSERTATION OF PUBLIC ADMINISTRATION: A STUDY OF PANJAB UNIVERSITY, CHANDIGARH
 University of Nebraska - Lincoln DigitalCommons@University of Nebraska - Lincoln Library Philosophy and Practice (e-journal) Libraries at University of Nebraska-Lincoln November 2016 CITATION ANALYSES
and Beyond How to become an expert at finding, evaluating, and organising essential readings for your course Tim Eggington and Lindsey Askin
 and Beyond How to become an expert at finding, evaluating, and organising essential readings for your course Tim Eggington and Lindsey Askin Session Overview Tracking references down: where to look for
Google Scholar and ISI WoS Author metrics within Earth Sciences subjects. Susanne Mikki Bergen University Library
 Google Scholar and ISI WoS Author metrics within Earth Sciences subjects Susanne Mikki Bergen University Library My first steps within bibliometry Research question How well is Google Scholar performing
What is Web of Science Core Collection? Thomson Reuters Journal Selection Process for Web of Science
 What is Web of Science Core Collection? Thomson Reuters Journal Selection Process for Web of Science Citation Analysis in Context: Proper use and Interpretation of Impact Factor Some Common Causes for
Citation-Based Indices of Scholarly Impact: Databases and Norms
 Citation-Based Indices of Scholarly Impact: Databases and Norms Scholarly impact has long been an intriguing research topic (Nosek et al., 2010; Sternberg, 2003) as well as a crucial factor in making consequential
Bibliometric Rankings of Journals Based on the Thomson Reuters Citations Database
 Instituto Complutense de Análisis Económico Bibliometric Rankings of Journals Based on the Thomson Reuters Citations Database Chia-Lin Chang Department of Applied Economics Department of Finance National
Impact of Data Sources on Citation Counts and Rankings of LIS Faculty: Web of Science Versus Scopus and Google Scholar
 Impact of Data Sources on Citation Counts and Rankings of LIS Faculty: Web of Science Versus Scopus and Google Scholar Lokman I. Meho and Kiduk Yang School of Library and Information Science, Indiana University,
Workshop Training Materials
 Workshop Training Materials http://libguides.nus.edu.sg/researchimpact/workshop Recommended browsers 1. 2. Enter your NUSNET ID and password when prompted 2 Research Impact Measurement and You Basic Citation
Professor Birger Hjørland and associate professor Jeppe Nicolaisen hereby endorse the proposal by
 Project outline 1. Dissertation advisors endorsing the proposal Professor Birger Hjørland and associate professor Jeppe Nicolaisen hereby endorse the proposal by Tove Faber Frandsen. The present research
A Correlation Analysis of Normalized Indicators of Citation
 1 2 3 4 5 6 7 8 9 10 11 12 13 14 15 16 17 18 19 20 21 22 23 24 25 26 27 28 29 30 31 32 33 34 35 36 37 38 39 40 41 42 43 44 45 Article A Correlation Analysis of Normalized Indicators of Citation Dmitry
Citation Metrics. From the SelectedWorks of Anne Rauh. Anne E. Rauh, Syracuse University Linda M. Galloway, Syracuse University.
 From the SelectedWorks of Anne Rauh April 4, 2013 Citation Metrics Anne E. Rauh, Syracuse University Linda M. Galloway, Syracuse University Available at: https://works.bepress.com/anne_rauh/22/ Citation
Rawal Medical Journal An Analysis of Citation Pattern
 Sounding Board Rawal Medical Journal An Analysis of Citation Pattern Muhammad Javed*, Syed Shoaib Shah** From Shifa College of Medicine, Islamabad, Pakistan. *Librarian, **Professor and Head, Forensic
AN OVERVIEW ON CITATION ANALYSIS TOOLS. Shivanand F. Mulimani Research Scholar, Visvesvaraya Technological University, Belagavi, Karnataka, India.
 Abstract: AN OVERVIEW ON CITATION ANALYSIS TOOLS 1 Shivanand F. Mulimani Research Scholar, Visvesvaraya Technological University, Belagavi, Karnataka, India. 2 Dr. Shreekant G. Karkun Librarian, Basaveshwar
Corso di dottorato in Scienze Farmacologiche Information Literacy in Pharmacological Sciences 2018 WEB OF SCIENCE SCOPUS AUTHOR INDENTIFIERS
 WEB OF SCIENCE SCOPUS AUTHOR INDENTIFIERS 4th June 2018 WEB OF SCIENCE AND SCOPUS are bibliographic databases multidisciplinary databases citation databases CITATION DATABASES contain bibliographic records
The Financial Counseling and Planning Indexing Project: Establishing a Correlation Between Indexing, Total Citations, and Library Holdings
 The Financial Counseling and Planning Indexing Project: Establishing a Correlation Between Indexing, Total Citations, and Library Holdings Paul J. Kelsey The researcher hypothesized that increasing the
Complementary bibliometric analysis of the Health and Welfare (HV) research specialisation
 research specialisation") April 28th, 2014 Complementary bibliometric analysis of the Health and Welfare (HV) research specialisation Per Nyström, librarian Mälardalen University Library per.nystrom@mdh.se +46 (0)21 101 637 Viktor
April 28th, 2014 Complementary bibliometric analysis of the Health and Welfare (HV) research specialisation Per Nyström, librarian Mälardalen University Library per.nystrom@mdh.se +46 (0)21 101 637 Viktor
NYU Scholars for Department Coordinators:
 NYU Scholars for Department Coordinators: A Technical and Editorial Guide This NYU Scholars technical and editorial reference guide is intended to assist editors and coordinators for multiple faculty members
Suggested Publication Categories for a Research Publications Database. Introduction
 Suggested Publication Categories for a Research Publications Database Introduction A: Book B: Book Chapter C: Journal Article D: Entry E: Review F: Conference Publication G: Creative Work H: Audio/Video
Research Evaluation Metrics. Gali Halevi, MLS, PhD Chief Director Mount Sinai Health System Libraries Assistant Professor Department of Medicine
 Research Evaluation Metrics Gali Halevi, MLS, PhD Chief Director Mount Sinai Health System Libraries Assistant Professor Department of Medicine Impact Factor (IF) = a measure of the frequency with which
Discussing some basic critique on Journal Impact Factors: revision of earlier comments
 Scientometrics (2012) 92:443 455 DOI 107/s11192-012-0677-x Discussing some basic critique on Journal Impact Factors: revision of earlier comments Thed van Leeuwen Received: 1 February 2012 / Published
Web of Science Unlock the full potential of research discovery
 Web of Science Unlock the full potential of research discovery Hungarian Academy of Sciences, 28 th April 2016 Dr. Klementyna Karlińska-Batres Customer Education Specialist Dr. Klementyna Karlińska- Batres
Complementary bibliometric analysis of the Educational Science (UV) research specialisation
 research specialisation") April 28th, 2014 Complementary bibliometric analysis of the Educational Science (UV) research specialisation Per Nyström, librarian Mälardalen University Library per.nystrom@mdh.se +46 (0)21 101 637 Viktor
April 28th, 2014 Complementary bibliometric analysis of the Educational Science (UV) research specialisation Per Nyström, librarian Mälardalen University Library per.nystrom@mdh.se +46 (0)21 101 637 Viktor
F. W. Lancaster: A Bibliometric Analysis
 F. W. Lancaster: A Bibliometric Analysis Jian Qin Abstract F. W. Lancaster, as the most cited author during the 1970s to early 1990s, has broad intellectual influence in many fields of research in library
INTRODUCTION TO SCIENTOMETRICS. Farzaneh Aminpour, PhD. Ministry of Health and Medical Education
 INTRODUCTION TO SCIENTOMETRICS Farzaneh Aminpour, PhD. aminpour@behdasht.gov.ir Ministry of Health and Medical Education Workshop Objectives Definitions & Concepts Importance & Applications Citation Databases
Alfonso Ibanez Concha Bielza Pedro Larranaga
 Relationship among research collaboration, number of documents and number of citations: a case study in Spanish computer science production in 2000-2009 Alfonso Ibanez Concha Bielza Pedro Larranaga Abstract
Microsoft Academic is one year old: the Phoenix is ready to leave the nest
 Microsoft Academic is one year old: the Phoenix is ready to leave the nest Anne-Wil Harzing Satu Alakangas Version June 2017 Accepted for Scientometrics Copyright 2017, Anne-Wil Harzing, Satu Alakangas
Research metrics. Anne Costigan University of Bradford
 Research metrics Anne Costigan University of Bradford Metrics What are they? What can we use them for? What are the criticisms? What are the alternatives? 2 Metrics Metrics Use statistical measures Citations
PUBLIKASI JURNAL INTERNASIONAL
 PUBLIKASI JURNAL INTERNASIONAL Tips (no trick in science) Ethics Monitoring Cited paper Journal Writing Paper 20 May 2015 Copyright (C) 2012 Sarwoko Mangkoedihardjo 1 Ethics (or Ended) Authorship Contribute
An Introduction to Bibliometrics Ciarán Quinn
 An Introduction to Bibliometrics Ciarán Quinn What are Bibliometrics? What are Altmetrics? Why are they important? How can you measure? What are the metrics? What resources are available to you? Subscribed
Assessing researchers performance in developing countries: is Google Scholar an alternative?
 Assessing researchers performance in developing countries: is Google Scholar an alternative? By Omwoyo Bosire Onyancha* (UNISA) and Dennis N. Ocholla** (University of Zululand) *b_onyancha@yahoo.com, **docholla@pan.uzulu.ac.za
ABOUT ASCE JOURNALS ASCE LIBRARY
 ABOUT ASCE JOURNALS A core mission of ASCE has always been to share information critical to civil engineers. In 1867, then ASCE President James P. Kirkwood addressed the membership regarding the importance
UCSB LIBRARY COLLECTION SPACE PLANNING INITIATIVE: REPORT ON THE UCSB LIBRARY COLLECTIONS SURVEY OUTCOMES AND PLANNING STRATEGIES
 UCSB LIBRARY COLLECTION SPACE PLANNING INITIATIVE: REPORT ON THE UCSB LIBRARY COLLECTIONS SURVEY OUTCOMES AND PLANNING STRATEGIES OCTOBER 2012 UCSB LIBRARY COLLECTIONS SURVEY REPORT 2 INTRODUCTION With
in the Howard County Public School System and Rocketship Education
 Technical Appendix May 2016 DREAMBOX LEARNING ACHIEVEMENT GROWTH in the Howard County Public School System and Rocketship Education Abstract In this technical appendix, we present analyses of the relationship
Battle of the giants: a comparison of Web of Science, Scopus & Google Scholar
 Battle of the giants: a comparison of Web of Science, Scopus & Google Scholar Gary Horrocks Research & Learning Liaison Manager, Information Systems & Services King s College London gary.horrocks@kcl.ac.uk
MURDOCH RESEARCH REPOSITORY
 MURDOCH RESEARCH REPOSITORY This is the author s final version of the work, as accepted for publication following peer review but without the publisher s layout or pagination. The definitive version is
Journal of American Computing Machinery: A Citation Study
 B.Vimala 1 and J.Dominic 2 1 Library, PSGR Krishnammal College for Women, Coimbatore - 641004, Tamil Nadu, India 2 University Library, Karunya University, Coimbatore - 641 114, Tamil Nadu, India E-mail:
Syddansk Universitet. The data sharing advantage in astrophysics Dorch, Bertil F.; Drachen, Thea Marie; Ellegaard, Ole
 Syddansk Universitet The data sharing advantage in astrophysics orch, Bertil F.; rachen, Thea Marie; Ellegaard, Ole Published in: International Astronomical Union. Proceedings of Symposia Publication date:
The largest abstract and citation database
 Scopus 1 The largest abstract and citation database www.scopus.com December 12, 2017 @ National Graduate Institute For Policy Studies Elsevier Japan Scopus 2 Agenda What is Scopus? Basic search workflow
Predicting the Importance of Current Papers
 Predicting the Importance of Current Papers Kevin W. Boyack * and Richard Klavans ** kboyack@sandia.gov * Sandia National Laboratories, P.O. Box 5800, MS-0310, Albuquerque, NM 87185, USA rklavans@mapofscience.com
Analysis of data from the pilot exercise to develop bibliometric indicators for the REF
 February 2011/03 Issues paper This report is for information This analysis aimed to evaluate what the effect would be of using citation scores in the Research Excellence Framework (REF) for staff with
University of Liverpool Library. Introduction to Journal Bibliometrics and Research Impact. Contents
 University of Liverpool Library Introduction to Journal Bibliometrics and Research Impact Contents Journal Citation Reports How to access JCR (Web of Knowledge) 2 Comparing the metrics for a group of journals
Bibliometrics and the Research Excellence Framework (REF)
") Bibliometrics and the Research Excellence Framework (REF) THIS LEAFLET SUMMARISES THE BROAD APPROACH TO USING BIBLIOMETRICS IN THE REF, AND THE FURTHER WORK THAT IS BEING UNDERTAKEN TO DEVELOP THIS APPROACH.
Bibliometrics and the Research Excellence Framework (REF) THIS LEAFLET SUMMARISES THE BROAD APPROACH TO USING BIBLIOMETRICS IN THE REF, AND THE FURTHER WORK THAT IS BEING UNDERTAKEN TO DEVELOP THIS APPROACH.
Citation Analysis: A Comparison of Google Scholar, Scopus, and Web of Science
 Citation Analysis: A Comparison of Google Scholar, Scopus, and Web of Science Kiduk Yang (corresponding author) School of Library and Information Science, Indiana University 1320 East 10th St., LI 011;
The largest abstract and citation database
 Scopus 1 The largest abstract and citation database www.scopus.com November 15, 2018 @ National Graduate Institute For Policy Studies Elsevier Japan Scopus 2 Agenda What is Scopus? Basic search workflow
SEARCH about SCIENCE: databases, personal ID and evaluation
 SEARCH about SCIENCE: databases, personal ID and evaluation Laura Garbolino Biblioteca Peano Dip. Matematica Università degli studi di Torino laura.garbolino@unito.it Talking about Web of Science, Scopus,
InCites Indicators Handbook
 InCites Indicators Handbook This Indicators Handbook is intended to provide an overview of the indicators available in the Benchmarking & Analytics services of InCites and the data used to calculate those
Comparing Bibliometric Statistics Obtained from the Web of Science and Scopus
 Comparing Bibliometric Statistics Obtained from the Web of Science and Scopus Éric Archambault Science-Metrix, 1335A avenue du Mont-Royal E., Montréal, Québec, H2J 1Y6, Canada and Observatoire des sciences
Scientometric and Webometric Methods
 Scientometric and Webometric Methods By Peter Ingwersen Royal School of Library and Information Science Birketinget 6, DK 2300 Copenhagen S. Denmark pi@db.dk; www.db.dk/pi Abstract The paper presents two
hprints , version 1-1 Oct 2008
 Author manuscript, published in "Scientometrics 74, 3 (2008) 439-451" 1 On the ratio of citable versus non-citable items in economics journals Tove Faber Frandsen 1 tff@db.dk Royal School of Library and
INTRODUCTION TO SCIENTOMETRICS. Farzaneh Aminpour, PhD. Ministry of Health and Medical Education
 INTRODUCTION TO SCIENTOMETRICS Farzaneh Aminpour, PhD. aminpour@behdasht.gov.ir Ministry of Health and Medical Education Workshop Objectives Scientometrics: Basics Citation Databases Scientometrics Indices
Alphabetical co-authorship in the social sciences and humanities: evidence from a comprehensive local database 1
 València, 14 16 September 2016 Proceedings of the 21 st International Conference on Science and Technology Indicators València (Spain) September 14-16, 2016 DOI: http://dx.doi.org/10.4995/sti2016.2016.xxxx
Research Playing the impact game how to improve your visibility. Helmien van den Berg Economic and Management Sciences Library 7 th May 2013
 Research Playing the impact game how to improve your visibility Helmien van den Berg Economic and Management Sciences Library 7 th May 2013 Research The situation universities are facing today has no precedent
SALES DATA REPORT
 SALES DATA REPORT 2013-16 EXECUTIVE SUMMARY AND HEADLINES PUBLISHED NOVEMBER 2017 ANALYSIS AND COMMENTARY BY Contents INTRODUCTION 3 Introduction by Fiona Allan 4 Introduction by David Brownlee 5 HEADLINES
Semi-automating the manual literature search for systematic reviews increases efficiency
 DOI: 10.1111/j.1471-1842.2009.00865.x Semi-automating the manual literature search for systematic reviews increases efficiency Andrea L. Chapman*, Laura C. Morgan & Gerald Gartlehner* *Department for Evidence-based
Bibliometrics & Research Impact Measures
 Bibliometrics & Research Impact Measures Show your Research Impact using Citation Analysis Christina Hwang August 15, 2016 AGENDA 1.Background 1.Author-level metrics 2.Journal-level metrics 3.Article/Data-level
Citation Indexes: The Paradox of Quality
 Citation Indexes: The Paradox of Quality Entre Pares Puebla 11 September, 2018 Michael Levine-Clark University of Denver @MLevCla Discovery Landscape Discovery System (EDS, Primo, Summon) Broad range of
Academic Identity: an Overview. Mr. P. Kannan, Scientist C (LS)
") Article Academic Identity: an Overview Mr. P. Kannan, Scientist C (LS) Academic identity is quite popular in the recent years amongst researchers due to its usage in the research report system. It is essential
Article Academic Identity: an Overview Mr. P. Kannan, Scientist C (LS) Academic identity is quite popular in the recent years amongst researchers due to its usage in the research report system. It is essential
Analysis of Citations in Undergraduate Papers 1
 Analysis of Citations in Undergraduate Papers 1 Stacey Knight-Davis and Jan S. Sung This paper presents the findings of a citation analysis of papers written by undergraduate students.the analysis included
Introduction to the Literature Review
 Introduction to the Literature Review Shirley Rais, MLS Chair, Serials & Electronic Resources Dept. Library Liaison to the School of Public Health srais@llu.edu Finding, assessing, and reporting on the
Department of American Studies M.A. thesis requirements
 Department of American Studies M.A. thesis requirements I. General Requirements The requirements for the Thesis in the Department of American Studies (DAS) fit within the general requirements holding for
Promoting your journal for maximum impact
 Promoting your journal for maximum impact 4th Asian science editors' conference and workshop July 6~7, 2017 Nong Lam University in Ho Chi Minh City, Vietnam Soon Kim Cactus Communications Lecturer Intro
arxiv: v1 [cs.dl] 8 Oct 2014
![arxiv: v1 [cs.dl] 8 Oct 2014](/thumbs/80/81228387.jpg "arxiv: v1 [cs.dl] 8 Oct 2014") Rise of the Rest: The Growing Impact of Non-Elite Journals Anurag Acharya, Alex Verstak, Helder Suzuki, Sean Henderson, Mikhail Iakhiaev, Cliff Chiung Yu Lin, Namit Shetty arxiv:141217v1 [cs.dl] 8 Oct
Rise of the Rest: The Growing Impact of Non-Elite Journals Anurag Acharya, Alex Verstak, Helder Suzuki, Sean Henderson, Mikhail Iakhiaev, Cliff Chiung Yu Lin, Namit Shetty arxiv:141217v1 [cs.dl] 8 Oct
GPLL234 - Choosing the right journal for your research: predatory publishers & open access. March 29, 2017
 GPLL234 - Choosing the right journal for your research: predatory publishers & open access March 29, 2017 HELLO! Katharine Hall Biology & Exercise Science Librarian Michelle Lake Political Science & Government
Measuring the reach of your publications using Scopus
 Measuring the reach of your publications using Scopus Contents Part 1: Introduction... 2 What is Scopus... 2 Research metrics available in Scopus... 2 Alternatives to Scopus... 2 Part 2: Finding bibliometric
WEB OF SCIENCE THE NEXT GENERATAION. Emma Dennis Account Manager Nordics
 WEB OF SCIENCE THE NEXT GENERATAION Emma Dennis Account Manager Nordics NEXT GENERATION! AGENDA WEB OF SCIENCE NEXT GENERATION JOURNAL EVALUATION AND HIGHLY CITED DATA THE CITATION CONNECTION THE NEXT
Eigenfactor : Does the Principle of Repeated Improvement Result in Better Journal. Impact Estimates than Raw Citation Counts?
 Eigenfactor : Does the Principle of Repeated Improvement Result in Better Journal Impact Estimates than Raw Citation Counts? Philip M. Davis Department of Communication 336 Kennedy Hall Cornell University,
GUIDELINES FOR THE PREPARATION OF A GRADUATE THESIS. Master of Science Program. (Updated March 2018)
") 1 GUIDELINES FOR THE PREPARATION OF A GRADUATE THESIS Master of Science Program Science Graduate Studies Committee July 2015 (Updated March 2018) 2 I. INTRODUCTION The Graduate Studies Committee has prepared
1 GUIDELINES FOR THE PREPARATION OF A GRADUATE THESIS Master of Science Program Science Graduate Studies Committee July 2015 (Updated March 2018) 2 I. INTRODUCTION The Graduate Studies Committee has prepared
Measuring the Impact of Electronic Publishing on Citation Indicators of Education Journals
 Libri, 2004, vol. 54, pp. 221 227 Printed in Germany All rights reserved Copyright Saur 2004 Libri ISSN 0024-2667 Measuring the Impact of Electronic Publishing on Citation Indicators of Education Journals
Analysing and Mapping Cited Works: Citation Behaviour of Filipino Faculty and Researchers
 Qualitative and Quantitative Methods in Libraries (QQML) 5: 355-364, 2016 Analysing and Mapping Cited Works: Citation Behaviour of Filipino Faculty and Researchers Marian Ramos Eclevia 1 and Rizalyn V.
Hybrid resampling methods for confidence intervals: comment
 Title Hybrid resampling methods for confidence intervals: comment Author(s) Lee, SMS; Young, GA Citation Statistica Sinica, 2000, v. 10 n. 1, p. 43-46 Issued Date 2000 URL http://hdl.handle.net/10722/45352
Focus on bibliometrics and altmetrics
 Focus on bibliometrics and altmetrics Background to bibliometrics 2 3 Background to bibliometrics 1955 1972 1975 A ratio between citations and recent citable items published in a journal; the average number