Investor Presentation. March 2015
|
|
|
- Jeremy Melton
- 5 years ago
- Views:
Transcription

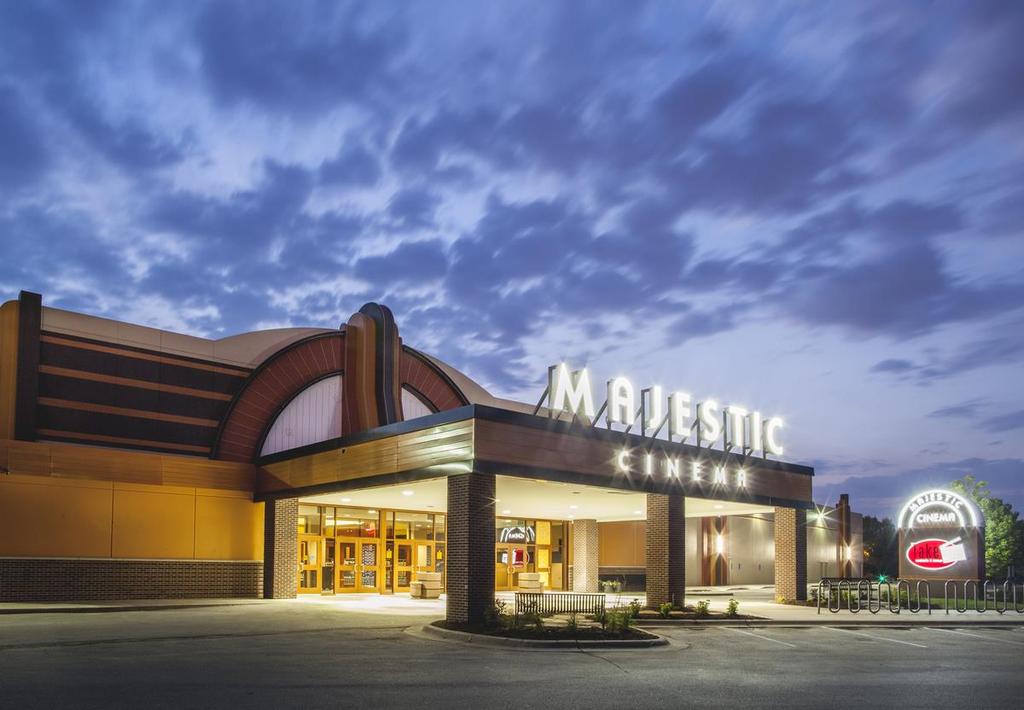
1 Investor Presentation March 2015
2 Forward Looking Statement Certain matters discussed in this presentation are forward-looking statements intended to qualify for the safe harbors from liability established by the Private Securities Litigation Reform Act of These forward-looking statements may generally be identified as such because the context of such statements include words such as we believe, anticipate, expect or words of similar import. Similarly, statements that describe our future plans, objectives or goals are also forward-looking statements. Such forward-looking statements are subject to certain risks and uncertainties which may cause results to differ materially from those expected, including, but not limited to, the following: (1) the availability, in terms of both quantity and audience appeal, of motion pictures for our theatre division, as well as other industry dynamics such as the maintenance of a suitable window between the date such motion pictures are released in theatres and the date they are released to other distribution channels; (2) the effects of adverse economic conditions in our markets, particularly with respect to our hotels and resorts division; (3) the effects on our occupancy and room rates of the relative industry supply of available rooms at comparable lodging facilities in our markets; (4) the effects of competitive conditions in our markets; (5) our ability to achieve expected benefits and performance from our strategic initiatives and acquisitions; (6) the effects of increasing depreciation expenses, reduced operating profits during major property renovations, impairment losses, and preopening and start-up costs due to the capital intensive nature of our businesses; (7) the effects of adverse weather conditions, particularly during the winter in the Midwest and in our other markets; (8) our ability to identify properties to acquire, develop and/or manage and the continuing availability of funds for such development; and (9) the adverse impact on business and consumer spending on travel, leisure and entertainment resulting from terrorist attacks in the United States or incidents such as the tragedy in a movie theatre in Colorado in July Shareholders, potential investors and other readers are urged to consider these factors carefully in evaluating the forward-looking statements and are cautioned not to place undue reliance on such forward-looking statements. The forward-looking statements made herein are made only as of the date of this presentation and we undertake no obligation to publicly update such forward-looking statements to reflect subsequent events or circumstances. 2


3 Company Overview A leader in lodging and entertainment LTM Revenues: $476M LTM EBITDA: $89M Strong senior management team Market Cap: ~$556M (as of 3/19/15) 3
4 A Leader in Lodging & Entertainment Fifth largest U.S. exhibitor 685 screens at 55 locations in 7 states Revenues by Division LTM Portfolio of 20 distinctive properties Manage ~5,200 rooms in 11 states Operating Income by Division LTM 54.7% 45.1% Marcus Theatres Marcus Hotels 78.5% 21.5% Corporate Items 0.2% 4
5 Diversified Business Platform Investment Thesis Proven expertise in two distinct business segments Theatres steady growth, resilient, promising film slate; Hotels recovery continues Long-term track record of success Strong Market and Financial Position Theatre investments and marketing driving industry outperformance Theatres and hotels both leaders in their respective markets and industries Conservative capitalization; liquidity to fund future growth; capital-light hotel growth strategy Significant real estate assets; hotel monetization opportunities Return of Capital to Shareholders Increased annual cash dividend rate 11.8% to $0.38 per share effective 5/15/14; Yield 1.9% (as of 2/26/15) Special dividends in 2006 ($7.00) and 2012 ($1.00) Repurchased over 3.9 million shares in last five fiscal years Total return to shareholders has averaged 27% over the last three fiscal years; 25% in F2015 YTD 5
6
7 By the Numbers 83% of screens are in states where Marcus is the #1 or #2 player among our peers 12.5 screens per location Digital cinema in 100% of first-run screens Digital 3D capability at 31% of first-run screens including 90% of UltraScreens Acquired more than 230 screens over the past 8 years; increased screen count by 36% Will have invested nearly $90 million over last two years in recliner seating, largeformat screens, expanded food and beverage concepts and a new flagship theatre; more investments planned Division president/ceo with 34 years of industry experience Marcus Theatres by Location ND 2 NE 8 ND 24 NE 88 MN 9 IA 4 OH IL 2 5 MN 107 WI 25 Marcus Theatres by Screen WI 303 IA 46 OH IL
8 By the Numbers Outperformed the industry in last five fiscal quarters by approximately 8-17 percentage points each quarter Only circuit in the U.S. Top 10 to report increased box office revenues for F2015 YTD Regardless of the strength of the movies in any given quarter, our goal is to outperform the national numbers Q1 F2015 Box Office Box Office Results 25% 24.0% 20% 15% 15.0% 17.2% 10% 8.2% 8.3% 5% 0% -5% -10% -15% Source for U.S. numbers: Rentrak 0.4% 0.5% Q3 F2014 Q4 F2014 Q1 F2015 Q2 F2015 Q3 F % -1.8% -12.7% U.S. Marcus 8
9 By the Numbers Stable and continuous revenue growth in concession and ticket revenue per person over the past 10 years Admissions Revenue Per Person YoY Growth Concessions Revenue per person YoY Growth 10.0% 8.0% 6.0% 4.0% 2.0% 0.0% -2.0% -4.0% -6.0% -8.0% 1.7% 0.2% 2.9% 4.8% 7.6% 2.1% 1.4% 1.9% YTD Admissions Revenue Growth -4.8%* 12.0% 10.0% 8.0% 6.0% 4.0% 2.0% 0.0% -5.4%* 5.2% 1.7% 2.6% 4.1% 3.7% 3.8% 9.7% 5.7% 0.7% * 3.4% * YTD Concessions Revenue Growth 10 Yr. CAGR 2.0% 10 Yr. CPI CAGR 2.3% 10 Yr. CAGR 4.3% 10 Yr. CPI CAGR 2.3% * Reflects impact of $5 Tuesday promotion 9
10 By the Numbers Stable industry-leading EBITDA margins Consistently stronger than larger competitors (AMC, Carmike, Regal and Cinemark have been in the 16-22% range) 30.0% 25.0% 20.0% 15.0% 27.4% 26.2% EBITDA Margin 28.6% 26.8% 26.0% 27.1% 10.0% 5.0% 0.0% LTM 2/26/15 Note: EBITDA is specific to Marcus Theatres division only 10

11 US Box Office ($bn) North American attendance down 5.6% in 2014 following a 1.3% decrease in 2013 and 6.3% increase in Marcus Theatres attendance up 13.9% for F2014 and up 12.8% for F2015 YTD. Box office revenues in North America declined to $10.4 billion in calendar 2014 compared to $10.9 billion in 2013 and $10.8 billion in Marcus Theatres box office up 8.6% for F2014 and up 6.7% for F2015 YTD. Resilient growth during recessions Domestic Attendance & Box Office 12 Box Office Revenue 3 10 Box office Revenue in recession years Attendence Admissions (bn) Source: National Association of Theatre Owners Internet DVD Online Video Streaming 11
12 Best Entertainment Value 1,400 1, Attendance (millions) 2014 Average Ticket Price for a Family of Four (in $) 1,200 NFL $ , NHL NBA $ $ Cinemas 379 Theme Parks MLB NBA NFL NHL Theme Parks $ MLB $ Cinemas $32.68 $0 $100 $200 $300 $400 Source: Motion Picture Association of America Report: Theatrical Market Statistics
13 Unique Real Estate Ownership Profile Real estate ownership profile sets us apart Own 85% of our theatres keeping rental expenses at a minimum and distinguishing ourselves from the industry standard of leased theatres Real estate portfolio provides a strategic advantage through the ability to quickly react to changing theatre trends 100% 90% 80% 70% 60% 50% 40% 30% 20% 10% 0% Theatre Ownership 15% 76% 87% 90% 95% 85% 24% 13% 5% 10% Marcus Carmike Cinemark Regal AMC Owned Leased 13


14 Growth Strategies Grow Revenues & Expand Audience Enhance Operating & Marketing Strategies Engage with Customers Pursue Expansion Opportunities 14

; 7")


15 Grow Revenues & Expand Audience Invested Nearly $90 Million in Existing Assets In the last two years we will have: Added DreamLounger premium recliner seating to 12 theatres Increased number of large screen formats in the circuit to 24: 16 UltraScreen DLX (DreamLounger experience); 7 traditional UltraScreens; 1 SuperScreen Added Big Screen Bistros to three theatres; five theatres total Added Take Five Lounges to 10 theatres; 14 theatres total Added Zaffiro s Express to 11 theatres; 15 theatres total Opened a new state-of-the-art theatre with all of these amentities in one location 15
 In nearly 23% of theatres and 28% of screens (by May 2015); highest")
16 Grow Revenues & Expand Audience Transforming the Way You See Movies DreamLounger premium, luxurious recliner seating: State-of-the-art oversized recliners Ultimate in comfort; double the legroom Requires full auditorium remodels to accommodate 7 feet of legroom 12 theatres in six states; 187 auditoriums (by May 2015) In nearly 23% of theatres and 28% of screens (by May 2015); highest percentages among the top chains Tremendous positive customer feedback; increased attendance Continued expansion planned 16

; additional conversions")
17 Grow Revenues & Expand Audience Transforming the Way You See Movies UltraScreen DLX Conversions: Bringing the best in premium, largeformat presentation to moviegoers Combines: Screens up to 70 feet wide, three stories tall Dolby Atmos multidimensional sound DreamLounger recliner seating All reserved seating, premium pricing 16 UltraScreen DLX screens and 7 traditional UltraScreens available in over 40% of first-run theatres (by May 2015); additional conversions planned 17


 Full-service,")

 Lobby")

18 Grow Revenues & Expand Audience Signature Food & Beverage Concepts Relaxing, social gathering place Variety of chef-inspired menu offerings and full bar TV screens for watching sports and events at some locations 14 locations (by June 2015) Full-service, in-theatre dining auditoriums Chef-prepared menu, concessions and cocktails delivered to customer s reserved seat by friendly waitstaff 5 locations (1 managed) Lobby dining amenity Freshly prepared Thincredible pizza, sandwiches, salads & desserts 15 locations (by June 2015) 18
19 Grow Revenues & Expand Audience Admissions Revenue Admissions revenue per person is a function of the local markets Consistent and stable growth in admissions revenue despite economic conditions Most Marcus theatres are located in lower-priced Midwest locations Concessions Revenue Concession sales per capita and revenues as a percent of box office receipts best in the U.S. Innovative food & beverage concepts contribute to industryleading numbers $9.00 $8.00 $7.00 $6.00 $5.00 $4.00 $3.00 $2.00 $7.18 Industry Average Revenue Per Person $7.50 $7.89 $7.93 $7.96 $2.91 $2.97 $3.10 $3.20 $3.34 $8.13 $8.17 $3.51 Note: There are no published industry averages for Average Concessions Revenue Per Person. The chart data is an estimate compiled by us using publicly available data from the four biggest U.S. Movie Theatre chains (Regal, AMC, Cinemark, Carmike) $ Average Admissions Revenue Per Person Average Concessions Revenue Per Person 19


20 Enhance Marketing & Operating Strategies Value Pricing Promotions $5 Tuesday promotion aimed at mid-week value customers Outstanding response has created another weekend day without impacting regular weekend attendance Contributed to outperformance of the industry in past five quarters Win-win-win for customers, studio partners and us Other promotions include $5 Student Thursdays, Ladies Night and Young at Heart 20


21 Enhance Marketing & Operating Strategies Alternate Programming and Indie Focus Theatre Entertainment Network offers weekday alternate programming at 30 locations including live sports, concerts, classic movies & genre-specific films Indie Focus offers the best art and independent films 21


22 Launched Magical Movie Rewards in March 2014; reached 1,000,000 members in less than one year Benefits include: Earn points for each dollar spent Rewards redeemable at the box office, concession stand or signature food and beverage venues Free popcorn on $5 Tuesdays No fees for online or mobile ticketing Exclusive screening opportunities Unique concessions offers Using data from Movio to understand customer preferences and habits and target rewards and promotions Promote special programming and series Engage with Customers Magical Movie Rewards 22


23 Engage with Customers Connecting Directly with Patrons Engage with moviegoers 24/7 about movies, events, special promotions, polls, contests and more Mobile app platform offers enhanced features including: Find a theatre View trailers Purchase tickets Select reserved seat Avoid printing a ticket Access Magical Movie Rewards program 231,688 Facebook fans; 8,000+ Twitter followers 23
24 Pursue Expansion Opportunities Added more than 230 screens over the past 8 years; increased screen count 36% Will pursue opportunistic acquisitions where we could leverage our innovative strategies to grow attendance Built a presence in the Midwest New 12-screen theatre in Sun Prairie, Wis. opening April 30 Will offer: Reserved DreamLounger seating in every auditorium Two UltraScreen DLX auditoriums Four Big Screen Bistro auditoriums Zaffiro s Express & Take Five Lounge Replaces older 16-screen theatre nearby Palace at Sun Prairie 24


25 Movie Outlook Remainder of Fiscal 2015 and Summer 25

 Hunger Games Mockingjay 2 The Good")


26 Movie Outlook Encouraging 2015 & 2016 Film Slate Second Half 2015 Film Slate Fantastic Four Movie Outlook The Man from U.N.C.L.E. Maze Runner 2 Hotel Transylvania 2 The Peanuts Movie Spectre (James Bond) Hunger Games Mockingjay 2 The Good Dinosaur The Martian Sisters Star Wars Film Slate Divergent: Allegiant Part 1 Superman vs Batman Captain America 3 Alice in Wonderland 2 X-Men: Apocalypse Finding Dory Independence Day 2 Star Trek 3 Ice Age 5 Ghostbusters Planet of the Apes 3 Next Bourne Chapter 26

27


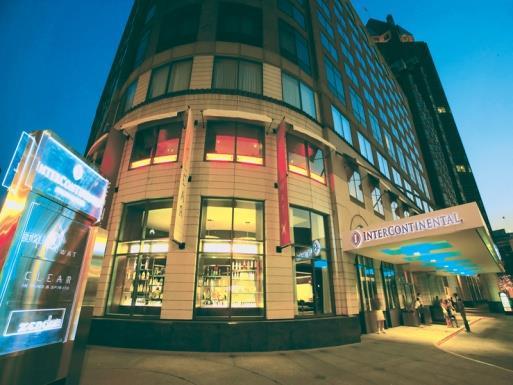
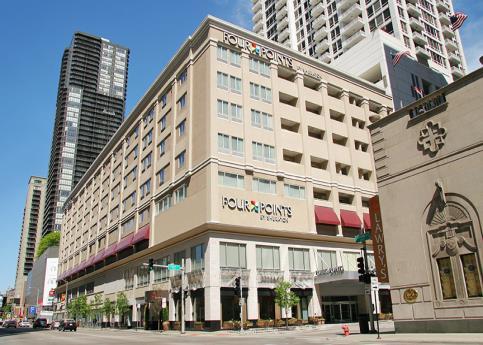


28 Company majority-owned properties: Diverse Portfolio Grand Geneva Resort, Lake Geneva, Wis. Skirvin Hilton, Oklahoma City, Okla. Four Points by Sheraton Chicago, Chicago, Ill. InterContinental Milwaukee Hilton Madison Monona Terrace, Madison, Wis. Hotel Phillips, Kansas City, Mo. Hilton Milwaukee The Pfister Hotel, Milwaukee, Wis. The Cornhusker, A Marriott Hotel, Lincoln, Neb. 28
29 By The Numbers Nine company majority-owned and operated properties Manage 11 properties for other owners Own or manage ~5,200 rooms Invested over $80M in existing hotels over the past six fiscal years Recently oversaw $24M in renovations at new managed properties Marcus Hotels Locations (Owned and/or managed) 29
30 Industry Performance Supply/demand imbalance driving strong performance Supply and Demand Change Source: Smith Travel Research 30
31 Industry Performance Occupancy rates at historic highs on an annualized basis ADR increasing but not back to historic levels Source: Smith Travel Research 31
32 Industry Performance Positive RevPAR Growth for the Foreseeable Future Source: Smith Travel Research 32
33 Industry Performance Marcus Hotels & Resorts has exceeded the fair share of its respective markets in terms of RevPAR, ADR and Occupancy Marcus Owned Market Share (1) RevPAR ADR Occupancy Fair Market Share (1) Index value of indicates fair market share. Value greater than suggests greater than fair share of market 33

34 Industry Performance Monetization opportunities: Continued upward trend in hotel market values Upper upscale hotels showed strong value increase of 7% in 2014 Book value of hotel assets is approximately $325M, or approximately $115,000 per room Evaluating individual hotel assets for monetization; considerations include income taxes, ability to continue managing, individual market conditions, pricing Year Value per Room Annual % Change Overall 2009 $76,457-18% ,326 2% ,952 12% ,322 12% ,957 9% ,334 7% Luxury ,083-22% ,762 4% ,380 10% ,943 12% ,482 9% ,498 7% Upper Upscale ,460-19% ,893 2% ,163 10% ,466 11% ,075 8% ,818 7% Upscale ,028-19% ,721 1% ,429 15% ,935 11% ,953 9% ,535 7% Source: Penn State index of U.S. Hotel Values


35 Growth Strategies Acquire Additional Properties Add New Management Contracts Enhance Existing Assets Maximize Competitive Advantages 35


36 Acquire Additional Properties Westin Atlanta Perimeter North MCS Capital: Serves as an investment fund sponsor, joint venture partner or sole investor Acquired properties can be managed by Marcus Hotels Led by experienced industry executive with seasoned team of professionals The Cornhusker, A Marriott Hotel 36


37 Add New Management Contracts Heidel House Resort & Spa The Hotel Zamora Westin Atlanta Perimeter North Added 931 rooms in F2013- F2015 YTD: Managing the Heidel House Resort & Spa in Green Lake, Wis. 73% majority owner of The Cornhusker, A Marriott Hotel, in Lincoln, Neb. 11% interest in the Westin Atlanta Perimeter North in suburban Atlanta, Ga. 10% interest in The Hotel Zamora in St. Pete Beach, Fla. Oversaw multi-million dollar renovations at The Cornhusker and Westin Atlanta Comprehensive portfolio of services hotel owners and developers need; proven track record Ability to make small equity investments in managed properties 37

38 Enhance Existing Assets Converting Four Points by Sheraton Chicago Downtown/Magnificent Mile into one of the first AC Hotels by Marriott in the U.S. Inspired by the fashion houses of Spain; European urban lifestyle brand; contemporary look and feel Latest amenities and technology for the savvy traveler Will feature an AC Lounge, AC Library, AC Fitness and AC Breakfast Opening May


39 Enhance Existing Assets Major renovation of 176 tower guest rooms at The Pfister completed; final phase of multi-year, multi-million dollar renovation Completed major renovations at The Cornhusker Hotel and Westin Atlanta Perimeter North totaling $24M New Club Lounges at the The Pfister Hotel and Grand Geneva Resort & Spa Enhanced Miller Time Pub & Grill restaurant concept at the Hilton Milwaukee; introduced second location at The Cornhusker Completed major hotel renovation projects at the Hilton Milwaukee, Grand Geneva Resort & Spa, Hotel Phillips and Hilton Madison in last four years Pfister Tower Rooms Pfister Club Lounge Westin Atlanta Perimeter North 39


40 Over 50 years of industry experience Expertise in management, development, historic renovations, asset repositioning and food & beverage Portfolio of leading brands including Hilton, IHG, Marriott & Starwood Strong balance sheet; well positioned for growth Proven track record Four properties received the AAA Four Diamond Award rating in 2015 Maximize Competitive Advantages Pfister has maintained AAA Four Diamond status for 39 consecutive years since first introduced in of Marcus Hotels owned and managed properties received the TripAdvisor 2014 Certificate of Excellence. 12 restaurants and lounges also received the designation in 2014 Eight hotels earned recognition as Best Hotels in their respective cities and states by U.S. News & World Report in
41 Maximize Competitive Advantages Engaging with Guests Mobile websites for smartphones and tablets; tremendous growth in Facebook and Twitter followers Social media team at each property responds to customer comments and online reviews Capture customers directly through online search, advertising and Hotel and restaurant loyalty program established in 2008 Points system rewards repeat customers; data used for targeted marketing 41


42 Maximize Competitive Advantages Grow Food & Beverage Revenues Food and beverage revenues up 6.1% in F2014 and 3.0% in F2015 YTD Expanding successful internally developed restaurant brands and catering & events business Reintroduced Miller Time Pub & Grill concept at Hilton Milwaukee and opened second location at The Cornhusker in Lincoln, Neb. 42
43 Outlook Good economic environment needed to sustain upward trends Near-term supply growth has been limited Exceptions are the Milwaukee and Oklahoma City markets PKF Hospitality Research predicts strong RevPAR growth in 2015 & 2016; shift from record-setting occupancy to growing ADR Exploring hotel investments through MCS Capital Actively pursuing new management contracts; added highly experienced development executive Leveraging experience and complete portfolio of services Exploring selected hotel monetization opportunities with goal of retaining management Grand Geneva Club Lounge 43
44

45 The Corners of Brookfield Initiated $200 million mixed-use open air development at prime location in suburban Milwaukee including a former theatre site Anchored by first Von Maur department store in Wis. Led project through concept, design and approval stages Entered into JV agreement with majority equity partner with significant retail experience; maintained 10% minority interest Contributed land, expect to be reimbursed for predevelopment costs with opportunity for development profit Expected spring 2015 groundbreaking; fall 2016 opening 45
46 Conservative Capitalization/ Ample Access to Capital Strong and consistent cash flow Credit facilities well positioned for growth $136 million of unused credit lines as of 2/26/15 Debt portfolio at 2/26/15 was 70% fixed/30% variable; average interest rate of 3.9% 50% 40% 30% 20% 10% 0% Debt/Capitalization Ratio 44% 41% 42% 39% 41% 37% /26/15 46
47 Summary
 Selected Theatre Replacement Hotel Expansion Joint Ventures Management Contracts Creation of a Fund Operating Strategies Revenue")

48 Shareholder Value Creation Long-Term Value Maximization Theatre Expansion Acquisitions New Builds Divestitures of Assets Sale of Selected Hotels (may retain management) Selected Theatre Replacement Hotel Expansion Joint Ventures Management Contracts Creation of a Fund Operating Strategies Revenue Enhancements Cost Rationalization Management Reinvestment in Existing Assets Hotel & Theatre Renovations New Amenities & Features F&B Innovations UltraScreens, DreamLoungers & UltraScreen DLX Capital Structure Strategies Share Repurchases Dividend Policy Balance Sheet Management Focused on Long-Term Shareholder Value 48

49 Company Strengths Market leadership with national presence Long-term track record of continuous growth Conservative capitalization and ample liquidity to fund both future growth and return of capital to shareholders Significant real-estate assets Experienced management team 49
50 Investor Presentation Appendix
51 Financial Performance $500 $400 $300 $379.1 $377.0 Revenues (in millions) $413.9 $412.8 $447.9 $476.5 $60 $50 $40 $30 $36.2 Operating Income (1) (in millions) $48.4 $46.5 $38.2 $33.5 $51.2 $200 $20 $100 $10 $0 (2) (2) LTM 2/26/15 (1) Legal costs related to the now-settled lawsuits concerning our Las Vegas property totaled approximately $3.3 million in 2013, $1.4 million in 2012, $1.8 million in 2011 and $1.7 million in (2) Fiscal 2012 was a 53-week year and operating results benefited from the extra week of operations. $ LTM 2/26/15 51
52 Financial Performance EBITDA (1) (in millions) Net Earnings (in millions) EBITDA EBITDA Margin % $25 $22.7 $25.0 $25.0 $100 $80 $60 $40 $ % $ % $ % $ % $ % $ % 25% 20% 15% $20 $15 $10 $16.1 $13.6 $17.5 $20 $5 $0 (2) LTM 2/26/15 10% $0 (2) LTM 2/26/15 (1) Legal costs related to the now-settled lawsuits concerning our Las Vegas property totaled approximately $3.3 million in 2013, $1.4 million in 2012, $1.8 million in 2011 and $1.7 million in (2) Fiscal 2012 was a 53-week year and operating results benefited from the extra week of operations. 52
53 Historical Results by Segment $500 Revenues by Segment $70 Operating Income by Segment $400 $300 $154 $169 $185 $193 $204 $215 $60 $50 $40 $1 $7 $13 $11 $16 $14 $200 $100 $224 $207 $228 $220 $243 $261 $30 $20 $10 $45 $37 $47 $41 $46 $51 $0 $120 $100 $80 $60 $40 $20 $0 $ * LTM Theatres Hotels & Resorts 2/26/15 *Fiscal 2012 was a 53-week year. EBITDA by Segment $32 $29 $32 $16 $27 $23 $61 $54 $65 $59 $63 $ * LTM Theatres Hotels & Resorts 2/26/15 Note: Corporate revenues and expenses are not reflected in operating income, EBITDA and capital expenditures. $80 $60 $40 $20 $ * LTM Theatres Hotels & Resorts 2/26/15 Capital Expenditures by Segment $22 $19 $12 $47 $16 $9 $10 $38 $26 $9 $16 $ * LTM Theatres Hotels & Resorts 2/26/15 53
 EBITDA (in millions) EPS Up 8.4% Up 7.2% Up 11.1% Down 2.")
54 First Three Quarters F2015 Revenues (in millions) Operating Income (in millions) EBITDA (in millions) EPS Up 8.4% Up 7.2% Up 11.1% Down 2.6% 54
55 Highlights First Three Quarters Marcus Theatres Admissions revenues outperformed the industry for fifth consecutive quarter Revenues up 9.6%; operating income up 13.3% Concession revenues up 16.6% New amenities, food and beverage concepts and $5 Tuesday promotion contributed to box office outperformance Marcus Hotels & Resorts Achieved record revenues all three quarters; operating income down due to temporary impact of construction for renovation of Chicago property RevPAR for comparable company-owned hotels up 6.1% (excluding Chicago) Occupancy at historic highs Average daily rate up slightly 55
56 Investor Presentation March 2015
INVESTING for GROWTH. The Marcus Corporation. Gabelli & Company Inaugural Movie Conference March 12, 2009
 INVESTING for GROWTH The Marcus Corporation Gabelli & Company Inaugural Movie Conference March 12, 2009 Forward-Looking Statement Certain matters discussed in this presentation are forward-looking statements
Piper Jaffray Non-Deal Roadshow New York, New York
 Piper Jaffray Non-Deal Roadshow New York, New York June 25, 2015 Disclaimer The following information contains, or may be deemed to contain, forward-looking statements. By their nature, forward-looking
INVESTOR PRESENTATION. March 2016
 INVESTOR PRESENTATION March 2016 DISCLAIMER Safe Harbor: - Some information in this report may contain forward-looking statements. We have based these forward looking statements on our current beliefs,
INVESTOR PRESENTATION. June 17
 INVESTOR PRESENTATION June 17 Company Overview India s largest cinema chain Leadership position in India with approx. 40% share of Hollywood Box Office and approx. 25% share of 75 Million Guests 587 Screens
BUY Current Price: $21.28 Target Price: $24.36 Market Cap: 3.39B S&P Debt Rating B+
 February, 17, 2017 Regal Entertainment Group (RGC) Analyst: Edward Stumm Sector: Consumer Discretionary Industry: Media Company Description: Regal Entertainment Group (RGC) is one of the leading and most
City Screens fiscal 1998 MD&A and Financial Statements
 City Screens fiscal 1998 MD&A and Financial Statements Management's Discussion and Analysis (Note: Fiscal 1998 is for the year ending April 1, 1999) OPERATING RESULTS Revenues. Total revenues increased
Credit Suisse Global Media and Communications Convergence Conference March 8, 2011
 Credit Suisse Global Media and Communications Convergence Conference March 8, 2011 Cineplex Entertainment The Largest and Most Successful Motion Picture Theatre Exhibition Company in Canada 131 Theatres
Gabelli & Co Exhibitor Media Conference March 17, 2011
 Gabelli & Co Exhibitor Media Conference March 17, 2011 Cineplex Entertainment The Largest and Most Successful Motion Picture Theatre Exhibition Company in Canada 131 Theatres with 1,362 Screens *as of
This is a licensed product of AM Mindpower Solutions and should not be copied
 1 TABLE OF CONTENTS 1. The US Theater Industry Introduction 2. The US Theater Industry Size, 2006-2011 2.1. By Box Office Revenue, 2006-2011 2.2. By Number of Theatres and Screens, 2006-2011 2.3. By Number
Our circuit is the third largest in the U.S. with 339 theatres and 4,566 screens in 41 states.
 FINANCIAL TEAR SHEET CORPORATE PROFILE We are a leader in the motion picture exhibition industry with 539 theatres and 5,998 screens in the U.S. and Latin America as of June 30, 2018. Our circuit is the
INVESTOR PRESENTATION. February 2017
 INVESTOR PRESENTATION February 2017 Disclaimer Safe Harbor: - Some information in this report may contain forward-looking statements. We have based these forward looking statements on our current beliefs,
CINEPLEX GALAXY INCOME FUND Reports Record First Quarter Results and Announces Distribution Increase. Three months ended March 31, 2008
 Not for release over US newswire services FOR IMMEDIATE RELEASE CINEPLEX GALAXY INCOME FUND Reports Record First Quarter Results and Announces Distribution Increase TORONTO, CANADA, May 8, 2008 (TSX: CGX.UN)
Sonic's Third Quarter Results Reflect Current Challenges
 Sonic's Third Quarter Results Reflect Current Challenges Sales Improve Steadily after Slow March, and Development Initiatives Maintain Strong Momentum Partner Drive-in Operations Slip OKLAHOMA CITY, Jun
A copy of the company s financial filings can be obtained from us. Contact:
 Management Presentation March 2018 Investor Considerations This presentation may include ''forward-looking statements.'' To the extent that the information presented in this presentation discusses financial
MACQUARIE CONFERENCE Wednesday 2 May, 2018
 MACQUARIE CONFERENCE Wednesday 2 May, 2018 2017 Financial Highlights Global Cinema Screens Introducing Kimbal Riley Vista Group - Growth Movio Will Palmer Questions 2 2 OPERATING SEGMENTS CINEMA MOVIO
CINEPLEX GALAXY INCOME FUND Reports Third Quarter Results. Three months ended September 30, 2008
 Not for release over US newswire services FOR IMMEDIATE RELEASE CINEPLEX GALAXY INCOME FUND Reports Third Quarter Results TORONTO, CANADA, November 6, 2008 (TSX: CGX.UN) Cineplex Galaxy Income Fund (the
Coinstar, Inc. Analyst Day May 16, 2012
 Coinstar, Inc. Analyst Day May 16, 2012 Redbox Business Review Gregg Kaplan President and COO Coinstar, Inc. Safe Harbor for Forward Looking Statements Various remarks that we may make about future expectations,
Multimedia Polska S.A. 4March 2015
 Multimedia Polska S.A. 2014 fourth quarter and FY results 4March 2015 Disclaimer This presentation may contain forward-looking statements with respect to the business, financial results, and/or results
SKYCITY Entertainment Group Limited. Interim results for the six months to 31 December 2017
 MARKET RELEASE 9 February 2018 SKYCITY Entertainment Group Limited Interim results for the six months to 31 December 2017 SKYCITY Entertainment Group Limited (NZX/ASX:SKC) today announced its interim results
Cineworld Group 2016 Results 9 th March 2017
 Cineworld Group 2016 Results 9 th March 2017 Overview Summary of 2016 another record year Reached the milestone of 100m admissions Overall strong financial performance for the Group, EBITDA growth of 13.2%,
Cineplex Galaxy. Income Fund Fourth Quarter & Full Year
 Cineplex Galaxy Income Fund Fourth Quarter & Full Year Cineplex Entertainment Circuit The Largest and Most Successful Motion Picture Theatre Exhibition Company in Canada 130 Theatres with 1,331 Screens
Village Roadshow Limited Hong Kong May 27 th Singapore May 29 th
 Village Roadshow Limited Hong Kong May 27 th Singapore May 29 th AGENDA Company Overview Our History Business Portfolio Financial Performance Capital Management Future Strategy Summary 2 Australia s Leading
NET LEASE INVESTMENT OFFERING AMC THEATRES
 AMC THEATRES 100 Meijer Drive Michigan City, IN 46360 TABLE OF CONTENTS TABLE OF CONTENTS I. Executive Profile Executive Summary Investment Highlights Property Overview II. Location Overview Photographs
MANAGEMENT S DISCUSSION AND ANALYSIS
 May 2, 2016 MANAGEMENT S DISCUSSION AND ANALYSIS The following management s discussion and analysis ( MD&A ) of ( Cineplex ) financial condition and results of operations should be read together with the
2014 FOURTH. QUARTER (As of December 31, 2014)
") 2014 FOURTH QUARTER (As of December 31, 2014) Contact: Pat Marshall Vice President, Communications and Investor Relations 416.323.6648 pat.marshall@cineplex.com Cineplex Entertainment The Largest and Most
2014 FOURTH QUARTER (As of December 31, 2014) Contact: Pat Marshall Vice President, Communications and Investor Relations 416.323.6648 pat.marshall@cineplex.com Cineplex Entertainment The Largest and Most
Eros International Plc Corporate Presentation
 Eros International Plc Corporate Presentation Jefferies Global TMT Conference May 2014 A Leading Global Indian Film Entertainment Company Leading co-producer, acquirer and distributor of Indian language
AT&T Investor Update. 2Q08 Earnings Conference Call July 23, 2008
 AT&T Investor Update 2Q08 Earnings Conference Call July 23, 2008 2008 AT&T Intellectual Property. All rights reserved. AT&T, the AT&T logo and all other marks contained herein are trademarks of AT&T Intellectual
Please find attached our presentation for the UBS Investor Conference.
 16 November 2015 Client Market Services NZX Limited Level 1, NZX Centre 11 Cable Street WELLINGTON RE: SKYCITY ENTERTAINMENT GROUP LIMITED (SKC) Please find attached our presentation for the UBS Investor
An Economic Overview, Stocks vs. Bonds, and An Update on Three Stocks
 Excerpt: Netflix Slides An Economic Overview, Stocks vs. Bonds, and An Update on Three Stocks Whitney Tilson Value Investing Congress October 1, 2012 T2 Accredited Fund, LP Tilson Offshore Fund, Ltd. T2
SKYCITY Entertainment Group Limited. Interim Results for six months to 31 December 2014
 MEDIA RELEASE 11 February 2015 SKYCITY Entertainment Group Limited Interim Results for six months to 31 December 2014 Result Highlights: Normalised revenue up 9.2% to $510.0 million, normalised EBITDA
Is the takeover of Regal Entertainment a solid solution for Cineworld?
 JANUARY 2018 1 Is the takeover of Regal Entertainment a solid solution for Cineworld? AUTHOR JULIA KLINKENBERG JULIA.KLINKENBERG@EDHEC.COM The first news about a potential acquisition of Regal Entertainment
MANAGEMENT S DISCUSSION AND ANALYSIS. Unless otherwise specified, all information in this MD&A is as of December 31, 2014.
 February 11, 2015 MANAGEMENT S DISCUSSION AND ANALYSIS Cineplex Inc. ( Cineplex ) owns 100% of Cineplex Entertainment Limited Partnership (the Partnership ). The following management s discussion and analysis
SECOND QUARTER. June 30, 2018
 SECOND QUARTER June 30, LETTER TO SHAREHOLDERS Dear fellow shareholders, Cineplex reported a record second quarter with increases in revenue across all reportable segments. Total revenue increased 12.4%
CINEPLEX INC. Reports First Quarter Results and Announces Dividend Increase
 FOR IMMEDIATE RELEASE CINEPLEX INC. Reports Results and Announces Dividend Increase TORONTO, Canada, May 8, 2015 (TSX: CGX) - Cineplex Inc. ( Cineplex ) today released its financial results for the three
UTV Software Communications Limited
 UTV Software Communications Limited EARNINGS RELEASE FOR THE QUARTER ENDED JUN 30, 2007 UTV s Consolidated Results for 1QFY2008 as compared to 1QFY2007 Total revenues Rs 571 million, up by 9% EBITDA Rs
Deutsche Bank Conference June 2005
 Deutsche Bank Conference June 2005 www.hearstargyle.com This presentation includes forward-looking statements. We based these forward-looking statements on our current expectations and projections about
SECOND QUARTER 2015 REPORT
 CINEPLEX INC. SECOND QUARTER REPORT Dear fellow shareholders, I am very pleased to report that Cineplex delivered record-breaking results for the second quarter of. New alltime records were set for total
CINEPLEX INC. Reports Fourth Quarter and Annual Results
 FOR IMMEDIATE RELEASE CINEPLEX INC. Reports Fourth Quarter and Annual Results TORONTO, Canada, February 11, 2014 (TSX: CGX) - Cineplex Inc. ( Cineplex ) today released its financial results for the three
Delivering a premium entertainment experience
 Delivering a premium entertainment experience third QUARTER 2012 As of September 30, 2012, owns, operates or has an interest in 133 theatres with 1,438 screens. The company operates theatres with the following
CINEPLEX INC. Reports Third Quarter Results
 FOR IMMEDIATE RELEASE CINEPLEX INC. Reports Third Quarter Results TORONTO, Canada, November 7, 2017 (TSX: CGX) - Cineplex Inc. ( Cineplex ) today released its financial results for the three and nine months
Sinclair Broadcast Group Who We Are
 SAFE HARBOR The following information contains, or may be deemed to contain, "forward-looking statements" (as defined in the U.S. Private Securities Litigation Reform Act of 1995). Any statements about
NET LEASE PORTFOLIO INVESTMENT OPPORTUNITY
 NET LEASE PORTFOLIO INVESTMENT OPPORTUNITY Chicago, IL Lake Delton, WI Michigan City, IN AMC Portfolio Three Properties Available on an Individual or Portfolio Basis DISCLAIMER STATEMENT DISCLAIMER STATEMENT:
CINEPLEX INC. Reports Record First Quarter Results and Announces Dividend Increase
 FOR IMMEDIATE RELEASE CINEPLEX INC. Reports Record Results and Announces Dividend Increase TORONTO, Canada, May 2, 2017 (TSX: CGX) - Cineplex Inc. ( Cineplex ) today released its financial results for
Israel Analyst Presentation 24 th May 2017
 Israel Analyst Presentation 24 th May 2017 Overview Overview Israel economy and demographics The cinema market in Israel Our brands in Israel Israel a case study for the UK Israel Economy & Demographics
Cineworld 2017 Interim Results 10 th August 2017
 Cineworld 2017 Interim Results 10 th August 2017 0 Financial Review 1 Financial Highlights Group H1 2017 Group H1 2016 Statutory Movement Admissions 50.7m 46.1m 10.0% m m Box office 267.2 227.0 17.7% Retail
entertainment Quarterly Briefing 3Q13 MAJOR CINEPLEX GROUP PLC. Analyst Meeting Paragon Cineplex, Siam Paragon: November 11 th, 2013
 IFESTYLE Quarterly Briefing MAJOR CINEPLEX GROUP PLC. Analyst Meeting Paragon Cineplex, Siam Paragon: November 11 th, 2013 81 657 193 215 192 165 201 235 230 293 301 942 440 Q13 QUATERLY BRIEFING The Bottom
Cineplex Inc. Reports Record First Quarter Results, Announces Dividend Increase and Amended Credit Facilities
 FOR IMMEDIATE RELEASE Cineplex Inc. Reports Record Results, Announces Dividend Increase and Amended Credit Facilities TORONTO, Canada, May 3, 2016 (TSX: CGX) - Cineplex Inc. ( Cineplex ) today released
Exhibit LIONSGATE Investor Presentation July 2012
 Exhibit 99.1 LIONSGATE Investor Presentation July 2012 Special Notice Regarding Forward-Looking Statements 2 This presentation contains projections and forward-looking statements. Forward-looking statements
Why split up Netflix?
 Netflix Group 4 Why split up Netflix? DVD by mail is slowly dying, but Netflix will do everything it can to keep it alive Netflix has diverged into two different business lines, with two very different
Cineworld 2017 Interim Results 10 th August 2017
 Cineworld 2017 Interim Results 10 th August 2017 0 Financial Review 1 Financial Highlights Group H1 2017 Group H1 2016 Statutory Movement Admissions 50.7m 46.1m 10.0% m m Box office 267.2 227.0 17.7% Retail
Strategic Partnership to Advance Dedicated and New Cinema Solutions
 Strategic Partnership to Advance Dedicated and New Cinema Solutions Analyst presentation Jan De Witte, CEO & Ann Desender, CFO 4 December 2017 Executive summary Catalysts driving next stage of growth in
entertainment Quarterly Briefing 1Q15 MAJOR CINEPLEX GROUP PLC. Analyst Meeting 1Q15 Quatier Cine Art, 11 th May, 2015
 IFESTYLE Quarterly Briefing MAJOR CINEPLEX GROUP PLC. Analyst Meeting Quatier Cine Art, 11 th May, 2015 Q15 QUARTERLY BRIEFING LIFESTYLE Financial Highlights Bt.Million growth Amt. % Revenue 1,703 100%
Vista Group International Limited 2015 Annual General Meeting Chairman s Address
 Vista Group International Limited 2015 Annual General Meeting Chairman s Address Before moving to the formal business of today s meeting, I would like to comment on some of the Group s activities and achievements
Digital Ad. Maximizing TV Stations' Revenues. The Digital Opportunity. A Special Report from Media Group Online, Inc.
 Maximizing TV Stations' Digital Ad The Digital Opportunity TV is an enviable position compared to almost all other traditional media in the digital age: an increasing number of TV households, a 96.5% penetration
CINEPLEX INC. Reports Third Quarter Results
 FOR IMMEDIATE RELEASE CINEPLEX INC. Reports Third Quarter Results TORONTO, Canada, November 8, 2012 (TSX: CGX) - Cineplex Inc. ( Cineplex ) today released its financial results for the third quarter of
2016 FIRST QUARTER March 31, 2016
 2016 FIRST QUARTER March 31, 2016 Dear fellow shareholders, I am pleased to report that Cineplex achieved record first quarter results for 2016. Total revenue of $378.9 million increased 30.8% and adjusted
FIRST QUARTER 2013 REPORT
 2013 CINEPLEX INC. FIRST QUARTER 2013 REPORT Letter to shareholders After experiencing our best annual results yet in 2012 including record quarterly results for Q4 2012 the first quarter of 2013 was a
entertainment Quarterly Briefing 3Q14 MAJOR CINEPLEX GROUP PLC. Analyst Meeting 3Q14 Paragon Cineplex, Siam Paragon: November 7 th, 2014
 IFESTYLE Quarterly Briefing MAJOR CINEPLEX GROUP PLC. Analyst Meeting Paragon Cineplex, Siam Paragon: November 7 th, 2014 Q14 QUARTERLY BRIEFING LIFESTYLE Financial Highlights Revenue growth from highlight
MARKET OUTPERFORMERS CELERITAS INVESTMENTS
 MARKET OUTPERFORMERS CELERITAS INVESTMENTS Universal Displays (OLED) Rating: Strong Buy Stock Price: $101/share Price Target: $130/share MOP Idea of the Month: Universal Displays Business Overview: Universal
THIRD QUARTER 2014 REPORT
 CINEPLEX INC. THIRD QUARTER REPORT Dear fellow shareholders, It is my pleasure to provide you with an overview of our recent business results. Cineplex delivered mixed results for the third quarter of.
UTV Software Communications Limited
 UTV Software Communications Limited EARNINGS RELEASE FOR THE QUARTER AND YEAR ENDED MAR 31, 2007 FY2007 as compared to FY2006 Total revenues Rs 2,030 million, from Rs 2,182 million Operating Income Rs
As at December 31, 2016
 As at December 31, 2016 Contact/Inquiries: Pat Marshall, Vice President, Communications and Investor Relations T: 416.323.6648 E: Pat.Marshall@cineplex.com CINEPLEX ENTERTAINMENT IS THE AS AT DECEMBER
Major Cineplex Group Plc. Annual. Results Briefing. February 25, 2009
 Annual Major Cineplex Group Plc. Results Briefing February 25, 29 Quarterly Results Briefing Contents 4Q8 P&L snapshots: Core revenue, EBITDA, & Net profit Revenue by business unit EBITDA growth analysis
CINEPLEX INC. Reports Record Third Quarter Results
 FOR IMMEDIATE RELEASE CINEPLEX INC. Reports Record Third Quarter Results TORONTO, Canada, November 14, 2018 (TSX: CGX) - Cineplex Inc. ( Cineplex ) today released its financial results for the three and
TV Azteca in Grupo Salinas
 March 2018 0 The following information contains or may be deemed to contain, forward-looking statements. By their nature, forward-looking statements involve risks and uncertainties because they relate
TV Azteca en Grupo Salinas
 October 2017 The following information contains or may be deemed to contain, forward-looking statements. By their nature, forward-looking statements involve risks and uncertainties because they relate
THIRD QUARTER. September 30, 2018
 THIRD QUARTER September 30, LETTER TO SHAREHOLDERS Dear fellow shareholders, The film exhibition business continued to show growth during the third quarter of. A strong film slate, including films like
CINEPLEX INC. Reports Fourth Quarter and Annual Results
 FOR IMMEDIATE RELEASE CINEPLEX INC. Reports Fourth Quarter and Annual Results TORONTO, Canada, February 22, 2018 (TSX: CGX) - Cineplex Inc. ( Cineplex ) today released its financial results for the three
CINEPLEX INC. Reports Second Quarter Results
 FOR IMMEDIATE RELEASE CINEPLEX INC. Reports Second Quarter Results TORONTO, Canada, August 6, 2014 (TSX: CGX) - Cineplex Inc. ( Cineplex ) today released its financial results for the three and six months
Netflix Inc. (NasdaqGS:NFLX) Company Description
 Company Description") Analyst: Anthony Petretti Sector: Consumer Discretionary Valuation: Netflix Inc. Ticker: (NasdaqGS:NFLX) Date: 12/18/2017 Current Price: $190.42 Recommendation: Short Company Description Investment Thesis
Analyst: Anthony Petretti Sector: Consumer Discretionary Valuation: Netflix Inc. Ticker: (NasdaqGS:NFLX) Date: 12/18/2017 Current Price: $190.42 Recommendation: Short Company Description Investment Thesis
REGAL ENTERTAINMENT GROUP. Moderator: Don DeLaria October 26, :30 a.m. CT
 Page 1 REGAL ENTERTAINMENT GROUP October 26, 2004 8:30 a.m. CT Operator: Good day everyone, and welcome to the Regal Entertainment Group third quarter 2004 earnings conference call. This call is being
Date: 27 th April 2015 UFO-MOVIEZ INDIA-IPO. Issue Size and Purpose
 Date: 27 th April 2015 UFO-MOVIEZ INDIA-IPO Issue Size and Purpose The company is coming out with an initial public offering (IPO) amounting to Rs 600 crore at an price band of Rs 615-625 per share of
CINEPLEX GALAXY INCOME FUND 2004 FIRST QUARTER REPORT
 CINEPLEX GALAXY INCOME FUND 2004 FIRST QUARTER REPORT CINEPLEX GALAXY LP IS A LEADING EXHIBITOR OF MOTION PICTURES IN THE ENTERTAINMENT INDUSTRY. HEADQUARTERED IN TORONTO, CANADA, CINEPLEX GALAXY LP CURRENTLY
Abbeville Opera House Impact Study
 Abbeville Opera House Impact Study This Study has been developed in order to gauge the current Economic Impact of the Opera House on the Abbeville County, vs its potential impact. Prepared by the Abbeville
Net Income (Non-GAAP) Profit Margin 5.9% 2.7% 2.2% -1.8% 3.6% 1.7% 4.0%
 Profit Margin 5.9% 2.7% 2.2% -1.8% 3.6% 1.7% 4.0%") AMC Investment Thesis: After a Cyclically-Driven Downturn in 2017, the Box Office is Poised to Have a Strong 2018 that will Significantly Benefit AMC s Depressed Stock Investment Thesis: A careful analysis
AMC Investment Thesis: After a Cyclically-Driven Downturn in 2017, the Box Office is Poised to Have a Strong 2018 that will Significantly Benefit AMC s Depressed Stock Investment Thesis: A careful analysis
The Council would like to know if you think it should provide this ongoing support to the Hawera Cinema 2 Trust.
 Page 1 of 8 Introduction In March 2007 the South Taranaki District Council (the Council) purchased the Hawera Cinema 2 (the Cinema) complex for $1 million to keep the facility operating. The Council of
Management s discussion and analysis (cont d) Cineplex Inc. first quarter 2011 Destination Cineplex
 Cineplex Inc. first quarter 2011 Destination Cineplex") Management s discussion and analysis (cont d) Cineplex Inc. first quarter 2011 Destination Cineplex c i n e p l e x g a l a xy i n co m e f u n d 2 01 0 a n n ua l r e p o rt 1 As of March 31, 2011, Cineplex
Management s discussion and analysis (cont d) Cineplex Inc. first quarter 2011 Destination Cineplex c i n e p l e x g a l a xy i n co m e f u n d 2 01 0 a n n ua l r e p o rt 1 As of March 31, 2011, Cineplex
VOTE THE ENCLOSED WHITE PROXY CARD TODAY FOR TAUBMAN S DIRECTOR NOMINEES
 VOTE THE ENCLOSED WHITE PROXY CARD TODAY FOR TAUBMAN S DIRECTOR NOMINEES May 5, 2017 Dear Fellow Taubman Shareholder, Over the past 20 years, the knowledge and expertise of the Taubman Board has contributed
Interim Results. 16 th August 2012
 Interim Results 16 th August 2012 Today s presentation team Steve Wiener Founder & Chief Executive Officer Philip Bowcock Chief Financial Officer Crispin Lilly Vice President of Business Affairs 2 2012
CINEPLEX INC. Reports Fourth Quarter and Annual Results
 FOR IMMEDIATE RELEASE CINEPLEX INC. Reports Fourth Quarter and Annual Results TORONTO, Canada, February 15, 2017 (TSX: CGX) - Cineplex Inc. ( Cineplex ) today released its financial results for the three
BALAJI TELEFILMS LIMITED Results for the Quarter ended September 30, 2010
 BALAJI TELEFILMS LIMITED Results for the Quarter ended September 30, 2010 A. Financial Highlights 1. Results comparison of Quarter II ended September 30, 2010 with June 30, 2010 Income from operations
THIRD QUARTER 2015 REPORT
 CINEPLEX INC. THIRD QUARTER REPORT Dear fellow shareholders, I am pleased to report that delivered another strong quarter. We established new third quarter record results for all revenue sources including
Strong all-round performance drives growth
 Strong all-round performance drives growth Domestic advertising revenue grew by 23.3% YoY to Rs. 11,526 mn Domestic subscription revenue grew by 26.0% YoY to Rs. 5,093 mn EBITDA grew by 37.6% YoY to Rs.
PT M Cash IPO Profile
 PT M Cash IPO Profile February 2018 Summary of Initial Public Offering SPECIALIZED INVESTMENT BANKERS AT THE INTERSECTION OF FINANCE & TECHNOLOGY Initial Public Offering Overview IDX: MCAS Headquarters
FIVE FLAGS CENTER FEASIBILITY STUDY REPORT
 FIVE FLAGS CENTER FEASIBILITY STUDY REPORT The FFCC has long-served as an important community asset for Dubuque and its residents. Its long history can be traced back to the mid-1800 with the opening of
Kinepolis Group Business Update Q Regulatory release - 16 November 2017
 Third quarter 2017 1 Visitor numbers rose in virtually every country in the third quarter, due, on the one hand, to the Group expansion and, on the other, to a relatively strong third-quarter film offer.
CINEPLEX INC. Reports First Quarter Results and Announces Dividend Increase
 FOR IMMEDIATE RELEASE CINEPLEX INC. Reports Results and Announces Dividend Increase TORONTO, Canada, May 9, 2013 (TSX: CGX) - Cineplex Inc. ( Cineplex ) today released its financial results for the first
CINEPLEX GALAXY INCOME FUND Reports Record Fourth Quarter and Full Year Results
 Not for release over US newswire services FOR IMMEDIATE RELEASE CINEPLEX GALAXY INCOME FUND Reports Record Fourth Quarter and Full Year Results TORONTO, CANADA, February 11, 2010 (TSX: CGX.UN) Cineplex
RTL GROUP PRESENTATION. Brussels, 21 June 2013
 RTL GROUP PRESENTATION Brussels, 21 June 2013 The leading European entertainment network Agenda Q1 HIGHLIGHTS o Business Review o Strategy Review 2 Quarter 1 highlights 2013 REVENUE 1.3 billion REPORTED
31 January , , ,000 90,000 80,000 70,000 60,000 50,000 40,000 30,000 20,000 10,000
 31 January 2012 Quickflix successfully launched its movie streaming service during the quarter becoming the first subscription video on demand (SVOD) service of its kind in Australia offering unlimited
Investor Presentation. Bank of America Merrill Lynch Leverage Finance Conference December 4, 2018
 Investor Presentation Bank of America Merrill Lynch Leverage Finance Conference December 4, 2018 Forward-Looking Statements This presentation contains various forward-looking statements that reflect management
Netflix: Amazing Growth But At A High Price
 Netflix: Amazing Growth But At A High Price Mar. 17, 2018 5:27 AM ET8 comments by: Jonathan Cooper Summary Amazing user growth, projected to accelerate into Q1'18. Contribution profit per subscriber continues
VRL Business Fundamentals
 VRL Business Fundamentals People will always want to go out Our simple, yet effective mantra We provide our customers with an escape from the worries of the world Our focus on delivering superior offerings
1H 2017 Investors Briefing Financial and Operating Results August 11, 2017
 1H 2017 Investors Briefing Financial and Operating Results August 11, 2017 Business Segments Media Networks & Studio Entertainment Digital & Interactive Media - Entertainment - News - Global - Film & Music
Entertainment One Ltd. Trading Update for the nine months ended 31 December 2014
 Entertainment One Ltd. Trading Update for the nine months ended 31 December 2014 STRONG PERFORMANCE AHEAD OF MANAGEMENT EXPECTATIONS Strong financial performance drives positive outlook for full year Full
CINEPLEX INC. Reports Second Quarter Results
 FOR IMMEDIATE RELEASE CINEPLEX INC. Reports Second Quarter Results TORONTO, Canada, August 2, 2017 (TSX: CGX) - Cineplex Inc. ( Cineplex ) today released its financial results for the three and six months
2014 Preliminary Results 12 th March 2015
 2014 Preliminary Results 12 th March 2015 Introduction Financials Philip Bowcock CFO Integration and Synergies Israel Greidinger - Deputy CEO Business Update Mooky Greidinger - CEO 2 Financial Review Financial
VISTA GROUP 2015 AGM : Event Cinema 3, Gold Class. 24 May 2016
 VISTA GROUP 2015 AGM : Event Cinema 3, Gold Class 24 May 2016 Introduction Chairman s Address CEO Address Questions on Annual Report & Financial Statements Business Resolutions Resolution 1 Remuneration
(Company Registration No N) (Incorporated in Singapore) (the Company)
 (Incorporated in Singapore) (the Company)") (Company Registration No. 201424372N) (Incorporated in Singapore) (the Company) PROPOSED ACQUISITION OF THE CATHAY CINEPLEXES BUSINESS SIGNING OF OPTION AGREEMENT FOR THE PROPOSED ACQUISITION OF 100% OF
(Company Registration No. 201424372N) (Incorporated in Singapore) (the Company) PROPOSED ACQUISITION OF THE CATHAY CINEPLEXES BUSINESS SIGNING OF OPTION AGREEMENT FOR THE PROPOSED ACQUISITION OF 100% OF
Investor Presentation
 Investor Presentation September 2013 Cautionary Note on Forward-Looking Statements This presentation includes forward-looking information and statements, including but not limited to: statements concerning