Traffic Control Device Evaluation Program: FY 2016
|
|
|
- Kerry Carr
- 6 years ago
- Views:
Transcription

1 TTI: Traffic Control Device Evaluation Program: FY 2016 Technical Report Cooperative Research Program TEXAS A&M TRANSPORTATION INSTITUTE COLLEGE STATION, TEXAS in cooperation with the Federal Highway Administration and the Texas Department of Transportation
2
3 1. Report No. FHWA/TX-16/ Title and Subtitle TRAFFIC CONTROL DEVICE EVALUATION PROGRAM: FY 2016 Technical Report Documentation Page 2. Government Accession No. 3. Recipient's Catalog No. 5. Report Date Published: March Performing Organization Code 7. Author(s) Susan T. Chrysler, Bradford K. Brimley, Paul J. Carlson, Srinivasa Sunkari, and Eun Sug Park 8. Performing Organization Report No. Report Performing Organization Name and Address Texas A&M Transportation Institute College Station, Texas Sponsoring Agency Name and Address Texas Department of Transportation Research and Technology Implementation Office 125 E. 11th Street Austin, Texas Work Unit No. (TRAIS) 11. Contract or Grant No. Project Type of Report and Period Covered Technical Report: August 2013 August Sponsoring Agency Code 15. Supplementary Notes Project performed in cooperation with the Texas Department of Transportation and the Federal Highway Administration. Project Title: Traffic Control Device Evaluation Program URL: Abstract This report presents findings on three different activities conducted in the Traffic Control Device Evaluation Program during the 2016 fiscal year. The first two activities are evaluations of full-matrix color lightemitting diode changeable message signs with 20 mm pixels. The first evaluation compared legibility and detection of roadway hazard objects for signs with and without sponsor acknowledgement logos on 1/3 of the sign. A closed-course evaluation was conducted day and night on a closed course with 30 drivers traveling 30 mph. Three sign types were evaluated: green background travel time signs with white letters, black background text signs with white letters, and blue background text signs with white letters. Sponsor logos had little or no effect on sign legibility or object detection distances. When an effect was significant, it was observed only for specific types of signs or placement locations. The second activity was a nighttime evaluation of legibility of these same signs comparing three different fonts: 16 inch letters (20 x 12 pixels), 18 inch (23 x 15 pixels), and a more condensed 18 inch letter (23 x 14 pixels). The study demonstrated drivers can read messages with 18 in. letters farther away than 16 in. letters. But when expressed as legibility index, all of the fonts tested hover around the minimum legibility index of 40 ft/in recommended in the TMUTCD. This suggests that there is room for improvement in the design of individual letters. The third activity provided an update to the worksheet used to determine signal preemption needs at railroad grade crossings. The updates provide default values in some frequently used fields, eliminated some fields rarely used, and minimized the decision making for those filling out the form. 17. Key Words Changeable Message Signs, CMS, Dynamic Message Signs, DMS, Digital Billboards, Font, 19. Security Classif. (of this report) Unclassified Form DOT F (8-72) 20. Security Classif. (of this page) Unclassified 18. Distribution Statement No restrictions. This document is available to the public through NTIS: National Technical Information Service Alexandria, Virginia No. of Pages Price Reproduction of completed page authorized
4
5 TRAFFIC CONTROL DEVICE EVALUATION PROGRAM: FY 2016 by Susan T. Chrysler, Ph.D. Senior Research Scientist Texas A&M Transportation Institute Bradford K. Brimley, Ph.D. Associate Transportation Researcher Texas A&M Transportation Institute Paul J. Carlson, Ph.D., P.E. Senior Research Engineer Texas A&M Transportation Institute Srinivasa R. Sunkari, P.E. Research Engineer Texas A&M Transportation Institute and Eun Sug Park, Ph.D. Research Scientist Texas A&M Transportation Institute Report Project Project Title: Traffic Control Device Evaluation Program Performed in cooperation with the Texas Department of Transportation and the Federal Highway Administration Published: March 2017 TEXAS A&M TRANSPORTATION INSTITUTE College Station, Texas
6
7 DISCLAIMER This research was performed in cooperation with the Texas Department of Transportation (TxDOT) and the Federal Highway Administration (FHWA). The contents of this report reflect the views of the authors, who are responsible for the facts and the accuracy of the data presented herein. The contents do not necessarily reflect the official view or policies of FHWA or TxDOT. This report does not constitute a standard, specification, or regulation. v
8 ACKNOWLEDGMENTS This project was conducted in cooperation with TxDOT and FHWA. The authors would like to thank the Project Monitoring Committee and particularly Wade Odell, the project manager. The sign installation and testing was greatly assisted by Ken Townsend of TxDOT and Kim Clark of TransCore. The research team would also like to thank Nada Trout, Dan Walker, Ivan Lorenz, Sandra Stone, Jeff Miles, Matt Robinson, Kyle Kingsbury, and Austin Fivash for their assistance with the research activities. vi
9 TABLE OF CONTENTS Page List of Figures... ix List of Tables... x Chapter 1. Closed-Course Evaluation of Sponsored Changeable Message Signs... 1 Introduction... 1 MUTCD Guidelines for Changeable Message Signs... 2 Study Design... 5 Research Questions... 5 Closed-Course Setup... 6 Experimental Design Experiment Signs Method Results Data Distributions Analyses of Legibility Distance Nighttime Object Detection Summary Conclusions Research Questions Discussion Chapter 2. Evaluation of Font Alternatives for Full Matrix Changeable Message Signs Method Experimental Design Experiment Signs Measurement Equipment Testing Location and Sign Specifications Participants Procedure Results Analysis of Legibility While Driving Analysis of Legibility While Stationary Conclusions Chapter 3. Update to the Guide for Determining Time Requirements for Traffic Signal Preemption at Highway-Rail Grade Crossings Background Existing Worksheet Overview of the Modifications Modifications Made to the Worksheet WB-67 as a Vehicle Turning Left onto the Tracks Pedestrian Truncation Summary Appendix A. Ordering for Signs and Objects vii
10 Appendix B. Procedure for Each Participant Appendix C. Statistical Output from Analyses of Variance Legibility ANOVA Testing Logo Presence on Travel Time Sign Legibility ANOVA Testing Logo Background Color on Travel Time Sign Legibility ANOVA Testing Logo Presence on Safety Sign Legibility ANOVA Testing Logo Background Color on Safety Sign Legibility Nighttime Object Detection ANOVA Testing Sign Type and Logo Presence on Object Detection Distance ANOVA Testing Logo Background Color on Object Detection Distance References viii
11 LIST OF FIGURES Page Figure 1. Overview of the Arrangement of the Study Signs and Target Objects Figure 2. Target Objects: (a) Box, (b) Tire, and (c) Deer Figure 3. Pictures of All Single-Phased Signs in the Study Figure 4. Pictures of All Dual-Phased Signs in the Study Figure 5. Photometric Camera Installed in Research Vehicle Figure 6. Study Vehicle and Instrumentation for Collecting Data Figure 7. Distribution of Measured Visual Acuity of the Participant Drivers Figure 8. Cumulative Distribution Plots of Legibility Distances for the Four Sign Types by (a) Day, and (b) Night Figure 9. Cumulative Distribution Plots of Detection Distances for the (a) Box, (b) Deer, and (c) Tire at Night Figure 10. Least Square Mean Values for the Interaction of Logo Presence and Sign Type Illustrating That Logo Presence Was Significant Only for Blue Signs Figure 11. Least Square Mean Values for the Interaction of Time of Day and Logo Background Color Figure 12. Average Detection Distance of the Deer, Box, and Tire at Night Figure 13. Least Square Mean Values for the Interaction of Logo Presence and Sign Type Figure 14. Least Square Mean Values for the Interaction of Logo Presence and Object Location Figure 15. Least Square Mean Values for the Interaction of Sign Type and Object Location Figure 16. Study Vehicle and Instrumentation for Collecting Data Figure 17. Overview of the Study Course Figure 18. Distribution of Measured Visual Acuity of the Participants Figure 19. Overall Range of Legibility Distance Measurements Figure 20. Overall Legibility Distance as a Function of Letter Height Figure 21. Legibility Distance for All Fonts as a Function of Visual Acuity Score Figure 22. A Sample of the Existing Worksheet Developed in Project Figure 23. Instructions for Completing the Preemption Worksheet Figure 24. Illustration of Cases to Store a Left Turning WB-67 toward the Tracks Figure 25. Illustration of Geometric Scenarios Considered for a WB-67 Turning toward the Tracks Figure 26. Illustration of Guidance for Removal/Relocation of Crosswalks Figure 27. Draft Revised Preemption Worksheet ix
12 LIST OF TABLES Page Table 1. Primary Independent Variables Table 2. Sign and Object Pairings for Participants Assigned to Groups Table 3. Luminance (cd/m 2 ) for Roadway Hazard Objects as a Function of Sign State Table 4. Luminance Values for CMS Messages at Nighttime Setting Table 5. Number of Object Viewings within and across Groups Table 6. Mixed-Effects ANOVA Testing Legibility of Travel Time Signs (Reduced Model) Table 7. Least Square Means and Tukey HSD Test from the Mixed-Effects ANOVA Testing Legibility of Travel Time Signs Table 8. Mixed-Effects ANOVA Testing Legibility of Safety Signs (Reduced Model) Table 9. Least Square Means and Tukey HSD Test from the Mixed-Effects ANOVA Testing Legibility of Safety Signs Table 10. Mixed-Effects ANOVA Testing Safety Sign Legibility with Logo Background (Reduced Model) Table 11. Least Square Means and Tukey HSD Test from the Mixed-Effects ANOVA Testing Effects of Logo Backgrounds on Safety Sign Legibility Table 12. Mixed-Effects ANOVA Object Detection Distance (Reduced Model) Table 13. Least Square Means and Tukey HSD Test from the Mixed-Effects ANOVA Testing Object Detection at Night Table 14. Experimental Design for Driving Laps Table 15. Signs Used for Full Width Display Evaluation of Letter Height Table 16. Sign Messages Used for 2/3 Width Display Evaluation of Letter Width Table 17. Signs Used in Stationary Evaluation of All Three Fonts Table 18. Variables and Explanation Table 19. Descriptive Statistics Showing Effect of Visual Acuity Test Scores on Legibility Distance Table 20. Legibility Distance (ft) for Full Width and 2/3 Width Displays Table 21. Legibility Distances (ft) as Function of Age and Font x
13 CHAPTER 1. CLOSED-COURSE EVALUATION OF SPONSORED CHANGEABLE MESSAGE SIGNS INTRODUCTION State and local transportation agencies have long sought innovative mechanisms to fund transportation infrastructure. One method identified by the Texas Department of Transportation (TxDOT) is the use of acknowledgments on changeable message signs (CMSs). TxDOT envisions acknowledging sponsors by displaying company logos on designated portions of CMSs. Section 2H.08 of the Manual on Uniform Traffic Control Devices (MUTCD) states that acknowledgment signs are a way of recognizing a company, business, or volunteer group that provides a highway-related service. Acknowledgment signs include sponsorship signs for adopta-highway litter removal programs, maintenance of a parkway or interchange, and other highway maintenance or beautification sponsorship programs (1). Based on the above support statement in the MUTCD, the definition of acknowledgment signs is not broad enough to include acknowledgments on a CMS. Guidance in Paragraph 2 of Section 2H.08, however, directs state and local highway agencies with acknowledgment sign programs to develop an acknowledgment sign policy, which could hypothetically broaden the classification of acknowledgment signs to include their use on CMSs. However, this inclusion would not be allowed due to language in Paragraph 4 stating that acknowledgment signs shall not be installed on CMSs. Because acknowledging a sponsor on a CMS is currently not allowed by the MUTCD, TxDOT requested and received permission from the Federal Highway Administration (FHWA) to experiment with sponsorship logos on CMSs (FHWA Request to Experiment ruling number 2(09)-83 (E) Sponsorship Acknowledgment on CMS TX). FHWA approved the research to be conducted in three parts: A driving simulator study to evaluate the distraction potential of having sponsor logos on a CMS. A closed-course driving study to evaluate the effects of sponsor logos on sign legibility and hazard detection. An open road study examining eyes-off-road time, pending review of the first two parts of the project. The design and findings of the driving simulator study are discussed in a separate report (2). The present report describes the design and findings of the closed-course study. The openroad study will not begin until FHWA has reviewed the findings of the first two studies. 1
14 MUTCD GUIDELINES FOR CHANGEABLE MESSAGE SIGNS Although the use of sponsor logos on CMSs is not in conformance with guidelines in the current national and Texas editions of the MUTCD, based on language in Section 2H.08, there are several other guidelines in the MUTCD relevant to CMSs. These guidelines cover topics such as the applications for CMSs, their placement, and the design and content of their messages. The MUTCD limits how much information is presented on a CMS display, which justifies the concern that sponsor logos would impact driver workload and comprehension of the sign. These effects were evaluated in the simulator study (2). The MUTCD states that CMSs shall automatically adjust their brightness under varying light conditions, that messages on CMSs should be displayed with positive contrast on a dark background, and that an increase in light with negative-contrast messages on CMS displays does not lead to increased legibility distance (1). These guidelines and statements regarding the light from a CMS add context to the concerns of using sponsor logos on signs. Light from sponsor logos introduces the potential for glare, which may affect a driver s ability to read the sign or see hazards on the road. The potential effects of sponsor logos on sign legibility and hazard detection were the basis for this study. The following excerpts from Chapters 2L and 2H of the MUTCD (1), identical in both the national and Texas editions, are reprinted here because of their relevance to the use of CMSs and the design of this study. Section 2L.02 Applications of Changeable Message Signs Support: 01 Changeable message signs have a large number of applications including, but not limited to, the following: A. Incident management and route diversion B. Warning of adverse weather conditions C. Special event applications associated with traffic control or conditions D. Control at crossing situations E. Lane, ramp, and roadway control F. Priced or other types of managed lanes G. Travel times H. Warning situations I. Traffic regulations J. Speed control K. Destination guidance Option: 02 Changeable message signs may be used by State and local highway agencies to display safety messages, transportation-related messages, emergency homeland security messages, and America s Missing: Broadcast Emergency Response (AMBER) alert messages. Standard: 06 When a CMS is used to display a safety, transportation-related, emergency homeland security, or AMBER alert message, the display format shall not be of a type that could be considered similar to advertising displays. 2
15 Section 2L.03 Legibility and Visibility of Changeable Message Signs Guidance: 04 Changeable message signs used on roadways with speed limits of 55 mph or higher should be visible from 1/2 mile under both day and night conditions. The message should be designed to be legible from a minimum distance of 600 feet for nighttime conditions and 800 feet for normal daylight conditions. When environmental conditions that reduce visibility and legibility are present, or when the legibility distances stated in the previous sentences in this paragraph cannot be practically achieved, messages composed of fewer units of information should be used and consideration should be given to limiting the message to a single phase (see Section 2L.05 for information regarding the lengths of messages displayed on changeable message signs). Section 2L.04 Design Characteristics of Changeable Message Signs Standard: 01 Changeable message signs shall not include advertising, animation, rapid flashing, dissolving, exploding, scrolling, or other dynamic elements. Guidance: 04 CMS should be limited to no more than three lines, with no more than 20 characters per line. 05 The spacing between characters in a word should be between 25 to 40 percent of the letter height. The spacing between words in a message should be between 75 and 100 percent of the letter height. Spacing between the message lines should be between 50 and 75 percent of the letter height. 06 Except as provided in Paragraph 18, word messages on changeable message signs should be composed of all upper-case letters. The minimum letter height should be 18 inches for changeable message signs on roadways with speed limits of 45 mph or higher. The minimum letter height should be 12 inches for changeable message signs on roadways with speed limits of less than 45 mph. Support: 07 Using letter heights of more than 18 inches will not result in proportional increases in legibility distance. Standard: 10 Changeable message signs shall automatically adjust their brightness under varying light conditions to maintain legibility. Guidance: 11 The luminance of changeable message signs should meet industry criteria for daytime and nighttime conditions. Luminance contrast should be between 8 and 12 for all conditions. 12 Contrast orientation of changeable message signs should always be positive, that is, with luminous characters on a dark or less luminous background. Standard: 16 If a green background is used for a guide message on a CMS or if a blue background is used for a motorist services message on a CMS, the background color shall be provided by green or blue lighted pixels such that the entire CMS would be lighted, not just the white legend. Support: 17 Some CMS that employ newer technologies have the capability to display an exact duplicate of a standard sign or other sign legend using standard symbols, the Standard Alphabets and letter forms, route shields, and other typical sign legend elements with no apparent loss of resolution or recognition to the road user when compared with a static version of the same sign legend. Such signs are of the full-matrix type and can typically display full-color legends. Use of such technologies for new CMS is encouraged for greater legibility of their displays and enhanced recognition of the message as it pertains to regulatory, warning, or guidance information. 3
16 Section 2L.05 Message Length and Units of Information Guidance: 01 The maximum length of a message should be dictated by the number of units of information contained in the message, in addition to the size of the CMS. A unit of information, which is a single answer to a single question that a driver can use to make a decision, should not be more than four words. Standard: 04 Each message shall consist of no more than two phases. A phase shall consist of no more than three lines of text. Each phase shall be understood by itself regardless of the sequence in which it is read. Messages shall be centered within each line of legend. Except for signs located on toll plaza structures or other facilities with a similar booth-lane arrangement, if more than one CMS is visible to road users, then only one sign shall display a sequential message at any given time. 05 Techniques of message display such as fading, rapid flashing, exploding, dissolving, or moving messages shall not be used. The text of the message shall not scroll or travel horizontally or vertically across the face of the sign. Guidance: 06 When designing and displaying messages on changeable message signs, the following principles relative to message design should be used: A. The minimum time that an individual phase is displayed should be based on 1 second per word or 2 seconds per unit of information, whichever produces a lesser value. The display time for a phase should never be less than 2 seconds. B. The maximum cycle time of a two-phase message should be 8 seconds. C. The duration between the display of two phases should not exceed 0.3 seconds. D. No more than three units of information should be displayed on a phase of a message. E. No more than four units of information should be in a message when the traffic operating speeds are 35 mph or more. F. No more than five units of information should be in a message when the traffic operating speeds are less than 35 mph. G. Only one unit of information should appear on each line of the CMS. H. Compatible units of information should be displayed on the same message phase. Section 2H.08 Acknowledgment Signs Guidance: 08 Acknowledgment signs should clearly indicate the type of highway services provided by the sponsor. Standard: 09 In addition to the general provisions for signs described in Chapter 2A and the sign design principles covered in the Standard Highway Signs and Markings book (see Section 1A.11), acknowledgment sign designs developed by State or local highway agencies shall comply with the following provisions: A. Neither the sign design nor the sponsor acknowledgment logo shall contain any contact information, directions, slogans (other than a brief jurisdiction-wide program slogan, if used), telephone numbers, or Internet addresses, including domain names and uniform resource locators (URL); B. Except for the lettering, if any, on the sponsor acknowledgment logo, all of the lettering shall be in upper-case letters as provided in the Standard Highway Signs and Markings book (see Section 1A.11); C. In order to keep the main focus on the highway-related service and not on the sponsor acknowledgment logo, the area reserved for the sponsor acknowledgment logo shall not 4
17 exceed 1/3 of the total area of the sign and shall be a maximum of 8 square feet, and shall not be located at the top of the sign; D. The entire sign display area shall not exceed 24 square feet; E. The sign shall not contain any messages, lights, symbols, or trademarks that resemble any official traffic control devices; F. The sign shall not contain any external or internal illumination, light-emitting diodes, luminous tubing, fiber optics, luminescent panels, or other flashing, moving, or animated features; and G. The sign shall not distract from official traffic control messages such as regulatory, warning, or guidance messages. The selected extracts from the current MUTCD above identify a number of factors for an agency to consider when developing a CMS program, including the uses for CMSs, guidelines to support visibility, installation of signs, and content and format of the information on the sign. Guidelines for acknowledgment signs relate to the appearance of the logo, the amount of space the acknowledgment logo occupies, and the use of illumination on the sign. The research team used all of these standards, guidance, and support statements for the design of the signs used in this study. STUDY DESIGN The main advantage of new light-emitting diode (LED) signs is that they are capable of displaying complex graphics. The signs are big enough and the resolution is high enough that the sign can be segmented to have different areas of the sign used for different purposes. The abilities to display graphics and use portions of the sign for different purposes make it possible to allocate a portion of the sign to a sponsor logo. It is anticipated that when sponsorships are used, the sponsor logo will occupy one-third of a sign s horizontal space. The effects of sponsorship logos on sign legibility and the ability of drivers to see potential hazards were the principal areas of focus in this study. This chapter describes the design of the study, which involved having participant drivers on a closed course complete two tasks: reading sign messages and identifying potential hazards in the roadway while approaching a sign. Research Questions The ability to display changing messages, sponsorship logos, and different background colors led to several research questions related to the design and brightness of these signs and their effect on legibility of the travel-related message on the sign. Specifically, there were three research questions associated with legibility in this study: 1. Does the use of a sponsor logo affect sign legibility? 2. Does the color or brightness of a sponsor logo affect a sign s legibility? 3. Does the background color of a safety message sign affect legibility? 5
18 LED signs are capable of producing more light than what is produced by a vehicle s headlamps and reflected back to a driver from a retroreflective traffic sign. Previous research (3) has investigated the possibility of signs being too bright and affecting either sign legibility or the driver s ability to see road hazards. With bright LED signs, this problem may also exist, introducing a need to assess whether an LED sign impacts the ability of a driver to detect possible roadway hazards near the sign. This study investigated the following five questions associated with the impact of LED signs on the visibility of hazardous objects near the sign: 1. Does a CMS affect a driver s ability to detect roadway hazards? 2. Does the use of a sponsor logo affect a driver s ability to detect hazards? 3. Does the color or brightness of a sponsor logo affect the ability to detect hazards? 4. Is the effect of a sponsor logo on the ability to detect a hazard dependent upon the location of the hazard, either before or after the sign? 5. Does dual phasing for signs (whether only the message changes, only the logo changes, or both change) affect the visibility of hazards? Glare from the CMS may affect visibility for objects located before and after the sign, but the sign can also illuminate objects in front of it. These differences support the testing of hazardous objects placed both before and after the sign. Two variables affecting answers to the above questions that were considered in the study were the time of day and age of the driver. The study was accordingly conducted during both daytime and nighttime conditions and with old and young drivers. Closed-Course Setup Researchers addressed the first group of questions by having study participants read signs with various messages. The second group was addressed by having the study participants also identify objects on the side of the road near the sign. The study was executed at the Riverside Campus of Texas A&M University on a runway no longer used by aircraft. Two LED signs were installed near opposite ends of the runway, separated by approximately 2,500 ft. The signs were placed 20 ft directly above the defined driving lane. The signs were Daktronics model Vanguard VF x RGB. Dimensionally, the signs were 7 ft 10 in. tall and 28 ft 5 in. wide with an 8-in. border all around, yielding an active display area of 6 ft 6 in. by 27 ft 1 in. The sign had 20-mm (0.81-in.) pixels in an array of 96 rows by 400 columns. The signs were arranged on opposite ends of an oval north/south loop with approximately 3,000 ft of straight approach distance to each sign. The north and south travel lanes were spaced 200 ft apart laterally. The sign structures were wide enough that the test vehicle could pass directly underneath each sign. The drivers were instructed to navigate the course at 30 mph. The travel lanes were marked with retroreflective raised pavement markers and retroreflective lane striping. While approaching each sign, the participants were instructed to read a target word (e.g., second word on the first line) of each sign message at the earliest possible location and time. Sign legibility was assessed by measuring the distance from the sign at which the driver correctly 6
19 read it. In addition to the legibility task, the drivers completed the task of identifying the location of a target hazardous object, also at the earliest moment possible. Each hazardous object was placed to the left or right of the driving lane at one of two test locations: 200 ft before the sign and 100 ft after the sign. These distances were chosen based on photometric measurements of the amount of illumination provided to the pavement by the sign. The amount of light cast onto the pavement peaked at 200 ft in front of the sign, so this location was selected as an extreme value for any benefit or disbenefit due to illumination of the object by the sign. The sign produced no additional illumination 100 ft behind the sign. Based on previous studies using similar target objects, the research team anticipated that detection distances would be approximately 300 ft at night. With peak brightness at 200 ft in front of the sign, an object located 100 ft after the sign may be disadvantaged due to glare from the sign affecting the driver at 200 ft. There were three primary target objects in the task of identifying hazards near the sign. The objects were a tire, a box, and a deer. Three other objects a traffic cone, a shoe, and a chair were placed in other locations as distractor objects to provide drivers an additional visual search task to find the target object among the distractors. Object detection distances were also obtained when the objects were placed at a control location of 1,500 ft from the sign, too far from the sign for the visibility to be affected by glare. Figure 1 shows an illustration of the physical setup of the study. The letters A E in Figure 1 represent the locations where the target objects were placed. Not every position was occupied by an object for each lap. Figure 2 shows pictures of the objects used for the object detection task (box, tire, and deer). The objects were always located 2 ft outside of the driving lane. 7
20 Figure 1. Overview of the Arrangement of the Study Signs and Target Objects. 8


 Tire,")
21 (a) (b) (c) Figure 2. Target Objects: (a) Box, (b) Tire, and (c) Deer. 9
22 Experimental Design Table 1 summarizes the independent variables evaluated in this research. Not every combination of the variables was investigated. For example, phasing was only tested with safety messages, and the background color of sponsor logos was only relevant if a logo was used. The research team tested 13 types of signs based on the combinations of sign category, background color, phasing, use of a sponsor logo, and color of the sponsor logo. A blank sign (a control condition representing a sign that was off) increased the number of tested types of signs to 14. With 14 types of signs, three objects, and two test locations for the objects, there were 84 possible combinations of sign type, object, and placement location that a driver could experience. Table 1. Primary Independent Variables. Variable Levels Possible Conditions Sign Category 2 Travel Time Message; Safety Message Background Color (safety message only) 2 Black; Blue Phasing (safety message only) 2 Single; Dual Sponsor Logo 2 Logo; No Logo Background Color of Sponsor Logo 2 White; Dark Object 3 Box; Tire; Deer Location of Object ft before Sign; 100 ft after Sign Time of Day 2 Day; Night Participant Age Group 2 Old; Young Presenting 84 combinations of sign type, object, and object location to each subject during both the daytime and nighttime visits would be unreasonably taxing on the subjects. It would also limit the number of participants that could be tested with the resources allocated for the study. Each subject participated in the complete study during both the day and night. Instead of having the participants view every type of sign six times (for three test objects two locations) on each visit, researchers assigned the participants to one of three groups for each visit, day and night. Each group viewed every type of sign twice, each time paired with a different object and placement location for the two viewings. The blank sign was only viewed once and always paired with a deer 100 ft after the sign. Table 2 shows the pairings for the three groups. Every participant read the same sign regardless of the group, but the sign/object/location pairings within each group were unique to that group. 10
23 Table 2. Sign and Object Pairings for Participants Assigned to Groups 1 3. Group 1 Group 2 Group 3 Message Type Phasing Background Logo Sign Number Object Location* Object Location* Object Location* Safety Travel Time Single Dual Single Green Black Black Blue No Logo Dark White No Logo Dark White No Logo Text Changes Logo Change Both Change No Logo Dark White 1 Deer E Tire E Box E 2 Box C Deer C Tire C 3 Deer E Tire E Box E 4 Box C Deer C Tire C 5 Deer E Tire E Box E 6 Box C Deer C Tire C 7 Tire E Box E Deer E 8 Deer C Tire C Box C 9 Tire E Box E Deer E 10 Deer C Tire C Box C 11 Tire E Box E Deer E 12 Deer C Tire C Box C 13 Box E Deer E Tire E 14 Tire C Box C Deer C 15 Box E Deer E Tire E 16 Tire C Box C Deer C 17 Box E Deer E Tire E 18 Tire C Box C Deer C 19 Box E Deer E Tire E 20 Tire C Box C Deer C 21 Deer E Tire E Box E 22 Box C Deer C Tire C 23 Deer E Tire E Box E 24 Box C Deer C Tire C 25 Deer E Tire E Box E 26 Box C Deer C Tire C Blank No Logo 27 Deer E Deer E Deer E *Location C was 200 ft before the sign and E was 100 ft after the sign, consistent with Figure 1. 11
24 Experiment Signs There were two categories of sign messages evaluated using CMSs: travel time messages and safety messages. Travel time messages communicate an estimated time to reach a destination. In this study, the destinations were identified as routes on the U.S. highway or interstate systems. Safety reminder messages are presented on CMSs when there is no incident or AMBER Alert information to be displayed. Testing legibility of safety message signs in this study did not include real safety messages. The safety messages were groups of six words unrelated to driving, each six letters in length. Using these unrelated words meant the reading task relied upon legibility rather than recognition and equalized the difficulty of the legibility task across all the various combinations of logos and background colors. The six-letter words were selected from previous studies of sign legibility. The experimenter instructed the subject to read a target word by indicating its position on the sign (e.g., read the second word on the third line ). For the travel time signs, the study participants were instructed to read the travel time for a given route (e.g., how long will it take to get to Interstate 75? ). The legibility distance was the distance from the sign at which the study driver correctly read the assigned time or target word. Experimental Design As Table 1 showed, the study was designed to test the following sign variables: presence of a sponsor logo, type of background (light or dark) of the sponsor logo, background color of the sign message (black or blue for safety messages), and use of dual phases for safety messages. There were four types of dual-phase safety signs: (a) changing text with no sponsor logo, (b) changing text with a steady sponsor logo, (c) steady text with a changing sponsor logo, and (d) changing text with a changing sponsor logo. Dual phasing was tested only on signs with a black background. These different combinations of dual phasing were included primarily to investigate the effect on object detection due to sudden changes in sign brightness. The same sign messages were used during daytime and nighttime testing for every participant, but a different target word or travel time was assigned to ensure the reading task still involved legibility. Pictures of the tested sign messages are shown in Figure 3 and Figure 4, split by whether the sign was displayed in one or two phases. There were nine types of single-phase signs (three types of signs or background colors with three types of logos) and four types of dualphase signs. Each type of sign was displayed twice, each time with a different message. The blank sign was displayed only once for each participant. 12

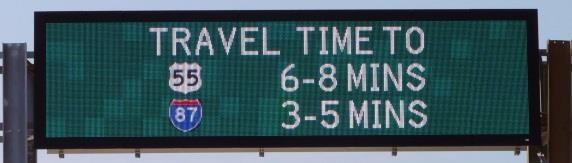
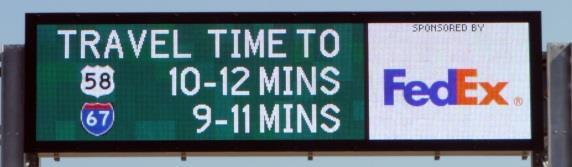
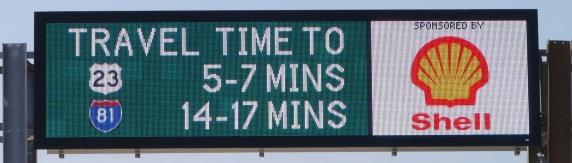
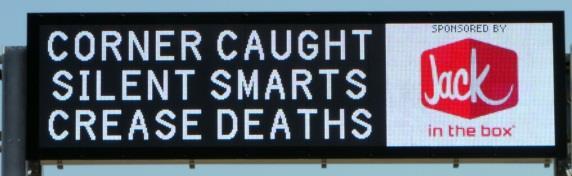
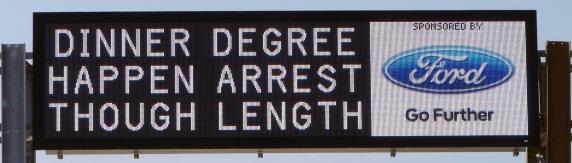
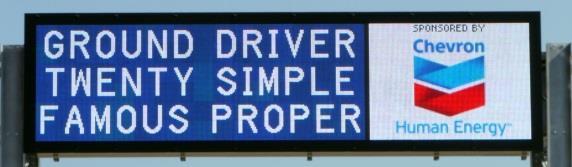
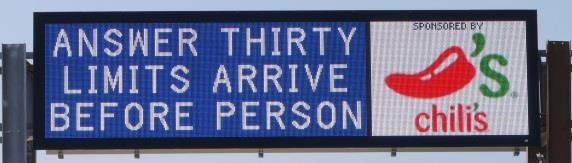
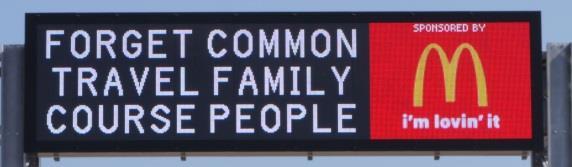
25 13 Logo Background Travel Time, Green Background Safety Message, Black Background Safety Message, Blue Background No Logo White Background Logo Dark Background Logo Figure 3. Pictures of All Single-Phased Signs in the Study.


26 Text/Logo Changing Messages (8-Second Cycle) Text Changes, No Logo Text Changes, Logo Constant Text Constant, Logo Changes Text and Logo Change Figure 4. Pictures of All Dual-Phased Signs in the Study. Luminance Measurements Each of the DMS messages was photometrically measured at the test course at night. The photometric measurements were completed using the Prometric 1613F-1 photometer and 14
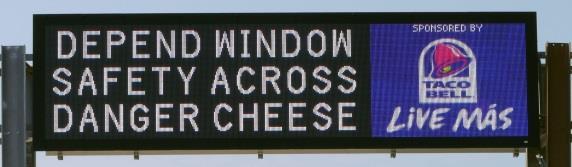
27 colorimeter from Radiant Vision Systems. The heart of this device is a thermally controlled charge-coupled device (CCD) 16-bit-depth monochromatic imaging chip with 1024 by 1024 pixels. This imaging chip allows a user to take a full image photograph that can be photometrically analyzed using special calibrations and the Prometric software. The chip is maintained to below 7 C to minimize measurement noise caused by temperature variation. This equipment will be referred to as the PM1613 from here forward. The PM1613 contains a motorized color wheel, and the equipment has been calibrated to accurately calculate CIE color in addition to luminance. The PM1613 was installed inside the study vehicle, a 2006 Toyota Highlander, in a position to simulate a participant s perspective (Figure 5). Measurements were taken of each sign at 540 ft away, and a subset of measurements was taken of three of the objects at varying distances. Only one distance was used for imaging the signs because the luminance was constant over the recorded legibility distances. The specific distance of 540 ft was selected based upon a legibility index of 30 ft of viewing distance for every 1 in. of letter height, and the letter heights were 18 in. The luminance output of the signs was fixed at 1 percent of their output, which is the typical value of the signs auto-dimming sensor system set for nighttime viewing. Also, the signs were not retroreflective, so there would not have been a perceptible impact of vehicle headlamps on the signs with respect to distance. Table 4 presents the luminance values. For comparison, a traditional freeway sign with Type XI retroreflective white sheeting would produce a luminance value of cd/m 2 at a comparable distance when viewed from a sports utility vehicle with market-weighted average headlamps. The values in Table 4 are all within or above this range of luminance values. The tire, box, and deer were the three objects measured. These measurements followed the same protocol as a previous study of work zone lighting that used some of the same objects (4). These objects are commonly seen on roadways in Texas, and they have been used in previous research, which would allow for cross comparisons between studies. While there were various locations that the objects were placed, detection data were only collected at 200 feet in front of and 100 feet behind the signs, so the researchers only photometrically characterized these objects at those distances. Each object was measured at a left and right road-side position as well for those distances, because the objects were placed to the left and right of the vehicle. The data reported here are the average of those two lateral positions. The photometric equipment was positioned 100 feet from the object location and a 300 mm lens was used. Each of the objects was measured with the messages that contained the brightest logo and the dimmest logo. An additional measurement was taken when the sign was off to establish a base-line condition. In addition, a measurement was done 1500 feet from the sign at the control detection point with the sign off to ensure there was no difference in different areas of the track. Table 3 shows the luminance values for the three objects at the two test positions in front of and behind the sign as well as at the control position. 15

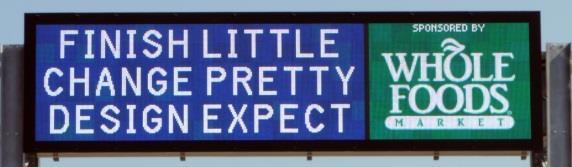
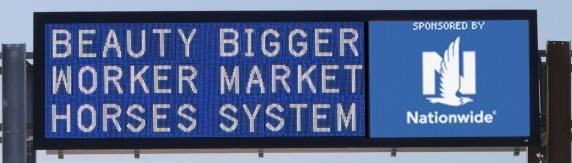
28 Table 3. Luminance (cd/m 2 ) for Roadway Hazard Objects as a Function of Sign State. Sign Off Brightest Logo Dimmest Logo -100 ft 200 ft 1500 ft -100 ft 200 ft -100 ft 200 ft Box Deer Tire Figure 5. Photometric Camera Installed in Research Vehicle. Table 4. Luminance Values for CMS Messages at Nighttime Setting. Luminance (cd/m 2 ) Message Text Color Background Color Logo Logo Only Message (Logo Present) Whole Sign Ticket Hourly White Black Exxon Dinner Degree White Black Ford Police Blouse White Black Goodyear Ticket Hourly White Black Harley Davidson Asleep Cousin White Black La Quinta Depend Window White Black Taco Bell Pulled Lights White Black Wells Fargo Weight Branch White Black None Checkboard White Black None

29 Answer Thirty White Blue Chili s Beauty Bigger White Blue Nationwide String Settle White Blue None Travel Time White Green Shell Travel Time White Green Southwest Travel Time White Green None None NA Black None Method Equipment The study participants drove a 2006 Toyota Highlander equipped with eye-tracking cameras and a global positioning system (GPS) receiver. A computer in the rear of the vehicle stored the data. Pictures of the vehicle and equipment in the vehicle are shown in Figure 6. A researcher operated the instrumentation in the vehicle and was responsible for logging the locations of sign legibility and object detection. The distances were based on the data collected by the GPS receiver. Figure 6. Study Vehicle and Instrumentation for Collecting Data. Participants and Sample Size The analyzed data in this study were collected from 30 people recruited to participate in the study, evenly split into young and old age groups. There were seven or eight males and females in each group. The ages of the young drivers were years (average 25.7), and the ages of the old drivers were years (average 70.1 years). Each participant was asked to drive the course during two different time periods (day and night). To counterbalance the learning effect that occurs from the first visit to the second, half of the recruited subjects participated at night first and the other half participated during the day first. 17
30 Sample Size Each participant completed tests of visual acuity, color blindness, and contrast sensitivity. No participant was turned away for inadequate vision. Figure 7 shows the distribution of visual acuities for the participants Old Young 0 20/13 20/15 20/20 20/25 20/30 20/40 Visual Acuity Figure 7. Distribution of Measured Visual Acuity of the Participant Drivers. With data from 30 drivers that viewed signs and test objects 27 times during both the daytime and nighttime experiments, the study design provided the potential for 1,620 total observations. Table 5 provides summaries of the number of times each hazard was viewed and at each test location (200 ft before the sign or 100 ft after the sign) based on the information in Table 2. Each participant viewed 13 objects 200 ft before the sign and 14 objects 100 ft after the sign. Though each participant viewed each hazard an equal number of times, there was a near balance in the total number of views when added across the three groups. The box was viewed 517 times, the tire 522 times, and the deer 581 times. The deer was viewed more because it was the only object paired with the blank sign. After eliminating data that were not usable due to experiment error, there were 1,530 legibility distances and 1,582 object detection distances of the 1,620 total possible observations. 18
31 Table 5. Number of Object Viewings within and across Groups. Group Location Box Tire Deer Total C (200 ft in front of sign) Group 1 E (100 ft behind sign) Participants Object Viewings per Participant Daytime: 10 Total Daytime Object Viewings Nighttime: 9 Total Nighttime Object Viewings Group 2 C (200 ft in front of sign) E (100 ft behind sign) Participants Object Viewings per Participant Daytime: 11 Total Daytime Object Viewings Nighttime: 10 Total Nighttime Object Viewings Group 3 C (200 ft in front of sign) E (100 ft behind sign) Participants Object Viewings per Participant Daytime: 9 Total Daytime Object Viewings Nighttime: 11 Total Nighttime Object Viewings Total Viewings ,620 Procedure Appendix B contains a summary of the actions the researchers completed with each participant, from the start when they greeted the participant to the end when they escorted the participant out of the facility. This section identifies the specific procedures that involved the data used in the analyses presented in Chapter 3. While navigating the course, each participant did the following while approaching each sign: a. Indicated left or right when the participant was able to determine the side of the lane where the stated control object was placed. b. Read the assigned travel time or target word on the sign. c. Indicated left or right when the participant was able to determine the side of the lane where the stated target object was placed. The participant was asked to do each of the above steps as soon as he or she could detect the assigned object or read the assigned word or travel time with a reasonable level of accuracy. The participants were allowed to correct mistakes. Instructions for the legibility task (b) and 19
32 object detection task (c) were both given after the driver completed the first task (a). They could be completed in any order. When the participant correctly identified an object (a and c) or read the sign (b), the researcher in the vehicle immediately marked in the continuous GPS data stream that the task was completed. The notations in the GPS data stream were later used to identify the object detection and legibility distances when processing the data. With each lap, the researchers rearranged the objects and displayed different signs based on the ordering shown in Appendix A. Each participant was randomly assigned an ordering for the daytime visit and a different ordering for the nighttime visit. Data Handling The focus of this study was the assessment of a full-matrix color CMS in terms of legibility of the sign and its effects on the visibility of objects near the sign at night. The measures of effectiveness were the legibility distance (the distance from where the participant correctly read the target word or travel time to the sign) and the object detection distance (the distance from where the participant correctly identified the test object to the object s location). The effects on legibility distance and object detection distance were attributed to different elements of the signs, including the type of sign (a travel time sign or a type of safety sign), the use of a logo, and the background color of the logo. With categorical variables, the results presented in Chapter 3 were derived from analyses of variance (ANOVAs) that identified the effects of sign elements on the two measures of interest. Variables included in the analyses that were not specific to the signs or logos were the time of day (day or night), age group of the participant (young or old), object used in the detection task (box, deer, or tire), placement location of the object (before or after the sign), and direction of the approach to the sign (north or south). RESULTS This chapter describes the analyses of the data collected during the Riverside closedcourse study. The dependent variables in the data were the detection and legibility distances obtained from the two primary tasks assigned to the drivers: reading a target word or travel time on the CMS and detecting an object near the driving lane. Legibility distance was measured as the distance from the sign when the driver correctly read the target word or travel time. The detection distance was measured as the distance from the object when the driver correctly announced the location of the object (left or right side). The independent variables used to answer the research questions were sign type, logo presence, logo background color (when there was a logo), and object location (referring to whether the target object was located 100 ft behind the sign or 200 ft in front of the sign). Other independent variables, such as age group or time of day, were included where appropriate but were not necessarily the focus of the research. 20
33 The sections below are organized as follows. The first section presents cumulative distribution plots of the legibility distances for the four types of signs (black single phase, black dual phase, blue single phase, and travel time), followed by cumulative distribution plots of the object detection distances for the three objects (box, deer, and tire) at night. The plots for detection distance are divided based on where the target object was located, corresponding to Points A, C, and E in Figure 1. The two test locations were 200 ft in front of and 100 ft behind the sign. A third location was 1,500 ft in front of the sign. Though not included in the ANOVAs, the detection distances for the objects 1,500 ft from the sign were comparable to the control data, where the data were assumed to not be affected by the CMS. Following the section with the distribution plots is a description of the analyses of the legibility distance. That section is followed by a discussion of the analyses of the object detection distances. The analyses were mixed-effects ANOVAs, with each participant included as a random effect. Data Distributions Figure 8 and Figure 9 show cumulative distribution plots of the legibility distances and object detection distances, respectively. The plots in Figure 8 show legibility distances of each type of sign for (a) daytime conditions, and (b) nighttime conditions. The plots in Figure 9 show detection distances for the (a) box, (b) deer, and (c) tire when the object was placed at the control location 1,500 ft in front of the sign or a test location 200 ft in front of or 100 ft behind the sign. 21
34 (a) Daytime Legibility Distance (ft) (b) Nighttime Legibility Distance (ft) Figure 8. Cumulative Distribution Plots of Legibility Distances for the Four Sign Types by (a) Day, and (b) Night. 22
35 (a) Box Detection Distance (ft) (b) Deer Detection Distance (ft) (c) Tire Detection Distance (ft) Figure 9. Cumulative Distribution Plots of Detection Distances for the (a) Box, (b) Deer, and (c) Tire at Night. 23
36 Figure 8 shows that legibility distances were longest for the safety signs (black single phase, black dual phase, and blue single phase) and shortest for the travel time signs. The notable difference is a reflection of the way the participants read the assigned route on the travel time signs. Researchers asked participants to read the travel time to, for example, Highway 58 or Interstate 25, and many participants would wait until they could read the smaller route number within the symbol 58 or 25 rather than rely on the shape of the symbol that is unique to the highway or interstate routes. The legibility distances for travel time signs were therefore not shorter because drivers could not read the travel time as easily but because of the smaller number within the route symbols. It is likely that the legibility distances for travel times would be different if the routes on the travel time signs were familiar to the drivers or the numerals in the shields were equivalent to the safety message sign words. One way to think about legibility is to consider legibility index, which expresses legibility distance as feet of legibility distance per unit of inch of letter height. This standard metric allows results of different studies using different sized signs to be compared. Section 2A.13 of the MUTCD recommends a minimum legibility index of 30 ft/in (1). The results of the legibility test for the safety signs (18-in. letters) showed a median legibility index of approximately 60 ft/in during the day and 45 ft/in. at night. For the travel time signs, the median legibility index was approximately 52 ft/in. during the day and 40 ft/in. at night. Considering the even balance of young and old drivers, these average legibility indexes are notably high. Values for legibility index of retroreflective signs as measured in related studies tend to be in the range of ft/in., depending on age group. Such a difference between the CMSs and retroreflective signs may be attributed to the constant and relatively high luminance from a CMS compared to a retroreflective sign illuminated by headlamps. The distribution plots for the deer, shown in Figure 9, excluded observations from detecting the deer behind the sign when the sign was off. All the observations for the three objects at the test locations thus represented conditions of the sign being on. As shown in Figure 9, the detection distances for the deer and box were consistently shorter near the sign than at the control location 1,500 ft from the sign. This was likely an effect of glare from the sign regardless of whether there was a logo present on the sign. When those objects were behind the sign, the detection distance was longer than when they were in front of the sign. This relationship was not consistent with detection of the tire, whose detection distance was greatest when the tire was in front of the sign and shortest at the control location. The tire was a low-contrast object when viewed against the pavement at night. It is likely that the increase in detection distance for the tire when it was in front of the sign was due to illumination provided by the sign. Further details of this analysis are presented in later sections. Analyses of Legibility Distance The researchers observed throughout the study that the task of reading a travel time sign differed from the task of reading a safety sign because many participants waited until the number 24
37 within the route symbol was legible before they identified the travel time. Such a clear difference led to analyzing legibility distance for the travel time and safety signs separately. The sections below present the separate analyses, which first investigated the effects of having a sponsor logo (using the variable logo presence) before investigating the effects of specific logo background colors. The logo background color was analyzed only if the first ANOVA showed that the logo presence significantly affected legibility. Daytime and nighttime data were analyzed together with time of day as an independent variable. The mixed-effects ANOVAs presented in the sections below were reduced models that only included significant effects. Appendix C shows each original mixed-effects model with all factors and interactions. Fixed effects included the following: Logo presence (no logo or logo). Logo background color (dark, dark/white [for dual phasing], or white), only used if the variable logo presence was significant. Sign type (black single phase, black dual phase, and blue single phase), only used when analyzing the safety signs. Age group (young or old). Time of day (day or night). Travel Time Signs Effect of Logo Presence Table 6 shows the results of the reduced model from the mixed-effects ANOVA testing the legibility of travel time signs. The results from the full model with the significance levels of all effects are shown in Appendix C. As shown in Table 6, there was no significant effect of logo presence or any interaction of logo presence with another variable, indicating that sponsor logos had no impact on the legibility of travel time signs. Age group and time of day, however, did affect legibility of travel time signs. Values for the least square means of the model and the Tukey Honest Significant Difference (HSD) test based on the reduced model are shown in Table 7. For the Tukey test, levels of a variable not connected by the same letter were significantly different. 25
38 Table 6. Mixed-Effects ANOVA Testing Legibility of Travel Time Signs (Reduced Model). Fixed Effect DF F Ratio Prob > F Time of Day < Age Group Age Group * Time of Day Table 7. Least Square Means and Tukey HSD Test from the Mixed-Effects ANOVA Testing Legibility of Travel Time Signs. Effect Least Square Standard Tukey HSD Mean Error Test Time of Day Day Night Age Group Young Old Age Group * Time of Day Day, Young A Night, Young B C Day, Old B Night, Old C From the least square mean values shown in Table 7, the average legibility distance was about 920 ft during the day, but only 700 ft at night. These values correspond to legibility indices of about 51 and 39 ft/in, respectively. With the effect of the age group and the interaction of age group with time of day, the mean legibility distance ranged from about 595 to 1,060 ft, depending on the two variables. These distances translate to legibility indices of 33 ft/in for old drivers at night and 59 ft/in for young drivers during the day. Based on the Tukey test, legibility distance for young drivers at night was not statistically different from that of old drivers at night. Note that these values are all above the MUTCD minimum legibility index of 30 ft/in. Effect of Logo Background Color Models with logo background were not investigated because the effect of logo presence was not significant. Safety Signs Effect of Sign Type and Logo Presence Table 8 shows the results of the reduced model from the mixed-effects ANOVA testing the legibility of safety signs. The results from the full model with the significance levels of all effects are shown in Appendix C. The analyses included the variable sign type to represent the three different types of safety signs investigated black single phase, black dual phase, and blue single phase describing the background color of the sign and the number of phases in its 26
39 message. Sign type and logo presence were significant effects, as shown in Table 8, and included interactions between themselves. The interaction meant that the effect of a logo changed when paired with certain types of signs. Values for the least square means and the Tukey HSD test based on the reduced model are shown in Table 9. Table 8. Mixed-Effects ANOVA Testing Legibility of Safety Signs (Reduced Model). Fixed Effect DF F Ratio Prob > F Time of Day <0.001 Age Group Sign Type Logo Presence < Age Group * Time of Day Sign Type * Logo Presence Table 9. Least Square Means and Tukey HSD Test from the Mixed-Effects ANOVA Testing Legibility of Safety Signs. Effect Least Square Standard Tukey HSD Means Error Test Time of Day Day Night Age Group Young Old Sign Type Black Dual Phase A Black Single Phase A Blue Single Phase B Logo Presence No Logo Logo Age Group * Time of Day Day, Young A Night, Young B Day, Old B Night, Old C Sign Type * Logo Presence Black Single Phase, No Logo A Blue Single Phase, No Logo A Black Dual Phase, Logo A Black Single Phase, Logo A Black Dual Phase, No Logo A Blue Single Phase, Logo B Similar to the analysis of travel time signs, the least square mean values in Table 9 show notable differences in the legibility for young and old drivers during the day and at night. The mean legibility distance for blue single-phase signs was significantly shorter than the mean legibility distance of the black single- and dual-phase signs, but by a difference of less than 27

40 5 percent. Legibility distance when a logo was used was reduced by about 3.5 percent overall. The Tukey test of the interaction of sign type with logo presence showed that logos significantly affected the legibility distance of only blue single-phase signs. Figure 10 shows a plot of the least square mean values for the interaction of sign type with logo presence. Figure 10. Least Square Mean Values for the Interaction of Logo Presence and Sign Type Illustrating That Logo Presence Was Significant Only for Blue Signs. Effect of Logo Background Color With the effect of logo presence significant in the analysis of the safety signs, the appropriate next step was to investigate whether or not the background color of the logo significantly affected legibility. This section presents the analysis of the safety signs that had a logo. Table 10 shows the results of the reduced model from the mixed-effects ANOVA (the full model is shown in Appendix C). Based on the significance values shown in Table 10, logo background had a significant effect on legibility distance. There was also an interaction with time of day, suggesting that the effect of the background color changed depending on whether or not the driver viewed the sign during the day or at night. Table 11 shows values for the least square means and the Tukey HSD test based on the reduced model. 28
41 Table 10. Mixed-Effects ANOVA Testing Safety Sign Legibility with Logo Background (Reduced Model). Fixed Effect DF F Ratio Prob > F Time of Day < Age Group Sign Type < Logo Background Time of Day * Sign Type Time of Day * Logo Background < Table 11. Least Square Means and Tukey HSD Test from the Mixed-Effects ANOVA Testing Effects of Logo Backgrounds on Safety Sign Legibility. Effect Least Square Standard Means Error Tukey HSD Test Time of Day Day Night Age Group Old Young Sign Type Black Dual Phase A Black Single Phase A Blue Single Phase B Logo Background White A Dark/White A Dark A Time of Day * Sign Type Day, Black Dual Phase A Day, Black Single Phase B Day, Blue Single Phase C Night, Black Single Phase D Night, Black Dual Phase D E Night, Blue Single Phase E Time of Day * Logo Background Day, White A Day, Dark B Day, Dark/White B Night, Dark/White C Night, Dark D Night, White D The interaction of logo background with time of day in Table 11 shows how each background color affected legibility differently depending on whether drivers were reading the sign at night or during the day. During the day, the longest legibility distance occurred when the logo s background color was white. At night, legibility distances were shortest when the logo s background color was white. Figure 11 illustrates the least square means for the interaction of time of day with logo background, showing that the change in legibility distance from day to nighttime viewing was greatest for the logos with a white background. 29

42 Figure 11. Least Square Mean Values for the Interaction of Time of Day and Logo Background Color. Nighttime Object Detection This section presents the analyses of the effects of the CMSs on object detection distances at night. The first analysis describes the effects of the signs on object detection regardless of any message. The subsequent analyses identify the effects of specific messages (using the variable sign type), the use of a logo (logo presence), and the background color of the logo (logo background). Effect of CMS Presence on Object Detection During the 28 approaches to a CMS with the task of identifying a target object, one condition every participant encountered was the task of detecting the deer while the sign was off. For consistency, the deer was always at the same location (100 ft behind the sign) and on the same approach (southbound). These detection distances could be used to validate the assumption that the detection distances of the objects at the control location (1,500 ft from the sign) represented the condition of a driver viewing an object when the sign was off or there was no sign. The average detection distance of the deer at the control location was 305 ft. The average detection distance of the deer behind the sign when the sign was off was nearly identical at 304 ft. Figure 12 shows these detection distances. The mean detection distances of the objects at the three locations are also shown in Figure 12 to illustrate the impacts of a CMS. 30

43 Note: The control point was located 1,500 ft from the sign, where it was assumed the sign had no effect on detection. Figure 12. Average Detection Distance of the Deer, Box, and Tire at Night. As shown in Figure 12, the average detection distance of the deer at the control location was nearly identical to the average detection distance when the deer was behind the sign and the sign was off. This equivalence supports the experimental design goal and claim that detection distances for the objects 1,500 ft from the sign could be reasonably used as control values for making comparisons with the study conditions. When the sign was on, the detection distances were reduced by nearly 50 ft (16 percent) if the deer was behind the sign and 85 ft (29 percent) if the deer was in front of the sign. The reduced detection distances when the sign was on are indicative of effects from glare due to the sign regardless of whether there was a logo present. Results of a Tukey test indicated that these reduced detection distances were significantly different from each other and from the two mean distances for the control location and when the sign was turned off. Like with the deer, detection distances were similarly reduced for the box near the sign. Mean detection distance decreased by 23 and 76 ft (6 and 20 percent) when participants viewed the box behind and in front of the sign, respectively. A Tukey test indicated that the detection distances of the box behind the sign were not different from the detection distances at the control location. The distances when the box was in front of the sign, however, were significantly different from the other two. For the tire, the detection distance appeared to increase by 11 percent when the tire was placed 100 ft behind the powered sign and 23 percent when the tire was placed in front of the sign, both compared to the tire at the control location. A Tukey test indicated that the detection distance when the tire was behind the sign was not significantly different from the detection distance at the control location. The increase when the tire was in front of the sign, however, was 31
44 significant. This increase in detection distance can be attributed to the illumination from the sign on the tire, despite the effects of glare. Effects of Sign Elements on Object Detection The distributions shown in Figure 9 and the averages shown in Figure 12 suggest that CMSs affect drivers ability to detect objects, whether by reducing detection distances for some objects (the box or deer) or increasing detection distances for others (the tire). This section presents the analyses that identified the effects of specific elements of the CMSs. The factors included the type of sign (which affects luminance), the use of a logo, and the background color of the logo. As with the legibility analyses, logo background color was analyzed only if the use of a logo significantly affected detection distances. The results of the mixed-effects ANOVAs described in the sections below were based on reduced models that included only significant effects. Each original model with all effects and interactions is shown in Appendix C. The detection distance of the test objects was the dependent variable. Fixed effects included the following: Logo presence (no logo or logo). Logo background color (dark, dark/white [for dual phasing], or white), only used if the variable logo presence was significant. Sign type (black dual phase, black single phase, blue single phase, or travel time). Object (box, deer, or tire). Object location (200 ft before or 100 ft after the sign). Age group (young or old). Effect of Sign Type and Logo Presence Table 12 shows the results of the mixed-effects ANOVA testing how logo presence and sign type affect object detection distance. The model contained only significant factors, reduced from the original mixed-effects ANOVA, as shown in Appendix C. Based on the values shown in Table 12, the effects that influenced detection distance the most were the object, object location, and age group, though logo presence and sign type were still significant factors. 32
45 Table 12. Mixed-Effects ANOVA Object Detection Distance (Reduced Model). Fixed Effect DF F Ratio Prob > F Logo Presence Sign Type Object < Object Location < Age Group Logo Presence * Sign Type < Logo Presence * Object Location Sign Type * Object Location Object * Object Location < Object * Age Group < Least square mean values for the model effects are shown in Table 13. While the effects of logo presence and sign type were significant, their effect overall was only ft based on the values of the least square means. While the effects of logo presence or sign type were small, the interactions between the two factors were significant, suggesting that certain combinations of logos and signs produced different detection distances than others. The values for the interaction of logo presence and sign type in Table 13 show some inconsistent results based on object detection distance. The black single-phase sign with a logo resulted in shorter detection distance than the same sign without a logo; however, the black dualphase sign with a logo resulted in a longer detection distance than the same sign without a logo. The Tukey HSD test indicated that there was no unique effect of logo within each of the other types of signs. 33
46 34 Table 13. Least Square Means and Tukey HSD Test from the Mixed-Effects ANOVA Testing Object Detection at Night. Effect Least Square Mean Standard Error Tukey HSD Test Effect Least Square Mean Standard Error Tukey HSD Test Logo Presence Logo Presence * Object Location No Logo No Logo, -100 ft A Logo Logo, -100 ft B Sign Type Logo, 200 ft C Blue Single Phase A No Logo, 200 ft C Black Single Phase A B Sign Type * Object Location Travel Time A B Blue Single Phase, -100 ft A Black Dual Phase B Black Dual Phase, -100 ft A Object Black Single Phase, -100 ft A Box A Travel Time, -100 ft A Deer B Blue Single Phase, 200 ft A B Tire C Black Single Phase, 200 ft A B Object Location Travel Time, 200 ft B C Behind Sign Black Dual Phase, 200 ft C In Front of Sign Object * Object Location Age Group Box, -100 ft A Young Box, 200 ft B Old Deer, -100 ft C Logo Presence * Sign Type Deer, 200 ft D Black Single Phase, No Logo A Tire, 200 ft E Blue Single Phase, No Logo A Tire, -100 ft E Black Dual Phase, Logo A B Object * Age Group Travel Time, No Logo A B C Box, Young A Blue Single Phase, Logo A B C Deer, Young B Travel Time, Logo B C Box, Old B Black Single Phase, Logo C Deer, Old C Black Dual Phase, No Logo C Tire, Young C D Tire, Old D

47 The interaction of the effect object location with logo presence shown in Table 13 was used to answer the research question relating to whether or not the glare from a sponsor logo affects detection distances at one location more than another. The interaction of object location with sign type was also relevant because each type of sign had different levels of luminance. The results for these two interactions were inconsistent. Plots of the least square mean values of the interaction terms Logo Presence * Sign Type and Logo Presence * Object Location are shown in Figure 13 and Figure 14. Again, these results show some inconsistencies. In Figure 13, the presence of a logo was shown to reduce detection distances under all sign types except for the black dual-phase signs. The effect, however, was not significant for the blue single-phase or travel time signs. Figure 14 illustrates how the presence of a logo reduced detection distance only for objects located 100 ft behind the sign. Figure 15 shows values for the interaction of sign type and object location. Travel time signs and black dual-phase signs had significantly shorter detection distances when objects were in front of the sign. Plots of least square means for other interactions are shown in Appendix C. Figure 13. Least Square Mean Values for the Interaction of Logo Presence and Sign Type. 35


48 Figure 14. Least Square Mean Values for the Interaction of Logo Presence and Object Location. Figure 15. Least Square Mean Values for the Interaction of Sign Type and Object Location. Since several two-way interactions were significant, it was worth examining three-way interactions. A three-way interaction of Logo Presence * Object * Object Location would indicate that the logos impacted object detection distance differently for each object at each of the two locations tested. A Tukey HSD test of the three-way interaction, shown in Appendix C, indicated that there was no effect of logos specific to a particular object at each location. 36
49 Effect of Logo Background Color The use of a logo was found to affect object detection distances for objects placed behind the sign, though a follow-up analysis identified that this relationship applied specifically to only the tire behind the sign. The appropriate next analysis was to investigate the effects of specific logo backgrounds. The analysis of the signs with logos (a full-model ANOVA is documented in Appendix C) could not attribute any effects of the object detection task to the background color of the logo. Summary The following points summarize the findings of the analyses with respect to the sponsoring logos and sign messages: Sponsor logos had no effect on the legibility distances of travel time signs (see Table 6). Sponsor logos had a small effect on the legibility distance of safety signs based on the main effect, as shown in Table 9. Specifically, safety signs with a blue single-phase message were the only signs affected by the use of a logo (an 8 percent reduction due to logos; see Table 9). At night, safety signs with sponsor logos that had a white background had the shortest legibility distances, though not significantly shorter than those with logos on a darkcolored background (see Table 10). The distance at which drivers could detect objects near a sign at night was reduced when the sign was on (see Figure 12). The use of sponsor logos marginally impacted object detection based on the main effect of logo presence, as shown in Table 13. There was a significant reduction in detection distance due to logos when objects were placed 100 ft behind the sign. There was no particular type of sign message that, when a sponsor logo was used, negatively affected object detection more than any other sign message (see Table 13). Conversely, there was no sign message that would be most suitable for a logo. CONCLUSIONS The objective of evaluating drivers on the closed course was to identify the effects of using sponsor logos on CMSs in terms of sign legibility and object detection. Two different types of sign messages were used: travel time signs, which identify an estimated time to reach a specific route, and safety signs, which inform drivers of a specific safety-related condition (such as an AMBER alert). The logos used on the signs came from a sample of national and local businesses that may be interested in sponsoring the sign messages displayed. 37
50 The two measures of effectiveness were legibility distance and object detection distance. Legibility distance was measured as the distance from the vehicle to the sign when the driver correctly read the assigned word or travel time. Object detection distance was the distance from the vehicle to the target object when the driver correctly identified the object. The objects tested were a box, a life-size deer, and a tire. When near the sign, the target objects were located either 200 ft in front of the sign or 100 ft behind the sign. As control data, detection distances were also obtained when the object was 1,500 ft from the sign. Legibility distances of the CMS messages were notably high in comparison to traditional traffic signs and well above the minimum value of 30 ft/in recommended in the Texas Manual on Uniform Traffic Control Devices (TMUTCD). During the day, the median legibility index was approximately 60 ft/in. At night, the index was approximately 45 ft/in. Drivers were able to read the sign at such great distances compared to retroreflective signs because they did not need to rely on illumination from their headlamps reaching the sign and reflecting back to the driver. The resulting luminance from a retroreflective sign would have been comparably low due to the height of the overhead sign and the great distance from which drivers were reading the CMS. The next section reviews the research questions identified in Chapter 2, providing answers based on the results presented in Chapter 3, followed by a discussion of the findings. Research Questions This section repeats the study questions asked in Chapter 2 and answers them based on the results presented in Chapter 3. The questions are divided into groups for legibility distance, last-look distance, and object detection distance. Legibility Distance 1. Does the use of a sponsor logo affect sign legibility? The sponsor logo did not impact the legibility of the green travel time signs and black safety signs (single and dual phase). The use of a sponsor logo next to a sign message reduced legibility for only the blue single-phase safety signs (by 8 percent). However, even these signs with a legibility distance of 905 ft (averaged across day and night), or 50 ft/in legibility index, were well above the MUTCD recommended minimum legibility index of 30 ft/in. 2. Does the color or brightness of a sponsor logo affect a sign s legibility? There was no impact on legibility due to the background of the sponsor logo, categorized as white, dark, or dark/white. 3. Does the background color of a safety message sign affect legibility? The legibility distance of the blue single-phase signs was significantly shorter than the legibility distance of the other signs (by percent). Despite these small differences across 38
51 colors, all of the signs produced legibility indices of 50 ft/in or greater, well above the recommended minimums in the MUTCD. Nighttime Object Detection Distance 1. Does a CMS affect a driver s ability to detect roadway hazards? The CMS reduced detection distances of the deer and box but increased the detection distance for the tire when the tire was in front of the sign, regardless of whether a logo was present. This finding indicates that glare from the sign negatively impacts the detection distance for some objects but has the potential to increase detection distance if the illumination from the sign is great enough on a low-contrast object. 2. Does the use of a sponsor logo affect a driver s ability to detect hazards? Overall, sponsor logos have a marginal effect on detection distances. The measured effect was approximately 10 ft, which is reasonably within the margin of error for the study procedure. 3. Does the color or brightness of a sponsor logo affect the ability to detect hazards? The background color of the sponsor logo had no effect on the object detection task. 4. Is the effect of a sponsor logo on the ability to detect a hazard dependent upon the location of the hazard, either before or after the sign? While sponsor logos overall had a small effect on object detection distances, the effect was most evident when the objects were placed 100 ft behind the sign. The effect was a reduction in detection distance of 24 ft when a logo was used. 5. Does dual phasing for signs (whether only the message changes, only the logo changes, or both change) affect the visibility of hazards? Compared to the black single-phase signs, object detection distances with dual-phase signs were reduced by 15 ft. Discussion The analyses in this study show that glare from a CMS may reduce a driver s ability to detect objects near the road. However, in some instances, the object may actually benefit from the sign s illumination. This is not the first study to investigate the effects of glare on the ability to see objects. In fact, another recent study (3) suggests that some retroreflective signs provide enough luminance that driver vision is impacted by glare from the sign. The researchers found that detection distances decreased for some objects when placed near signs. The three objects in that study included a deer, a pedestrian, and a small wooden plaque. Similar to the observations with the deer and box in this study, whose detection distances decreased by up to 85 and 75 ft 39
52 when in front of the sign, the detection distances of the deer and pedestrian in the earlier study were significantly reduced when near a sign, and sometimes by more than 100 ft. There was no effect, however, for the wooden plaque. The detection distance of the tire in the present study was not reduced when the tire was placed near the sign, but actually increased when the tire was in front of the sign. The sign s illumination of the tire more than compensated for the glare. Another interesting connection between the two studies is that there were no differences between the detection distances for the old and young drivers viewing the wood and the tire. Neither the wood in the earlier study and tire in the present study had a high level of contrast against the pavement, nor did they stand as high as the other objects. For objects that have comparably short detection distances, the illumination from the CMS may in fact be beneficial, at least when the object is in front of the sign. Every object drivers may encounter on a road will be impacted by glare and illuminance from a sign in a unique way. Legibility distances of each type of message on the CMSs were remarkably long, especially in light of other studies of legibility that involved retroreflective signs. Sponsor logos on the CMSs had only minor effects on legibility distance. Reduced legibility occurred only when logos were used on safety signs with a blue background, which affected legibility distance by 8 percent. All signs produced legibility indices of greater than 50-ft legibility for every inch of letter height. These values are well above the MUTCD minimum recommended value of 30 ft/in. 40
53 CHAPTER 2. EVALUATION OF FONT ALTERNATIVES FOR FULL MATRIX CHANGEABLE MESSAGE SIGNS CMS technology has improved greatly in the past 10 years in terms of brightness, pixel resolution, and viewing angularity. The higher pixel resolution allows for a greater variety of font styles to be used on CMS than in the past. As TxDOT begins to adopt higher resolution full matrix CMS, decisions on which font to use on these signs will need to be made. The current task supports this decision making by evaluating the legibility of three different typeface sizes and styles included in one vendor s software library. One of the advantages of new LED signs is that they are capable of displaying messages in many fonts. In addition, the signs are big enough and the resolution is high enough that the sign can be split to have different areas of the sign used for different purposes. It is anticipated that if sponsorships are used, the sponsor logo will occupy one third of a sign s horizontal space. This may require using a more condensed typeface with a higher height:width ratio in order to accommodate the horizontal line space dedicated to the sponsor logo. Another alternative is to use a smaller letter height. In the previous task, an 18 in. letter was used as specified in the TMUTCD. METHOD Experimental Design The research team organized an expert panel viewing that included TTI and TxDOT traffic operations staff. The panel viewed multiple variations of interletter spacing and interline spacing in order to select the conditions to be tested in the study. The panel concluded that examining the amount of display area used in addition to font height and height:width ratio should be the main topics for the study. The study was designed to test the following sign variables: legibility according to letter height and letter width. There were three types of text font signs: 1) 16 in. tall letters where the letters are 20 pixels in height and 12 pixels in width, 2) 18 in. tall letters where the letters are 23 pixels in height and 14 pixels in width, and 3) 18 in. tall letters where the letters are 23 pixels in height and 15 pixels in width. The messages were displayed on two types of signs: 1) the background covered the whole sign, and 2) the right third of the sign board was blank. The background color for all signs was blue, and all letters were white. The research team used an incomplete factorial design where letter height was tested for signs that displayed the message using the full width of the display matrix. For signs where one-third of the board was blank, only 18 in. letters where displayed. Letters with 14 pixel width were compared to letters with 15 pixel width. This design allowed repeated measures of each sign type to allow a variety of words to be used. In this way, the research team could assure that any legibility advantage was not due to a particular word that happened to be easier to read. The amount of time participants spent on the 41
54 task was a consideration in the experimental design as well. In general, the research team finds that testing should be complete within minutes to keep the participants attentive and engaged in the tasks. At the time of this testing, only one of the full matrix CMS was functional. Given these constraints, a total of 16 driving laps could be completed limiting the design to an incomplete factorial, as shown in Table 14. In addition to the driving laps, participants completed a stationary test similar to an optometry test. Message displayed full-width Message on Left 2/3 of sign Table 14. Experimental Design for Driving Laps. 16 in. letters (20 12 pixels) 18 in. letters (23 15 pixels) 18 in. letters - Condensed (23 14 pixels) X X X X Experiment Signs The sign messages were groups of six words unrelated to driving, each six letters in length. The experimenter instructed the study participants to read a preselected word as they approached the sign. The legibility distance was the distance from the sign at which the study driver correctly read the assigned time or target word. The same sign messages were used for every participant. There were four types of singlephase signs. Each type of sign was displayed once for each participant. Table 15 shows pictures of the tested sign messages to evaluate letter height. Table 16 shows the signs used to evaluate letter width. Table 17 shows the test signs used in the stationary testing. Thirteen random letters were arranged in groups of 4 5 letters to aide in reading and recording. 42


55 Message Width Table 15. Signs Used for Full Width Display Evaluation of Letter Height. 16 in. letters (20 12 pixels) 18 in. letters (23 15 pixels) Full Board Table 16. Sign Messages Used for 2/3 Width Display Evaluation of Letter Width. Message 18 in. letters (23 14 pixels) 18 in. letters (23 15 pixels) Width Two-thirds of the board 43
 Note: Slight scaling issues may have been introduced in re-sizing the photos for the report.")
56 Message Font Table 17. Signs Used in Stationary Evaluation of All Three Fonts. Sign board message 16 in. letters (20 12 pixels) 18 in. letters (23 14 pixels) 18 in. letters (23 15 pixels) Note: Slight scaling issues may have been introduced in re-sizing the photos for the report. Measurement Equipment The study participants drove a 2014 Toyota Sienna equipped with eye-tracking cameras and a GPS receiver. A computer in the rear of the vehicle stored the data. Figure 16 shows pictures of the vehicle and equipment in the vehicle. A researcher operated the instrumentation in the vehicle and was responsible for logging the locations of sign legibility. The distances were based on the data collected by the GPS receiver. 44


57 (a) (b) Figure 16. Study Vehicle and Instrumentation for Collecting Data. Testing Location and Sign Specifications The study was executed at the Riverside campus of Texas A&M University on a runway no longer used by aircraft. The sign was Daktronics model Vanguard VF x RGB and was located on the south end of the runway. The sign was placed 20 ft directly above the defined driving lane. Dimensionally, the sign was 7 ft 10 in. tall and 28 ft 5 in. wide with an 8-in. border yielding an active display area of 6 ft 6 in. by 17 ft 1 in. The sign had 20 mm (0.81 in) pixels in an array of 96 rows by 400 columns. The course was an oval north/south loop with approximately 2,800 ft of straight approach distance to the sign. The north and south travel lanes were spaced 200 ft apart laterally. The sign structure was wide enough that the test vehicle could pass directly underneath the sign. The drivers were instructed to navigate the course at 35 mph. The travel lanes were marked with retroreflective raised pavement markers and retroreflective lane striping. Figure 17 shows an overview of the study track course with location A indicating the stopping point for the stationary testing. 45
58 Figure 17. Overview of the Study Course. Participants The analyzed data in this study were collected from 20 people recruited to participate in the study. There were 9 males and 11 females. The ages of the drivers were years (average 65.5). Each participant completed tests of visual acuity, color blindness, and contrast sensitivity. No participant was turned away for inadequate vision. Figure 18 shows the distribution of visual acuities for the participants. Participants were compensated $40 for their participation. 46
59 Figure 18. Distribution of Measured Visual Acuity of the Participants. Procedure The experiment was comprised of two phases driving and stationary. The first phase had a driving component where subjects would drive the course. While approaching each sign, subjects were instructed to read a target word at the earliest possible location and time. For example, the experimenter would say read the second word on the third line of the sign. Legibility was assessed by measuring the distance from the sign at which the driver correctly read it. After subjects completed all 16 signs, then phase two of the experiment was performed. For phase two, subjects were asked to stop at a point 728 ft from the sign (point A in Figure 17) and read a line of letters. The distance from the sign was selected based on the previous study where 728 ft was where 85 th percentile of participants was able to read the message on the sign correctly. At first, participants would read a display with a single line of letters in order to assess their individual performance. The goal was to get each participant at a distance where they could read the 18 in. letters with 70 percent accuracy. If the participant was too uncomfortable to read all letters, then the researcher would instruct the participant to move to 600 ft from the sign board. If the participant showed no struggle and got all the letters right, then the subject was instructed to move upstream to 800 ft from the sign board. If the subject was comfortable reading the sign and missed less than 3 letters, then the participant would read the rest of the signs at 728 ft away from the sign board. The following steps summarize the actions the researchers completed with each participant: 47
60 1. Greet the participant, introduce the study concept, sign the waiver, conduct a vision test, and complete the intake form. 2. Escort the participant to the vehicle and calibrate the instruments in the vehicle. 3. Instruct the participant to drive to the start of the study site. 4. Stop on the taxiway and make sure all equipment is working correctly. 5. Start and complete 16 total laps (one sign with each lap), changing the sign based on the lap number for that participant. 6. While approaching each sign, the participant is to read the target word. 7. After the 16 laps, the participant would stop the instrumented vehicle 728 ft from the CMS sign and a preliminary optometry test sign would be read by the participant to determine the comfort level. 8. The participant would read the middle line of all optometry test signs RESULTS With data from 20 drivers that viewed signs 16 times during the driving phase and 3 different signs for the stationary test, the study design had the potential for 320 observations for the driving phase and 60 observations for the optometry test portion of the field study. After eliminating data that were not usable due to experiment error, there were 261 legibility distances. Analysis of Legibility While Driving The research team built a database that combined the GPS distance with the experimenter data sheet. These data only include the signs that were read during the laps, not the stationary test. Table 18 lists the variables. 48
61 Variable Sign Number Participant Number Date Time Age Table 18. Variables and Explanation. Explanation this is interchangeable with lap number Participant number Day the experiment was conducted time of day age of participant AgeGr Age group (50 59, 60 69, >70) Gender Visual Acuity Male (M) or Female (F) obtained from vision test Contrast A score on line A of contrast sensitivity test Contrast B score on line B Contrast C score on line C Contrast D score on line D Contrast E score on line E Astigmatism self-reported Corrective lenses self-reported Color Blind assessed with Ishihawa color plates Other Vision Conditions self-reported SignFileName Target Word Row Col Correct Word Extra tag Word Spoken Comments Distance from sign file name of the files word that subject was meant to read row where target word was located column where target word was located Y/N whether the correct word was read whether extra tag was made wrong word spoken by subject when guessing comment from experiments calculated GPS distance Preliminary analysis identified one particular target word though that nearly everyone got wrong. The legibility difficulty with this word appeared to be idiosyncratic to this single word and so all data from this word was dropped. The research team performed quality assurance on the data based by creating a script that would remove these data and any recorded distance when the participant got the word incorrect. Figure 19 shows the overall range of legibility distances for all conditions. The distribution is relatively normal and matches the range of legibility distances obtained in the previous study. 49
62 Figure 19. Overall Range of Legibility Distance Measurements. To illustrate the effect of letter height, Figure 20 shows the median and range of the legibility distances as a function of letter height. The box indicates the 25 th and 75 th percentile distances in the distribution for that condition. The mean legibility distance for the 16 in. letters was 634 ft, for 18 in. letters normal width it was 760 ft, and for the condensed 18 in. letters, it was 714 ft. When expressed as legibility index, which is the legibility distance divided by the letter height, these results show that both the 16 in. letter and the condensed 18 in. letter have a legibility index of 39 ft/in., while the 15 pixel wide 18 in. letter has an index of 42 ft/in. 50
63 Figure 20. Overall Legibility Distance as a Function of Letter Height. Box and Whiskers Indicate Median, Range, 25 th and 75 th percentile The legibility distances ranged from less than 200 ft to over 1200 ft. Some of this variability is due to each individual participant s visual acuity ability. Table 19 shows a breakdown of legibility averages and ranges for each font type as a function of visual acuity. The column on the far right indicates the number of observations; recall that each of the 20 participants saw multiple signs. The effect of visual acuity is illustrated in Figure 21, collapsed across all three font conditions. 51
64 Table 19. Descriptive Statistics Showing Effect of Visual Acuity Test Scores on Legibility Distance. Letter Height (in.) Values Letter Average of Max of Min Of Count of width Visual Distance from Distance from Distance From Distance from (pixels) Acuity Sign Sign Sign Sign / / / / Total / / / / Total / / / / Total Grand Total Figure 21. Legibility Distance for All Fonts as a Function of Visual Acuity Score. 52
65 In order to assess whether limiting the overall width of the display area, the experimental design included the 18 in. (23 15 pixels) font in both the full and 2/3 width conditions. Table 20 shows that the mean legibility distance for this font in the full width display was 768 ft while in the 2/3 width display, it was 729 ft. Given the variability in the data, this effect is not significant. Table 20. Legibility Distance (ft) for Full Width and 2/3 Width Displays. Letter Height (in.) Letter width (pixels) Grand Total Full width Full Width Total /3 Width /3 Width Total Grand Total The participants in this study were all over the age of 50, because past research has shown that older drivers have more difficulty reading signs at night than young drivers. The research team created three groups of participants based on their decade of age. Table 21 shows the results based on age group. Table 21. Legibility Distances (ft) as Function of Age and Font. Letter Height (in.) Age Group Letter width (pixels) Grand Total Total Total > >70 Total Grand Total
66 Analysis of Legibility While Stationary The experimenter in the vehicle recorded how many of the 13 letters in each line were identified correctly for each of the fonts. The data were analyzed using a repeated measures analysis of variance. The results showed a significant (F2,38=23.82, p<0.001) effect of font where both of the 18 in. fonts were better than the 16 in. letters but were not different from each other. These results are in line with the legibility data gathered while driving. CONCLUSIONS The study demonstrated drivers can read messages with 18 in. letters farther away than 16 in. letters. But when expressed as legibility index, all of the fonts tested hover around the minimum legibility index of 40 ft/in recommended in the TMUTCD. This suggests that there is room for improvement in the design of individual letters. Using 1/3 of the display width for a sponsor logo should not affect legibility of the text message, and a condensed form of the 18 in. letters can be used without negatively affecting legibility a great deal. 54
67 CHAPTER 3. UPDATE TO THE GUIDE FOR DETERMINING TIME REQUIREMENTS FOR TRAFFIC SIGNAL PREEMPTION AT HIGHWAY-RAIL GRADE CROSSINGS BACKGROUND The existing Guide for Determining Time Requirements for Traffic Signal Preemption at Highway-Rail Grade Crossings worksheet was developed as a deliverable for project The specific objectives of the project were: 1. To increase safety at highway-rail grade crossings with nearby traffic signal-controlled highway intersections. 2. To reduce the disruption in coordinated traffic signal operations along arterials with railroad preemption. The researchers achieved these objectives by 1) examining safety, human factors, and operational problems at traffic signals near grade crossings; 2) identifying and evaluating potential solutions to these problems with regard to their effectiveness and applicability in Texas; and 3) combining applicable solutions into a guideline document that will help TxDOT staff recognize and address the special circumstances associated with signals near grade crossings. The guidelines the researchers developed were used to evaluate and improve safety and existing operations, and assist in the design future operations at highway-rail grade crossings. The worksheet that was developed provided specific guidelines for the following safety concerns: Safety Concern #1: Abbreviating normal pedestrian clearance and vehicular minimum green times. Safety Concern #2: Gates descending on stationary vehicles or trapping vehicles in a queue on the tracks with nowhere to go. Safety Concern #3: Failure to consider the longer length and slower acceleration of heavy vehicles. Safety Concern #4: Not providing sufficient time between the last vehicle leaving the crossing and the train arriving at the crossing. Safety Concern #5: Non-Supervised Interconnection Circuits and failsafe traffic signal controller preempt inputs. Safety Concern #6: Preemption over large distances. The worksheet facilitated addressing these safety concerns by calculating parameters for complex highway-rail interactions at at-grade signalized intersections. Detailed instructions were provided to enable the use of the worksheet. 55

68 EXISTING WORKSHEET The three-page worksheet was developed in PDF format. There were two versions of the PDF worksheet. One was a worksheet that was fillable electronically, which then performed calculations to determine various parameters to determine the preemption needs at the grade crossing being analyzed. Figure 22 illustrates a sample of the worksheet that was created in Project (5) and that has been adopted by TxDOT and many agencies in Texas and outside the state. Figure 22. A Sample of the Existing Worksheet Developed in Project The worksheet is supported by a 16-page instructions document that gives detailed guidance about the using the worksheet. The instruction document includes graphs and tables that the engineer conducting the analysis could use to determine various parameters affecting the preemption requirements at the grade crossing. These include the definition of design vehicles, acceleration characteristics for design vehicles, impact of grade on the acceleration rates for various design vehicles, parameters to estimate acceleration rates over larger distances, and the impact of gate descent on various design vehicles. Figure 23 illustrates a portion of the instructions for filling up the preemption worksheet. 56

69 Figure 23. Instructions for Completing the Preemption Worksheet. The worksheet and the accompanying instructions have been extensively used over the last 10 years by TxDOT not only to analyze existing grade crossings but also propose new grade crossings. These documents were also used by various cities in Texas and other municipalities outside Texas. OVERVIEW OF THE MODIFICATIONS With time, as more and more users were using the worksheet, some areas were identified that could improve the worksheet. These included simplifying entering some fields and identifying additional scenarios that the worksheet does not consider. While instructions for most of the entries in the worksheet required a small paragraph, some required about 4 5 paragraphs, consulting graphs and tables. Specifically, Line 24, which determines Time for design vehicle to accelerate through the design vehicle clearance distance (DVCD) has over four paragraphs along with a graph and table, making it very complicated for the user to determine the entry. Hence TxDOT had the following overarching objectives for the modifying the worksheet: 57
70 Standardize guidance for items that have a large effect on the requested APT such as minimum green, pedestrian timing, and vehicle gate interaction. Provide default values in some fields so that the user need not determine those values. The user, however, can change the values for analyzing grade crossings where the default values may not be suitable. Identify entries in the form that are rarely used and can be eliminated. Eliminate confusion on how to use the form when there is existing APT. Minimize the decision making for someone filling out the form (other than basic measurements). o Pedestrian truncation decision. o Automatically read from the graphs and tables to minimize user errors and simplify the process. Improve the figures in the worksheet. MODIFICATIONS MADE TO THE WORKSHEET Based on the multiple meetings with TxDOT engineers and other experts in the industry, the following modifications to the worksheet were listed: 1. Provided guidance on the storage of the worksheet. 2. Defined WB-67 as the default design vehicle with a length of 75 ft. 3. Improved the figures. 4. Addressed various scenarios of a design vehicle turning left toward the track from the street parallel to the tracks: a. Design vehicle being the first in the queue for a preempt at the start of green. b. Design vehicle already in motion in the queue for a preempt during the green. c. Design vehicle blocking the vehicle on the track phase. d. Design can or cannot be stored between the parallel road and the railroad tracks. 5. Developed guidance for pedestrian truncation: a. Move away from the existing process that requires some data collection at the intersection. b. Based on geometrics at the intersection. 6. Identified the duration of green indications for the track phase after the gates are down for various scenarios. WB-67 as a Vehicle Turning Left onto the Tracks The objective of this modification was to ensure that right-of-way transfer time is long enough to clear left-turning vehicle from travel lanes of track phase approach. Two critical cases were identified, assessed, and then addressed in the worksheet: 58
71 Storage distance is not sufficient to store left-turning truck. Storage distance is sufficient to store left-turning truck. The following assumptions were made to analyze these scenarios, which are illustrated in Figure 24: 5 seconds minimum green of right-of-way-transfer time (enough time to get two vehicles moving). Design case: Truck is second vehicle in platoon. Once moving, truck will continue into intersection, even if signal turns yellow. If CSD < Storage Distance If CSD > Storage Distance Figure 24. Illustration of Cases to Store a Left Turning WB-67 toward the Tracks. The scenario of the left turning truck included an analysis to calculate the distance traveled by the truck while turning. This analysis intern required a literature review of acceleration characteristics of trucks. The analysis was then conducted for various numbers of approach and receiving lanes as illustrated in Figure
72 Figure 25. Illustration of Geometric Scenarios Considered for a WB-67 Turning toward the Tracks. Pedestrian Truncation An informal survey of some operating agencies was conducted to get fact-based responses for policies being used to document pedestrian interval treatment during preemption. About 20 percent of respondents stated that the agency does not truncate or abbreviate the pedestrian signal phases. The take away from this feedback was that the agencies now believe that it is important to detect an approaching train early enough to appropriately terminate pedestrian movements that conflict with motor vehicles needing to clear the tracks (typically pedestrian movements crossing parallel to the rail alignment). The researchers identified the pedestrian conflict zones, made recommendations for removal of some conflict zones, and provided further guidance on the truncation/abbreviation of pedestrian phases based on expected volume of trains and pedestrian at the intersection. Figure 26 illustrates the recommendations for removal/relocation of pedestrian crossings followed by recommendations about interval truncations and abbreviations. 60
73 Remove/relocate crosswalks Figure 26. Illustration of Guidance for Removal/Relocation of Crosswalks. Based on analysis of prevailing practices and discussions with numerous operating agencies, the following recommendations have been made for truncation and abbreviation of pedestrian intervals. New grade crossing, consider providing full pedestrian clearance protection. If crosswalk width less than 4 lanes, consider truncations because FDW approximately equal to Y + AR. Wide approaches: o Very Light Ped traffic (<10 pedestrian activations per day) potentially use full truncation. o Light Ped traffic (10 to 50 pedestrian activations per day) consider preemption frequency to determine if partial truncation should be used or use design recommendations to separate pedestrian phases. o Moderate (1 in 4 cycle to 1 in 2 cycles with pedestrians in crosswalk) Partial truncation with enough time to get pedestrian to middle of conflict zone. o Heavy (> 1 in 2 cycles with pedestrians) consider full protection. 61
74 Based on feedback received from TxDOT engineers in TRF and some districts, the following modifying were made to the worksheet and instructions: 1. Provided all the geometric information at the beginning of the worksheet. 2. Designated and used a WB-67 as the default design vehicle. 3. Incorporated the impact of a WB-67 turning left onto the track in the estimation of the queue clearance time and track clearance green. 4. The calculation of track clearance green time that was optional in the earlier worksheet is no longer option and is further clarified for the situation when no gate down circuit is present. 5. A calculation is made for the maximum duration of the track green after the gates are down so that the user is not surprised when it happens. 6. Finally, a summary of all the critical controller preemption settings is presented at the end of the worksheet. Figure 27 illustrates the draft preemption worksheet. Figure 27. Draft Revised Preemption Worksheet. 62
75 SUMMARY The Guide for Determining the Time Requirements for Traffic Signal Preemption at Highway-Rail Grade Crossings is being updated. A draft has been presented to the reviewers at TxDOT and other preemption experts and is being reviewed. Currently TTI researchers are assessing the feasibility of converting this excel spreadsheet into PDF format. 63
76
77 APPENDIX A. ORDERING FOR SIGNS AND OBJECTS As discussed in Chapter 2, each participant was randomly assigned one of three groups for each of the visits (daytime and nighttime) during the study. Each participant was assigned to two different groups for the two visits. The objects viewed and signs displayed were changed with each lap based on a predetermined configuration to ensure that all three target objects were viewed with every type of sign at both testing locations. The only exception was the blank sign, which was always paired with a deer placed 100 ft behind the sign. Tables A-1 through A-3 identify the specific placement locations of every object (including the dummy objects) used throughout the 14 laps of the study. Locations A, B, C, D, and E correspond with the following distances with respect to the sign, as shown in Figure 1: 1,500, 400, 200, and 100 ft before the sign for A D and 100 ft after the sign for E. Locations C and E were the locations of interest in determining the signs effects on the hazardous object detection task. Shading in the tables indicates the test object and location for that lap. At the beginning of each lap, the first task was to identify the object at Location A, which was the control location that allowed comparisons with the other object detection distances. Even though the dummy objects were often placed at Location A, the only data of interest obtained from Location A were the occasions a test object was placed there. Each participant provided at least four control object detection distances during both daytime and nighttime testing. 65
78 66 Table A-1. Group 1 Sign and Object Ordering. Northbound A (Control 1,500 ft) B (400 ft) C (200 ft) D (100 ft) E ( 100 ft) Lap L R L R L R L R L R Sign 1 (Practice) Deer Cone Shoe Chair Tire 2 Deer Cone Box Shoe Tire 4 3 Chair Cone Box Shoe Deer 1 4 Tire Box Shoe Deer 22 5 Chair Tire Deer 25 6 Box Tire 18 7 Deer Tire Box 19 8 Shoe Deer Box 15 9 Cone Deer Chair Tire 9 10 Shoe Deer Box Chair Tire Chair Box Chair Deer 5 12 Shoe Tire Chair Box Deer 8 14 Tire Deer 12 Southbound A (Control) B (400 ft) C (200 ft) D (100 ft) E ( 100 ft) Lap L R L R L R L R L R Sign 1 Box Chair Deer 21 2 Tire Chair Box Deer 6 3 Cone Chair Box Shoe Deer 3 4 Tire Box Shoe 26 5 Deer Shoe Box 13 6 Cone Deer Box 17 7 Shoe Deer 10 8 Cone Shoe Deer 27 9 Box Shoe Tire Deer Shoe Box 2 11 Shoe Tire Cone Shoe Chair Tire Cone Box Chair Cone Tire 7 14 Shoe Chair Cone Deer 23
79 67 Table A-2. Group 2 Sign and Object Ordering. Northbound A (Control 1,500 ft) B (400 ft) C (200 ft) D (100 ft) E ( 100 ft) Lap L R L R L R L R L R Sign 1 (Practice) Tire Deer Chair Box 2 Tire Deer Chair Box 22 3 Cone Deer Chair Tire 25 4 Box Shoe Deer Cone Tire 4 5 Chair Shoe Box Cone Tire 5 6 Deer Shoe Box Tire 1 7 Chair Shoe Box 18 8 Deer Tire 8 9 Shoe Cone Tire Deer Box Cone Tire Chair Deer Shoe Cone Chair Deer Shoe Chair Box 9 13 Deer Box Chair Tire Deer 24 Southbound A (Control) B (400 ft) C (200 ft) D (100 ft) E ( 100 ft) Lap L R L R L R L R L R Sign 1 Chair Shoe Tire 23 2 Box Chair Deer Shoe Tire 6 3 Box Chair Deer Tire 3 4 Shoe Chair Deer 17 5 Tire Box Deer 13 6 Cone Shoe Box 16 7 Tire Shoe Deer Cone 26 8 Chair Shoe Deer Cone Box 2 9 Chair Cone Box Deer Chair Tire Box Deer Chair Box 7 12 Cone Shoe Deer Chair Box Shoe Deer Cone Shoe Tire 21
80 68 Table A-3. Group 3 Sign and Object Ordering. Northbound A (Control 1,500 ft) B (400 ft) C (200 ft) D (100 ft) E ( 100 ft) Lap L R L R L R L R L R Sign 1 (Practice) Cone Box Shoe Deer 2 Cone Box Shoe Deer 9 3 Chair Cone Box Shoe Tire 15 4 Chair Cone Box Tire 8 5 Shoe Cone Box 12 6 Deer Tire 24 7 Box Tire Chair 22 8 Shoe Chair Box 25 9 Tire Deer Chair Box Tire Shoe Deer Chair Box 5 11 Cone Shoe Deer Box Chair Shoe Cone Box 1 13 Deer Shoe Tire Cone 4 14 Box Shoe Cone Tire 19 Southbound A (Control) B (400 ft) C (200 ft) D (100 ft) E ( 100 ft) Lap L R L R L R L R L R Sign 1 Tire Chair Box 23 2 Shoe Chair Tire Box 26 3 Deer Chair Tire Shoe Box 3 4 Cone Tire Shoe Deer 27 5 Box Cone Tire Shoe Deer 2 6 Chair Cone Deer 7 7 Tire Cone Deer 11 8 Chair Tire 13 9 Box Deer Chair Tire Cone Deer Chair Tire Cone Deer Chair Cone Tire 6 13 Deer Box Shoe Box 21
81 APPENDIX B. PROCEDURE FOR EACH PARTICIPANT Following are the steps the researchers completed with each participant. 1. Greet the participant, introduce the study concept, have the subject sign the informed consent form, conduct a vision test, and complete the intake form, which asked some basic demographic questions. 2. Provide instructions to the subject about the legibility and object detection tasks. The pictures in Figure B-1 were shown to the participant in a larger format so the participant could become familiar with the study procedure. 3. Escort the participant to the vehicle, calibrate the eye-tracker in the vehicle, and start the GPS data acquisition software. 4. Instruct the participant to drive to the start of the study site. 5. Allow the participant to approach one sign (half of one lap) as a practice run. Have the participant practice completing the legibility and hazard detection tasks. 6. While completing 14 total laps (two signs with each lap), change the objects and signs based on the object and sign ordering assigned to that participant. Specific details of the objects placed for each group are provided in Appendix A. 7. While approaching each sign, instruct the participant to: a. Indicate left or right for the side of the lane where the control object is placed. b. Read the assigned travel time or target word. c. Indicate left or right for the side of the lane where the test object is placed. 8. The legibility task (b) and object detection task (c) can be completed in any order. Indicate in the GPS data stream the moment the above tasks are completed. 9. After the 14 laps, stop data collection and instruct the participant to return to the original location for compensation. Escort the participant out of the facility. 69
")


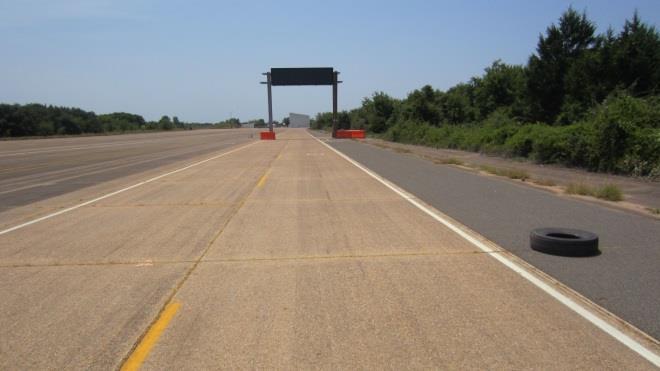
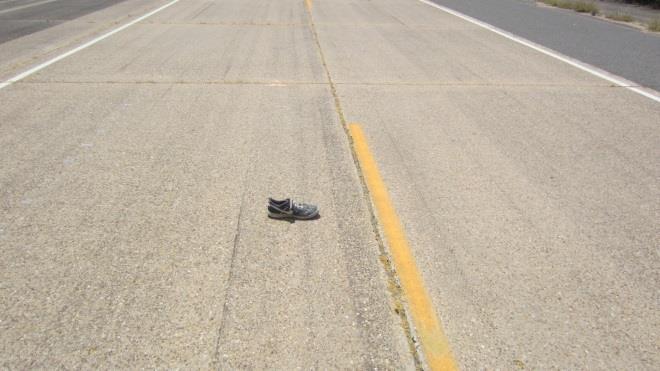
82 Sign (blank) Sign (night) Deer Box Cone Chair Tire Shoe Figure B-1. Images Shown to Each Participant before Starting Each Experiment. 70
LEGIBILITY DISTANCES OF 9 TO 18 INCH CHARACTERS FOR LIGHT-EMITTING DIODE (LED) DYNAMIC MESSAGE SIGNS ON ARTERIAL ROADWAYS
 DYNAMIC MESSAGE SIGNS ON ARTERIAL ROADWAYS") LEGIBILITY DISTANCES OF 9 TO 18 INCH CHARACTERS FOR LIGHT-EMITTING DIODE (LED) DYNAMIC MESSAGE SIGNS ON ARTERIAL ROADWAYS Texas Transportation Institute The Texas A&M University System College Station,
LEGIBILITY DISTANCES OF 9 TO 18 INCH CHARACTERS FOR LIGHT-EMITTING DIODE (LED) DYNAMIC MESSAGE SIGNS ON ARTERIAL ROADWAYS Texas Transportation Institute The Texas A&M University System College Station,
In the proposed amendment below, text shown with underline is proposed to be added and text shown with strikethrough is proposed to be removed.
 ZOA-13-07 AN ORDINANCE TO AMEND, REENACT AND RECODIFY ARTICLES 13 AND 18 OF THE ARLINGTON COUNTY ZONING ORDINANCE TO DEFINE LARGE MEDIA SCREENS AS AUTOMATIC CHANGEABLE COPY SIGNS LARGER THAN 12 SQUARE
Welcome SIGN CODE UPDATE
 Welcome SIGN CODE UPDATE PUBLIC MEETING Aztlan Community Center Thursday, May 24, 2018 Community Room 5:30 7:30 PM 112 E Willow Street, Fort Collins *Brief orientation at 6:00 PM* PROCESS AND HOW TO PARTICIPATE
EVALUATION OF PERFORMANCE OF SOLAR POWERED FLASHING BEACONS AT ROOM TEMPERATURE CONDITIONS
 CIVIL ENGINEERING STUDIES Illinois Center for Transportation Series No. 10-069 UILU-ENG-2010-2010 ISSN: 0197-9191 EVALUATION OF PERFORMANCE OF SOLAR POWERED FLASHING BEACONS AT ROOM TEMPERATURE CONDITIONS
Technical Report Documentation Page. 1. Report No. FHWA/TX-02/ Government Accession No. 3. Recipient's Catalog No.
 Technical Report Documentation Page 1. Report No. FHWA/TX-02/4049-1 2. Government Accession No. 3. Recipient's Catalog No. 4. Title and Subtitle EVALUATION OF CLEARVIEW ALPHABET WITH MICROPRISMATIC RETROREFLECTIVE
City Council Report 915 I Street, 1 st Floor
 Meeting Date: 8/4/2016 Report Type: Consent Report ID: 2016-00700 03 City Council Report 915 I Street, 1 st Floor www.cityofsacramento.org Title: Ordinance adding Sections 15.148.015 and 15.148.191 to
INTERIM ADVICE NOTE 109/08. Advice Regarding the Motorway Signal Mark 4 (MS4)
") INTERIM ADVICE NOTE 109/08 Advice Regarding the Motorway Signal Mark 4 (MS4) Summary This document provides advice on usage of MS4 signal and when they can be used to replace MS3 signals. Instructions
INTERIM ADVICE NOTE 109/08 Advice Regarding the Motorway Signal Mark 4 (MS4) Summary This document provides advice on usage of MS4 signal and when they can be used to replace MS3 signals. Instructions
DIGITAL SIGN SURVEY SURVEY REQUESTED BY CYLCE JOHNSON ON 2/26/07 - QUESTION: NAHBA SURVEY ON SIGN INTENSITY (BRIGHTNESS)
") DIGITAL SIGN SURVEY SURVEY REQUESTED BY CYLCE JOHNSON ON 2/26/07 - QUESTION: NAHBA SURVEY ON SIGN INTENSITY (BRIGHTNESS) STATE: DATE: 1. Does your state allow digital signs? yes no. 2. If yes, have you
DIGITAL SIGN SURVEY SURVEY REQUESTED BY CYLCE JOHNSON ON 2/26/07 - QUESTION: NAHBA SURVEY ON SIGN INTENSITY (BRIGHTNESS) STATE: DATE: 1. Does your state allow digital signs? yes no. 2. If yes, have you
City Council Report 915 I Street, 1 st Floor
 Meeting Date: 4/14/2016 Report Type: Staff/Discussion Report ID: 2016-00333 12 City Council Report 915 I Street, 1 st Floor www.cityofsacramento.org Title: Ordinance Adding Section 15.148.920 to the Sacramento
SECTION 5900 TRAFFIC SIGNALS CITY OF LEE S SUMMIT, MISSOURI DESIGN CRITERIA
 SECTION 5900 TRAFFIC SIGNALS CITY OF LEE S SUMMIT, MISSOURI DESIGN CRITERIA TABLE OF CONTENTS Section Title Page 5901 GENERAL... 2 5902 DESIGN CRITERIA... 2 5902.1 Codes and Standards... 2 5902.2 Signal
Evaluation of Construction Zone Pavement Marking Materials
 Transportation Kentucky Transportation Center Research Report University of Kentucky Year 1985 Evaluation of Construction Zone Pavement Marking Materials Kenneth R. Agent Jerry G. Pigman University of
September 28, 2018 CITY OF BERKELEY JOHN MUIR SCHOOL CROSSING IMPROVEMENTS SPECIFICATION NO C ADDENDUM NO. 2
 Department of Public Works Transportation Division September 28, 2018 CITY OF BERKELEY JOHN MUIR SCHOOL CROSSING IMPROVEMENTS ADDENDUM NO. 2 Dear Bidder: The following amendments are hereby made to the
RESEARCH UPDATE. FIELD EVALUATION OF 3MfM SCOTCH-LANE WET REFLECTIVE REMOVABLE TAPE SERIES 750 (Final Report)
") MATERIALS~~ RESEARC H R~viewed by: _,;;/ :/._ ~o~ 1{ rs~~!l Donald H. Lathop, P.E. Materials and Research Engineer RESEARCH UPDATE Prepared by:, /J. /1 k c/jj-?1-v ~ (,. Theresa C. Gilman January 10, 2003
MATERIALS~~ RESEARC H R~viewed by: _,;;/ :/._ ~o~ 1{ rs~~!l Donald H. Lathop, P.E. Materials and Research Engineer RESEARCH UPDATE Prepared by:, /J. /1 k c/jj-?1-v ~ (,. Theresa C. Gilman January 10, 2003
MONDO VIDEOSCREENS AND LED SOLUTIONS
 MONDO VIDEOSCREENS AND LED SOLUTIONS DESCRIPTION A MONDO video screen is not only a product but a full package that includes personalized service done at different stages, from before to after the production
Back to the MUTCD Future
 Back to the MUTCD Future 1930s 1920s 1960s 1950s 2000s Gene Hawkins, Ph.D., P.E. Texas A&M University 1940s Part 1: MUTCD Past There have been 10 National MUTCDs 1935 1942 1948 1961 1971 1978 1988 2000
GORDON WATSON and ASSOCIATES
 KONDWERA TECHNICAL SERVICES PTY LTD TRADING AS GORDON WATSON and ASSOCIATES ELECTRICAL 29 CURRAWONG AVENUE LIGHTING NORMANHURST DESIGN NSW 2076 ACN 002 105 268 TEL 02 9487 2119 ABN 83 002 105 268 Mob 0412
Concept of Operations (CONOPS)
") PRODUCT 0-6873-P1 TxDOT PROJECT NUMBER 0-6873 Concept of Operations (CONOPS) Jorge A. Prozzi Christian Claudel Andre Smit Praveen Pasupathy Hao Liu Ambika Verma June 2016; Published March 2017 http://library.ctr.utexas.edu/ctr-publications/0-6873-p1.pdf
PRODUCT 0-6873-P1 TxDOT PROJECT NUMBER 0-6873 Concept of Operations (CONOPS) Jorge A. Prozzi Christian Claudel Andre Smit Praveen Pasupathy Hao Liu Ambika Verma June 2016; Published March 2017 http://library.ctr.utexas.edu/ctr-publications/0-6873-p1.pdf
Implementation of LED Roadway Lighting
 Implementation of LED Roadway Lighting Ken Taillon, Principal Investigator Short Elliot Hendrickson, Inc. (SEH ) May 2016 Research Project Final Report 2016-17 To request this document in an alternative
I 2. Government Accession No. 3. Recipient's Catalog No. I
 L Report No. TX -02/4940-1 4. Title and Subtitle PHOTOMETRIC REQUIREMENTS FOR ARROW PANELS Technical Report Documentation Paae I 2. Government Accession No. 3. Recipient's Catalog No. I 5. Report Date
BUREAU OF ENERGY EFFICIENCY
 Date: 26 th May, 2016 Schedule No.: 11 Color Televisions 1. Scope This schedule specifies the energy labeling requirements for color televisions with native resolution upto 1920 X 1080 pixels, of CRT,
Brief History of the MUTCD
 Brief History of the MUTCD 1930s 1920s 1960s Early 1950s Today Gene Hawkins Texas Transportation Institute 1940s The MUTCD There have been 8 editions of the MUTCD 1935 1942 1948 1961 1971 1978 1988 2000
Don t let Potential Customers pass you by!
 Don t let Potential Customers pass you by! Your colorful and vibrant messages will make you stand out and get noticed. LED lighting technology is the most energy efficient and our simple and reliable designs
RECOMMENDED AMENDMENTS TO OFF-PREMISE SIGN REGULATIONS
 RECOMMENDED AMENDMENTS TO OFF-PREMISE SIGN REGULATIONS The use of electronic, digital or video technology in signs is permitted and allowed, subject to the following limitations and additional restrictions:
The MUTCD: Where It s. Gene Hawkins
 The MUTCD: Where It s Been and Where It s Going 1930s 1920s 1960s Early 1950s Today Gene Hawkins Texas A&M University 1940s The MUTCD: Where It s Been There have been 9 editions of the MUTCD 1935 1942
DCI Memorandum Regarding Direct View Displays
 1. Introduction DCI Memorandum Regarding Direct View Displays Approved 27 June 2018 Digital Cinema Initiatives, LLC, Member Representatives Committee Direct view displays provide the potential for an improved
Branding Guidelines NOTICE:
 Branding Guidelines NOTICE: THE STRUCTURE OF THE HEVC ADVANCE LICENSING PROGRAM, INCLUDING THE TERMS HEVC ADVANCE IS CURRENTLY AUTHORIZED TO OFFER IN ITS PATENT PORTFOLIO LICENSE AGREEMENT, ARE SUBJECT
Public Opinion and Understanding of Advance Warning Arrow Displays Used in Short-Term, Mobile, and Moving Work Zones
 KU: STE45110 Public Opinion and Understanding of Advance Warning Arrow Displays Used in Short-Term, Mobile, and Moving Work Zones Technical Report 45110-1 The Civil, Environmental, and Architectural Engineering
Analysis of Background Illuminance Levels During Television Viewing
 Analysis of Background Illuminance Levels During Television Viewing December 211 BY Christopher Wold The Collaborative Labeling and Appliance Standards Program (CLASP) This report has been produced for
SHOWLINE SL BEAM 100 LED LUMINAIRE SPECIFICATIONS.
 SHOWLINE SL BEAM 100 LED LUMINAIRE SPECIFICATIONS. GENERAL. A.) Overview. 1.) The luminaire shall be a motorized colour mixing luminaire employing seven (7) homogenized red, green, blue, and white LED
Bus route and destination displays making it easier to read.
 Loughborough University Institutional Repository Bus route and destination displays making it easier to read. This item was submitted to Loughborough University's Institutional Repository by the/an author.
City of Tacoma Community and Economic Development Department
 City of Tacoma Community and Economic Development Department Agenda Item GB-2 TO: FROM: SUBJECT: Planning Commission Shirley Schultz, Principal Planner 2012 Annual Amendment Application No. 2012-4, Sign
THE CITY OF WINNIPEG BY-LAW NO. 36/2013
 THE CITY OF WINNIPEG BY-LAW NO. 36/2013 A By-law of The City of Winnipeg to amend Winnipeg Zoning By-law No. 200/2006 with respect to digital signs and billboards. THE CITY OF WINNIPEG, in Council assembled,
Basic Elements > Logos and Markings
 Page 1 Please note: The full functionality of the tutorial is guaranteed only with use of the latest browser versions. Contents At a glance: DB brand Division Logo DB Netze Division Logo DB Schenker Color
ARTICLE 8 - SIGN REGULATIONS
 ARTICLE 8 - SIGN REGULATIONS These regulations are intended to apply to all zoning districts. However, these regulations may not be pertinent to all uses and situations. 8.1 DEFINITIONS ABANDONED SIGN
boston convention & exhibition center Media & Sponsorship Opportunities
 boston convention & exhibition center Media & Sponsorship Opportunities 1 With the best technology in the industry, and its excellent infrastructure, the Boston Convention & Exhibition Center (BCEC) gives
SHOWLINE SL NITRO 510 LED STROBE LUMINAIRE SPECIFICATIONS.
 GENERAL. A.) Overview. SHOWLINE SL NITRO 510 LED STROBE LUMINAIRE SPECIFICATIONS. 1.) The luminaire shall be an LED strobe luminaire employing one-thousand, three-hundred and fifty (1350) white LED engines.
Thesis and Dissertation Handbook
 Indiana State University College of Graduate and Professional Studies Thesis and Dissertation Handbook Handbook Policies The style selected by the candidate should conform to the standards of the candidate
SHOWLINE SL BAR 640 LINEAR WASH LUMINAIRE SPECIFICATIONS.
 GENERAL. A.) Overview. SHOWLINE SL BAR 640 LINEAR WASH LUMINAIRE SPECIFICATIONS. 1.) The luminaire shall be a color mixing luminaire employing twenty-four (24) red, green, blue, and white LED engines.
Tech Paper. HMI Display Readability During Sinusoidal Vibration
 Tech Paper HMI Display Readability During Sinusoidal Vibration HMI Display Readability During Sinusoidal Vibration Abhilash Marthi Somashankar, Paul Weindorf Visteon Corporation, Michigan, USA James Krier,
Case Study Meeting Demand with Automation: Luminator Aerospace Ramps Up Backlit Sign Testing Using ProMetric Imaging Colorimeters
 Case Study Meeting Demand with Automation: Luminator Aerospace Ramps Up Backlit Sign Testing Using ProMetric Imaging Colorimeters About Luminator Luminator Technology Group is a family of brands that manufacture
D.A. Schreuder Voorburg, ]981 Institute for Road Safety Research SWOV, The Netherlands
![D.A. Schreuder Voorburg, ]981 Institute for Road Safety Research SWOV, The Netherlands](/thumbs/89/100144234.jpg "D.A. Schreuder Voorburg, ]981 Institute for Road Safety Research SWOV, The Netherlands") LIGHT SIGNALS FOR ROAD TRAFFIC CONTROL Article Traffic Engineering & Control 22 (1981) 6: 370-371 R-81-] 8 D.A. Schreuder Voorburg, ]981 Institute for Road Safety Research SWOV, The Netherlands -2- S~RY
LIGHT SIGNALS FOR ROAD TRAFFIC CONTROL Article Traffic Engineering & Control 22 (1981) 6: 370-371 R-81-] 8 D.A. Schreuder Voorburg, ]981 Institute for Road Safety Research SWOV, The Netherlands -2- S~RY
A.D. Engineering International Pty Ltd - Product Range
 A.D. Engineering International Pty Ltd - Product Range Over the last thirty five years A.D. Engineering International has specialised in the design and manufacture of high quality electronic equipment
The MUTCD: Its History and Future
 The MUTCD: Its History and Future 1930s 1920s 1960s 1950s 2000s Gene Hawkins, Ph.D., P.E. Texas A&M University 1940s Manual on Uniform Traffic Control Devices Known as the MUTCD Contains basic principles
FLORIDA DEPARTMENT OF TRANSPORTATION
 FLORIDA DEPARTMENT OF TRANSPORTATION ADDENDUM NO.: 2 Date: January 16, 2015 To: From: All Bidders Greg Hill, Procurement Agent Subject: Questions & Answers LED Based Open/Closed Embedded Signage Insert:
Plan for Generic Information Collection Activity: Submission for. National Transportation Safety Board (NTSB).
.") This document is scheduled to be published in the Federal Register on 10/10/2014 and available online at http://federalregister.gov/a/2014-24234, and on FDsys.gov 7533-01-M NATIONAL TRANSPORTATION SAFETY
This document is scheduled to be published in the Federal Register on 10/10/2014 and available online at http://federalregister.gov/a/2014-24234, and on FDsys.gov 7533-01-M NATIONAL TRANSPORTATION SAFETY
NEXT/RADIUS Shelf Mount CCU
 2018 NEXT/RADIUS Shelf Mount CCU The Next / Radius shelf mount CCU is open for orders and is available to ship mid September. CCU information on pages 3 and 7. September 11, 2018 VantageRadius Radar technology
Brief History of the MUTCD
 Brief History of the MUTCD 1930s 1920s 1960s Early 1950s Today Gene Hawkins Texas Transportation Institute 1940s The MUTCD There have been 9 editions of the MUTCD 1935 1942 1948 1961 19711978 1988 2000
American Coaster Enthusiasts Logo Guidelines
 American Coaster Enthusiasts Logo Guidelines Introduction...2 Downloads of Logo Artwork...2 ACE Logos...2 ACE Logos...3 Usage Guidelines...5 Logo Usage Rights...5 ACE Logo and ACE Logo...5 ACE Member Logo...5
Table 6.1: Level of Service Thresholds for Basic Freeway Segments. Density Range LOS (pc/mi/ln) A 0 11 B >11 18 C >18 26 D > E >35 45 F > 45
 A 0 11 B >11 18 C >18 26 D > E >35 45 F > 45") 6.0 FREEWAY ANALYSIS 6.1 FREEWAY LEVEL OF SERVICE METHODOLOGY Two CMP freeway monitoring stations in the vicinity of the study area were identified for freeway analysis. The first station is located on
6.0 FREEWAY ANALYSIS 6.1 FREEWAY LEVEL OF SERVICE METHODOLOGY Two CMP freeway monitoring stations in the vicinity of the study area were identified for freeway analysis. The first station is located on
SHOWLINE SL epar 180 LUMINAIRE SPECIFICATIONS.
 SHOWLINE SL epar 180 LUMINAIRE SPECIFICATIONS. GENERAL. A.) Overview. 1.) The luminaire shall be a color mixing luminaire employing nineteen (19) homogenized red, green, blue, and white LED engines. The
Lineside Signals, Indicators and Layout of Signals
 Lineside Signals, Indicators and Layout of Signals Synopsis This document defines the format, presentation and layout of lineside signalling equipment that is used to display movement authority information
Chapter 10. Lighting Lighting of Indoor Workplaces 180
 Chapter 10 Lighting 10.1 Lighting of Indoor Workplaces 180 10 10 Lighting 10.1 Lighting of Indoor Workplaces In March 2003, the German version of the European Standard EN 12464-1 Lighting of workplaces,
SIDRA INTERSECTION 8.0 UPDATE HISTORY
 Akcelik & Associates Pty Ltd PO Box 1075G, Greythorn, Vic 3104 AUSTRALIA ABN 79 088 889 687 For all technical support, sales support and general enquiries: support.sidrasolutions.com SIDRA INTERSECTION
The Extron MGP 464 is a powerful, highly effective tool for advanced A/V communications and presentations. It has the
 MGP 464: How to Get the Most from the MGP 464 for Successful Presentations The Extron MGP 464 is a powerful, highly effective tool for advanced A/V communications and presentations. It has the ability
4. Title and Subtitle 5. Report Date June 1992; GUIDELINES ON THE USE AND OPERATION OF Revised November 1992 CHANGEABLE MESSAGE SIGNS
 Technical Report Documentation Page 1. Report No. 2. Government Accession No. 3. Recipient's Calalog No. FHWAjTX-92/1232-9 4. Title and Subtitle 5. Report Date June 1992; GUIDELINES ON THE USE AND OPERATION
QUADRO AND NVS DISPLAY RESOLUTION SUPPORT
 QUADRO AND NVS DISPLAY RESOLUTION SUPPORT DA-07089-001_v06 April 2017 Application Note DOCUMENT CHANGE HISTORY DA-07089-001_v06 Version Date Authors Description of Change 01 November 1, 2013 AP, SM Initial
Optical Engine Reference Design for DLP3010 Digital Micromirror Device
 Application Report Optical Engine Reference Design for DLP3010 Digital Micromirror Device Zhongyan Sheng ABSTRACT This application note provides a reference design for an optical engine. The design features
Dynamic Lane Assignment Using Fiber-Optic Signs
 10 TRANSPORTATION RESEARCH RECORD 1368 Dynamic Lane Assignment Using FiberOptic Signs WAYNE L. GISLER, NEILON J. ROWAN, AND MICHAEL A. OGDEN The legibility distance for various fiberoptic changeable laneuse
SHOWLINE SL NITRO 510C LED STROBE LUMINAIRE SPECIFICATIONS.
 GENERAL. A.) Overview. SHOWLINE SL NITRO 510C LED STROBE LUMINAIRE SPECIFICATIONS. The luminaire shall be an LED strobe luminaire employing five hundred and twenty eight (528) red, green, blue and white
2013, 2014 Hewlett-Packard Development Company, L.P.
 User Guide 2013, 2014 Hewlett-Packard Development Company, L.P. The only warranties for HP products and services are set forth in the express warranty statements accompanying such products and services.
ENERGY STAR Program Requirements Product Specification for Televisions. Eligibility Criteria Version 5.3
 ENERGY STAR Program Requirements Product Specification for Televisions Eligibility Criteria Version 5.3 Following is the Version 5.3 ENERGY STAR Product Specification for Televisions. A product shall meet
DISPLAY WEEK 2015 REVIEW AND METROLOGY ISSUE
 DISPLAY WEEK 2015 REVIEW AND METROLOGY ISSUE Official Publication of the Society for Information Display www.informationdisplay.org Sept./Oct. 2015 Vol. 31, No. 5 frontline technology Advanced Imaging
QUADRO AND NVS DISPLAY RESOLUTION SUPPORT
 QUADRO AND NVS DISPLAY RESOLUTION SUPPORT DA-07089-001_v07 March 2019 Application Note DOCUMENT CHANGE HISTORY DA-07089-001_v07 Version Date Authors Description of Change 01 November 1, 2013 AP, SM Initial
Roadway/Structure Widening Project MP A30.30 to MP A Lansdale Montgomery County, PA NOISE ANALYSIS REPORT FINAL. August 2006.
 Roadway/Structure Widening Project Lansdale Montgomery County, PA NOISE ANALYSIS REPORT Prepared for: Pennsylvania Turnpike Commission P.O. Box 67676 Harrisburg, PA 17106-7676 August 2006 FINAL EXECUTIVE
GK/GN0658. Guidance on Lineside Signal Aspect and Indication Requirements. Rail Industry Guidance Note for GK/RT0058
 GN This document contains one or more pages which contain colour Published by: Block 2 Angel Square 1 Torrens Street London EC1V 1NY Copyright 2014 Rail Safety and Standards Board Limited GK/GN0658 Issue
REPORT DOCUMENTATION PAGE
 REPORT DOCUMENTATION PAGE Form Approved OMB No. 0704-0188 Public reporting burden for this collection of information is estimated to average 1 hour per response, including the time for reviewing instructions,
LaCie 321 LCD Monitor
 SWOP Application Data Sheet Remote Director Monitor Proofing System using the LaCie 321 LCD Monitor The SWOP Review Committee has approved the use of off-press proofs as input material to publications.
The National Traffic Signal Report Card: Highlights
 The National Traffic Signal Report Card: Highlights THE FIRST-EVER NATIONAL TRAFFIC SIGNAL REPORT CARD IS THE RESULT OF A PARTNERSHIP BETWEEN SEVERAL NTOC ASSOCIATIONS LED BY ITE, THE AMERICAN ASSOCIATION
THE USE OF LED LAMPS FOR TURN AND STOP SIGNAL PRESENTATIONS
 THE USE OF LED LAMPS FOR TURN AND STOP SIGNAL PRESENTATIONS Paul L. Olson, Toshiaki Aoki, and Dennis S. Battle The University of Michigan Transportation Research Institute Ann Arbor, Michigan 481 09 Report
Author Guidelines Foreign Language Annals
 Author Guidelines Foreign Language Annals Foreign Language Annals is the official refereed journal of the American Council on the Teaching of Foreign Languages (ACTFL) and was first published in 1967.
AGE AND THE PERCEPTION OF A MODULATING TRAFFIC SIGNAL LIGHT IN A FIELD LOCATION
 PROCEEDINGS of the HUMAN FACTORS SOCIETY 35th ANNUAL MEETING-1991 AGE AND THE PERCEPTION OF A MODULATING TRAFFIC SIGNAL LIGHT IN A FIELD LOCATION Lawrence T. Guzy and Nancy Pena-Reynolds State University
Monitor QA Management i model
 Monitor QA Management i model 1/10 Monitor QA Management i model Table of Contents 1. Preface ------------------------------------------------------------------------------------------------------- 3 2.
Remote Director. Apple 23 LCD Display. Collaborative Soft Proofing using the I. MANUFACTURER INTRODUCTION. SWOP Application Data Sheet
 SWOP Application Data Sheet Remote Director Collaborative Soft Proofing using the Apple 23 LCD Display The SWOP Review Committee has approved the use of off-press proofs as input material to publications.
Color mixing or White-light LED (Light Emitting Diode) ERS-style product
 ERS-style product") WHT Color mixing or White-light LED (Light Emitting Diode) ERS-style product GENERAL PHYSICAL A. The product shall be an Ovation E-910FC as manufactured by Chauvet & Sons, LLC or approved equal. 1. The
WHT Color mixing or White-light LED (Light Emitting Diode) ERS-style product GENERAL PHYSICAL A. The product shall be an Ovation E-910FC as manufactured by Chauvet & Sons, LLC or approved equal. 1. The
Section 508 Conformance Audit Voluntary Product Accessibility Template
 Date:11/06/2015 Section 508 Conformance Audit Voluntary Product Accessibility Template Marketing Name: OptiPlex 7440 All-In-One Regulatory Model: W11B Dell Inc. One Dell Way Round Rock, TX 78682 Reviewed
TEO Work Zone Safety Committee Meeting January 25, 2006 Minutes
 January 25, 2006 Page 1 of 5 TEO Work Zone Safety Committee Meeting January 25, 2006 Minutes Committee Members Present: Oliver Kendall, District 4 Mike Engh, Metro Sue Lorentz, Metro Ken Nelson, CO Maintenance
TRAFFIC SIGNAL DESIGN GUIDELINES
 TRAFFIC SIGNAL DESIGN GUIDELINES January, 2006 INDEX PLAN APPROVAL PROCESS 1 1. Designer Prequalification 1 2. Items Available from the County 1 3. Plan Submittals 1 4. Final Submittal 1 5. Checklist for
Processes for the Intersection
 7 Timing Processes for the Intersection In Chapter 6, you studied the operation of one intersection approach and determined the value of the vehicle extension time that would extend the green for as long
AGEC 693 PROFESSIONAL STUDY PAPER GUIDELINES
 AGEC 693 PROFESSIONAL STUDY PAPER GUIDELINES Guidelines for the Preparation of Professional Study Papers Intellectual Leaders for Food, Agribusiness, and Resource Decisions Department of Agricultural Economics
MX215. Your advantages. 2MP Medical-Display
 MX215 Your advantages The EIZO MX215 features factory-preset DICOM tonal values and displays greyscale tones of radiological images in accordance with the requirements of the object. The advantage here
STATE OF OHIO DEPARTMENT OF TRANSPORTATION SUPPLEMENTAL SPECIFICATION 872 LIGHT EMITTING DIODE TRAFFIC SIGNAL LAMP UNITS JULY 19, 2002
 STATE OF OHIO DEPARTMENT OF TRANSPORTATION SUPPLEMENTAL SPECIFICATION 872 LIGHT EMITTING DIODE TRAFFIC SIGNAL LAMP UNITS JULY 19, 02 872.01 Description 872.02 Prequalification 872.03 Material Requirements
Speech Recognition and Signal Processing for Broadcast News Transcription
 2.2.1 Speech Recognition and Signal Processing for Broadcast News Transcription Continued research and development of a broadcast news speech transcription system has been promoted. Universities and researchers
Official Journal L 191, 23/07/2009 P
 Commission Regulation (EC) No 642/2009 of 22 July 2009 implementing Directive 2005/32/EC of the European Parliament and of the Council with regard to ecodesign requirements for televisions Text with EEA
ENERGY STAR Program Requirements Product Specification for Televisions. Eligibility Criteria Draft 1 Version 6.0
 ENERGY STAR rogram Requirements roduct Specification for Televisions Eligibility Criteria Draft 1 Version 6.0 1 2 Following is the Draft 1 Version 6.0 ENERGY STAR roduct Specification for Televisions.
ORM0022 EHPC210 Universal Controller Operation Manual Revision 1. EHPC210 Universal Controller. Operation Manual
 ORM0022 EHPC210 Universal Controller Operation Manual Revision 1 EHPC210 Universal Controller Operation Manual Associated Documentation... 4 Electrical Interface... 4 Power Supply... 4 Solenoid Outputs...
Lineside Signals, Indicators and Layout of Signals
 To be part superseded by GKRT0045 Iss 4, GKRT0057 Iss 1 and GKRT0058 Iss 1 published on 06/12/2014 Lineside Signals, Indicators and Layout of Signals Synopsis This document defines the format, presentation
Display Size Matters Selecting the Right Display Size for Classrooms
 Display Size Matters Selecting the Right Display Size for Classrooms 100" Display 65" Display Contents Key Factors for Selecting the Right Display 3 The 4/6/8 Rule 4 Classroom Configurations 5 THE FINDINGS:
GENERAL WRITING FORMAT
 GENERAL WRITING FORMAT The doctoral dissertation should be written in a uniform and coherent manner. Below is the guideline for the standard format of a doctoral research paper: I. General Presentation
SHOWLINE SL PAR 155 LED LUMINAIRE SPECIFICATIONS.
 SHOWLINE SL PAR 155 LED LUMINAIRE SPECIFICATIONS. GENERAL. A.) Overview. 1.) The luminaire shall be a color mixing luminaire employing nine (9) homogenized red, green, blue, and white LED engines. The
Texas Transportation Institute The Texas A&M University System College Station, Texas
 1. Report No. FHWA/TX-00/1439-7 4. Title and Subtitle INITIAL EVALUATION OF SELECTED DETECTORS TO REPLACE INDUCTIVE LOOPS ON FREEWAYS 2. Government Accession No. 3. Recipient's Catalog No. 5. Report Date
Guidelines for Specification of LED Lighting Products 2010
 Guidelines for Specification of LED Lighting Products 2010 September 2010 Introduction With LED s emerging as a new functional light source there is a need to ensure performance claims are made in a consistent
Graphics Standards Manual
 height of letters width of shield 1 Introduction When Winthrop gained university status in 1992, the occasion was marked by the unveiling of a new logo reflecting the institution s distinctive qualities.
Electronic Thesis and Dissertation (ETD) Guidelines
 Guidelines") Electronic Thesis and Dissertation (ETD) Guidelines Version 4.0 September 25, 2013 i Copyright by Duquesne University 2013 ii TABLE OF CONTENTS Page Chapter 1: Getting Started... 1 1.1 Introduction...
Electronic Thesis and Dissertation (ETD) Guidelines Version 4.0 September 25, 2013 i Copyright by Duquesne University 2013 ii TABLE OF CONTENTS Page Chapter 1: Getting Started... 1 1.1 Introduction...
MANAGING HDR CONTENT PRODUCTION AND DISPLAY DEVICE CAPABILITIES
 MANAGING HDR CONTENT PRODUCTION AND DISPLAY DEVICE CAPABILITIES M. Zink; M. D. Smith Warner Bros., USA; Wavelet Consulting LLC, USA ABSTRACT The introduction of next-generation video technologies, particularly
This document is meant purely as a documentation tool and the institutions do not assume any liability for its contents
 2009R0642 EN 12.09.2013 001.001 1 This document is meant purely as a documentation tool and the institutions do not assume any liability for its contents B COMMISSION REGULATION (EC) No 642/2009 of 22
NOVA Digital Media System Guidelines Northern Virginia Community College 2017
 NOVA Digital Media System Guidelines Office of College Marketing and Web Services Northern Virginia Community College 2017 NOVA Digital Media System Guidelines Table of Contents Overview 3 Goals of Digital
APA Research Paper Chapter 2 Supplement
 Microsoft Office Word 00 Appendix D APA Research Paper Chapter Supplement Project Research Paper Based on APA Documentation Style As described in Chapter, two popular documentation styles for research
Remote Director. EIZO ColorEdge CG21. Collaborative Soft Proofing using the I. MANUFACTURER INTRODUCTION. SWOP Application Data Sheet
 SWOP Application Data Sheet Remote Director Collaborative Soft Proofing using the EIZO ColorEdge CG21 The SWOP Review Committee has approved the use of off-press proofs as input material to publications.
David Mrnak, International Sales Department, eyevis GmbH
 as a pioneer LED-lit rear projection technology, eyevis provides the widest range of products regarding sizes and resolutions - proven technology in robust design. David Mrnak, International Sales Department,
*Please note that although this product has been approved in Japan, its launch in other countries has not yet been confirmed.
 make News & Information 1-7-1 Konan, Minato-ku, Tokyo 108-0075, Japan Sony Corporation No.13-085E July 23, 2013 Sony Introduces head-mount image processing unit for endoscopic image display - Images from