BACHELOR THESIS. Placing of Subwoofers. Measurements of common setups with 2-4 subwoofers for an even sound
|
|
|
- Lynne Flowers
- 5 years ago
- Views:
Transcription
1 BACHELOR THESIS Placing of Subwoofers Measurements of common setups with 2-4 subwoofers for an even sound pressure lever over the audience area and lower level on the stage Linnéa Burman 2013 Bachelor of Arts Audio Engineering Luleå University of Technology Institutionen för konst, kommunikation och lärande
2 Bachelor Thesis Luleå University of Technology Placing of subwoofers- Measurements of common setups with 2-4 subwoofers for an even sound pressure lever over the audience area and lower level on the stage. Linnéa Burman Luleå University of Technology Department of Arts, Communication and Education 2013
3 Abstract On live events like festivals and concerts subwoofers is a part of the main system, at smaller concerts it is not always a possibility to use a lot of subwoofers due to for example lack of space or not enough money. Sometimes it might only be possible to use 2 or 4 subwoofers. This essay shows a research were 8 different setups with 2-4 subwoofers were measured with Clio to see which setup to prefer when aiming for an even coverage in sound pressure level over the audience, at the same time that the level is lower on the stage. An even coverage is preferable so that there won t be too large differences in the level of the lower frequencies depending on were one stand in the audience. Lower levels on the stage can make it easier for the musicians to hear themselves and avoid interference with the stage monitor system. The results of these measurements shows that the setups used had a quite similar level both on the stage and in the audience, the difference were just a few db. To avoid comb filter and unevenness in levels the results show that setups with the subwoofers closer to each other are better. This work contains graphics with different colors for the different settings therefore it should be printed with color to be able to read it all. 2
4 Contents 1. Introduction Subwoofers on live events Research question and aim 4 2. Background The PA system Subwoofer clusters Sound Pressure Level Sounds in the free field Comb-filter effect and standing waves Cardioid subwoofers Method Venue Equipment Setups Simulations Placing of measuring points Clio and settings Result and analysis ArrayCalc simulations Graphics Audience area Stage area Calculating the arithmetic average Formulas Tables Discussion Reliability Conclusions Further research References.31 Appendix All graphics All simulations
5 1. Introduction 1.1 Subwoofers on live events For events such as festivals and concerts the main system also includes subwoofers to handle the lower frequencies and these can be placed in many different ways depending on what the aim is. There are three things that are mainly thought about while planning for the subwoofer placing: the frequency response, the impulse response and the sound pressure level. These three things can be adjusted by changing the delay or the direction of the subwoofers. [1] On an event the most common thing to think about is the sound pressure level over the audience. The main goal is to get an even coverage over the audience-area so that the ones in the front wont get all of the bass and the ones in the back wont get any bass at all. Instead you want to place the subwoofers in such ways to get a similar sound pressure level independent on where in the audience you stand. At the same time you want the sound pressure level on stage to be lower than in the audience so that the musicians will have a reasonable environment to work in and it will also ease the requirements of the stage monitor system. [2] One thing to have in mind is that there in the center of the audience area quite often will become a larger sound pressure level, something that is generally referred to as a power alley. These can appear on several places over the area depending on the placing of subwoofers and the delay time between them and they are usually something that is required to avoid, or else there won t be an even coverage over the listeners. [1] These power alleys can appear especially if the subwoofers spacing is larger. At the same time the acoustical output can be smoother over the audience if the subwoofers are placed too close to each other. [2] Just like there will be so called power alleys, there can appear places in the audience were there are lower levels of sound pressure level, also called nodes. The reason for these possible power alleys or nodes is the comb-filter effect, which means that two different sound waves will either add to each other or there will be a cancellation, depending on the delay time and amplitude Research question and aim On larger festivals and concerts the use of larger subwoofer arrays with many subs is usual because it makes it easier to get an even coverage over the audience. A problem that can occur while planning the subwoofer placing is that it s not always possible to have a lot of subwoofers and therefore it may be harder to get the result aiming for. This can depend on that the place can t afford several subwoofers, that there s not enough space or for other reasons. One reason to why several subwoofers is better is because if one want to get a certain directivity of the lower frequencies there have to be multiple sound sources and just a few subs might not be enough. If the directivity can be changed it is easier to decide and plan where to place the subwoofers and it can be possible to avoid having a lot of low frequencies were they re not preferable. [1] For example if the aim is to get a lower sound pressure level on the stage the subwoofers can be placed so that they only play out over the audience and not so much backwards up on the stage. This can be possible by using a lot of subwoofers and for example making subwoofer clusters out of them and thereby 2-4 subwoofers probably won t be enough to get a just as good result as when using more subs. [2] 4
6 In some cases you might need a cardioid subwoofer to get the SPL lower on the stage but if you don t have a subwoofer with the cardioid directivity it is possible to make one by for example placing two omnidirectional next to each other, with one of the subwoofers polarity reversed and a small delay added on the reversed one. [2] This solution takes a lot more subwoofers than it would by having real cardioid subwoofers but it is still a way to be able to change the directivity a bit if necessary. Another benefit with having several subwoofers is that they can be placed closer together so that power alleys and nodes can be avoided and the sound pressure level between frequencies can be more even. When subwoofers are placed at a larger distance from each other the delay time between them increases as well and this can cause comb filter, which may result in cancellations and power alleys. This study looks in to a few subwoofer setups that are commonly used on smaller concerts with just 2-4 subwoofers in use. The idea of this study is to measure 8 different setups to see how the sound pressure level is spread over the audience and on the stage and to see how the levels are compared to each other. The goal is to get an even coverage over the audience and still have a lower SPL on the stage. In this study there will only be made measurements of the sound pressure level and it will not focus on how the different placing solutions sounds. The aim for the study is to see if one can be able to get preferable differences in levels between the stage and the audience with just 2-4 subwoofers. Something that normally takes a lot more subwoofers to achieve since it is difficult to change the directivity of subwoofers without multiple sources. 5
7 2. Background 2.1. The PA system PA stands for Public Address and is used to strengthen the sounds to give a better balance between the instruments so that the people in the audience will hear everything. Some instruments with lower volume, for example vocals, need to be strengthen and put up at the same levels as amplified instrument such as bass guitar and guitar. The PA makes it possible for a lot more people to hear the performance compared to only playing acoustically. During the last years the development of sound systems has gone really fast and nowadays the sound systems are really good and can handle larger levels. In the 30 s and 40 s it was more usual to have just one microphone for the singer and nothing more. Then when the rock music grew bigger in the 50 s and 60 s this changed in order to be able to control the louder music and also to be able to overpower the noise from the audience. [3] To reproduce the lower frequencies of the music a loudspeaker called woofer was used during the 70 s. The crossover between the higher and the lower frequencies then generally were around 500 Hz. When the disco music, with its powerful bass drum, became extremely popular in the late 70 s the audio reproduction required something new to reproduce the frequency range of the bass drum. New speakers with a crossover frequency at 80 Hz were developed since it allowed reproducing the sound between 40 Hz (an octave below 80 Hz) and 120 Hz (half an octave above 80 Hz). These loudspeakers became known as subwoofers since they played below the woofers. [2] In figure 1 there is a simplified overview of a PA system and the different parts that the sound goes through on it s way from the microphone or instrument to the loudspeaker. In this chain one can also put equalizers and other effects, for example a equalizer can be inserted between the mixing console and the crossover to be able to tune the system. There can also be added effects by sending the sound from the mixing console, to the effect and back again to the mixing console. Figure 1. Overview of the parts of a PA-system. 6
8 2.2. Subwoofer clusters The subwoofers used in live sound mostly have a polar pattern that is omnidirectional and by adding another subwoofer close with a reversed polarity results in a pattern that is dipole. This setting with a dipole pattern can easily be turned in to a cardioid by adding a small delay to the secondary subwoofer. By removing the reversed polarity of the second subwoofer you can reverse the pattern so that the subwoofers play against the other way, for example to the front instead of backwards. Even though the subwoofers are placed to play forward, away from the stage, there still will be some low frequencies on the stage. There is also a risk that the coverage over the audience won t be even and that the audience that stands to the sides of the stage won t receive as much of the lower frequencies as the ones in front of the middle of the stage. This will especially occur for audience that is placed on an area similar to an arena, where there are people on the sides too and not just in front of the stage. This problem of coverage can be solved by adding two more subwoofers, with the third one placed directly to the right of the primary source and with the same signal as the second unit. The fourth one will be placed equally spaced from the second and third unit and with polarity that is reversed and with no delay. The reason for this fourth subwoofer is that with just the first three subwoofers there is a build up of energy in the rear of the subwoofer cluster. With the fourth unit added you get rid of this energy and it also gives a better directivity on the sides and in front of the cluster. To cover the audience during a concert you can either add some additional subwoofers under or in front of the stage, or you can rotate the four subwoofers cluster so that its energy gets directed in a way that it covers the center audience. This configuration just requires two channels of processing/amplification because the signal of the first and forth are the same, just as the second and third have the same signal. For placing with individual cardioid sources you are able to rotate the subwoofers the way you want to get a desired coverage. Depending on the delay time and spacing between the units there will be some sort of interference between the sources. [2] 2.3. Sound pressure level Sound pressure level is the parameter that is usually uses while measuring in acoustics since it s the most accessible parameter. The sound pressure level (SPL) can be referred to as the sound level and it is a logarithmic value of the sound pressure. To calculate the sound pressure level when the reference pressure is 20 µp and the sound pressure (p) is measured in micropascals one can use equation 1. The reason for 20 µp being the reference level is that it is a close value to the minimum audible pressure for sounds in air. SPL =10log 10 p 2 p ref 2 (equation 1). p = 20log 10 20µPa decibels To get a better perspective of what these levels mean we can compare them to some sounds that we might be exposed to in the real world (figure 2). 7
9 Figure 2. Sound pressure level db compared to sound pressure Pascal. To measure sound pressure level there are sound-level meters designed for this purpose. The human hearing is not flat and for example there is a roll-off both in the low and the high frequencies in our hearing sensitivity. At softer listening levels this roll off is more pronounced and therefore there are usually three different weightings networks to choose between on the sound-level meters, called A, B and C. Depending on the level of the sound-pressure to be measured one of these three networks are more preferred than the others, for example: Network A for a SPL of db. Network B for a SPL of db. Network C for a SPL of db. [4] 2.4. Sounds in the free field A free field means that there is nothing at all that will influence or change the sound in any way. This means that a sound in a free field is undiffracted, unreflected, unabsorbed, undiffused and so on. These free fields were sounds can travel without interference are generally just a theoretical invention but there can exist an approximate free field in for example anechoic chambers. The inverse distance law is a way to understand how the sound changes over distance. The sound pressure and the distance from a source is inversely proportional to each other, just like the sound intensity is inversely proportional to the square of 8
10 the distance. For each doubling of the distance the sound pressure level reduces with 6 db in theory. This only applies for sounds in the free field but it works as a basis for understanding the sounds behavior in practical circumstances as well. [4] 2.5. Comb-filter effect and standing waves If the frequency response of a signal is effected with a delayed reflection this is often referred to as a comb-filter. Superposition is an example of when both destructive and constructive interferences will appear, for example on sounds. For two sounds this means that they will either summarize or they will cancel each other depending on the phase. For example if a 60 Hz tone gets to a microphone at the same time as another 60 Hz tone with the same amplitude and the same phase they will reinforce and deliver an output voltage twice as large, with a 6 db increase. If they instead have the same amplitude but one of the signals (tones) is out of phase with 180 they will acoustically cancel each other which means that the output voltage from the microphone will fall to zero. Also signals with another amplitude can interfere with the sound and make changes in the spectral shape, for example reflections from walls and floor depending on for example the angle of incidence and the surface acoustical characteristics. A comb-filter is produced when a direct sound is combined with its reflections and one characteristic in the frequency response will be nulls, also called notches. These appear when the signals cancel each other due to different phase. It is the delay between the reflected and the direct sound that determines the peaks and nulls frequencies. At the point where the period is twice the delay time the first nulls frequency appear, which can be calculated with: f=1/(2t), where the t stands for the delay in seconds. On each odd multiple (1,3,5,7 and so on) nulls will appear successive. For peaks the first one will appear at f=1/t and after that successive at 1,2,3,4,5 and etcetera. If the delay time between reflected and direct sound increases the number of superposition will increase as well, in other words, the risk of getting problems with comb-filter is larger the more the delay time increases. [4] When talking about standing waves in rooms these peaks and nulls is called antinodes (reinforcement, maximum) and nodes (cancellation, minimum). A standing wave in a room appear when the sound waves superposition and along the wave there will be nodes and antinodes, which can be audible if walking along it and it s in an audible frequency and amplitude. In a room there are many ways node can appear since a room has three dimensions height, width and length. Because of the walls the sounds can reflect from more than two surfaces, which can create other kinds of nodes as well. [4] 2.6. Cardioid subwoofers In situations were there are concerts or festivals indoor the ideal thing would be to have unidirectional arrays so that they could be placed in a way to avoid a lot of reflections from the sides or the back wall. This desirable behavior is more or less achieved for the higher frequencies since the backward lobe is relatively week. This is however not the case for the lower frequencies in an array since they get more omnidirectional the lower in frequency they get. It is really simple to make a cardioid subwoofer by using two monopole sources with opposite polarity, placing them together and adding a delay to one of them. 9
11 When a delay is added it means that the time have been changed so that one of the sounds will come after the other. The delay time is usually specified in milliseconds (ms). [5] Gradient loudspeakers are the most common technique to use when keeping control of the low- frequency directionality. This technique is based on the knowledge about controlling the direction of microphones and was proposed in 1973 by Olson. As Olson described it: A gradient loudspeaker is: A loudspeaker consisting of two or more loudspeakers separated in space and operating with a difference in phase or powers of the difference in phase between the loudspeakers [2]. Through this method the loudspeakers can achieve different polar responses and the three basic polar patterns are cardioid, dipole and omnidirectional. The zero-order gradient sound source is the simplest pattern and only consists of one omnidirectional speaker. By placing two omnidirectional units next to each other with opposite polarity it becomes a first-order gradient sound source, also called a dipole. This pattern looks like an eight. If we use the same setup as the first-order gradient sound source and just change the delay time with a small amount on one of them the polar pattern will cardioid. So just by adding different units with different delay and phase one can create many different polar patterns with omnidirectional speakers or subwoofers. [2]. 10
12 3. Method A large part of this examination was based on real world measurements of subwoofers placed in a room in different setups, all to be able to see the sound pressure level at different frequencies. The goal for this test was to be able to easier see the difference between setups and because of this, measurements were made instead of for example a listening test, which more show how people perceive the differences. Since the research focus on subwoofers all these tests were made with only subwoofers and without a main PA playing. Clio were used to make the measurements since it is a good program that is able to measure the sound pressure level for several frequencies (with sine sweeps) and show the results in diagrams that get a good overview of the levels. An ordinary SPL-meter could as well have been used but this would have taken a lot more time and therefore Clio was chosen. This examination was made in two different steps, first there were made some simulations in ArrayCalc and afterwards real world measurements made with 4 Nexo subwoofers. There were made 6 simulations and 8 measurements and for these a stepped sine sweep were used. The signal from Clio was sent in to a Mini Drive before it was sent in to the amps, all to be able to control the delay time for the subwoofers Venue: The measurements took place in Black box, Acusticum, in Piteå. This is a concert hall with the size; Length 21,866 m x With 11,866 m x Height 9 m. In the room there is also an orchestra pit in the floor made for concerts with an orchestra. When it s not in use the pit is covered with floor and at the time of the measurements it was not damped in any way. [6] 3.2. Equipment 4 Nexo SL Nexo amps 1 Mini Drive 1 Computer with Clio 1 Microphone for measurements Cables ArrayCalc version V6.4 CLIOwin 6, Setups During this test 8 setups were used. The setups measured were some of the most common setups seen on smaller concerts such as one subwoofer on each side of the stage, four subwoofers spread equally in front of the stage and two in the middle of the stage. This was a way to compare which setup is most appropriate when you want to have an even SPL coverage over the audience and a lower level on the stage. Some of the setups were just the same when it comes to the placing; the difference was instead the delay time on the subwoofers. Setup 1 (figure 3) was a basic setup with one subwoofer on each side of the stage, both with the same polarity and the delay-time put on 0 ms. The second setup (figure 4) was just the same as the first one with the only difference that there now were to 11
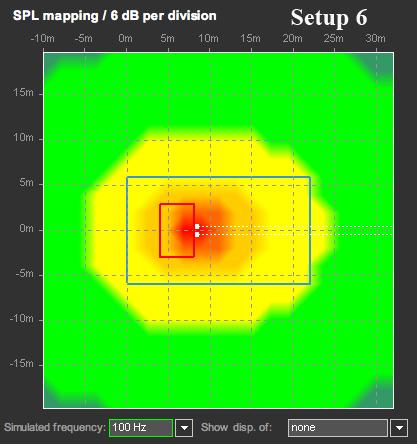
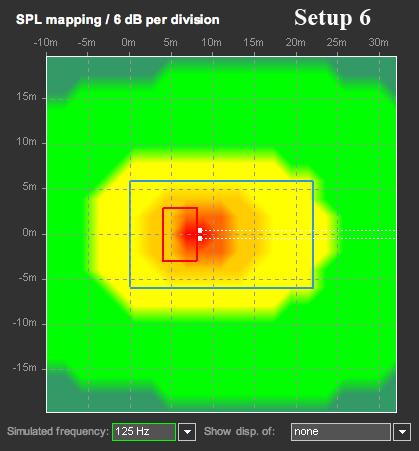
13 subwoofers stacked on each side. These setups were used because they are very commonly used on smaller concerts, probably because it is so easy to just put the subwoofers on each side of the stage. Setup 3-5 (figure 5-7) were exactly the same in placing, the spacing between them was about 94 centimeters. These were made to be able to compare the setups with a larger spacing (left and right) with the ones with a smaller spacing to see if there are any noticeable comb filter consequences. In setup 3 there was no delay on the subwoofers, on setup 4 the two in the middle had a delay-time of 3 ms and on setup 5 the two furthest to the sides had a delay-time of 3 ms. In the figures the delayed units have a D written on them. Setup 6 (figure 8) consisted of two units, this time with both placed in the middle of the stage instead of one on each side to be able to compare the difference. In setup 7 (figure 9) A and C have the same settings with no delay on and facing the audience, while B is turned back to front facing the stage. B also have a reversed phase and a 2 ms delay added to it. Setup 8 (figure 9) is exactly the same as setup 7 with the only change that the delay-time on B now is set on 2,5 ms. These two setups were based on a setup made by Rog Mogale and is the only setup in this test where a cardioid subwoofer is made by the omnidirectional subwoofers used in this experiment. [7]. 12
14 Figure 3. Two subwoofers in front of the stage, one left and one right. Figure 6. Four subwoofers in front of the stage, with 3 ms delay on the two in the middle. Figure 4. Two subwoofers in front of the stage on each side, left and right. Figure 7. Four subwoofers in front of the stage, with 3 ms delay on the two on the sides (left and right). Figure 5. Four subwoofers in front of the stage, all with the same settings. Figure 8. Two subwoofers in front of the stage, in the middle of it. 13
15 Figure 9. Three subwoofers, A and C with the same settings and playing towards the audience, B with a inverted phase, playing towards the stage. The delay times were 2 ms in setup 7 and 2,5 ms in setup Simulations Before the measurements took place the setups were made in ArrayCalc to be able to compare the real world measurements with simulations. ArrayCalc is a system design program made by d&b and for the simulations the Q-sub were chosen since this is the subwoofer that is most similar to a Nexo SL 1200, both consisting of 1x18 driver. [8 and 9]. Simulations were made for setup 1-6 in ArrayCalc. Setup 7 and 8 could not be done completely since it is not possible to change the phase setup in the used version of ArrayCalc. The subwoofers can be turn 180 but the phase cannot be inverted Placing of measuring points The measuring points in the room were the same for all the setups. Totally there were 25 points, 15 in the audience area and 10 on the stage to get a better view of the levels in the room at different points (figure 10). The stage and the floor were on the same level for the measurement. 8 of the measuring points were decided where to be before they were marked out. These were the 5 points in the middle of the audience, with 2 meters distance between each point, and the 3 points on the stage with a distance of 1 meter. The reason for this was to see the SPL change over distance. All the other measuring points were decided where to be while marking out all points in the room. They were marked out on the floor and then measured to see the distance to the middle of the room and the front of the stage (table 1). The measuring points were spread over the audience and stage area with different distance to each other. Just a few points were symmetrical but mainly there were nonsymmetrical points. Since the room is like a box and the subwoofers were placed symmetrical there would probably be the same values in the symmetrical points. Therefore the points were mainly marked out non-symmetrical. The microphone was placed at a height of 1,6m. 14
16 Figure 10. The measuring points in Black box, P (audience) and S (stage). 15
17 Table 1. The measuring points distance to the middle of the room and the front of the stage Clio and settings The measurements were made with Clio, an acoustical measurement system. They were made with a stepped sine sweep between Hz, with 1/48 octave. No gate or delay was added in the program settings. First of all a measurement of the room without any sound from the subwoofers were made at point P9 to see the sound pressure level of the background noise (figure 11). After that the level of the subwoofers were measured at point P6 for setup 1 with the result 69,5 dbspl at 60 Hz. All settings were the same during the whole experiment, nothing changed except for the amount of subwoofers, delay time and phase. 16
18 Figure 11. Result of measurement without any subwoofers, the room only. As we can see on this graph of the noise in the room it is on a quite low level, never over 60 dbspl that is the level of normal speech. These sounds are probably mainly from the ventilation system, the computer and the amplifier for the subwoofers. Since all the frequencies are low, under 130 Hz and our ear have a roll-off on both high and low frequencies this means that they have to be a lot higher to be disturbing. Compared to a Noise Rating curve the levels in a concert hall should not exceed the NR 25 curve, by looking at the curve above the result fits between NR 20 and NR 30 [9]. In other words the levels for the noise in the room is low enough to be acceptable in this room. Noise rating curves are mainly used in Europe while noise criteria curves (NC) are used in the USA. Both the NR and NC curves are standard curves that show the criteria for the noise levels at frequency bands and how much noise is acceptable. When comparing the levels in a room against the NR curves it is the nearest curve above that it relates to (where none of the measured results rises over the levels in the NR curve). [10] 17
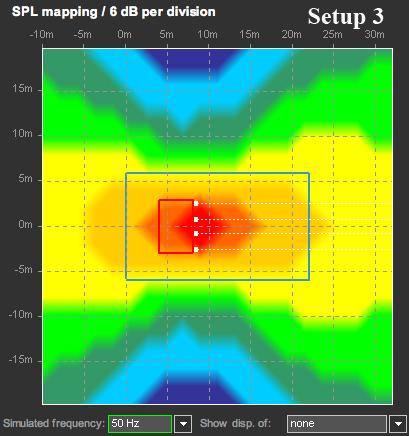
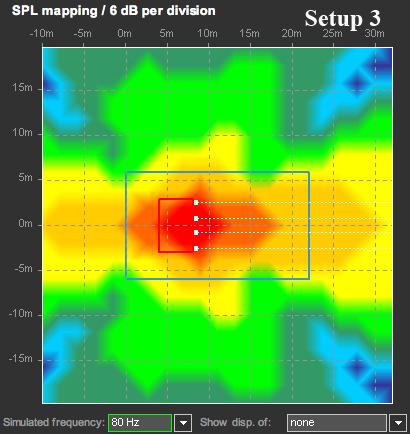
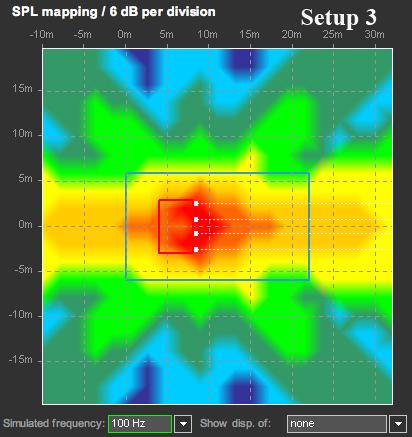
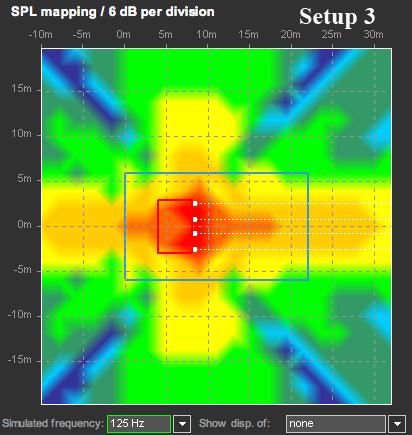
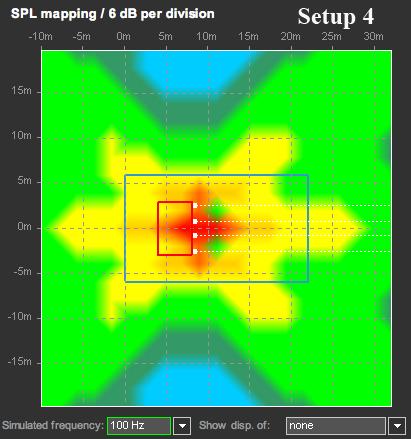
19 4. Results and analysis 4.1. ArrayCalc simulations The following figures (figure 12-17) show the results of the simulations in ArrayCalc for setup 1-6 at 63Hz. The reason that 63 Hz is chosen for this result and analysis part is because this is a frequency that has a higher sound pressure level on the stage than in the audience for setup 1 and 2 and it is interesting to see how it differs from the other setups as well. This is also a frequency that is audible, the subwoofers can handle to play it fully and it is a lower frequency that means that it will be quite omnidirectional which might have an influence on the result. As mentioned earlier (in 3.4.) setup 7 and 8 could not be done in ArrayCalc since it is not possible to convert the phase in the program and therefore there are no ArrayCalc pictures of them. For each division (change of color) there is a loss of 6 db, where the red got the highest SPL and the dark blue got the lowest. Unfortunately ArrayCalc doesn t show the exact SPL level to begin with while using just subwoofer arrays; therefore it s not possible to know the expected levels in the different divisions. Figure Hz at setup 1. Figure Hz at setup 2. Figure Hz at setup 3. Figure Hz at setup 4. 18
 is setup 4 (figure 15), but at the same time the output over the audience is very low as well.")
20 Figure Hz at setup 5. Figure Hz at setup 6. In all of these settings there is still a lot of bass on the stage since the subwoofers are placed directly in front of the stage. The setup that seems to be the most suitable (that have a low amount of lower frequencies on the stage) is setup 4 (figure 15), but at the same time the output over the audience is very low as well. Setup 1 and 2 (figure 12 and 13) are almost identical to each other and both spreads a lot to the sides and not so much to the front or to the back. Setup 6 (figure 17) spreads all over the area with a smaller amount in the stage but not so far out in the audience. Setup 5 (figure 16) gives quit large amount of bass on the stage but seemingly a lot of bass out over the audience as well. The bass on the stage is more directed to the sides of the stage and there is a lower level in the middle of the stage. 19
21 4.2. Graphics Each graphic show the setups 1-8 for one measuring point (figures 18-23). On the x-axis the frequency is seen and on the y-axis the sound pressure level in dbspl is seen. This means that the graphics show how the sound pressure level changes for different frequencies at the same measuring point and with the different setups compared to each other. This way we can also see room-nodes and antinodes. The different colors are for the different setups. Setup1: Red Setup2: Grey Setup3: Green Setup4: Yellow Setup5: Orange Setup6: Blue Setup7: Purple Setup8: Light Blue Audience area Figure 18, setup 1-8 at P3. In P3 we can see that the red line (setup 1) is very uneven and for example have a large dip around 70 Hz. This could be because of room nodes at these specific frequencies where it is lower. We can also see that the yellow line (setup 4) is quite even over frequencies. 20
22 Figure 19, setup 1-8 at P6. At point P6 we can see that all the setups are quite uneven between the frequencies on all the setups. At about 95 Hz we can see that all the setups have a dip and this is probably because of a room node. One notable thing between this point and P3 is that setup 1 (the red line) doesn t have just as large dips as in P6, instead it is the orange line (setup 5) that have more nodes shown. 21
23 Figure 20, setup 1-8 at P9. Point P9 we can see that the setups are really similar to each other, the nodes seem to appear on the same places for all the setups and the average SPL value is more even. When comparing the graphics for P3 (figure 18), P6 (figure 19) and P9 (figure 20) none of the setups are as even between frequencies as one might prefer them to be. Setup 4 (yellow) is quite even on the three points and so also setup 3 (green) but if we look at setup 1 (red) and 5 (orange) they differ a lot in all of the points. However, the further away from the stage the curves get more even. As we can see there is a roll-off for all frequencies between Hz where the levels are lower and they are quite similar between the setups. 22
24 Stage area Figure 21, all setup 1-8 at S2. At S2 the sound pressure level between the frequencies are very even but we can also see that the level on the stage is around dbspl for all of the setups. This is still a quite high level when the aim is to reduce the low frequency level on the stage and keep a lower SPL there. Figure 22, setup 1-8 at S5. 23
25 At S5 there are a bit more nodes that appear compared to setup S2 but the setups are still quite similar to each other. Figure 23, setup 1-8 at S8. Compared to the audience area the stage area with graphics from S2 (figure 21), S5 (figure 22) and S8 (figure 23) have a more even spread in SPL between the frequencies in all the setups. Especially between 35 Hz-60 Hz. Above 60 Hz there seem to be more interference. Also on the stage Setup 4 (yellow) is the one with the most even SPL. The level on the stage however is quite high and in most setups almost just as high as in the audience Calculating the arithmetic average Since there were made a lot of measurements (totally 200 since there were 25 measuring points and 8 different setups) calculating the arithmetic average is a way to make it easier to see the differences between the levels on the stage and in the audience. Because of the sound pressure level being logarithmic there are logarithmic equations that has to be done Formulas If there are two different sounds, for example a fan (A) and a ventilation system (B) the combined dbspl can be calculated with the formula below (equation 2). [4] A log B 10 (equation 2) 24
26 Since this calculation only is for calculating the combined db for two different sounds we have to change it a bit to calculate the arithmetic average for the SPL on a specific measure point. The formula used in the calculations made for this report is: L P, medel =10* log 1 N N 10L Pi / 10 i =1 (equation 3) The calculations were made with excel and the result for the audience is of course separate from the ones on the stage. 25
27 Tables Table 2 shows the arithmetic average for setup 1-4 and table 3 shows the average for setup 5-8, where the A stands for Audience and S for Stage. The frequencies showed are the ones closest to those seen in ArrayCalc. Table 2. The arithmetic average for Setup 1-4, A for audience S for Stage. Freq. Setup 1 Setup 2 Setup 3 Setup 4 Hz. A S A S A S A S 32,08 77,0 83,2 81,7 89,0 85,7 91,9 88,3 91,6 40,39 90,3 86,8 96,1 92,3 97,0 96,4 96,9 97,2 50,12 89,8 91,5 95,4 96,8 96,4 98,0 96,7 98,3 60,43 94,2 90,4 100,7 94,6 96,0 91,4 98,8 94,8 63,1 89,1 90,8 94,6 96,8 96,5 92,8 97,4 95,2 80,58 90,7 86,6 95,8 90,6 95,4 93,4 96,8 94, ,3 83,1 91,5 86,9 92,3 86,7 92,1 90,1 110,6 83,3 81,3 88,1 85,2 86,1 86,0 88,7 86,7 120,57 83,9 82,0 89,2 86,9 89,4 82,7 89,2 85,9 125,89 82,1 76,6 87,7 81,1 83,8 80,9 85,7 80,9 131,45 81,0 78,3 85,8 82,8 83,3 81,7 85,5 81,0 Table 3. The arithmetic average for Setup 5-8, A for audience S for Stage. Freq. Setup 5 Setup 6 Setup 7 Setup 8 Hz. A S A S A S A S 32,08 86,4 92,2 86,2 90,1 85,6 88,7 85,7 88,7 40,39 96,5 96,5 93,8 95,4 93,5 94,9 93,6 95,0 50,12 96,1 96,9 94,0 94,4 95,6 94,5 95,9 94,3 60,43 96,3 89,1 97,3 91,0 96,1 89,2 96,4 88,9 63,1 95,4 91,9 95,7 91,6 95,4 90,7 95,6 90,0 80,58 92,6 91,3 93,5 91,6 93,6 89,4 93,7 89, ,9 87,9 91,6 86,8 90,9 88,4 90,8 88,0 110,6 86,6 84,2 89,0 84,2 88,8 86,4 88,4 85,4 120,57 86,4 85,4 89,6 82,3 86,6 82,9 86,7 82,2 125,89 84,4 81,3 86,5 78,1 84,1 81,2 84,0 80,4 131,45 84,2 79,8 85,7 80,2 80,9 79,0 80,9 77,4 To get a better view of the difference between the sound pressure level on the stage and tin the audience the arithmetic average were calculated for all measuring points in each setup (table 4). 26
28 Table 4. Arithmetic average on each setup, audience and stage are separated. Audience Stage Setup 1 88,9 87,3 Setup 2 94,7 92,4 Setup 3 94,0 92,7 Setup 4 95,0 93,8 Setup 5 93,2 92,0 Setup 6 93,1 90,9 Setup 7 92,7 90,4 Setup 8 92,9 90,1 The arithmetic average between the stage area and the audience area are quite similar in all the setups. For some setups the average is even higher on the stage than in the area for some of the frequencies, for example at 63,1 Hz in setup 1 and 2. Setup 7 and 8 are the ones with the largest difference between stage and audience while looking at 63 Hz but it still just differs about 5 db between them. 27
29 5. Discussion The setups used in this essay are a few of the ones usually seen on smaller concerts. Setup 1 and 2 might be the most common way to place the subwoofers, with one or two subwoofers on each side of the stage. By looking at the results from these measurements it seems like none of the eight setups are really good if you want to keep the level lower on the stage for the lower frequencies. The differences between the levels on the stage compare to the levels in the audience are not large enough and it is the same for all of the setups. Since there were 15 measuring point in the audience and 10 on the stage there are larger differences between maximum and minimum level in the audience (also due to the distance between measuring point and subwoofer), but the calculations still give the average sound pressure level for both places. When comparing all of the graphics from the measurements (all available to see in the appendix) the setups were quite similar in coverage but there were some noticeable differences. For example, setup 1 and 2 are the ones with the most uneven sound pressure level between different frequencies. The other setups are a more even but that also depends a lot on which measuring point the data is taken from. This differences in coverage is something seen when comparing the simulations from ArrayCalc as well. Another thing that can be seen while comparing the results from the stage against the results from the audience is that the sound pressure levels over frequency is more similar to each other on the stage for the eight setups and that the nodes are not as large and many on the stage. This could be because the measuring points on the stage are closer to each other and the fact that they are behind the subwoofers. When measuring points further away in the audience gets a more even SPL between the frequencies and the nodes are not as large. A reason for that could be that the amplitude and delay time between the different sounds wont be as large as they are when getting closer to the subwoofers. Therefore the reinforcement and cancellations might not be just as noticeable the further away from the subwoofers one gets. Since setup 1 and 2 are the ones with the most unevenness one can assume that it is better to place the subwoofers closer to each other to avoid power alleys and nodes and therefore it is preferable to place the subwoofers equally over the stage or next to the middle of the stage instead of one subwoofer on each side. This got a lot to do with the comb-filter effect and the unevenness is due to the delay time between the sound sources. Another part of the effect is that the further away from the sound source one gets, the SPL gets more even between the frequencies, in other words, the coverage is more even further away. This is due to the delay time, the further away one gets, the less difference there is in distance to the sound sources. Setup 7 and 8 were the only setups in this examination based on making cardioid subwoofers out of omnidirectional subwoofers. The results of these two setups are quite similar to the other setups and there is only a difference of 2-3 db between the stage and the audience. A reason for this result could be that the delay time of the subwoofer playing against the stage were not completely right and therefore the setups did not create enough cancellations on the stage area as hopes for. To get a better result of this placing it might have been a good idea to try to calculate a bit more on what the delay time should have been instead of just choosing two different delay times. The reason that the area between Hz is quite similar to all the setups and that the levels are lower there could be because it is under the subwoofers usable range 28
30 and that they are not able to play these frequencies fully. The differences in this area could instead be due to how close the measuring microphone were to the ventilation, the amplifiers and other things that might have given a noise. The levels are still quite low and more similar to the level of the background noise that was measured in the beginning. By looking at the simulations in ArrayCalc we can see that in all of the setups there are a lot of lower frequencies on the stage and that the difference between the stage and audience are quite small. This is also what s been shown in the real world measurement which means that the simulations gives a quite good image of how the setups will behave. Therefore it might be a good thing while planning for a subwoofer array to first see in ArrayCalc what it will look like before placing the subwoofers. Even if it won t be exactly the same it can still get a good preview of how the result of the placing might be and therefore also save some time. This research wasn t able to come up with a suitable solution for placing of the subwoofers when the aim is the get an even coverage over the audience and still have a lower SPL on the stage. The results from the eight different setups are quite similar to each other and none of them seem to be the best solution of subwoofer placement for this specific aim. Even though the result wasn t as different as hoped they might still be in good use for others that want to continue this research Reliability In this test all the settings were the same for all the setups except for the amount of subwoofers, the delay time and the placing. Therefore there were not any factors in the setup that could have influenced the result. One thing that could have influenced the result is the orchestra pit because of it being just an empty box that is not damped it could give some resonance at different frequencies. Another thing that could have differed between the different measuring points is the placing of the microphone. The height of it were the same for all the points and so where the placing in the room, but since it were moved between all the points the microphone might have pointed a few centimeters different between them even if the aim was that it would be directed straight forward, against the stage all the time. So due to the human factor there might be some small differences in placing, just a few centimeters but still a difference. This might have had a small impact on the results but other than that these results have a large reliability. The method used in this examination was to measure only the subwoofers without the main PA, this because the focus was on the subwoofers and not the whole system. The subwoofers got their own outputs on the amps and therefore it should not matter that the rest of the PA was not in use. One thing that could have influenced the work is the crossover and how it is made, however, in the specifications for the Nexo subwoofers it can be read that the crossover frequency is at 80 Hz and that the usable range is between Hz. The subwoofers therefore should be able to play all the frequencies without any problem. This method is quite similar to other research were they make simulations and compare them to real world measurements. In the planning of this experiment a few of these researches were read and the methods used in some of them are similar to the one used in this essay. One larger difference is that they in one of them [2] had a lot more simulations in programs that show the results better. The Finite-Difference Time-Domain method is quite often used in other research in this area. The method 29
31 used in this essay worked well for the examinations since it gave the results needed to make a comparison but it might have been easier to use another program for the simulations. Partial because ArrayCalc couldn t show the exact levels of the lower frequencies; it only shows the exact levels for the main PA which was not used for this project. Since ArrayCalc is a program made for loudspeakers from d&b it might be some differences in the results but not any large ones because of the fact that subwoofers are omnidirectional and works on similar ways independent of manufacturer. When it comes to real world measurements not all the earlier research had just as many measuring points as the ones used in this work, for example one research only used 10 different measuring points, 7 in the audience and 3 on the stage, all lined up and not spread out over the area [2]. Another thing that is different between this examination compared to earlier work is the use of flown subwoofers. This is something that was chosen not to use for this experiment since it was not possible to fly the subwoofers used for the experiment in the room used. The lack of time and that fact that the author was alone during the experiment also affected the choice Conclusion The aim of this experiment was to see if it with 2-4 subwoofers is possible to get an even sound pressure level coverage for the lower frequencies over the audience at the same time as the SPL on the stage are lower. This can be hard to achieve since there have to be several subwoofers to be able to change the direction of the sound. The setups measured in this examination are some of the more common setups seen on smaller events and the test includes both simulations and real world measurements. The arithmetic average between the different setups measured in this experiment doesn t have enough difference between the level on the stage and in the audience. This means that none of these setups were able to fulfill the goal to get a lower sound pressure level on the stage, at the same time as there is an even coverage over the audience. Since the difference is very small between the levels on the stage and in the audience we can assume that the amount of subwoofers were too low to be able to fulfill the goal. To be able to get the result wanted it might be better to use several subwoofers and make larger arrays or subwoofers clusters to be able to change the direction more to take the lower frequencies off the stage. These setups could perhaps have given a better result with cardiod subwoofers instead of omnidirectional Further research There is still a lot to do in this area for the one that is interested. In this paper just a few different setups were compared and for further research other solutions might be good to look up. For example it would be interesting to look into other settings with cardioid subwoofers and try to change the directions so that less lower frequencies spreads to the stage area. All setups were put as close to the stage as possible, this might have had an impact on the results and it may be good to put the subwoofers a bit forward from the stage and not directly in front of it. 30
32 6. References: [1] Shabalina, E., Ramuscak, J. & Vorländer, M., (2011). A Study of Human Perception of Temporal and Spectral Distortion Caused by Subwoofer Arrays, Paper presented at the 130 th AES Convention, London, UK. Convention paper [2] Hill, A.J., Hawksford, M.O.J., Rosenthal A.P., & Gand, G., (2010), Subwoofer positioning, orientation and calibration for large-scale sound reinforcement, Paper presented at the 128 th AES Convention, London, UK. Convention paper [3] Nicklasson, H. (2006). Jakten på det perfekta PA-ljudet. Ljungskile, Sweden: HN Ljuddesign. ISBN: [4] Alton Everest, F. & Pohlmann, K.C. (2009). Master Handbook of Acoustics (5 th ed.). New York, USA: The McGraw-Hill Companies, Inc. ISBN: [5] Start, E. & Van Beuningen, G. (2003). Design and application of DDS- Controlled, cardioid loudspeaker arrays. In Proceedings of the Institute of Acoustics, Volume: 25, Part 8 [6] Black Box measurements, Retrieved March 17, 2013, from [7] Mogale, R, 2008, A Practical Guide To Bass Arrays, Produced in conjunction with Void Acoustics LTD, Part 1. [8] Specifications for d&b q-sub, Retrieved March 17, 2013, from [9] Specifikations for Nexo SL 1200, Retrieved March 17, 2013, from [10] Noise rating curves, Retrieved June 6, 2013, from [11] Rumsey, F., & McCormick, T., (2009). Sound and recording (6 th ed.). Oxford, UK: Elsevier Ltd. ISBN:
33 Appendix: All Graphics Setup1: Red Setup2: Grey Setup3: Green Setup4: Yellow Setup5: Orange Setup6: Blue Setup7: Purple Setup8: Light Blue These graphics show all the setups, 1-8, together for each measuring point in the audience: Setup 1-8 for P1. 32
34 Setup 1-8 for P2. Setup 1-8 for P3. 33

35 Setup 1-8 for P4. Setup 1-8 for P5. 34
36 Setup 1-8 for P6. Setup 1-8 for P7. 35

37 Setup 1-8 for P8. Setup 1-8 for P9. 36
38 Setup 1-8 for P10. Setup 1-8 for P11. 37
39 Setup 1-8 for P12. Setup 1-8 for P13. 38
40 Setup 1-8 for P14. Setup 1-8 for P15. 39
41 These graphics show all the setups, 1-8, together for each measuring point on the stage: Setup 1-8 for S1. Setup 1-8 for S2. 40
42 Setup 1-8 for S3. Setup 1-8 for S4. 41
43 Setup 1-8 for S5. Setup 1-8 for S6. 42
44 Setup 1-8 for S7. Setup 1-8 for S8. 43
45 Setup 1-8 for S9. Setup 1-8 for S10. 44


46 ArrayCalc Simulations Setup 1 at 32Hz, 40Hz, 50Hz, 63Hz, 80Hz, 100Hz and 125Hz: 45


47 Setup 2 at 32Hz, 40Hz, 50Hz, 63Hz, 80Hz, 100Hz and 125Hz: 46


48 Setup 3 at 32Hz, 40Hz, 50Hz, 63Hz, 80Hz, 100Hz and 125Hz: 47
49 48


50 Setup 1 at 32Hz, 40Hz, 50Hz, 63Hz, 80Hz, 100Hz and 125Hz: 49


51 Setup 5 at 32Hz, 40Hz, 50Hz, 63Hz, 80Hz, 100Hz and 125Hz: 50


52 Setup 6 at 32Hz, 40Hz, 50Hz, 63Hz, 80Hz, 100Hz and 125Hz: 51
53 52
THE EFFECT OF PERFORMANCE STAGES ON SUBWOOFER POLAR AND FREQUENCY RESPONSES
 THE EFFECT OF PERFORMANCE STAGES ON SUBWOOFER POLAR AND FREQUENCY RESPONSES AJ Hill Department of Electronics, Computing & Mathematics, University of Derby, UK J Paul Department of Electronics, Computing
LIVE SOUND SUBWOOFER DR. ADAM J. HILL COLLEGE OF ENGINEERING & TECHNOLOGY, UNIVERSITY OF DERBY, UK GAND CONCERT SOUND, CHICAGO, USA 20 OCTOBER 2017
 LIVE SOUND SUBWOOFER SYSTEM DESIGN DR. ADAM J. HILL COLLEGE OF ENGINEERING & TECHNOLOGY, UNIVERSITY OF DERBY, UK GAND CONCERT SOUND, CHICAGO, USA 20 OCTOBER 2017 GOALS + CHALLENGES SINGLE SUBWOOFERS SUBWOOFER
POSITIONING SUBWOOFERS
 POSITIONING SUBWOOFERS PRINCIPLE CONSIDERATIONS Lynx Pro Audio / Technical documents When you arrive to a venue and see the Front of House you can find different ways how subwoofers are placed. Sometimes
White Paper JBL s LSR Principle, RMC (Room Mode Correction) and the Monitoring Environment by John Eargle. Introduction and Background:
 and the Monitoring Environment by John Eargle. Introduction and Background:") White Paper JBL s LSR Principle, RMC (Room Mode Correction) and the Monitoring Environment by John Eargle Introduction and Background: Although a loudspeaker may measure flat on-axis under anechoic conditions,
White Paper JBL s LSR Principle, RMC (Room Mode Correction) and the Monitoring Environment by John Eargle Introduction and Background: Although a loudspeaker may measure flat on-axis under anechoic conditions,
DSP Monitoring Systems. dsp GLM. AutoCal TM
 DSP Monitoring Systems dsp GLM AutoCal TM Genelec DSP Systems - 8200 bi-amplified monitor loudspeakers and 7200 subwoofers For decades Genelec has measured, analyzed and calibrated its monitoring systems
How to Obtain a Good Stereo Sound Stage in Cars
 Page 1 How to Obtain a Good Stereo Sound Stage in Cars Author: Lars-Johan Brännmark, Chief Scientist, Dirac Research First Published: November 2017 Latest Update: November 2017 Designing a sound system
UB22z Specifications. 2-WAY COMPACT FULL-RANGE See NOTES TABULAR DATA for details CONFIGURATION Subsystem DESCRIPTION
 DESCRIPTION Ultra-compact 2-way system Wide projection pattern LF on angled baffles to maintain a wide upper/midrange beamwidth High output, high definition sound DESCRIPTION The UB22z is engineered for
THE DIGITAL DELAY ADVANTAGE A guide to using Digital Delays. Synchronize loudspeakers Eliminate comb filter distortion Align acoustic image.
 THE DIGITAL DELAY ADVANTAGE A guide to using Digital Delays Synchronize loudspeakers Eliminate comb filter distortion Align acoustic image Contents THE DIGITAL DELAY ADVANTAGE...1 - Why Digital Delays?...
Live Sound System Specification
 Unit 26: Live Sound System Specification Learning hours: 60 NQF level 4: BTEC Higher National H1 Description of unit This unit deals with the design and specification of sound systems for a range of performance
Xsub v5.0 cardioid and supercardioid ground-stack array settings
 Cardioid subwoofer array settings Cardioid subwoofer arrays can be used to direct the output of an array of subwoofers in order to limit excessive amounts of bass in undesired locations. Cardioid arrays
JOURNAL OF BUILDING ACOUSTICS. Volume 20 Number
 Early and Late Support Measured over Various Distances: The Covered versus Open Part of the Orchestra Pit by R.H.C. Wenmaekers and C.C.J.M. Hak Reprinted from JOURNAL OF BUILDING ACOUSTICS Volume 2 Number
USER MANUAL FOR DDT 2D. Introduction. Installation. Getting Started. Danley Design Tool 2d. Welcome to the Danley Design Tool 2D program.
 USER MANUAL FOR DDT 2D ( VERSION 1.8) Welcome to the Danley Design Tool 2D program. Introduction DDT2D is a very powerful tool that lets the user visualize how sound propagates from loudspeakers, including
RoomMatch Utility RMU208 TECHNICAL DATA SHEET. small-format foreground/fill loudspeaker. Key Features. Technical Specifications
 RoomMatch Utility RMU28 Key Features Award-winning RoomMatch sound now in smaller 2-way point-source designs for high-level foreground music, under-balcony, zone-fill and vocalrange floor monitor applications
Using the BHM binaural head microphone
 11/17 Using the binaural head microphone Introduction 1 Recording with a binaural head microphone 2 Equalization of a recording 2 Individual equalization curves 5 Using the equalization curves 5 Post-processing
Technical Guide. Installed Sound. Loudspeaker Solutions for Worship Spaces. TA-4 Version 1.2 April, Why loudspeakers at all?
 Installed Technical Guide Loudspeaker Solutions for Worship Spaces TA-4 Version 1.2 April, 2002 systems for worship spaces can be a delight for all listeners or the horror of the millennium. The loudspeaker
MAD A-Series...Flat Panel Surface Planar Arrays
 HPV TECHNOLOGIES, Inc. 17752 Fitch Irvine, California 92614 MAD A-Series...Flat Panel Surface Planar Arrays...Concert Sound at it s Finest! Flat Panel Surface Planar Arrays describe a new speaker technology
A few white papers on various. Digital Signal Processing algorithms. used in the DAC501 / DAC502 units
 A few white papers on various Digital Signal Processing algorithms used in the DAC501 / DAC502 units Contents: 1) Parametric Equalizer, page 2 2) Room Equalizer, page 5 3) Crosstalk Cancellation (XTC),
dbtechnologies QUICK REFERENCE
 dbtechnologies QUICK REFERENCE 1 DVA Composer Ver3.1 dbtechnologies What s new in version 3.1 COMPOSER WINDOW - DVA T8 line array module now available in the System Models window. - Adding modules in the
A Straightforward One-Seat Stereo Tuning Process and Some Notes About Why it Works
 A Straightforward One-Seat Stereo Tuning Process and Some Notes About Why it Works The Process Note 1: This process assumes the input to your DSP is confirmed as a flat, two-channel and in phase signal,
MAW218D7. User s manual. Pol.Ind.Norte-Perpinyà, TERRASSA (Barcelona-SPAIN)
") MAW218D7 User s manual Pol.Ind.Norte-Perpinyà,25 08226 TERRASSA (Barcelona-SPAIN) info@master-audio.com www.master-audio.com Nov 2008 CAUTION RISK OF ELECTRIC SHOCK DON T OPEN WARNING: To reduce the risk
MAW218D7 User s manual Pol.Ind.Norte-Perpinyà,25 08226 TERRASSA (Barcelona-SPAIN) info@master-audio.com www.master-audio.com Nov 2008 CAUTION RISK OF ELECTRIC SHOCK DON T OPEN WARNING: To reduce the risk
Recording to Tape (Analogue or Digital)...10
...10") c o n t e n t s DUAL MIC-PRE Green Dual Mic Pre (introduction).............................4 Section (i): Setting Up Power Connections...........................................4 Power Supply................................................5
c o n t e n t s DUAL MIC-PRE Green Dual Mic Pre (introduction).............................4 Section (i): Setting Up Power Connections...........................................4 Power Supply................................................5
Calibrating Measuring Microphones and Sound Sources for Acoustic Measurements with Audio Analyzer R&S UPV
 Product: R&S UPV Calibrating Measuring Microphones and Sound Sources for Acoustic Measurements with Audio Analyzer R&S UPV Application Note 1GA47_0E This application note explains how to use acoustic calibrations
A Performance Ranking of. DBK Associates and Labs Bloomington, IN (AES Paper Given Nov. 2010)
") A Performance Ranking of Seven Different Types of Loudspeaker Line Arrays D. B. (Don) Keele, Jr. DBK Associates and Labs Bloomington, IN 47408 www.dbkeele.com (AES Paper Given Nov. 2010) Nov. 4, 2010 AES
A Performance Ranking of Seven Different Types of Loudspeaker Line Arrays D. B. (Don) Keele, Jr. DBK Associates and Labs Bloomington, IN 47408 www.dbkeele.com (AES Paper Given Nov. 2010) Nov. 4, 2010 AES
Difficult acoustic environments? Maintaining voice intelligibility
 Difficult acoustic environments? Maintaining voice intelligibility Measurement Conventions Speech transmission index, Alcons and all the others Measurement Conventions % Alcons, STI or C50? %ALcons = Articulation
DIGITAL SPEAKER MANAGEMENT UK
 DSM2-6mkII DIGITAL SPEAKER MANAGEMENT 170.659UK Features 96kHz sampling frequency, 32-bit A/D and D/A converter, 24-bit DSP processor Input channel: 6-band parametric EQ, Delay, Polarity Output channel:
CPH-10 SUBWOOFER OWNERS MANUAL
 CPH-10 SUBWOOFER OWNERS MANUAL www.artcoustic.com Welcome to the world of Artcoustic! Congratulations with your purchase of the Artcoustic CPH-10 Subwoofer. The CPH-10 has an efficient design, producing
Panaray 802 Series III TECHNICAL DATA SHEET. loudspeaker. Key Features. Product Overview. Technical Specifications
 Panaray 82 Series III Key Features Articulated Array design provides 12 x 1 coverage to deliver wide-range reproduction over a broad dispersion area Eight Bose 4.5" (114 mm) full-range drivers for unsurpassed
Genelec 2029B Digital Monitoring System. Operating Manual
 Genelec 2029B Digital Monitoring System Operating Manual 2029B Digital Monitoring System 1. General description Genelec 2029B Digital Monitoring System has a 96 khz/24 bit digital audio interface allowing
VCE VET MUSIC INDUSTRY: SOUND PRODUCTION
 Victorian Certificate of Education 2017 SUPERVISOR TO ATTACH PROCESSING LABEL HERE Letter STUDENT NUMBER VCE VET MUSIC INDUSTRY: SOUND PRODUCTION Aural and written examination Friday 17 November 2017 Reading
I. LISTENING. For most people, sound is background only. To the sound designer/producer, sound is everything.!tc 243 2
 To use sound properly, and fully realize its power, we need to do the following: (1) listen (2) understand basics of sound and hearing (3) understand sound's fundamental effects on human communication
What is the minimum sound pressure level iphone or ipad can measure? What is the maximum sound pressure level iphone or ipad can measure?
 Technical Note 1701 i437l- Frequent Asked Questions Question 1 : What are the advantages of MicW i437l? Answer 1 : The i437l is a digital microphone connected to iphone Lightning connector. It has flat
A BEM STUDY ON THE EFFECT OF SOURCE-RECEIVER PATH ROUTE AND LENGTH ON ATTENUATION OF DIRECT SOUND AND FLOOR REFLECTION WITHIN A CHAMBER ORCHESTRA
 A BEM STUDY ON THE EFFECT OF SOURCE-RECEIVER PATH ROUTE AND LENGTH ON ATTENUATION OF DIRECT SOUND AND FLOOR REFLECTION WITHIN A CHAMBER ORCHESTRA Lily Panton 1 and Damien Holloway 2 1 School of Engineering
The Research of Controlling Loudness in the Timbre Subjective Perception Experiment of Sheng
 The Research of Controlling Loudness in the Timbre Subjective Perception Experiment of Sheng S. Zhu, P. Ji, W. Kuang and J. Yang Institute of Acoustics, CAS, O.21, Bei-Si-huan-Xi Road, 100190 Beijing,
The Orator. by Wilson Benesch.
 The Orator by Wilson Benesch. Post Cubism! The Orator Loudspeaker is a direct descendent of the radical A.C.T. One Loudspeaker development. The distinctive form is functional and attractive and incorporates
Simple Harmonic Motion: What is a Sound Spectrum?
 Simple Harmonic Motion: What is a Sound Spectrum? A sound spectrum displays the different frequencies present in a sound. Most sounds are made up of a complicated mixture of vibrations. (There is an introduction
Lecture 1: What we hear when we hear music
 Lecture 1: What we hear when we hear music What is music? What is sound? What makes us find some sounds pleasant (like a guitar chord) and others unpleasant (a chainsaw)? Sound is variation in air pressure.
Application note for Peerless XLS 12" subwoofer driver
 Application note for Peerless XLS 12" subwoofer driver Introduction: The following is an application note of how to use the Peerless XLS 12" driver especially designed for subwoofers. The application note
J R Sky, Inc. tel: fax:
 STEREO OPTICAL RECORDING SYSTEM N UOPTIX STEREO OPTICAL RECORDING MONITOR LEFT SYSTEM MODE PREVIEW RECORD BIAS RECORD REV SETUP TEST RIGHT INPUT SETUP INPUT BIAS SETUP BIAS INPUT STEREO AUX MONO DIRECT
DRM212 DRM215 DRM315 SPECIFICATIONS
 DRM212 DRM215 DRM315 DRM Series Professional Powered Loudspeakers deliver class-leading power via ultra-efficient Class-D amplifiers with next-gen protection and Power Factor Correction technology for
Vibration Measurement and Analysis
 Measurement and Analysis Why Analysis Spectrum or Overall Level Filters Linear vs. Log Scaling Amplitude Scales Parameters The Detector/Averager Signal vs. System analysis The Measurement Chain Transducer
CTP 431 Music and Audio Computing. Basic Acoustics. Graduate School of Culture Technology (GSCT) Juhan Nam
 Juhan Nam") CTP 431 Music and Audio Computing Basic Acoustics Graduate School of Culture Technology (GSCT) Juhan Nam 1 Outlines What is sound? Generation Propagation Reception Sound properties Loudness Pitch Timbre
CTP 431 Music and Audio Computing Basic Acoustics Graduate School of Culture Technology (GSCT) Juhan Nam 1 Outlines What is sound? Generation Propagation Reception Sound properties Loudness Pitch Timbre
JBL f s New Differential Drive Transducers for VerTec Subwoofer Applications:
 JBL PROFESSIONAL Technical Note Volume 1 Number 34 JBL f s New Differential Drive Transducers for VerTec Subwoofer Applications: Introduction and Prior Art: JBL's 18-inch 2242H low frequency transducer
The Cocktail Party Effect. Binaural Masking. The Precedence Effect. Music 175: Time and Space
 The Cocktail Party Effect Music 175: Time and Space Tamara Smyth, trsmyth@ucsd.edu Department of Music, University of California, San Diego (UCSD) April 20, 2017 Cocktail Party Effect: ability to follow
METHODS TO ELIMINATE THE BASS CANCELLATION BETWEEN LFE AND MAIN CHANNELS
 METHODS TO ELIMINATE THE BASS CANCELLATION BETWEEN LFE AND MAIN CHANNELS SHINTARO HOSOI 1, MICK M. SAWAGUCHI 2, AND NOBUO KAMEYAMA 3 1 Speaker Engineering Department, Pioneer Corporation, Tokyo, Japan
RoomMatch RM and RM TECHNICAL DATA SHEET. asymmetrical array modules. Key Features. Product Overview. Technical Specifications
 RoomMatch RM281 and RM281 Key Features All the benefits of the original 2 RoomMatch array module loudspeakers - Concert-quality sound quality for live music and outstanding spoken-word clarity with industry-leading
Performing a Sound Level Measurement
 APPENDIX 9 Performing a Sound Level Measurement Due to the many features of the System 824 and the variety of measurements it is capable of performing, there is a great deal of instructive material in
DESIGNING OPTIMIZED MICROPHONE BEAMFORMERS
 3235 Kifer Rd. Suite 100 Santa Clara, CA 95051 www.dspconcepts.com DESIGNING OPTIMIZED MICROPHONE BEAMFORMERS Our previous paper, Fundamentals of Voice UI, explained the algorithms and processes required
A Real Word Case Study E- Trap by Bag End Ovasen Studios, New York City
 21 March 2007 070315 - dk v5 - Ovasen Case Study Written by David Kotch Edited by John Storyk A Real Word Case Study E- Trap by Bag End Ovasen Studios, New York City 1. Overview - Description of Problem
A Real Word Case Study E- Trap by Bag End Ovasen Studios, New York City
 21 March 2007 070315 - dk v5 - Ovasen Case Study Written by David Kotch Edited by John Storyk A Real Word Case Study E- Trap by Bag End Ovasen Studios, New York City 1. Overview - Description of Problem
ELECTRO-ACOUSTIC SYSTEMS FOR THE NEW OPERA HOUSE IN OSLO. Alf Berntson. Artifon AB Östra Hamngatan 52, Göteborg, Sweden
 ELECTRO-ACOUSTIC SYSTEMS FOR THE NEW OPERA HOUSE IN OSLO Alf Berntson Artifon AB Östra Hamngatan 52, 411 08 Göteborg, Sweden alf@artifon.se ABSTRACT In this paper the requirements and design of the sound
AC 23S OPERATORS MANUAL ACTIVE CROSSOVER QUICK START. Manual-1
 OPERATORS MANUAL AC 3S ACTIVE CROSSOVER CH 1 LEVEL MID MID / HIGH HIGH CH MID MID / HIGH HIGH W: INACTIVE W: INACTIVE / HIGH W: INACTIVE W: INACTIVE / HIGH LEVEL DELAY 40 400 LEVEL DELAY 0 1.0k LEVEL LEVEL
Anti-Mode 8033Cinema User's Manual
 Anti-Mode 8033Cinema User's Manual Revision History Rev. Date Author Affected chapters Description 1.0 2007-11-30 TK & ToLi All Original version Finnish and English for 8033B 1.8 2012-02-15 POj All Updated
LIVERPOOL TLX43. Custom-Engineered Drivers
 Compact 2 way line array element for portable and fixed installation application 15 Watts continuous, 6 Watts peak power Ideal for FOH, center cluster, offstage fill, stereo in-fill or distributed fill
AcoustiSoft RPlusD ver
 AcoustiSoft RPlusD ver 1.2.03 Feb 20 2007 Doug Plumb doug@etfacoustic.com http://www.etfacoustic.com/rplusdsite/index.html Software Overview RPlusD is designed to provide all necessary function to both
Put your sound where it belongs: Numerical optimization of sound systems. Stefan Feistel, Bruce C. Olson, Ana M. Jaramillo AFMG Technologies GmbH
 Put your sound where it belongs: Stefan Feistel, Bruce C. Olson, Ana M. Jaramillo Technologies GmbH 166th ASA, San Francisco, 2013 Sound System Design Typical Goals: Complete Coverage High Level and Signal/Noise-Ratio
CFX 12 (12X4X1) 8 mic/line channels, 2 stereo line channels. CFX 16 (16X4X1) 12 mic/line channels, 2 stereo line channels
 8 mic/line channels, 2 stereo line channels. CFX 16 (16X4X1) 12 mic/line channels, 2 stereo line channels") COMPACT CFX MIXERS COMPACT SOUND REINFORCEMENT MIXERS WITH EFX FOR THE GIGGING MUSICIAN THREE MODELS CFX 12 (12X4X1) 8 mic/line channels, 2 stereo line channels CFX 16 (16X4X1) 12 mic/line channels, 2
COMPACT CFX MIXERS COMPACT SOUND REINFORCEMENT MIXERS WITH EFX FOR THE GIGGING MUSICIAN THREE MODELS CFX 12 (12X4X1) 8 mic/line channels, 2 stereo line channels CFX 16 (16X4X1) 12 mic/line channels, 2
Brochure ELODIS-SUB-VB21. Copyright by Franz Hinterlehner 1. Version L for deeper bass reproduction Version H for higher sound pressure level
 Copyright by Franz Hinterlehner 1 Brochure ELODIS-SUB-VB21 Version L for deeper bass reproduction Version H for higher sound pressure level 1 Copyright by Franz Hinterlehner 2 2 Copyright by Franz Hinterlehner
INSTRUCTION SHEET FOR NOISE MEASUREMENT
 Customer Information INSTRUCTION SHEET FOR NOISE MEASUREMENT Page 1 of 16 Carefully read all instructions and warnings before recording noise data. Call QRDC at 952-556-5205 between 9:00 am and 5:00 pm
Getting Started with the LabVIEW Sound and Vibration Toolkit
 1 Getting Started with the LabVIEW Sound and Vibration Toolkit This tutorial is designed to introduce you to some of the sound and vibration analysis capabilities in the industry-leading software tool
AMEK SYSTEM 9098 DUAL MIC AMPLIFIER (DMA) by RUPERT NEVE the Designer
 by RUPERT NEVE the Designer") AMEK SYSTEM 9098 DUAL MIC AMPLIFIER (DMA) by RUPERT NEVE the Designer If you are thinking about buying a high-quality two-channel microphone amplifier, the Amek System 9098 Dual Mic Amplifier (based on
AMEK SYSTEM 9098 DUAL MIC AMPLIFIER (DMA) by RUPERT NEVE the Designer If you are thinking about buying a high-quality two-channel microphone amplifier, the Amek System 9098 Dual Mic Amplifier (based on
QSA 200i. ACTIVE LOUDSPEAKER user manual
 QSA 200i ACTIVE LOUDSPEAKER user manual Contents Safety Precautions Safety 03 Installation 04 Flying and installation of this speaker cabinet must be carried out by suitably qualified personnel following
The simplest way to stop a mic from ringing feedback. Not real practical if the intent is to hear more of the choir in our PA.
 Lose the Feeback Improving Gain-Before-Feedback in Worship Sennheiser HOW Applications Tip #9 Kent Margraves, June 2008 *This discussion focuses on the processing and optimization of miked sources on the
Sound Quality. Crossovers. High-Precision Stereo 2-Way/Mono 3-Way Crossover with Subwoofer Output
 Professional stereo 2-way/mono 3-way crossover featuring state-ofthe-art Linkwitz-Riley filters with 24 db/octave Additional subwoofer output with independent Frequency control Absolutely flat summed amplitude
Home Theater / September 2004
 Room Correction, Volume One The next frontier of system tweaking, in gear almost everyone can relate to. by Chris Lewis Audio truth number one: You can spend all the money in the world on equipment, but
Application note for Peerless XLS 10" and XLS 12" subwoofer drivers for cars
 Application note for Peerless XLS 10" and XLS 12" subwoofer drivers for cars Introduction: The following is an application note of how to use the Peerless XLS family of subwoofer drive units especially
White Paper Measuring and Optimizing Sound Systems: An introduction to JBL Smaart
 White Paper Measuring and Optimizing Sound Systems: An introduction to JBL Smaart by Sam Berkow & Alexander Yuill-Thornton II JBL Smaart is a general purpose acoustic measurement and sound system optimization
Con o t n e t n e t n s t
 Contents Page Item 3 Safety Warnings 4 Glossary 5 Attachment and Removal of Caster Frames 6 Line Array Element Attachment 7 Angle Selection 8 Rigging Frame (Bumper) 9 Electrical connection 10 System Mounting
NuQ102 ## ## for FOH, sidefill and delay line loudspeakers, and is an exceptional choice for wedge monitoring applications.
 Product Information Document PA and Installation Applications 2 way full range loudspeaker for for portable PA and installation applications Watts continuous, 1,2 Watts peak power Ideal for FOH, side fill
Pole Zero Correction using OBSPY and PSN Data
 Pole Zero Correction using OBSPY and PSN Data Obspy provides the possibility of instrument response correction. WinSDR and WinQuake already have capability to embed the required information into the event
VCE VET MUSIC TECHNICAL PRODUCTION
 Victorian Certificate of Education 2016 SUPERVISOR TO ATTACH PROCESSING LABEL HERE Letter STUDENT NUMBER VCE VET MUSIC TECHNICAL PRODUCTION Aural and written examination Wednesday 2 November 2016 Reading
Binaural Measurement, Analysis and Playback
 11/17 Introduction 1 Locating sound sources 1 Direction-dependent and direction-independent changes of the sound field 2 Recordings with an artificial head measurement system 3 Equalization of an artificial
A-Line LOUDSPEAKER SYSTEM. Mobile Audio Concert Sound Fixed Installation Pro Entertainment. English
 A-Line LOUDSPEAKER SYSTEM Mobile Audio Concert Sound Fixed Installation Pro Entertainment English A-LINE FAMILY A Perfect Match THE A-LINE IS YOUR ENTRY TO PROFESSIONAL DYNACORD LIVE SOUND Powered loudspeakers
Voxengo PHA-979 User Guide
 Version 2.6 http://www.voxengo.com/product/pha979/ Contents Introduction 3 Features 3 Compatibility 3 User Interface Elements 5 Delay 5 Phase 5 Output 6 Correlometer 7 Introduction 7 Parameters 7 Credits
NuQ152-WH # # connector plate carries Neutrik speakon* NL4 connectors for input and link connections to additional enclosures.
 Product Information Document 2 way full range loudspeaker for portable PA and installation applications 5 Watts continuous, 2, Watts peak power Ideal for FOH, side fill and monitor applications Carbon
BeoVision Televisions
 BeoVision Televisions Technical Sound Guide Bang & Olufsen A/S January 4, 2017 Please note that not all BeoVision models are equipped with all features and functions mentioned in this guide. Contents 1
BACHELOR THESIS. Stereo Microphone Techniques in Drum Recording
 BACHELOR THESIS 2010:163 Stereo Microphone Techniques in Drum Recording Luleå University of Technology Bachelor thesis Audio Technology Department of Music and media Division of Media and adventure management:
Software Package WW 9038 for the Sound Intensity Analysing System Type 3360 or the Digital Frequency Analyzer Type 2131
 Software Package WW 9038 for the Sound Intensity Analysing System Type 3360 or the Digital Frequency Analyzer Type 2131 BO 0065-11 Software Package WW 9038 for the Sound Intensity Analysing System Type
Collection of Setups for Measurements with the R&S UPV and R&S UPP Audio Analyzers. Application Note. Products:
 Application Note Klaus Schiffner 06.2014-1GA64_1E Collection of Setups for Measurements with the R&S UPV and R&S UPP Audio Analyzers Application Note Products: R&S UPV R&S UPP A large variety of measurements
The interaction between room and musical instruments studied by multi-channel auralization
 The interaction between room and musical instruments studied by multi-channel auralization Jens Holger Rindel 1, Felipe Otondo 2 1) Oersted-DTU, Building 352, Technical University of Denmark, DK-28 Kgs.
Achat 115 Sub A active subwoofer. user manual
 Achat 115 Sub A active subwoofer user manual Musikhaus Thomann Thomann GmbH Hans-Thomann-Straße 1 96138 Burgebrach Deutschland Telephone: +49 (0) 9546 9223-0 E-mail: info@thomann.de Internet: www.thomann.de
Multi-Purpose Auditorium Sound Reinforcement System Design ECE Spring 2017
 Multi-Purpose Auditorium Sound Reinforcement System Design ECE 40020 Spring 2017 Left to right: Maxwell Risinger, Riley Shannon, Skyler Carrico, Guanghua Zha Outline Primary System Design Constraints Venue
SR-D8-M, SR-D8-S. (Ver ) SOFTWARE INSTRUCTIONS
 SOFTWARE INSTRUCTIONS") SOFTWARE INSTRUCTIONS active l ine array speak er SYStems SR-D8-M, SR-D8-S (Ver. 1.1.1) Thank you for purchasing TOA's Active Line Array Speaker Systems. Please carefully follow the instructions in this
SOFTWARE INSTRUCTIONS active l ine array speak er SYStems SR-D8-M, SR-D8-S (Ver. 1.1.1) Thank you for purchasing TOA's Active Line Array Speaker Systems. Please carefully follow the instructions in this
ROOM LOW-FREQUENCY RESPONSE ESTIMATION USING MICROPHONE AVERAGING
 ROOM LOW-FREQUENCY RESPONSE ESTIMATION USING MICROPHONE AVERAGING Julius Newell, Newell Acoustic Engineering, Lisbon, Portugal Philip Newell, Acoustics consultant, Moaña, Spain Keith Holland, ISVR, University
PCM ENCODING PREPARATION... 2 PCM the PCM ENCODER module... 4
 PCM ENCODING PREPARATION... 2 PCM... 2 PCM encoding... 2 the PCM ENCODER module... 4 front panel features... 4 the TIMS PCM time frame... 5 pre-calculations... 5 EXPERIMENT... 5 patching up... 6 quantizing
New recording techniques for solo double bass
 New recording techniques for solo double bass Cato Langnes NOTAM, Sandakerveien 24 D, Bygg F3, 0473 Oslo catola@notam02.no, www.notam02.no Abstract This paper summarizes techniques utilized in the process
Audio Engineering Society. Convention Paper. Presented at the 141st Convention 2016 September 29 October 2 Los Angeles, USA
 Audio Engineering Society Convention Paper Presented at the 141st Convention 2016 September 29 October 2 Los Angeles, USA This Convention paper was selected based on a submitted abstract and 750-word precis
SE7261A DSP Subwoofer Operating Manual
 SE7261A DSP Subwoofer Operating Manual 2 Introduction Congratulations and a thank-you for the purchase of this Genelec SE7261A DSP Subwoofer. This manual addresses setting up and using the Genelec SE7261A
Interface Practices Subcommittee SCTE STANDARD SCTE Measurement Procedure for Noise Power Ratio
 Interface Practices Subcommittee SCTE STANDARD SCTE 119 2018 Measurement Procedure for Noise Power Ratio NOTICE The Society of Cable Telecommunications Engineers (SCTE) / International Society of Broadband
Get Funked Compact 6-piece. Technical Rider 2017/18. Contents Page 1/2 Technical Rider Page 3 Channel List Page 4 Monitor List Page 5 Stage Diagram
 Get Funked Compact 6-piece Technical Rider 2017/18 Contents Page 1/2 Technical Rider Page 3 Channel List Page 4 Monitor List Page 5 Stage Diagram Contact Martyn Strange Tour Manager UK cell phone: +44
LUCAS NANO 600 Series
 LUCAS NANO 600 Series PROFESSIONAL SOUND TO GO > LUCAS NANO 602/600/608i 1 LUCAS NANO 600 Series PROFESSIONAL SOUND TO GO > The LUCAS NANO 600 series packs professional audio performance into the most
THE KARLSON REPRODUCER
 THE KARLSON REPRODUCER The following is a description of a speaker enclosure that at one stage was at the centre of attention in the US because of its reputedly favourable characteristics. The reader is
Psychoacoustic Evaluation of Fan Noise
 Psychoacoustic Evaluation of Fan Noise Dr. Marc Schneider Team Leader R&D - Acoustics ebm-papst Mulfingen GmbH & Co.KG Carolin Feldmann, University Siegen Outline Motivation Psychoacoustic Parameters Psychoacoustic
G.R.A.S. Sound & Vibration
 Instruction Manual Single-channel Low-noise Measuring System consisting of: ½-inch Low-noise Level Microphone System Type 40HH and Power Module Type 12HF 40HH 12HF G.R.A.S. Sound & Vibration Skovlytoften
456 SOLID STATE ANALOGUE TAPE + A80 RECORDER MODELS
 456 SOLID STATE ANALOGUE TAPE + A80 RECORDER MODELS 456 STEREO HALF RACK 456 MONO The 456 range in essence is an All Analogue Solid State Tape Recorder the Output of which can be recorded by conventional
BBN ANG 141 Foundations of phonology Phonetics 3: Acoustic phonetics 1
 BBN ANG 141 Foundations of phonology Phonetics 3: Acoustic phonetics 1 Zoltán Kiss Dept. of English Linguistics, ELTE z. kiss (elte/delg) intro phono 3/acoustics 1 / 49 Introduction z. kiss (elte/delg)
VTX V25-II Preset Guide
 VTX V25-II Preset Guide General Information: VTX V25-II Preset Guide Version: 1.1 Distribution Date: 10 / 11 / 2016 Copyright 2016 by Harman International; all rights reserved. JBL Professional 8500 Balboa
Using Extra Loudspeakers and Sound Reinforcement
 1 SX80, Codec Pro A guide to providing a better auditory experience Produced: October 2018 for CE9.5 2 Contents What s in this guide Contents Introduction...3 Codec SX80: Use with Extra Loudspeakers (I)...4
EUROPA I PREAMPLIFIER QUICK START GUIDE Dave Hill Designs version
 EUROPA I PREAMPLIFIER QUICK START GUIDE 2011 Dave Hill Designs version 20110201 This is a start of a manual; it is to provide some information on what to do with the color controls. At 0db gain the maximum
Faithful Sound Uniform Loudness Distribution Reproduction. Source. System
 Faithful Sound Uniform Loudness Distribution Reproduction Lucid ULD III Loudspeakers Althar Audio strives to protect the integrity of sounds. We recognise the delicacy of sound, beginning with its creation
Electrical and Electronic Laboratory Faculty of Engineering Chulalongkorn University. Cathode-Ray Oscilloscope (CRO)
") 2141274 Electrical and Electronic Laboratory Faculty of Engineering Chulalongkorn University Cathode-Ray Oscilloscope (CRO) Objectives You will be able to use an oscilloscope to measure voltage, frequency
2141274 Electrical and Electronic Laboratory Faculty of Engineering Chulalongkorn University Cathode-Ray Oscilloscope (CRO) Objectives You will be able to use an oscilloscope to measure voltage, frequency