Auditory streaming of amplitude modulated sounds in the songbird forebrain
|
|
|
- Shannon Short
- 5 years ago
- Views:
Transcription
1 Articles in PresS. J Neurophysiol (April 8, 2009). doi: /jn Title Auditory streaming of amplitude modulated sounds in the songbird forebrain Authors Naoya Itatani 1 Georg M. Klump 1 Affiliation [1].Animal Physiology and Behaviour Gloup Institute for Biology and Environmental Sciences Carl von Ossietzky University-Oldenburg D Oldenburg, Germany Running head Auditory streaming of amplitude modulated sounds Contact information Naoya Itatani, Carl von Ossietzky Universität Oldenburg Fakultät V, Institut für Biologie und Umweltwissenschaften AG Zoophysiologie und Verhalten Carl von Ossietzky Str. 9-11, Oldenburg, Germany naoya.itatani@uni-oldenburg.de Copyright 2009 by the American Physiological Society.
2 2 ABSTRACT Streaming in auditory scene analysis refers to the perceptual grouping of multiple interleaved sounds having similar characteristics while sounds with different characteristics are segregated. In human perception auditory streaming occurs on the basis of temporal features of sounds such as the rate of amplitude modulation. We present results from multiunit recordings in the auditory forebrain of awake European starlings (Sturnus vulgaris) on the representation of sinusoidally amplitude modulated (SAM) tones to investigate the effect of temporal envelope structure on neural stream segregation. Different types of rate modulation transfer functions in response to SAM tones were observed. The strongest responses were found for modulation frequencies (fmod) below 160 Hz. The streaming stimulus consisted of sequences of alternating SAM tones with the same carrier frequency but differing in fmod (ABA-ABA-ABA- ). A signals had a modulation frequency evoking a large excitation while the fmod of B signals was up to 4 octaves higher. Synchrony of B signal responses to the modulation decreased as fmod increased. Spike rate in response to B signals dropped as fmod increased. Faster signal repetition resulted in fewer spikes suggesting the contribution of forward suppression to the response that may be due to both signals having similar spectral energy and that is not related to the temporal pattern of modulation. These two effects are additive and may provide the basis for a more separated representation of A and B signals by two populations of neurons that can be viewed as a neuronal correlate of segregated streams. KEYWORDS Stream segregation, Forward suppression, Auditory forebrain, SAM tone, Bird.
3 3 INTRODUCTION In nature a number of sound sources may be active simultaneously and it is important for the auditory system to segregate temporally overlapping sounds from different sources and integrate consecutive sounds from each source. This task has been called auditory scene analysis and the consecutive sounds originating from one source have been described as auditory streams (Bregman 1990). The segregation of auditory streams is often referred to as auditory streaming. One of the most common paradigm used in the research on auditory streaming has been proposed by van Noorden (1975) who presented a repeated three-tone sequence which consisted of triplets of low-frequency (A) and high-frequency (B) alternating pure tones and an additional silent interval between each triplet (i.e., ABA-ABA-, A and B denotes the tones and - the silent interval). Depending on the rate at which the tones were presented and on their frequency separation, listeners heard one tone series of both A and B tones with a galloping rhythm or separate tone series of A or B tones each with an isochronous rhythm. The latter percept has been viewed as evidence for auditory streaming (for review, see Moore and Gockel 2002). The ABA- stimulus or related stimuli have been used in a number of psychophysical or physiological studies of auditory streaming of pure tone sequences (e.g., van Nooden 1975, Fishman et al. 2001, Micheyl et al. 2003, Bee and Klump 2004, 2005, Pressnitzer et al. 2008). Beauvois and Meddis (1996) and McCabe and Denham (1997) established a computational model explaining auditory streaming based on peripheral frequency channelling, i.e., that exploited spectral differences of sequential sounds exciting auditory neurons tuned to different pure tone frequencies. According to
4 4 these models, one stream is perceived if the frequencies of both A and B tones are represented in one frequency channel and two streams are perceived when A and B tones each excite a different frequency channel. Auditory filters can be viewed as the psychophysical equivalent of a frequency channel in the models and populations of neurons that are defined by their frequency tuning can be viewed as their neurophysiological correlate. Following the line of argument of the peripheral channelling hypothesis, Fishman et al. (2001) proposed a model to explain streaming in tone series in the monkey auditory cortex on the basis of frequency differences of the tones. This model can also explain puretone streaming in the forebrain of a songbird (Bee and Klump 2004). The tone presentation rate and tone duration also affected perceptual stream segregation which suggests that forward suppression of neuronal activity to A and B tones affect auditory streaming (Fishman et al. 2004, Bee and Klump 2005). Auditory streaming, however, can also be observed for stimuli that do not differ in the frequency range in which they provide excitation (see review by Moore and Gockel 2002). Roberts et al. (2002) demonstrated that stream segregation can be observed between A and B signals that do not differ in their spectral components but only in the phase relationship of those components that result in a different temporal pattern. Stream segregation has also been observed with SAM signals in which the carrier was a broadband noise lacking spectral cues (Grimault et al. 2002). Others have demonstrated psychophysically that stream segregation can occur on the basis of the fundamental (f0) in complex tone stimuli that spectrally overlap (e.g., Singh 1987, Singh and Bregman 1997, Vliegen and Oxenham 1999). A physiological correlate of such auditory streaming by f0 in complex tones was
5 5 reported by Gutschalk et al. (2007) studying the cortical activity of humans in response to harmonic complexes with only unresolved harmonic frequency components by using fmri and MEG. They suggested that processes of forward suppression may also operate with respect to streaming by temporal features of sound. Although streaming by temporal patterns has been well investigated psychophysically, studies focusing on the neuronal correlate of such streaming are limited to fmri and MEG experiments (e.g., Gutschalk et al. 2007) that reflect the gross population response providing indirect evidence as to the mechanisms underlying streaming being based on the global pattern of activation. To elucidate the mechanisms on the cellular level, we studied the responses of cortical neurons in a songbird, the European starling (Sturnus vulgaris) when presented with sinusoidally amplitude modulated (SAM) tones of a constant carrier frequency that differed in the rate of modulation. The choice of the SAM stimuli on the one hand allows to connect to the study by Gutschalk et al. (2007), and on the other hand to build on what is known about modulation coding from observations of single neurons or small clusters of neurons (see review by Joris et al. 2004). Using pure tones, the auditory streaming effect has been demonstrated in starlings in the ABA- paradigm (MacDougall- Shackleton et al. 1998) and a neural correlate of this percept has been observed in starling cortical neurons (Bee and Klump 2004, 2005). With respect to streaming of pure tone stimuli, European starlings show many similarities to humans (Bee and Klump 2004). Therefore, we think that the European starling can also be a suitable model for studying streaming of SAM tones, especially since songbirds are known to use rapid amplitude modulations in their song (see review by Greenewalt 1968). Since neurons in the forebrain
6 6 of the bird are not only tuned to tone frequency but also can show tuning to the rate of amplitude modulation (Hose et al. 1987), it is possible that different populations of neurons represent different auditory streams of SAM tones based on the modulation. Thus, tuned responses to different features of the sounds, i.e., spectral frequency in the case of pure tones and modulation rate in the case of SAM tones may underlie auditory streaming. Here we test whether the neural mechanism underlying streaming of SAM tones is similar to the neuronal mechanism proposed for streaming of pure tones, i.e., whether different populations of neurons, each of which shows the tuning to a specific modulation frequency, integrate or segregate successive SAM tones based on their temporal envelope structure. The contribution of forward suppression on stream segregation of SAM tones is also considered in relation with this mechanism as has been suggested in the imaging studies by Gutschalk et al. (2007).
7 7 METHODS Surgical and recording procedures Three wild-caught, adult starlings (1 male, 2 females) were used in the present study. The care and treatment of the animals were in accordance with the procedures of animal experimentation approved by Niedersaechsisches Landesamt fuer Verbraucherschutz und Lebensmittelsicherheit. All procedures were performed in compliance with the American Physiological Society s Guiding Principles in the Care and Use of Animals. For extracellular recording from the starling forebrain, implantable microdrives with two types of electrodes were prepared: commercially made tungsten microelectrodes (shank diameter 75 μm, Frederick Haer and Co., Bowdoinham, ME) and custom-built Tefloninsulated platinum-iridium wires (wire diameter 25 μm, A-M Systems, Carlsborg, WA). The latter electrodes were sharpened at the tip. The procedure of the sharpening is described in Hofer and Klump (2003). The impedance of electrodes measured in 0.9% NaCl using an isolated differential amplifier (ISO-80, World Precision Instruments Inc., Sarasota, FL) ranged from 4.0 to 7.6 MΩ. An array of 4 electrodes was fixed to a custombuilt small head-mounted microdrive using dental acrylic. The microdrive allowed positioning the electrodes at a depth of up to 5 mm into the forebrain. Prior to surgery 0.04 ml of atropine solution (B.Braun Melsungen AG, Germany) was injected subcutaneously. After 2-3 minutes the animal was anesthetized using 4-5% Isoflurane and the concentration of Isoflurane was subsequently reduced to % for keeping the animal anesthetized during the surgery. The head was fixed using ear bars and the head angle of the animal was adjusted in a stereotaxic apparatus so that the bill of the
8 8 bird inclined about 45º below the horizontal plane. The electrodes were implanted into the field L complex of the right forebrain hemisphere. Recordings were done primarily from neurons in the input layer field L2 which is the homologue of layer IV of the mammalian primary auditory cortex (Jarvis 2005). These neurons can be identified by a primary-like response pattern (Hofer and Klump 2003, Nieder and Klump 1999). Two custom-built reference electrodes were implanted into the left rostral forebrain hemisphere (stainless steel wire, diameter of 50 μm, A-M Systems). Finally, next to the microdrive and reference electrodes a small socket for attaching a radio transmitter was mounted. After a recovery of between 3 and 7 days after the surgery the recordings started after surgical wounds had healed normally. The recording was performed using radio telemetry from the freely behaving birds in a test cage ( cm, L W H) located inside a radio-shielded sound chamber (IAC 402A, Industrial Acoustics, Niederküchten, Germany, equipped with sound absorbing foam to reduce echoes; for details see Bee et al. 2007). For radio transmission, a small FM radio transmitter (FHC type , Frederick Haer and Co.) was used. A dipole antenna was located near the test cage to receive the radio signal. The signals were demodulated by an FM tuner (TX-970, Pioneer), band-pass filtered ( Hz), amplified, converted to 16- bit, 44.1 khz digital signals (Hammerfall DSP Multiface II, RME) and recorded on a Linux workstation for later analysis. Acoustic stimulation
9 9 All stimuli were generated digitally (sampling rate 44.1 khz, 16-bit resolution) and played back by a Hammerfall DSP (Multiface II, RME) using the same Linux workstation that recorded the neural responses synchronized to the playback. The analog sound output was attenuated (Hewlett-Packard 350D, Böblingen, Germany, and TDT PA4, Tucker-Davis Technologies, Alachua, FL) then amplified (Rotel RB-1050, Sussex, UK) and presented through a loudspeaker (Type SP3253, KEF Audio, Maidstone, UK) attached on the ceiling of the chamber approximately 70 cm above the bird in the cage. For defining the characteristic frequency (CF, see below) of each recording site, 200-ms tone pips with 10-ms raised cosine shaped rise and fall were used. Stimulus levels were adjusted to take the frequency response of the speaker into account that was generally flat (±3 db) over the range of frequencies used in this study. First, the CF was estimated audiovisually by presenting a series of pure tones with frequency rising in half octave steps and observing the neural response. Then 20 repetitions of tone pips with frequencies that varied from 1.5 octaves below to 1.5 octaves above the estimated CF in 0.25 octave steps were presented with a silent interval of 800 ms between the tones and the first 10 repetitions showing no artifacts (i.e., typically high potentials resulting from ongoing movement being about 3 times higher than the threshold used to detect spiking activity of the neurons) were analyzed. The level of the stimuli ranged between 0 and 70 db SPL and was increased in 10 db steps. To characterize the modulation tuning, sinusoidally amplitude modulated (SAM) tones with the CF as the carrier frequency were presented with modulation frequencies (fmod) varying in half-octave steps and ranging from 5 Hz to 320 Hz (in a few exceptional cases up to 640
10 10 Hz) to construct a rate modulation transfer function (rmtf). The modulation depth was fixed at 100%. The presentation level was 70 db SPL and the duration was 600 ms (5 ms raised cosine rise/fall) with a silent interval of 800 ms between the AM tones. The long duration of the signal made sure that a large number of modulation cycles were presented. The basic stimulation paradigm for investigating auditory streaming of SAM tones was similar to that of the starling study by Bee and Klump (2004) using pure tones. An ABA signal triplet with a silent period after the third tone was repeatedly presented ( -ABA- ABA- ) and the responses to those repetitions were recorded. The A signals were SAM tones with a CF carrier and a constant modulation frequency (termed reference modulation frequency, RMF) of up to 160 Hz that was chosen as described below. The B signals were SAM tones with a CF carrier that had a higher modulation frequency than A signals. The modulation frequency of B tones varied between 0.5 and 4.0 octaves above RMF in 0.5 octave steps. By increasing the modulation frequency of the B signals rather than decreasing it, we made sure that the neurons were provided with a sufficient number of modulation cycles given that the SAM tone duration was limited to 125 ms. In most cases, this also brought the modulation frequencies to a range for which SAM stimuli may evoke a pitch percept rather than a percept of a fluctuating amplitude allowing a better comparison to the study by Gutschalk et al. (2007) in humans that have used stimuli providing a pitch sensation. The ABA signal triplets were repeated 30 times. The duration of each A or B signal and of the silent interval was 125 ms in the case of a repetition period of 100%. SAM tones were ramped with a 5 ms raised cosine (rise/fall). For stimuli with larger repetition periods of 200% or 400% additional silent intervals were introduced to increase the time
11 11 from the onset of the A signal to the onset of the B signal (and vice versa) to 200% or 400% of the signal duration of 125 ms and adjust the silent interval between the triplets accordingly. Fig. 1 shows an example of the ABA- triplet stimulus and the response at a TRT of 200%. As additional controls triplets of all RMF SAM tones (AAA-), B signals of varying modulation frequency surrounded by unmodulated tones of the carrier frequency of the B Signal (CBC-), and isolated A and B signals (A-A- and -B--) were presented. The presentation level of all stimuli was 70 db SPL. The order of the presentation of all triplet stimuli was randomized. Evaluation of pure tone responses and tuning characteristics A frequency tuning curve was constructed based on the rate responses to the 200-ms pure tones varying in frequency and level. Spike rate was calculated by counting spikes over 10 artifact free responses within a time window incorporating the total length of the tone and considering the response latency. The threshold of the recording site was determined as the minimum stimulus amplitude at which the spike rate at a specific frequency was greater than the spontaneous rate plus 1.8 standard deviations. The tone frequency at which the lowest threshold was found was defined as the CF of the recording site. The bandwidth of the tuning curve was calculated as the frequency difference between the tone frequencies above and below CF which evoked the threshold spike rate at 70 db SPL. Recording sites in field L2 of European starlings commonly show primary-like temporal responses and regions of reduced spike activity compared to the spontaneous activity that are often referred to as suppressive sidebands (Nieder and Klump 1999). These suppressive
12 12 sidebands were determined as regions of the response map at which the spike rate was less than the spontaneous rate minus 1.8 standard deviations. If the response pattern was not primary-like suggesting a recording site outside the field L2, no further measurement was conducted from that recording site. Evaluation of rate modulation transfer functions Spike rates in response to SAM tones with varying fmod were analyzed to construct an rmtf based on the responses to 10 artifact free repetitions of the stimuli. Spike rates were estimated for a latency corrected time window of the duration of the stimulus. First, the maximum spike rate and the corresponding modulation frequency (rbmf) were identified. Then it was checked whether the spike rate for modulation frequencies above or below rbmf dropped to 75% or less of the maximum rate. If the spike rate dropped according to this criterion only for fmod above rbmf, the recording site was classified as low-pass (LP). If the drop according to this criterion occurred only for fmod below rbmf, the recording site was classified as high-pass (HP). If the criterion was met on both sides of rbmf, the recording site was labeled as band-pass (BP). In some recording sites, spike rate recovered after the rate first dropped by more than 25% with increasing fmod. If the recovery was to 12.5% of the maximum rate, these recording sites showing a partial suppression at specific fmods were classified as band-reject (BR). If the rate did not drop by at least 25% of the maximum rate at the different fmods tested, that recording site was classified as all-pass (AP).
13 13 The reference modulation frequency (RMF) for the subsequent presentation of streaming stimuli, that was also the modulation frequency of the A signal, was set as follows. In BP units the fmod evoking the maximum rate was chosen as the RMF. In LP units, RMF was set to the highest fmod which evoked more than 75% of the spike rate compared to the maximum discharge rate observed at rbmf. For BR units, the choice of RMF was similar to that for LP units, i.e., RMF was set to a modulation frequency at which the response started to decline. This fmod generally was below the fmod at which the discharge rate was at a minimum. For recording sites with HP characteristics, a local maximum close to the sloping part of the rate modulation transfer function (in HP the rate first increased with increasing fmod and then varied within the 75% to 100% range relative to the maximum rate) was chosen as the RMF. In AP recording sites, a local maximum up to fmod of 160 Hz was chosen as the RMF. Rate analysis of signal triplet response pattern Rate responses to the first, second and third signals of a triplet summed up over the duration on the ongoing signal (with a correction for the recording site response latency) were compared as follows. Absolute spike rates in spikes/s to each signal in the different types of signal triplets and in the single signal type controls were determined for the different fmod and tone repetition time (TRT) for further analysis. Data from 20 triplet repetitions with artifact free recordings were analyzed. Normalized responses to all stimuli were also calculated by dividing their absolute spike rates by the absolute rate to the isolated A signal (first A of the A-A- control stimulus) at the largest TRT (400%). The
14 14 normalized rates were expressed as a function of the difference between the modulation frequencies of A and B signals in octaves (Δfmod). Forward suppression analysis To observe the effect of mutual forward suppression between successive tones, the differences of the responses to different tones (A or B) in different conditions (isolated or surrounded by other tones) were calculated. The analysis method followed that used by Bee and Klump (2004). We further observed the responses to B signals surrounded by nonmodulated pure tones to investigate the effect of modulation on forward suppression. Differences of the normalized response rates for four conditions were calculated: (1) the difference between responses to B signals in ABA- and responses to isolated B signals in -B--, (2) the difference between responses to B signals in CBC- and responses to isolated B signals in -B--, (3) the difference between responses to B signals in ABA- and responses to B signals in CBC-, and (4) the difference between responses to A signals in ABA- and responses to A signals in A-A-. Temporal analysis of B signal response pattern Spike period histograms in which each period was the reciprocal of the modulation frequency of stimulus were constructed. Vector strength (VS, Goldberg and Brown, 1969) was then calculated to observe the synchrony of the spiking to the envelope modulation. For the investigation of significance of the synchrony, Rayleigh statistics of VS was used.
15 15 Statistical analysis The effects of Δfmod or fmod, TRT, triplet type and response type of recording site on absolute rate, normalized rate and VS were examined using repeated-measures ANOVA (rmanova) using SPSS version 15. Mauchley s sphericity test was used prior to the analysis to inspect whether the sphericity assumption of rmanova is violated. For repeated-measures analyses with more than a single numerator degree-of-freedom (df), we calculated P values using the Greenhouse and Geisser (1959) adjusted df for omnibus tests of within subjects factors that violated the sphericity assumption of rmanova. The unadjusted df values are shown when reporting statistical results. We also computed for each rmanova the partial η 2 as a measure of the effect size for all main effects and interactions. Partial η 2, which can vary from 0 to 1, is the proportion of the combined effect and error variance that is attributable to the effect, and thus represents a non-additive variance-accounted-for measure of effect size. The criterion for statistical significance in all tests in the present study was α = 0.05.
16 16 RESULTS Pure tone frequency tuning In total, data were obtained from 54 recording sites in the auditory forebrain of three European starlings. Fig. 2 shows the relationship between CF and bandwidth at 70 db SPL as defined by the recording sites' pure tone frequency tuning curve and in relation to recording sites' unit type. The CF ranged from 0.4 to 6 khz, and there were no significant differences between the unit types' CF values (Kruskal Wallis H-Test). The 70-dB bandwidth increased with increasing CF; the relation being well described by an exponential regression (bandwidth = 528 e ( CF), R 2 = 0.63). The response patterns elicited by pure tones at the CF of those 54 recording sites were primary-like exhibiting a strong onset response and a subsequent decay of rate. Rate responses to single SAM tones and unit types All recording sites were classified into five types by their rate-response patterns to SAM tones with different modulation frequencies (for the classification criteria, see Methods). AP type units were observed most frequently (15/54), followed by LP (13/54), HP (10/54), BP (8/54) and BR (8/54) types. The modulation frequencies that elicited a strong rate response and that were used as the reference modulation frequencies in the subsequent analysis ranged from 5 to 160 Hz and were mostly below 100 Hz (Table 1, see also Methods for the choice of reference modulation frequency). In a BP type recording site, the reference modulation frequency is equivalent to the rate best modulation frequency, at which the maximum spike rate is evoked. An example of rate modulation transfer function
17 17 (rmtf) from a BP recording site together with the VS as a measure of the temporal response pattern is shown in Fig. 3. Rate responses to SAM tone triplets Responses to SAM tone triplets in each recording site were collected and their spike rates and synchrony were calculated to observe the effect of varying the difference in modulation frequency Δfmod between the A signals and B signals and the TRT. Fig. 4 shows an example of rate responses to ABA- triplets at different Δfmods and TRTs. The rmtf is shown in Fig. 3. Since the unit has BP characteristics the fmod of the A signal (i.e., the RMF) for this recording site was chosen as the fmod corresponding to the peak of its rmtf. Similarly to the general pattern (see below), the example demonstrates a strong response that is phase-locked to the AM of the A signals in the triplets for all TRTs. On the other hand, spike rate in response to B signals and the phase locking to the modulation as expressed by the vector strength decreased as Δfmod increased. This was most prominently observed when TRT was short (100%, see top panel of Fig. 4). When responses to ABAtriplets at different TRTs were compared, the trend of the decrease in spike rates as Δfmod increased was similar, although the amount of decrease at the TRTs of 200% and 400% were not as large compare to that at the shortest TRT. Onset responses to the B signal were observed irrespective of Δfmod but subsequent spike activities decayed more strongly when fmod of B signal became greater. Rate responses for the different unit types are summarized in Fig. 5. Mean normalized rates as a function of Δfmod and TRT together with ±2SE are shown. All rate data were
18 18 normalized to the response elicited by A signals presented alone at the largest TRT. Rate responses to first and second A signals and the interspersed B signal were compared using a rmanova (for detail, see Methods) with sound number (i.e., first, second or third signal in the triplet), Δfmod, TRT and unit type as factors. Significant main effects were observed for sound number, Δfmod and TRT, but not for unit type (see Table 2). The average rate response between all three sounds in the triplet differed (all p < 0.001, T-test). The first A signal in the triplet elicited the highest response, the last A signal in the triplet elicited the second highest response and the B signal elicited the lowest response. The effect of Δfmod is due to the decrease in the B signal response with increasing Δfmod. Since in A signals fmod did not vary and thus the response did not change, the overall effect size remains small. The effect of TRT reflects differential forward suppression that is larger at smaller TRTs (all differences significant with p < 0.001, T-test). Both the B signal and the second A signal in the triplet were suppressed by the preceding signal. Significant two-way interactions were observed between sound number and Δfmod, sound number and TRT, and sound number and unit type. The interaction between sound number and Δfmod can be explained by the fact that the fmod of A signals always is RMF whereas the fmod of B signals changes. The same effect also accounts for the interaction between sound number and unit type since the different unit types respond differently to the varying fmod of the B signal. The interaction between sound number and TRT reflects the differential suppression on the three signals in the triplet. The significant two way interaction between unit type and TRT reflects that the change in the rate response in relation to TRT in BR and HP units differed from that in AP, BP and LP units that all responded similarly to changing TRT. BR
19 19 units showed higher rate responses at the shortest TRT compared to other unit types. HP units showed the largest increase in rate by the change of TRT from 100% to 200%, and as a consequence, HP units showed the largest spike rate at a TRT of 200%. The significant three way interactions are accounted for by the two way interactions shown here. Rate responses to B signals in relation to the type of triplet Now we focus on the rate response to B signals in ABA- triplets and compare these to the responses in two types of controls. In the first control, the first and third signals of the triplet were pure tones instead of SAM tones (triplets termed CBC-), i.e., this control served to demonstrate the effect of amplitude modulation of preceding sound per se on B signal responses. As an additional control, we also observed responses to B-alone stimuli (- B--), in which forward suppression of the first signal in the triplet on the B signal is absent. An example of the responses to the three different triplet types at the shortest TRT (100 % which should evoke the maximum effect of preceding sound on B signal) is shown in Fig. 6. The neurons respond to the C signal with a strong onset response that rapidly adapts whereas the A signal evokes a strong response at each cycle of the modulation. The preceding A signal in ABA- triplets suppressed B signal responses and hence the spike rate of B signal responses in ABA- triplets dropped compared to those observed in B-alone stimuli. Similar responses were observed by CBC- triplets, showing a suppression of spike activity in response to B signals. To describe the general effects of the types of surround signals on the rate responses to non- RMF B signals, we analyzed the normalized (see above) B signal rate responses using a
20 20 rmanova with triplet type, Δfmod, TRT and unit type as factors. Significant main effects of triplet type, Δfmod, TRT and unit type were observed (Table 3). Responses to B signals in the different triplet types were all significantly different (p < 0.02, T-test), although the difference of rate responses between ABA- and CBC- triplets was not as large as that between B-alone signals and the other two triplet types. Responses rates were significantly different when the modulation frequencies for which rates were compared were largely separated. In particular, B signals at a Δfmod of more than 1.0 octave evoked significantly fewer spikes than B signals at a Δfmod of up to 1.0 octave (all p < 0.02, T-test). TRT of 100%, 200% and 400% elicited significantly different average spike rates (all p < 0.001, T- test) which can be related to the different magnitude of forward suppression in each TRT condition as described above. The significant interaction between triplet type and TRT can be accounted for by the fact that in the -B-- condition no signal precedes the B signal and thus suppression at short TRTs cannot occur that is observed for the other two triplet types. The significant interaction between triplet type and unit type and between TRT and unit type may both reflect the differential susceptibility of the various unit types to suppression since in the -B-- condition and for long TRT there is no strong excitation before the presentation of the B signal. The relation between relative rate and TRT was quite similar in AP, LP and BP units but differed in HP and BR units. The significant interaction between Δfmod and unit type is trivial since the unit types were classified based on the shape of the rmtf. The significant interaction between the effects of Δfmod and triplet type reflects changes in the slope of the function relating the relative response rate to Δfmod in the different triplet types.
21 21 Forward masking effects in the rate response Bee and Klump (2004, 2005) studying pure tone streaming concluded that forward masking of the first A signal on the B signal provided a large contribution to the effect. Using the similar line of argument as Bee and Klump (2004), we investigated the forward masking effect in this stimulus paradigm with SAM tones as a function of Δfmod and TRT. We computed the relative forward suppression in various stimulus conditions by calculating the difference between responses to the B signals which were surrounded by other (A or C) signals and the responses elicited by isolated B signals. Four differences were calculated: (1) Difference between B in ABA- versus isolated B in -B--. First, we compared normalized spike rates in response to B signals with surrounding SAM tones (ABA-) to those in the B-alone stimulus (-B--) to inspect the effects of Δfmod and TRT on forward suppression by preceding SAM tones on the B signals in the different unit types. The results are shown on the left column of Fig. 7 displaying the average differences as a function of Δfmod and TRT in the different unit types. The statistical analysis of those differences using a rmanova showed a significant effect of TRT on the difference indicating the largest amount of forward suppression in the shortest TRT condition (all p < 0.04, T-test). There was a significant interaction between TRT and unit type (p < 0.04, rmanova). This reflects that the suppression increases with increasing TRT in the BR type but decreases with increasing TRT in the other types. No significant main effect of Δfmod was observed and none of the other interactions involving Δfmod were significant.
22 22 This indicates that the amount of suppression by preceding A signals on B signals does not differ by the change of the fmod of the B signals itself. (2) Difference between B in CBC- versus isolated B in -B--. The condition in which the SAM tone preceding the B signal was substituted with a pure tone of the same CF as the carrier of the SAM tone reflects the forward suppression resulting from spectral energy in the frequency range of the B signal (i.e., this signal was in the same spectral range but had no amplitude modulation). The average difference for the different unit types is shown in the middle column of Fig. 7. A rmanova showed a significant main effect of TRT on forward suppression (p < 0.001). The shortest TRT condition evoked the largest forward suppression (all p < 0.02, T-test). A significant main effect of Δfmod was also observed (p = 0.01, rmanova). However, the change of forward suppression with increasing Δfmod was not systematic, e.g., forward suppression at Δfmod of 0.5 octaves was significantly different from that at Δfmod of 1.0, 2.0, 3.0 and 4.0 octaves (all p < 0.03, T-test) but not at 1.5, 2.5 and 3.5 octaves. If the eight BR units were excluded from the analysis, the main effect of Δfmod was far from being significant (p = 0.135, rmanova) indicating that these units may have contributed strongly to the non-systematic but significant variation. No significant two-way and three-way interactions were observed in this condition. (3) Difference between B in ABA- versus B in CBC-. Responses to B signals in the two conditions observed above were compared to investigate the influence of the amplitude modulation of the masker tones per se on the magnitude of suppression to B signals. We have demonstrated above (responses to B signals in relation to
23 23 triplet type) that there is a difference. Here we test, whether this difference changes in relation to Δfmod and TRT in different unit types (right column of Fig. 7). The differences in the normalized rate observed in different Δfmod conditions ranged between (Δfmod = 2.5 octaves, standard error = 0.014) and (Δfmod = 2.0 octaves, standard error = 0.014), showing hardly any change of the amount of forward suppression. The statistical analysis using a rmanova showed only a weak but significant (p < 0.02) main effect of TRT on the difference. However, this effect accounted only for a small amount of variance (η 2 = 0.086). No other main effects or interactions were significant. (4) Difference between A in ABA- versus A in A-A-. We also analyzed the masking effects of responses to B signals on the rate responses to preceding and following A signals. The difference values observed across all Δfmods, TRTs and unit types for the first A signal were always close to zero indicating that backward suppression of B signals on the preceding A signals is not an important effect. A rmanova with TRT Δfmod and unit type as the factors did not reveal any significant effects. When the response to the A signal following the B signal in ABA- triplets was compared to that to the second A signal in the A-A- stimulus there was a significant main effect of TRT on the change of the magnitude of forward suppression (p < 0.01, rmanova with TRT, Δfmod and unit type as factors). No other significant main effects or interactions were observed. Temporal responses to ABA- triplets
24 24 Vector strength (VS) was calculated from responses with reference to the period of the modulation to obtain a measure of the temporal representation of the modulated signal. The example shown in Fig. 1 demonstrates a strong phase locking to the modulation in the A signal and the B signal. The phase locking to the modulation of the B signal deteriorated with increasing modulation frequency. Fig. 8 shows the mean VS (±2SE) as a function of Δfmod and TRT observed in the different unit types and for different triplet types. VS of the response to the first and second A signals and the interspersed B signal were compared using a rmanova with sound number (i.e., first, second or third signal in the triplet), Δfmod, TRT and unit type as factors. Significant main effects were observed for sound number, Δfmod, TRT, and for unit type (see Table 4). Post-hoc tests revealed a large significant decrease in VS in the response to the B signals compared to that to the A signals (p < 0.001, T-test). The VS increased significantly (p < 0.02, T-test) from the response to the first A signal to that to the last A signal in the triplet, but this difference was much smaller. The VS of the response decreased with increasing Δfmod; VS for a Δfmod of up to 1.5 octaves was significantly different from the response at larger Δfmod. Post-hoc tests revealed that the VS differed significantly between all TRTs tested (p< 0.001, T-test) being largest at the shortest TRT. Of all unit types AP units had the highest VS that differed significantly from that in all other unit types and LP units had the lowest VS (p< 0.05). LP units had a significantly lower VS (p= 0.03, T-test) than HP units. A number of significant two-factor interactions were observed. The interaction between sound number and Δfmod is trivial since Δfmod was changed in the B signal but not in the A signals. The interaction between sound number and unit type reflects that VS exhibits higher values in AP units
25 25 than in the other unit types. Also the rate of decay of VS with increasing Δfmod varied between unit type which is reflected in the interaction between Δfmod and unit type. The interaction between TRT and unit type reflects that VS deteriorates more in AP and HP units with increasing TRT than in the other unit types. The three way interactions can be deduced from the interactions described so far. Temporal responses to B tones in different types of triplets Temporal responses to (non-rmf) B signals in different triplet types may vary due to the influence of forward suppression by the surrounding signals. To assess this hypothesis, we compared VS calculated from the responses to B signals in different types of triplets in which B signals were either surrounded by RMF tones (ABA-) or pure tones (CBC-). For reference, we also calculated temporal responses to B-alone signals (-B--). VS of the response to the B signal in the various conditions were compared using a rmanova with triplet type, Δfmod, TRT and unit type as factors (see Table 5). The main effects of triplet type, Δfmod and TRT were significant (although the TRT accounted for changes in VS of only 0.02) but the main effect of unit type was not significant. Post-hoc tests revealed that the VS in B-alone stimuli (-B--) was smaller than that in ABA- or CBC- triplets (p < 0.001, T-test, VS in the latter two conditions was not significantly different). VS decreased with increasing TRT (p < 0.01 for all pairwise comparisons, T-test). As is typical for modulation transfer functions, VS decreased with increasing Δfmod. The largest differences were observed in the comparison of Δfmod of up to one octave and higher Δfmod (all p < 0.001, T-test). Significant two way interactions between Δfmod and triplet type (p = 0.001),
26 26 Δfmod and TRT (p = 0.024) and triplet type and TRT (p < 0.001) were also observed. Those interactions may reflect the effect of suppression on VS which can be related to TRT (shorter TRTs may be providing more suppression) and triplet type (no suppression effects in triplet type -B--).
27 27 DISCUSSION In this study we tested the hypothesis whether successive modulated signals that differ in modulation frequency and can be segregated into two streams are represented by separate populations of neurons. This separate representation may be similar to the representation of separate streams in the perception of pure tone sequences by distinct population of neurons (e.g., Fishman et al. 2001, Bee and Klump 2004). Compared to streaming by pure tone frequency, however, streaming by modulation frequency cannot rely on differences in the location of the main peak in the signal spectrum. Using an approach paralleling that of Bee and Klump (2004), we evaluate the effects of modulation rate differences and temporal proximity of signals on the amount of suppression that may lead to separated neural representations being a possible correlate of stream segregation. The area in the starling auditory forebrain from which we recorded in awake birds is the homologue of the mammalian auditory primary cortex thus providing an interesting comparison to the imaging study by Gutschalk et al. (2007) focusing on the human auditory cortex. Modulation tuning properties and the effect of Δfmod To represent streams of sounds that can be segregated by differences in the rate of modulation, it is necessary to have neurons that show tuning to the modulation. Although the multi-unit responses in the current study were obtained from small groups of neurons, the finding that the data provide evidence for modulation tuning suggest that these small groups of neurons do not differ too much in their response properties (as has been found for pure tone tuning characteristics, see Nieder and Klump, 1999). Furthermore, previous
28 28 studies on masking of neuronal responses in the starling forebrain by temporally structured sounds indicate a well developed ability of the multi-unit activity to represent temporal patterns of sounds (Nieder and Klump 2001, Bee et al. 2007). We found different types of functions relating the neurons' rate response to the frequency of sinusoidal amplitude modulation of a tone. Besides recording sites that were responding best to a certain modulation frequency (i.e., show a band pass characteristic), also a large number of recording sites were found that showed low pass or high pass characteristics regarding the modulation. Neurons showing these three types of response pattern in relation the modulation could contribute to a segregated representation of sounds with different modulation frequencies. Also the recording sites with a band reject characteristic have a possibility to represent a certain range of modulation frequencies. Thus, there is a large population of neurons (more than 72% of recording sites) in our study in the primary auditory area of the starling forebrain demonstrating tuning characteristics with regard to the modulation that can form the neural substrate for streaming by temporal envelope cues. Recording sites with all pass characteristics should have a limited possibility to contribute to a separate representation of streams of sounds differing in modulation frequency in the rate response. Tuning of the rate response to the modulation frequency has been reported in the field L complex of a close relative of the starling, the Mynah bird (Hose et al. 1987). In the study by Hose et al (1987) the best rate response to the modulation was below 200 Hz in more than 95% of the neurons. Our own data in the starling for recording sites with BP characteristics also show low best modulation frequencies (between 17 and 80 Hz). This compares well with the range of modulation frequencies to which neurons in the
29 29 mammalian auditory cortex respond (see review by Joris et al. 2004). Since we presented our stimuli with a carrier frequency that corresponded to the recording site's best frequency when stimulated with pure tones, quadratic distortion products, equivalent to the modulation frequency of presented SAM tone, produced by the spectral components due to the modulation (see McAlpine 2004) are not likely to have affected the observed response because the generally have a much lower level than the main spectral components. Cubic distortion product (2f1-f2, 2f2-f1) otoacoustic emissions in the European starling that have been reported by Kettembeil et al. (1995) and show a level of less than about 10 db SPL at any primary tone frequencies between 1.9 and 4 khz when the primary tone level was 70 db SPL. It is unlikely that this level of the cubic distortion products can lead to a sufficient alteration of the temporal signal structure by an interaction between the spectral components of the signal and the distortion products. As can be expected from the large proportion of recording sites showing tuning to the modulation, the difference in modulation frequency (Δfmod) between two successive SAM tones has a significant effect on the spike rate, although in some cases that modulation tuning found for the 125 ms signals used in the triplets was not as good as that observed with the 600 ms signals used to characterize the tuning. This may be due to presenting fewer cycles of modulation. The difference in the response to the A signals and to the B signal in the ABA- triplet is reflected in the significant interaction between signal position in the triplet and the modulation frequency difference Δfmod. The interaction between signal position and the pattern of change of the rate response with increasing Δfmod varies between different types of recording sites as is indicated by a significant three-way
30 30 interaction between sound number, Δfmod and unit type. While LP or BP recording sites (classified on the basis of the MTF) showed a monotonic decrease in the response to an increasing fmod of the B signals, the rate in response to these signals in HP sites usually first increased with increasing fmod as predicted by the MTF. A similar monotonic increase of spike rate with increasing fmod (i.e. a HP characteristic) was commonly observed from recording sites in the primary auditory cortex of the awake squirrel monkey (Bieser and Müller-Preuss, 1996), awake marmoset (non-bp; Liang et al. 2002) and cat (Eggermont, 1993) as well as other neuronal types such as BP and LP (for a review, see Joris et al. 2004). The similarity of the response pattern in the MTF and in response to the varying modulation frequency of B signals in ABA triplets suggests that the characteristics of modulation tuning in some of the unit types (e.g. LP, BP) may determine the segregation of successive SAM tones in auditory streaming. By changing the rate of modulation, we not only changed the temporal structure of the envelope, but at the same time changed the bandwidth of the signal that increased with larger modulation frequencies. The range of reference modulation frequencies applied in the current study was generally below 160 Hz, i.e. strongly overlapped with the range of tuned responses observed in the previous studies described above (e.g., Hose et al. 1987). Given the low reference modulation frequencies, the side bands created by the amplitude modulation up to two octaves above the reference modulation frequency were generally within the range of frequencies providing excitation (49 out of 54 recording sites; only five recording sites deviated from the rule, see Fig. 9). Up to four octaves above the reference modulation frequency, the percentage of units in which the sidebands created by the
31 31 modulation lay outside the limit of the excitatory tuning curve was increased (between 25 and 69 % of the different unit types, see Fig. 9). Thus, at modulation frequencies that were more than two octaves above the RMF the drop of spike rates in response to SAM tones may be due to the sidebands created by the modulation falling into suppression areas that were commonly observed in pure tone frequency tuning curve in the tested forebrain area. The contribution of suppressive sidebands of the frequency tuning curve on the drop of the spike rate may be important especially if the RMF of the recording site is high and/or Δfmod is large. In such a condition the effect of the suppression by the sidebands is not clearly distinguishable from the rate drop that is due to the modulation tuning based on temporal cues. Even if the sidebands created by the modulation were found to lie within the limits of the excitatory tuning curve, it is possible that the decrease of spike rates in response to SAM tones with increasing modulation frequency occurred due to the modulation. Sideband frequencies that are more remote from the carrier frequency may elicit a weaker response than sidebands being close to the carrier frequency. This, however, cannot explain all patterns of spike responses such as HP or AP recording sites, showing no decrease of spike rate with increasing the modulation frequency up to a rate of 320 Hz. In a previous psychophysical study, Grimault et al. (2002) used SAM noise to investigate if sounds without spectral cues that only differ in their modulation frequencies could elicit stream segregation. They found that the separation of AM frequencies of more than about 1.0 octave could segregate successive sounds paralleling our finding of significant differences in the response to stimuli with a modulation frequency that differs from the
32 32 reference modulation frequency by more than one octave. Using stimuli that were similar to those presented to the starlings (ABA- series, 125 ms tone duration, 100% TRT and carrier frequency of 1 khz or 4 khz), Dolležal and Klump (2009 and unpublished data) observed that SAM tones like those presented here could evoke stream segregation in the perception of human subjects. In these experiments, human segregated successive SAM tones with a separation of fmod by more than 1.5 octaves into two streams which is a difference that also appears to be effective in starling forebrain neurons. Other studies have suggested the contribution of fundamental frequency of harmonic complex sounds on stream segregation for spectrally unresolved harmonics which also points to a role of temporal processing in stream segregation (Vliegen and Oxenham, 1999, Gutschalk et al., 2007). Those psychophysical studies are consistent with our current investigations, showing modulation frequency-dependent spike responses to SAM tones with different modulation frequency. The effect of forward suppression Forward suppression has been assigned a significant role for the stream segregation of successive sounds. The present study compared the rate responses to B signals in different stimulus sequences (ABA-, CBC- and -B--) and showed that the stimulation history (SAM tones, pure tones or silence) significantly affected the spike rate responses to B signals. The observation that the -B-- sequence evoked a significantly larger number of spikes in response to the B signal compared to that in the other two stimulus sequences strongly indicates forward suppression. The result that the change of tone repetition time (TRT) in the present study had a significant effect, as observed in the responses to pure tone ABA
33 33 triplets (Bee and Klump, 2004), also indicates forward suppression. This effect was observed from all unit types. The finding of the present study that there was a significant monotonic increase of rate for all TRTs of up to the maximum of 400% was in agreement with the responses to pure tones showing a significant increase of spiking activity with increasing TRT up to 800%. The parallels in the effects of TRT indicate that forward suppression is effective both in the processing of pure tone sequences and SAM tone sequences. In contrast to the results from Bee and Klump (2004) who observed that the difference between the response to the first and last A tone in the triplet was almost zero when the TRT was longer than 200%, we still observed a relatively large rate difference between the first and second A signal responses in ABA- triplets at the longest TRT and a general reduction in the A signal responses at TRTs of 100 and 200 %. This might indicate that also long duration suppression is effective in the current paradigm involving SAM signals in which always signal energy was presented at the neurons' CF. A similar long lasting suppression between successive SAM tones extending over a few hundred ms was also observed in the study Bartlett and Wang (2005) in the primate auditory cortex. Forward suppression (as indicated by Difference 1) was independent from the modulation frequency of B signals, which is in contrast with the previous study of streaming in the starling forebrain using pure tone stream sequences by Bee and Klump (2004). Bee and Klump found that the amount of forward suppression decreased with increasing frequency difference between A and B tones whereas it was independent of Δfmod in the present study. Bartlett and Wang (2005) who also observed the response of one SAM tone to the following SAM tone in the auditory cortex of awake marmosets found a significant
34 34 masking effect by either SAM tone or noise with modulation frequencies which were dissimilar to those of a following SAM tone/noise by up to 4 octaves or more. This was in agreement with our study. However, they also found a correlation (r=0.44, p<0.001) between the weighted average of the modulation frequencies of the first tone providing suppression and the modulation frequency of the second tone that was suppressed indicating that a similarity in the modulation frequency promoted suppression. However, we observed that an unmodulated first C signal in the triplet could even provide slightly more suppression on the subsequent modulated signal than a modulated first A signal indicating that similarity in modulation frequency was not that important for the amount of suppression. Our results that show significant main effects of Δfmod and TRT but no significant interaction on the rate response indicate that the effects of suppression being mainly mediated by spectral energy in the frequency band occupied by the preceding stimulus and the drop in activity that is related to the modulation tuning are acting in an additive fashion. Since we only increased fmod of the B sound, we cannot evaluate whether the additive effect also occurs at lowered modulation frequencies. Tuned AM selective forward masking was observed in human psychophysics. Wojtczak and Viemeister (2005) using an SAM noise carrier that was modulated for two consecutive time periods found that modulation perception during the second period was compromised maximally if the first and second periods were close in modulation frequency. This is in contrast to our finding, which showed that the magnitude of forward suppression was nonsensitive to modulation frequency of B signals. One of the reasons of the discrepancy may lie in the different experimental paradigm. Wojtczak et al. (2007), however, who used the
35 35 same paradigm as Wojtczak and Viemeister (2005) in the study of IC neurons in the awake rabbit did not find a correlate of the psychophysical result in the IC neurons response pattern. This is similar to our results that indicate that the response to an AM signal is not negatively affected by the modulation of the preceding signal. We even observed slightly higher forward suppression by non-am maskers (CBC-) on the rate response to the B signal than by SAM tone maskers (ABA-). Gutschalk et al (2007) suggested a contribution of modulation-based forward suppression on stream segregation from the investigation of human cortical activity using fmri and MEG. However, they observed increased cortical activity if the Δfmod of two successive amplitude modulated sounds was increased whereas we observed a decrease in the response. This difference between the data obtained with the various methods can be explained by the fact that the MEG and fmri study by Gutschalk et al. (2007) records the responses to both populations of neurons responding to A and B signals whereas we look at the population of neurons that is mostly tuned to A signal responses. Temporal representation of streaming sounds If stream segregation is based on differences in the temporal patterning of the response rather than differences in the overall rate, the neurons' ability to reflect the pattern of modulation is important. This ability can be described by the vector strength in the response to the period of the modulation of SAM tones that was inspected in the present study. Different unit types showed different amounts of synchrony to the modulation period of the signals in ABA triplets and vector strength in AP recording sites was significantly higher
36 36 than that in other types of recording sites. In general, vector strength significantly decreased with increasing Δfmod which indicates a limited ability to synchronize to the modulation at high modulation rates. There was no significant interaction between Δfmod and unit type indicating similar patterns of decay with increasing Δfmod in all unit types. When VS values from B tone responses at Δfmod of more than one octave were calculated, hardly any synchrony of the response with the modulation was observed. Since most RMFs in the present study were below 100 Hz this indicates that the representation of temporal patterns is limited to envelope frequencies of below 200 Hz. This limit is in agreement with the results from other studies in birds (Hose et al. 1987, Knipschild et al. 1992) and mammals (e.g., Nelson and Carney 2007, Gaese and Ostwald, 1995, Bieser and Müller-Preuss, 1996, Liang et al., 2002, for a review see Joris et al. 2004). In addition, we observed that the shortest TRT elicited significantly larger VS in the response to B signals in ABA- triplets compared to that at longer TRTs. This may indicate that the reduction of spiking activity due to forward suppression results in a more accurate temporal representation of the modulation. Similarly, VS in response to B signals in ABA- and CBC- was significantly larger than VS in response to -B-- stimuli further indicating that suppression may enhance the temporal representation of modulation frequency. If the temporal representation is enhanced, this may lead to a better segregation of streams since the temporal patterns are better separable. Using SAM noise, Grimault et al. (2002) reported that the increase in modulation depth of sounds results in increased stream segregation in human psychophysics which is consistent with the hypothesis that a better temporal representation helps segregating sounds from different sources. In summary, although a transformation
37 37 from a temporal to a rate representation of the modulation occurs at the level of central auditory system (e.g., Schreiner and Langner, 1988, Schulze and Langner 1997, review by Joris et al. 2004), we cannot exclude that the temporal representation of the modulation by the neurons may be exploited for stream segregation. Peripheral channeling versus modulation tuning For stream segregation of pure tones differing in frequency the peripheral channeling hypothesis has suggested that the degree of overlap in excitation patterns at the level of the cochlea is an important factor for stream segregation (Hartmann and Johnson, 1991, Moore and Gockel, 2002). A neural correlate of stream segregation of tone series can already be observed in neurons of the cochlear nucleus (Pressnitzer et al. 2008). The tonotopically organized peripheral channels are conserved up to the cortical level, but other types of channels representing different features of the sounds (e.g., envelope modulation) are created within the auditory pathway (e.g., Miller et al. 2001, Joris et al. 2004). The tonotopic organization implicates that also in the central auditory system streaming on the basis of segregation by spectral frequency can be observed (e.g., Fishman et al. 2001, Bee and Klump 2004). Beauvois and Meddis (1996) and McCabe and Denham (1997) established computational models to explain the relationship between the excitation patterns evoked in the cochlea by alternating tones and the perception of segregated streams. Other studies, however, have shown that stream segregation occurs even if two successive complex sounds produce excitation patterns that are identical or very similar (Vliegen and Oxenham 1999, Cusack and Roberst 1999, Houtsma and Smurzynski 1990, Moore and
38 38 Gockel, 2002, Grimault et al., 2002, Gutschalk et al. 2007, Dolležal and Klump 2009). These observations indicate that the temporal structure of sounds may also result in stream segregation if no substantial difference in the representation of the sounds in peripheral frequency channels is provided. Also the results of the present study cannot easily be explained by the peripheral channeling hypothesis. At least for modulation frequencies differing by less than two octaves, the response to the SAM tones that had the same carrier frequency in the triplet differed although all frequency components of the SAM tones in the triplet fell within the limits of the excitatory tuning curve. The peak of the excitation patterns in the cochlea resulting from A and B signals in the triplet having the same carrier frequency is not different and can be found in the same peripheral channel for both SAM tones that are segregated. At higher levels of the auditory system modulation filters are found that could support the segregation of the SAM tones. Modulation tuning at the central auditory system results in a map that is independent from the tonotopic representation (e.g., see Hose et al. 1987, Langner 1992, Joris et al., 2004). This independent map could lead to a segregated representation of streams differentiated by other features than spectral patterns of excitation. Our observation in the starling forebrain suggests that such a segregated representation of SAM sounds may provide the basis for auditory streaming by temporal modulation patterns. This is a possible mechanism for the implementation of stream segregation which is analogous to the pure tone stream segregation mechanism (Bee and Klump 2004), suggesting that modulation tuning in general will support the segregation.
39 39 Moore and Gockel (2002) pointed out that any difference in the salience of sequential sounds could possibly result in stream segregation. Thus multiple cues are effective and the question is how they interact. Cusack and Roberts (1999) used two-tone stimuli that offered different spectral and temporal cues simultaneously. They found that neither the intermodulation rate of the two-tone stimulus nor the spectral overlap would predict the perception of stream segregation, but both absolute and relative bandwidths of the stimulus were important. Also in the present study the bandwidth of the stimulus was changed and the results from the starling forebrain could be both explained in terms of differentiation by modulation rate and differentiation by bandwidths. Cusack and Roberts (1999) argued that the negative result regarding the modulation rate might be due to the low pitch strength of their two-tone stimulus. Physiological studies suggest that pitch strength is related to the time locking of action potentials to the temporal waveform of the modulated stimulus (e.g. Cariani and Delgutte 1996) and a well time locked response can be evoked by SAM stimuli in the auditory system. Thus, it seems possible that streaming of SAM stimuli can be based on the temporal waveform of the stimulus although spectral processing of the width of the spectral pattern of excitation that varies with the SAM frequency cannot be excluded. Concluding remarks The response pattern observed here in neurons of the avian forebrain area Field L can be interpreted as a correlate of the processes occurring during auditory stream segregation by amplitude modulation that can be observed in an ABA- paradigm. With an increasing difference in modulation frequency between the A and B signal, neurons responding with a
40 40 high rate to the modulation frequency of A signals will reduce their response to the B signals differing in modulation frequency. Added to this reduction is a forward suppression from A signals on B signals that appears to be related to having spectral energy in a similar frequency range in both signals. The reduction of the response of B signals relative to that of A signals being due to both processes adds up and may result in a more separated representation of A and B signals by two populations of neurons each responding preferentially to one of the two signal types. This mechanism is consistent with the hypothesis proposed on the basis of fmri and MEG data by Gutschalk et al. (2007) that auditory streaming by temporal patterns of stimuli evoking a pitch sensation is related to reciprocal feature-specific suppression between the two signal types.
41 41 REFERENCES Bartlett EL, Wang X. Long-lasting modulation by stimulus context in primate auditory cortex. J Neurophysiol 94: , Beauvois MW, Meddis R. Computer simulation of auditory stream segregation in alternating-tone sequences. J Acoust Soc Am 99: , Bee MA, Buschermöhle M, Klump GM. Detecting modulated signals in modulated noise: (II) neural thresholds in the songbird forebrain. Eur J Neurosci 26: , Bee MA, Klump GM. Primitive auditory stream segregation: a neurophysiological study in the songbird forebrain. J Neurophysiol 92: , Bee MA, Klump GM. Auditory stream segregation in the songbird forebrain: effects of time intervals on responses to interleaved tone sequences. Brain Behav Evol 66: , Bee MA, Buschermöhle M, Klump GM. Detecting modulated signals in modulated noise: (II) neural thresholds in the songbird forebrain. Eur J Neurosci 26: , Bendor D, Wang X. The neuronal representation of pitch in primate auditory cortex. Nature 436: , Bieser A, Müller-Preuss P. Auditory responsive cortex in the squirrel monkey: neural responses to amplitude-modulated sounds. Exp Brain Res 108: , Bregman AS. Auditory Schene Analysis: Ther Perceptual Organization of Sound. MIT, Cambridge, MA Cariani, Delgutte. Neural correlates of the pitch of complex tones. I. Pitch and Pitch salience. J Neurophysiol 76: , 1996.
42 42 Cusack R, Roberts B. Effects of similarity in bandwidth on the auditory sequential streaming of two-tone complexes. Perception 28: , Dolležal LV, Klump GM. Auditory streaming in the perception of sinusoidally amplitudemodulated signals. Abstr. Assoc. Res. Otolaryngol, 32nd Midwinter Meeting, Baltimore, MD, Duifhuis H. Consequences of peripheral frequency selectivity for nonsimultaneous masking. J Acoust Soc Am 54: , Eggermont JJ. Differential effects of age on click-rate and amplitude modulationfrequency coding in primary auditory cortex of the cat. Hear Res 65: , Fishman YI, Arezzo JC, Steinschneider M. Auditory stream segregation in monkey auditory cortex: effects of frequency separation, presentation rate, and tone duration. J Acoust Soc Am 116: , Fishman YI, Reser DH, Arezzo JC, Steinschneider M. Neural correlates of auditory stream segregation in primary auditory cortex of the awake monkey. Hear Res 151: , Gaese BH, Ostwald J. Temporal coding of amplitude and frequency modulation in the rat auditory cortex. Eur J Neurosci 7: , Goldberg JM, Brown PB. Response of binaural neurons of dog superior olivary complex to dichotic tonal stimuli: some physiological mechanisms of sound localization. J Neurophysiol 32: , Greenewalt CM. Bird song: acoustics and physiology. Washington DC, Smithsonian Institution Press, 1968.
43 43 Greenhouse SW, Geisser S. On methods in the analysis of profile data. Psychometrika 24: , Grimault N, Bacon SP, Micheyl C. Auditory stream segregation on the basis of amplitude-modulation rate. J Acoust Soc Am 111: , Gutschalk A, Oxenham AJ, Micheyl C, Wilson EC, Melcher JR. Human cortical activity during streaming without spectral cues suggests a general neural substrate for auditory stream segregation. J Neurosci 27: , Hartmann WM, Johnson D. Stream segregation and peripheral channeling. Music Perception 9: , Hofer SB, Klump GM. Within- and across-channel processing in auditory masking: a physiological study in the songbird forebrain. J Neurosci 23: , Hose B, Langner G, Scheich H. Topographic representation of periodicities in the forebrain of the mynah bird: one map for pitch and rhythm? Brain Res 422: , Houtsma AJM, Smurzynski J. Pitch identification and discrimination for complex tones with many harmonics. J Acoust Soc Am 87: , Jarvis ED for The Avian Brain Nomenclature Consortium. Avian brains and a new understanding of vertebrate brain evolution. Nature Neuroscience 6: Joris PX, Schreiner CE, Rees A. Neural processing of amplitude-modulated sounds. Physiol Rev 84: , Kettembeil S, Manley GA, Siegl E. Distortion-product otoacoustic emissions and their anaesthesia sensitivity in the European starling and the chicken. Hear Res 86: 47-62, 1995.
44 44 Knipschild M, Dörrscheidt GJ, Rübsamen R. Setting complex tasks to single units in the avian auditory forebrain. I: Processing of complex artificial stimuli. Hear Res 57: , Langner G. Periodicity coding in the auditory system. Hear Res 60: , Liang L, Lu T, Wang X. Neural representations of sinusoidal amplitude and frequency modulations in the primary auditory cortex of awake primates. J Neurophysiol 87: , MacDougall-Shackleton SA, Hulse SH, Gentner TQ, White W. Auditory scene analysis by European starlings (Sturnus vulgaris): perceptual segregation of tone sequences. J Acoust Soc Am 103: , McAlpine D. Neural sensitivity to periodicity in the inferior colliculus: evidence for the role of cochlear distortions. J Neurophysiol 92: , McCabe SL, Denham MJ. A model of auditory streaming. J Acoust Soc Am 101: , Micheyl C, Carlyon RP, Shtyrov Y, Hauk O, Dodson T, Pullvermüller F. The neurophysiological basis of the auditory continuity illusion: a mismatch negativity study. J Cogn Neurosci 15: , Miller LM, Escabí MA, Read HL, Schreiner CE. Functional convergence of response properties in the auditory thalamocortical system. Neuron 32: , Moore BC, Gockel H. Factors influencing stream segregation. Acta Acustica 3: , 2002.
45 45 Nelson PC, Carney LH. Neural rate and timing cues for detection and discrimination of amplitude-modulated tones in the awake rabbit inferior colliculus. J Neurophysiol 97: , Nieder A, Klump GM. Adjustable frequency selectivity of auditory forebrain neurons recorded in a freely moving songbird via radiotelemetry. Hear Res 124: , Nieder A, Klump GM. Signal detection in amplitude-modulated maskers. II. Processing in the songbird's auditory forebrain. Eur J Neurosci 13: , Pressnitzer D, Sayles M, Micheyl C, Winter IM. Perceptual organization of sound begins in the auditory periphery. Curr Biol 18: , Roberts B, Glasberg BR, Moore BC. Primitive stream segregation of tone sequences without differences in fundamental frequency or passband. J Acoust Soc Am 112: , Schulze H, Langner G. Periodicity coding in the primary auditory cortex of the Mongolian gerbil (Meriones unguiculatus): two different coding strategies for pitch and rhythm? J Comp Physiol [A] 181: , Schreiner CE, Langner G. Periodicity coding in the inferior colliculus of the cat. II. Topographical organization. J Neurophysiol 60: , Singh PG, Bregman AS. The influence of different timbre attributes on the perceptual segregation of complex-tone sequences. J Acoust Soc Am 102: , Singh PG. Perceptual organization of complex-tone sequences: a tradeoff between pitch and timbre? J Acoust Soc Am 82: , 1987.
46 46 van Noorden LPAS. Temporal coherence in the perception of tone sequences. Ph.D. dissertation, Eindhoven, The Netherlands: Eindhoven University of Technology, Vliegen J, Oxenham AJ. Sequential stream segregation in the absence of spectral cues. J Acoust Soc Am 105: , Wojtczak M, Nelson PC, Carney LH, Viemeister NF. Forward masking in the amplitude modulation domain: further psychophysical observations and potential physiological correlates. Abstr. Assoc. Res. Otolaryngol, 30th Midwinter Meeting, Denver, CO, Wojtczak M, Viemeister NF. Forward masking of amplitude modulation: basic characteristics. J Acoust Soc Am 118: , 2005.
47 47 ACKNOWLEDGEMENTS We thank the anonymous reviewers for giving as useful comments on the earlier versions of the manuscript. We also thank Holger Dierker for his help for establishing the experimental setup and for data analysis. GRANT This research was supported by the Deutsche Forschungsgemeinschaft (SFB/TRR 31). DISCLOSURES The authors declare to have no conflict of interest with respect to the work presented here.
48 48 FIGURE LEGENDS Fig. 1. Example of peri-stimulus time histogram (bottom panel) in response to ABAtriplets at tone repetition time (TRT) of 200%, with the spike onset latency adjusted. The PSTH summarizes data from 20 triplet repetitions (bin width 1 ms). The waveform of the stimulus is shown on the top panel. The duration of each signal is 125 ms and the modulation frequency of the first and third signal is set to the reference modulation frequency (RMF). In this example, the modulation frequency of the second signal was 1 octave above RMF. Fig. 2. Relationships between the recording site s CF and its bandwidth at 70 db SPL. Each dot represents an individual recording site. The symbols indicate the different unit types. Fig. 3. An example of a rate-modulation transfer function (rmtf, solid line) and vector strength (VS, dotted line) observed from a recording site determined as band-pass (BP) type. The reference modulation frequency (RMF) indicated as the dotted line is used as the modulation frequency of the first and third signal of ABA- triplets in the subsequent measurements. Fig. 4. Peri-stimulus time histograms as a function of time and Δfmod in response to an ABA- stimulus (data summed over 20 triplet repetitions). Different tone repetition times are represented in the different panels (top:100%, middle:200%, bottom:400%). The response was recorded from the same site as that shown in Fig. 3. Each tone in the triplet was 125 ms
49 49 with a varying inter-tone silence period depending on the TRT. Shades of gray represent number of spikes summed over 20 repetitions of the stimulus in 1-ms time bins. Fig. 5. Normalized rate responses to ABA- stimulus sequences from five different types of recording sites in relation to Δfmod and TRT. Left, middle and right columns for each unit type show responses to the first, second and third tones of triplet, respectively. Symbols (* = TRT 100%, = TRT 200%, Δ = TRT 400%) represent the mean normalized responses (±2 SE) averaged over 20 artifact-free responses. Responses to an AAA- stimulus are also shown in the ABA- response panels depicted as the responses to ABA- stimulus sequence with Δfmod of 0. Fig. 6. Peri-stimulus time histograms (data summed over 20 triplet repetitions) as a function of time and Δfmod in response to -B--, CBC- and ABA- stimulus sequences at a TRT of 100% are presented in different panels (top: -B-- responses, middle: CBC- responses, bottom: ABA- responses). The response was recorded from the same site as that shown in Fig. 3 and Fig. 4. Shades of gray represent number of spikes summed over 20 repetitions of the stimulus in 1-ms time bins. Fig. 7. Relative forward masking effect in relation to stimulus type, Δfmod and TRT described by the difference in the response of the middle B sound when surrounded by other sounds (i.e., in ABA- or CBC- triplets) and when presented in isolation (i.e., -B--). Responses from different unit types are shown in each row. The first and second columns
50 50 show the effects of modulated and unmodulated sounds on the B sound, respectively (* = TRT 100%, = TRT 200%, Δ = TRT 400%). The third column depicts the difference in the B-response that is due to the modulation of the first and third sounds in the triplets (i.e., the difference in the B-response in ABA- stimulus sequences versus CBC- stimulus sequences). Fig. 8. Synchrony of the response to the modulation period measured as the vector strength (VS) for ABA- stimulus sequences in relation to Δfmod and TRT. Each row represents the data from a specific unit type. Left, middle and right columns for each unit type show responses to the first, second and third tones of triplet, respectively. Symbols (* = TRT 100%, = TRT 200%, Δ = TRT 400%) represent the mean responses (±2 SE) averaged over 20 artifact-free responses. Responses to an AAA- stimulus are also shown in the ABA- response panels depicted as the responses to ABA- stimulus sequence with Δfmod of 0. Fig. 9. The range of modulation frequencies of SAM tones applied to each recording site in relation to its pure tone tuning characteristics. Recording sites are sorted by unit type and the reference modulation frequency (RMF) is represented as a filled square. Lines depict the range of modulation frequencies of the SAM tone stimuli (between 0 and 4 octaves above RMF) with the modulation frequency of 2 octaves above RMF shown as a central dot. Crosses indicate the modulation frequency at which the sidebands that are due to the modulation pass the upper frequency limit of the recording site's excitatory response curve
51 51 at 70 db SPL. If the modulation frequency of the SAM tone stimulus exceeds this limit, the sideband frequency components of the stimulus will be located outside the frequency range providing excitation. Sideband frequency components outside this range may provide suppression.
52 52 TABLE 1. Distribution of reference modulation frequency (RMF) of recording sites in Hz applied in the present study and chosen on the basis of the rate response. < * * In two recording sites a RMF of 120 Hz was used, others were 140 Hz and 160 Hz
53 53 TABLE 2. Results of rmanova comparing the effects of triplet position (Sound-num), modulation frequency separation (Δfmod), tone repetition time (TRT) and unit types (Unittype) on the normalized rate responses to the A and B signals in the ABA- stimulus. Bold numbers highlight the significant effects. Effect df F P η 2 Sound-num 2, < Δfmod 8, TRT 2, < Unit-type 4, Sound-num Δfmod 16, < Sound-num TRT 4, < Sound-num Unit-type 8, Δfmod TRT 16, Δfmod Unit-type 32, TRT Unit-type 8, Sound-num Δfmod TRT 32, Sound-num Δfmod Unit-type 64, Sound-num TRT Unit-type 16, Δfmod TRT Unit-type 64, Sound-num Δfmod TRT Unit-type 128,
54 54 TABLE 3. Results of rmanova comparing the effects of triplet type (Triplet-type), modulation frequency separation (Δfmod), tone repetition time (TRT) and unit types (Unittype) on the normalized rate responses to the B signals in the -B--, CBC- and ABA- stimuli. Bold numbers highlight the significant effects. Effect df F P η 2 Triplet-type 2, < Δfmod 7, < TRT 2, < Unit-type 4, Triplet-type Δfmod 14, Triplet-type TRT 4, < Triplet-type Unit-type 8, Δfmod TRT 14,686 0, Δfmod Unit-type 28, TRT Unit-type 8, Triplet-type Δfmod TRT 28, Triplet-type Δfmod Unit-type 56, Triplet-type TRT Unit-type 16, Δfmod TRT Unit-type 56, Triplet-type Δfmod TRT Unit-type 112,
55 55 TABLE 4. Results of rmanova comparing the effects of triplet position (Sound-num), modulation frequency separation (Δfmod), tone repetition time (TRT) and unit types (Unittype) on the VS to the A and B signals in the ABA- triplets. Bold numbers highlight the significant effects. Effect df F P η 2 Sound-num 2, < Δfmod 8, < TRT 2, < Unit-type 4, < Sound-num Δfmod 16, < Sound-num TRT 4, Sound-num Unit-type 8, < Δfmod TRT 16, Δfmod Unit-type 32, TRT Uni-type 8, Sound-num Δfmod TRT 32, Sound-num Δfmod Unit-type 64, < Sound-num TRT Unit-type 16, Δfmod TRT Unit-type 64, Sound-num Δfmod TRT Unit-type 128,
56 56 TABLE 5. Results of rmanova comparing the effects of triplet type (Triplet-type), modulation frequency separation (Δfmod), tone repetition time (TRT) and unit types (Unittype) on the VS to the B signals in the -B--, CBC- and ABA- stimuli. Bold numbers highlight the significant effects. Effect df F P η 2 Triplet-type 2, < Δfmod 7, < TRT 2, < Unit-type 4, Triplet-type Δfmod 14, Triplet-type TRT 4, < Triplet-type Unit-type 8, Δfmod TRT 14, Δfmod Unit-type 28, TRT Unit-type 8, Triplet-type Δfmod TRT 28, Triplet-type Δfmod Unit-type 56, Triplet-type TRT Unit-type 16, Δfmod TRT Unit-type 56, Triplet-type Δfmod TRT Unit-type 112,
57
58
59
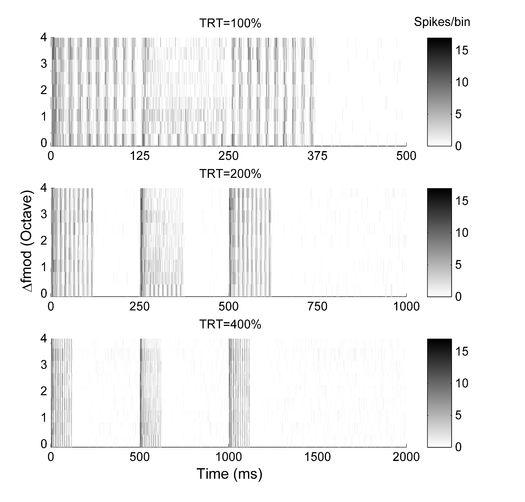
60
61
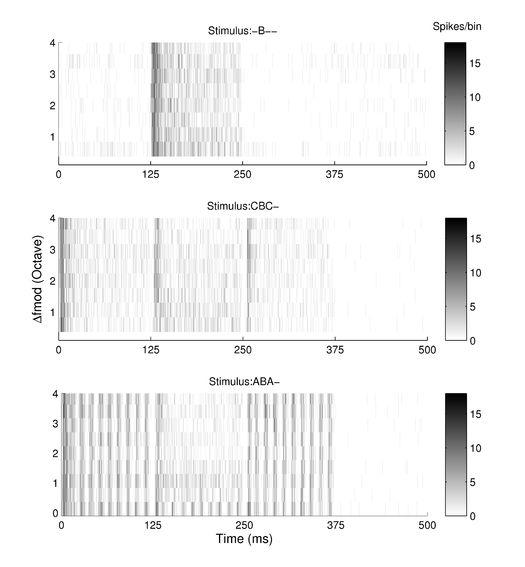
62
Auditory Streaming of Amplitude-Modulated Sounds in the Songbird Forebrain
 J Neurophysiol 101: 3212 3225, 2009. First published April 8, 2009; doi:10.1152/jn.91333.2008. Auditory Streaming of Amplitude-Modulated Sounds in the Songbird Forebrain Naoya Itatani and Georg M. Klump
Neural Correlates of Auditory Streaming of Harmonic Complex Sounds With Different Phase Relations in the Songbird Forebrain
 J Neurophysiol 105: 188 199, 2011. First published November 10, 2010; doi:10.1152/jn.00496.2010. Neural Correlates of Auditory Streaming of Harmonic Complex Sounds With Different Phase Relations in the
DAT335 Music Perception and Cognition Cogswell Polytechnical College Spring Week 6 Class Notes
 DAT335 Music Perception and Cognition Cogswell Polytechnical College Spring 2009 Week 6 Class Notes Pitch Perception Introduction Pitch may be described as that attribute of auditory sensation in terms
Pitch Perception and Grouping. HST.723 Neural Coding and Perception of Sound
 Pitch Perception and Grouping HST.723 Neural Coding and Perception of Sound Pitch Perception. I. Pure Tones The pitch of a pure tone is strongly related to the tone s frequency, although there are small
Pitch. The perceptual correlate of frequency: the perceptual dimension along which sounds can be ordered from low to high.
 Pitch The perceptual correlate of frequency: the perceptual dimension along which sounds can be ordered from low to high. 1 The bottom line Pitch perception involves the integration of spectral (place)
Behavioral and neural identification of birdsong under several masking conditions
 Behavioral and neural identification of birdsong under several masking conditions Barbara G. Shinn-Cunningham 1, Virginia Best 1, Micheal L. Dent 2, Frederick J. Gallun 1, Elizabeth M. McClaine 2, Rajiv
Object selectivity of local field potentials and spikes in the macaque inferior temporal cortex
 Object selectivity of local field potentials and spikes in the macaque inferior temporal cortex Gabriel Kreiman 1,2,3,4*#, Chou P. Hung 1,2,4*, Alexander Kraskov 5, Rodrigo Quian Quiroga 6, Tomaso Poggio
The Research of Controlling Loudness in the Timbre Subjective Perception Experiment of Sheng
 The Research of Controlling Loudness in the Timbre Subjective Perception Experiment of Sheng S. Zhu, P. Ji, W. Kuang and J. Yang Institute of Acoustics, CAS, O.21, Bei-Si-huan-Xi Road, 100190 Beijing,
Brian C. J. Moore Department of Experimental Psychology, University of Cambridge, Downing Street, Cambridge CB2 3EB, England
 Asymmetry of masking between complex tones and noise: Partial loudness Hedwig Gockel a) CNBH, Department of Physiology, University of Cambridge, Downing Street, Cambridge CB2 3EG, England Brian C. J. Moore
Do Zwicker Tones Evoke a Musical Pitch?
 Do Zwicker Tones Evoke a Musical Pitch? Hedwig E. Gockel and Robert P. Carlyon Abstract It has been argued that musical pitch, i.e. pitch in its strictest sense, requires phase locking at the level of
Experiments on tone adjustments
 Experiments on tone adjustments Jesko L. VERHEY 1 ; Jan HOTS 2 1 University of Magdeburg, Germany ABSTRACT Many technical sounds contain tonal components originating from rotating parts, such as electric
The Tone Height of Multiharmonic Sounds. Introduction
 Music-Perception Winter 1990, Vol. 8, No. 2, 203-214 I990 BY THE REGENTS OF THE UNIVERSITY OF CALIFORNIA The Tone Height of Multiharmonic Sounds ROY D. PATTERSON MRC Applied Psychology Unit, Cambridge,
AUD 6306 Speech Science
 AUD 3 Speech Science Dr. Peter Assmann Spring semester 2 Role of Pitch Information Pitch contour is the primary cue for tone recognition Tonal languages rely on pitch level and differences to convey lexical
MASTER'S THESIS. Listener Envelopment
 MASTER'S THESIS 2008:095 Listener Envelopment Effects of changing the sidewall material in a model of an existing concert hall Dan Nyberg Luleå University of Technology Master thesis Audio Technology Department
SUPPLEMENTARY INFORMATION
 doi: 1.138/nature691 SUPPLEMENTAL METHODS Chronically Implanted Electrode Arrays Warp16 electrode arrays (Neuralynx Inc., Bozeman MT) were used for these recordings. These arrays consist of a 4x4 array
Measurement of overtone frequencies of a toy piano and perception of its pitch
 Measurement of overtone frequencies of a toy piano and perception of its pitch PACS: 43.75.Mn ABSTRACT Akira Nishimura Department of Media and Cultural Studies, Tokyo University of Information Sciences,
Proceedings of Meetings on Acoustics
 Proceedings of Meetings on Acoustics Volume 19, 2013 http://acousticalsociety.org/ ICA 2013 Montreal Montreal, Canada 2-7 June 2013 Psychological and Physiological Acoustics Session 1pPPb: Psychoacoustics
Musical Acoustics Lecture 15 Pitch & Frequency (Psycho-Acoustics)
") 1 Musical Acoustics Lecture 15 Pitch & Frequency (Psycho-Acoustics) Pitch Pitch is a subjective characteristic of sound Some listeners even assign pitch differently depending upon whether the sound was
1 Musical Acoustics Lecture 15 Pitch & Frequency (Psycho-Acoustics) Pitch Pitch is a subjective characteristic of sound Some listeners even assign pitch differently depending upon whether the sound was
Consonance perception of complex-tone dyads and chords
 Downloaded from orbit.dtu.dk on: Nov 24, 28 Consonance perception of complex-tone dyads and chords Rasmussen, Marc; Santurette, Sébastien; MacDonald, Ewen Published in: Proceedings of Forum Acusticum Publication
I. INTRODUCTION. Electronic mail:
 Neural activity associated with distinguishing concurrent auditory objects Claude Alain, a) Benjamin M. Schuler, and Kelly L. McDonald Rotman Research Institute, Baycrest Centre for Geriatric Care, 3560
Auditory scene analysis
 Harvard-MIT Division of Health Sciences and Technology HST.723: Neural Coding and Perception of Sound Instructor: Christophe Micheyl Auditory scene analysis Christophe Micheyl We are often surrounded by
Spatial-frequency masking with briefly pulsed patterns
 Perception, 1978, volume 7, pages 161-166 Spatial-frequency masking with briefly pulsed patterns Gordon E Legge Department of Psychology, University of Minnesota, Minneapolis, Minnesota 55455, USA Michael
Supplemental Material for Gamma-band Synchronization in the Macaque Hippocampus and Memory Formation
 Supplemental Material for Gamma-band Synchronization in the Macaque Hippocampus and Memory Formation Michael J. Jutras, Pascal Fries, Elizabeth A. Buffalo * *To whom correspondence should be addressed.
Nature Neuroscience: doi: /nn Supplementary Figure 1. Emergence of dmpfc and BLA 4-Hz oscillations during freezing behavior.
 Supplementary Figure 1 Emergence of dmpfc and BLA 4-Hz oscillations during freezing behavior. (a) Representative power spectrum of dmpfc LFPs recorded during Retrieval for freezing and no freezing periods.
Noise evaluation based on loudness-perception characteristics of older adults
 Noise evaluation based on loudness-perception characteristics of older adults Kenji KURAKATA 1 ; Tazu MIZUNAMI 2 National Institute of Advanced Industrial Science and Technology (AIST), Japan ABSTRACT
Temporal summation of loudness as a function of frequency and temporal pattern
 The 33 rd International Congress and Exposition on Noise Control Engineering Temporal summation of loudness as a function of frequency and temporal pattern I. Boullet a, J. Marozeau b and S. Meunier c
MODIFICATIONS TO THE POWER FUNCTION FOR LOUDNESS
 MODIFICATIONS TO THE POWER FUNCTION FOR LOUDNESS Søren uus 1,2 and Mary Florentine 1,3 1 Institute for Hearing, Speech, and Language 2 Communications and Digital Signal Processing Center, ECE Dept. (440
The Lecture Contains: Frequency Response of the Human Visual System: Temporal Vision: Consequences of persistence of vision: Objectives_template
 The Lecture Contains: Frequency Response of the Human Visual System: Temporal Vision: Consequences of persistence of vision: file:///d /...se%20(ganesh%20rana)/my%20course_ganesh%20rana/prof.%20sumana%20gupta/final%20dvsp/lecture8/8_1.htm[12/31/2015
A 5 Hz limit for the detection of temporal synchrony in vision
 A 5 Hz limit for the detection of temporal synchrony in vision Michael Morgan 1 (Applied Vision Research Centre, The City University, London) Eric Castet 2 ( CRNC, CNRS, Marseille) 1 Corresponding Author
Loudness and Sharpness Calculation
 10/16 Loudness and Sharpness Calculation Psychoacoustics is the science of the relationship between physical quantities of sound and subjective hearing impressions. To examine these relationships, physical
2 Autocorrelation verses Strobed Temporal Integration
 11 th ISH, Grantham 1997 1 Auditory Temporal Asymmetry and Autocorrelation Roy D. Patterson* and Toshio Irino** * Center for the Neural Basis of Hearing, Physiology Department, Cambridge University, Downing
Modeling sound quality from psychoacoustic measures
 Modeling sound quality from psychoacoustic measures Lena SCHELL-MAJOOR 1 ; Jan RENNIES 2 ; Stephan D. EWERT 3 ; Birger KOLLMEIER 4 1,2,4 Fraunhofer IDMT, Hör-, Sprach- und Audiotechnologie & Cluster of
The Cocktail Party Effect. Binaural Masking. The Precedence Effect. Music 175: Time and Space
 The Cocktail Party Effect Music 175: Time and Space Tamara Smyth, trsmyth@ucsd.edu Department of Music, University of California, San Diego (UCSD) April 20, 2017 Cocktail Party Effect: ability to follow
Smooth Rhythms as Probes of Entrainment. Music Perception 10 (1993): ABSTRACT
: ABSTRACT") Smooth Rhythms as Probes of Entrainment Music Perception 10 (1993): 503-508 ABSTRACT If one hypothesizes rhythmic perception as a process employing oscillatory circuits in the brain that entrain to low-frequency
Smooth Rhythms as Probes of Entrainment Music Perception 10 (1993): 503-508 ABSTRACT If one hypothesizes rhythmic perception as a process employing oscillatory circuits in the brain that entrain to low-frequency
MEASURING LOUDNESS OF LONG AND SHORT TONES USING MAGNITUDE ESTIMATION
 MEASURING LOUDNESS OF LONG AND SHORT TONES USING MAGNITUDE ESTIMATION Michael Epstein 1,2, Mary Florentine 1,3, and Søren Buus 1,2 1Institute for Hearing, Speech, and Language 2Communications and Digital
LOUDNESS EFFECT OF THE DIFFERENT TONES ON THE TIMBRE SUBJECTIVE PERCEPTION EXPERIMENT OF ERHU
 The 21 st International Congress on Sound and Vibration 13-17 July, 2014, Beijing/China LOUDNESS EFFECT OF THE DIFFERENT TONES ON THE TIMBRE SUBJECTIVE PERCEPTION EXPERIMENT OF ERHU Siyu Zhu, Peifeng Ji,
Pitch is one of the most common terms used to describe sound.
 ARTICLES https://doi.org/1.138/s41562-17-261-8 Diversity in pitch perception revealed by task dependence Malinda J. McPherson 1,2 * and Josh H. McDermott 1,2 Pitch conveys critical information in speech,
LETTERS. The neuronal representation of pitch in primate auditory cortex. Daniel Bendor 1 & Xiaoqin Wang 1
 Vol 436 25 August 25 doi:1.138/nature3867 The neuronal representation of pitch in primate auditory cortex Daniel Bendor 1 & Xiaoqin Wang 1 LETTERS Pitch perception is critical for identifying and segregating
Equal Intensity Contours for Whole-Body Vibrations Compared With Vibrations Cross-Modally Matched to Isophones
 Equal Intensity Contours for Whole-Body Vibrations Compared With Vibrations Cross-Modally Matched to Isophones Sebastian Merchel, M. Ercan Altinsoy and Maik Stamm Chair of Communication Acoustics, Dresden
The presence of multiple sound sources is a routine occurrence
 Spectral completion of partially masked sounds Josh H. McDermott* and Andrew J. Oxenham Department of Psychology, University of Minnesota, N640 Elliott Hall, 75 East River Road, Minneapolis, MN 55455-0344
inter.noise 2000 The 29th International Congress and Exhibition on Noise Control Engineering August 2000, Nice, FRANCE
 Copyright SFA - InterNoise 2000 1 inter.noise 2000 The 29th International Congress and Exhibition on Noise Control Engineering 27-30 August 2000, Nice, FRANCE I-INCE Classification: 7.5 BALANCE OF CAR
Timbre blending of wind instruments: acoustics and perception
 Timbre blending of wind instruments: acoustics and perception Sven-Amin Lembke CIRMMT / Music Technology Schulich School of Music, McGill University sven-amin.lembke@mail.mcgill.ca ABSTRACT The acoustical
Assessing and Measuring VCR Playback Image Quality, Part 1. Leo Backman/DigiOmmel & Co.
 Assessing and Measuring VCR Playback Image Quality, Part 1. Leo Backman/DigiOmmel & Co. Assessing analog VCR image quality and stability requires dedicated measuring instruments. Still, standard metrics
Psychoacoustics. lecturer:
 Psychoacoustics lecturer: stephan.werner@tu-ilmenau.de Block Diagram of a Perceptual Audio Encoder loudness critical bands masking: frequency domain time domain binaural cues (overview) Source: Brandenburg,
We realize that this is really small, if we consider that the atmospheric pressure 2 is
 PART 2 Sound Pressure Sound Pressure Levels (SPLs) Sound consists of pressure waves. Thus, a way to quantify sound is to state the amount of pressure 1 it exertsrelatively to a pressure level of reference.
INTRODUCTION J. Acoust. Soc. Am. 107 (3), March /2000/107(3)/1589/9/$ Acoustical Society of America 1589
, March /2000/107(3)/1589/9/$ Acoustical Society of America 1589") Effects of ipsilateral and contralateral precursors on the temporal effect in simultaneous masking with pure tones Sid P. Bacon a) and Eric W. Healy Psychoacoustics Laboratory, Department of Speech and
Effects of ipsilateral and contralateral precursors on the temporal effect in simultaneous masking with pure tones Sid P. Bacon a) and Eric W. Healy Psychoacoustics Laboratory, Department of Speech and
Laboratory Assignment 3. Digital Music Synthesis: Beethoven s Fifth Symphony Using MATLAB
 Laboratory Assignment 3 Digital Music Synthesis: Beethoven s Fifth Symphony Using MATLAB PURPOSE In this laboratory assignment, you will use MATLAB to synthesize the audio tones that make up a well-known
Problem Points Score USE YOUR TIME WISELY USE CLOSEST DF AVAILABLE IN TABLE SHOW YOUR WORK TO RECEIVE PARTIAL CREDIT
 Stat 514 EXAM I Stat 514 Name (6 pts) Problem Points Score 1 32 2 30 3 32 USE YOUR TIME WISELY USE CLOSEST DF AVAILABLE IN TABLE SHOW YOUR WORK TO RECEIVE PARTIAL CREDIT WRITE LEGIBLY. ANYTHING UNREADABLE
A PSYCHOACOUSTICAL INVESTIGATION INTO THE EFFECT OF WALL MATERIAL ON THE SOUND PRODUCED BY LIP-REED INSTRUMENTS
 A PSYCHOACOUSTICAL INVESTIGATION INTO THE EFFECT OF WALL MATERIAL ON THE SOUND PRODUCED BY LIP-REED INSTRUMENTS JW Whitehouse D.D.E.M., The Open University, Milton Keynes, MK7 6AA, United Kingdom DB Sharp
4. ANALOG TV SIGNALS MEASUREMENT
 Goals of measurement 4. ANALOG TV SIGNALS MEASUREMENT 1) Measure the amplitudes of spectral components in the spectrum of frequency modulated signal of Δf = 50 khz and f mod = 10 khz (relatively to unmodulated
Instrument Recognition in Polyphonic Mixtures Using Spectral Envelopes
 Instrument Recognition in Polyphonic Mixtures Using Spectral Envelopes hello Jay Biernat Third author University of Rochester University of Rochester Affiliation3 words jbiernat@ur.rochester.edu author3@ismir.edu
Quarterly Progress and Status Report. An attempt to predict the masking effect of vowel spectra
 Dept. for Speech, Music and Hearing Quarterly Progress and Status Report An attempt to predict the masking effect of vowel spectra Gauffin, J. and Sundberg, J. journal: STL-QPSR volume: 15 number: 4 year:
Acoustic and musical foundations of the speech/song illusion
 Acoustic and musical foundations of the speech/song illusion Adam Tierney, *1 Aniruddh Patel #2, Mara Breen^3 * Department of Psychological Sciences, Birkbeck, University of London, United Kingdom # Department
Pitch perception for mixtures of spectrally overlapping harmonic complex tones
 Pitch perception for mixtures of spectrally overlapping harmonic complex tones Christophe Micheyl, a Michael V. Keebler, and Andrew J. Oxenham Department of Psychology, University of Minnesota, Minneapolis,
Using the new psychoacoustic tonality analyses Tonality (Hearing Model) 1
 1") 02/18 Using the new psychoacoustic tonality analyses 1 As of ArtemiS SUITE 9.2, a very important new fully psychoacoustic approach to the measurement of tonalities is now available., based on the Hearing
02/18 Using the new psychoacoustic tonality analyses 1 As of ArtemiS SUITE 9.2, a very important new fully psychoacoustic approach to the measurement of tonalities is now available., based on the Hearing
Psychoacoustic Evaluation of Fan Noise
 Psychoacoustic Evaluation of Fan Noise Dr. Marc Schneider Team Leader R&D - Acoustics ebm-papst Mulfingen GmbH & Co.KG Carolin Feldmann, University Siegen Outline Motivation Psychoacoustic Parameters Psychoacoustic
Signal processing in the Philips 'VLP' system
 Philips tech. Rev. 33, 181-185, 1973, No. 7 181 Signal processing in the Philips 'VLP' system W. van den Bussche, A. H. Hoogendijk and J. H. Wessels On the 'YLP' record there is a single information track
PRODUCT SHEET
 ERS100C EVOKED RESPONSE AMPLIFIER MODULE The evoked response amplifier module (ERS100C) is a single channel, high gain, extremely low noise, differential input, biopotential amplifier designed to accurately
PSYCHOACOUSTICS & THE GRAMMAR OF AUDIO (By Steve Donofrio NATF)
") PSYCHOACOUSTICS & THE GRAMMAR OF AUDIO (By Steve Donofrio NATF) "The reason I got into playing and producing music was its power to travel great distances and have an emotional impact on people" Quincey
PSYCHOACOUSTICS & THE GRAMMAR OF AUDIO (By Steve Donofrio NATF) "The reason I got into playing and producing music was its power to travel great distances and have an emotional impact on people" Quincey
I. INTRODUCTION. 1 place Stravinsky, Paris, France; electronic mail:
 The lower limit of melodic pitch Daniel Pressnitzer, a) Roy D. Patterson, and Katrin Krumbholz Centre for the Neural Basis of Hearing, Department of Physiology, Downing Street, Cambridge CB2 3EG, United
Voice segregation by difference in fundamental frequency: Effect of masker type
 Voice segregation by difference in fundamental frequency: Effect of masker type Mickael L. D. Deroche a) Department of Otolaryngology, Johns Hopkins University School of Medicine, 818 Ross Research Building,
Topic 10. Multi-pitch Analysis
 Topic 10 Multi-pitch Analysis What is pitch? Common elements of music are pitch, rhythm, dynamics, and the sonic qualities of timbre and texture. An auditory perceptual attribute in terms of which sounds
Neural Correlates of the Lombard Effect in Primate Auditory Cortex
 The Journal of Neuroscience, ugust 1, 212 32(31):1737 1748 1737 ehavioral/systems/ognitive Neural orrelates of the Lombard Effect in Primate uditory ortex Steven J. Eliades and Xiaoqin Wang Laboratory
Investigation of Digital Signal Processing of High-speed DACs Signals for Settling Time Testing
 Universal Journal of Electrical and Electronic Engineering 4(2): 67-72, 2016 DOI: 10.13189/ujeee.2016.040204 http://www.hrpub.org Investigation of Digital Signal Processing of High-speed DACs Signals for
LETTERS. The neuronal representation of pitch in primate auditory cortex. Daniel Bendor 1 & Xiaoqin Wang 1
 Vol 436 25 August 2005 doi:10.1038/nature03867 The neuronal representation of pitch in primate auditory cortex Daniel Bendor 1 & Xiaoqin Wang 1 Pitch perception is critical for identifying and segregating
2005 BY THE REGENTS OF THE UNIVERSITY OF CALIFORNIA. The Influence of Pitch Interval on the Perception of Polyrhythms
 Music Perception Spring 2005, Vol. 22, No. 3, 425 440 2005 BY THE REGENTS OF THE UNIVERSITY OF CALIFORNIA ALL RIGHTS RESERVED. The Influence of Pitch Interval on the Perception of Polyrhythms DIRK MOELANTS
Electrical Stimulation of the Cochlea to Reduce Tinnitus. Richard S. Tyler, Ph.D. Overview
 Electrical Stimulation of the Cochlea to Reduce Tinnitus Richard S., Ph.D. 1 Overview 1. Mechanisms of influencing tinnitus 2. Review of select studies 3. Summary of what is known 4. Next Steps 2 The University
TO HONOR STEVENS AND REPEAL HIS LAW (FOR THE AUDITORY STSTEM)
") TO HONOR STEVENS AND REPEAL HIS LAW (FOR THE AUDITORY STSTEM) Mary Florentine 1,2 and Michael Epstein 1,2,3 1Institute for Hearing, Speech, and Language 2Dept. Speech-Language Pathology and Audiology (133
TO HONOR STEVENS AND REPEAL HIS LAW (FOR THE AUDITORY STSTEM) Mary Florentine 1,2 and Michael Epstein 1,2,3 1Institute for Hearing, Speech, and Language 2Dept. Speech-Language Pathology and Audiology (133
Concert halls conveyors of musical expressions
 Communication Acoustics: Paper ICA216-465 Concert halls conveyors of musical expressions Tapio Lokki (a) (a) Aalto University, Dept. of Computer Science, Finland, tapio.lokki@aalto.fi Abstract: The first
DIFFERENCES IN TRAFFIC NOISE MEASUREMENTS WITH SLM AND BINAURAL RECORDING HEAD
 DIFFERENCES IN TRAFFIC NOISE MEASUREMENTS WITH SLM AND BINAURAL RECORDING HEAD 43.50.LJ Schwarz, Henrik schwarzingenieure GmbH, consultants in civil engineering Franckstrasse 38 71665 Vaihingen an der
Quarterly Progress and Status Report. Perception of just noticeable time displacement of a tone presented in a metrical sequence at different tempos
 Dept. for Speech, Music and Hearing Quarterly Progress and Status Report Perception of just noticeable time displacement of a tone presented in a metrical sequence at different tempos Friberg, A. and Sundberg,
1 Introduction to PSQM
 A Technical White Paper on Sage s PSQM Test Renshou Dai August 7, 2000 1 Introduction to PSQM 1.1 What is PSQM test? PSQM stands for Perceptual Speech Quality Measure. It is an ITU-T P.861 [1] recommended
Temporal Envelope and Periodicity Cues on Musical Pitch Discrimination with Acoustic Simulation of Cochlear Implant
 Temporal Envelope and Periodicity Cues on Musical Pitch Discrimination with Acoustic Simulation of Cochlear Implant Lichuan Ping 1, 2, Meng Yuan 1, Qinglin Meng 1, 2 and Haihong Feng 1 1 Shanghai Acoustics
Reconstruction of Ca 2+ dynamics from low frame rate Ca 2+ imaging data CS229 final project. Submitted by: Limor Bursztyn
 Reconstruction of Ca 2+ dynamics from low frame rate Ca 2+ imaging data CS229 final project. Submitted by: Limor Bursztyn Introduction Active neurons communicate by action potential firing (spikes), accompanied
Hearing Research 219 (2006) Research paper. Influence of musical and psychoacoustical training on pitch discrimination
 Research paper. Influence of musical and psychoacoustical training on pitch discrimination") Hearing Research 219 (2006) 36 47 Research paper Influence of musical and psychoacoustical training on pitch discrimination Christophe Micheyl a, *, Karine Delhommeau b,c, Xavier Perrot d, Andrew J. Oxenham
Hearing Research 219 (2006) 36 47 Research paper Influence of musical and psychoacoustical training on pitch discrimination Christophe Micheyl a, *, Karine Delhommeau b,c, Xavier Perrot d, Andrew J. Oxenham
2 MHz Lock-In Amplifier
 2 MHz Lock-In Amplifier SR865 2 MHz dual phase lock-in amplifier SR865 2 MHz Lock-In Amplifier 1 mhz to 2 MHz frequency range Dual reference mode Low-noise current and voltage inputs Touchscreen data display
Time course of simultaneous masking in the starling s auditory forebrain
 Exp Brain Res (1999) 124:311 320 Springer-Verlag 1999 RESEARCH ARTICLE Andreas Nieder Georg M. Klump Time course of simultaneous masking in the starling s auditory forebrain Received: 20 April 1998 / Accepted:
Why are natural sounds detected faster than pips?
 Why are natural sounds detected faster than pips? Clara Suied Department of Physiology, Development and Neuroscience, Centre for the Neural Basis of Hearing, Downing Street, Cambridge CB2 3EG, United Kingdom
Detection and demodulation of non-cooperative burst signal Feng Yue 1, Wu Guangzhi 1, Tao Min 1
 International Conference on Applied Science and Engineering Innovation (ASEI 2015) Detection and demodulation of non-cooperative burst signal Feng Yue 1, Wu Guangzhi 1, Tao Min 1 1 China Satellite Maritime
INTENSITY DYNAMICS AND LOUDNESS CHANGE: A REVIEW OF METHODS AND PERCEPTUAL PROCESSES
 INTENSITY DYNAMICS AND LOUDNESS CHANGE: A REVIEW OF METHODS AND PERCEPTUAL PROCESSES Kirk N. Olsen The MARCS Institute, University of Western Sydney, Australia k.olsen@uws.edu.au In real-world listening
Noise. CHEM 411L Instrumental Analysis Laboratory Revision 2.0
 CHEM 411L Instrumental Analysis Laboratory Revision 2.0 Noise In this laboratory exercise we will determine the Signal-to-Noise (S/N) ratio for an IR spectrum of Air using a Thermo Nicolet Avatar 360 Fourier
Quarterly Progress and Status Report. Violin timbre and the picket fence
 Dept. for Speech, Music and Hearing Quarterly Progress and Status Report Violin timbre and the picket fence Jansson, E. V. journal: STL-QPSR volume: 31 number: 2-3 year: 1990 pages: 089-095 http://www.speech.kth.se/qpsr
2. AN INTROSPECTION OF THE MORPHING PROCESS
 1. INTRODUCTION Voice morphing means the transition of one speech signal into another. Like image morphing, speech morphing aims to preserve the shared characteristics of the starting and final signals,
ANALYSING DIFFERENCES BETWEEN THE INPUT IMPEDANCES OF FIVE CLARINETS OF DIFFERENT MAKES
 ANALYSING DIFFERENCES BETWEEN THE INPUT IMPEDANCES OF FIVE CLARINETS OF DIFFERENT MAKES P Kowal Acoustics Research Group, Open University D Sharp Acoustics Research Group, Open University S Taherzadeh
Proceedings of Meetings on Acoustics
 Proceedings of Meetings on Acoustics Volume 19, 2013 http://acousticalsociety.org/ ICA 2013 Montreal Montreal, Canada 2-7 June 2013 Musical Acoustics Session 3pMU: Perception and Orchestration Practice
9.35 Sensation And Perception Spring 2009
 MIT OpenCourseWare http://ocw.mit.edu 9.35 Sensation And Perception Spring 29 For information about citing these materials or our Terms of Use, visit: http://ocw.mit.edu/terms. Hearing Kimo Johnson April
Skip Length and Inter-Starvation Distance as a Combined Metric to Assess the Quality of Transmitted Video
 Skip Length and Inter-Starvation Distance as a Combined Metric to Assess the Quality of Transmitted Video Mohamed Hassan, Taha Landolsi, Husameldin Mukhtar, and Tamer Shanableh College of Engineering American
Precedence-based speech segregation in a virtual auditory environment
 Precedence-based speech segregation in a virtual auditory environment Douglas S. Brungart a and Brian D. Simpson Air Force Research Laboratory, Wright-Patterson AFB, Ohio 45433 Richard L. Freyman University
Audio Feature Extraction for Corpus Analysis
 Audio Feature Extraction for Corpus Analysis Anja Volk Sound and Music Technology 5 Dec 2017 1 Corpus analysis What is corpus analysis study a large corpus of music for gaining insights on general trends
Music Source Separation
 Music Source Separation Hao-Wei Tseng Electrical and Engineering System University of Michigan Ann Arbor, Michigan Email: blakesen@umich.edu Abstract In popular music, a cover version or cover song, or
Brain.fm Theory & Process
 Brain.fm Theory & Process At Brain.fm we develop and deliver functional music, directly optimized for its effects on our behavior. Our goal is to help the listener achieve desired mental states such as
Musicians Adjustment of Performance to Room Acoustics, Part III: Understanding the Variations in Musical Expressions
 Musicians Adjustment of Performance to Room Acoustics, Part III: Understanding the Variations in Musical Expressions K. Kato a, K. Ueno b and K. Kawai c a Center for Advanced Science and Innovation, Osaka
Brain-Computer Interface (BCI)
") Brain-Computer Interface (BCI) Christoph Guger, Günter Edlinger, g.tec Guger Technologies OEG Herbersteinstr. 60, 8020 Graz, Austria, guger@gtec.at This tutorial shows HOW-TO find and extract proper signal
Brain-Computer Interface (BCI) Christoph Guger, Günter Edlinger, g.tec Guger Technologies OEG Herbersteinstr. 60, 8020 Graz, Austria, guger@gtec.at This tutorial shows HOW-TO find and extract proper signal
Release from speech-on-speech masking in a front-and-back geometry
 Release from speech-on-speech masking in a front-and-back geometry Neil L. Aaronson Department of Physics and Astronomy, Michigan State University, Biomedical and Physical Sciences Building, East Lansing,
Influence of tonal context and timbral variation on perception of pitch
 Perception & Psychophysics 2002, 64 (2), 198-207 Influence of tonal context and timbral variation on perception of pitch CATHERINE M. WARRIER and ROBERT J. ZATORRE McGill University and Montreal Neurological
Largeness and shape of sound images captured by sketch-drawing experiments: Effects of bandwidth and center frequency of broadband noise
 PAPER #2017 The Acoustical Society of Japan Largeness and shape of sound images captured by sketch-drawing experiments: Effects of bandwidth and center frequency of broadband noise Makoto Otani 1;, Kouhei
Table 1 Pairs of sound samples used in this study Group1 Group2 Group1 Group2 Sound 2. Sound 2. Pair
 Acoustic annoyance inside aircraft cabins A listening test approach Lena SCHELL-MAJOOR ; Robert MORES Fraunhofer IDMT, Hör-, Sprach- und Audiotechnologie & Cluster of Excellence Hearing4All, Oldenburg
Digital Representation
 Chapter three c0003 Digital Representation CHAPTER OUTLINE Antialiasing...12 Sampling...12 Quantization...13 Binary Values...13 A-D... 14 D-A...15 Bit Reduction...15 Lossless Packing...16 Lower f s and
Music Perception with Combined Stimulation
 Music Perception with Combined Stimulation Kate Gfeller 1,2,4, Virginia Driscoll, 4 Jacob Oleson, 3 Christopher Turner, 2,4 Stephanie Kliethermes, 3 Bruce Gantz 4 School of Music, 1 Department of Communication
THE DIGITAL DELAY ADVANTAGE A guide to using Digital Delays. Synchronize loudspeakers Eliminate comb filter distortion Align acoustic image.
 THE DIGITAL DELAY ADVANTAGE A guide to using Digital Delays Synchronize loudspeakers Eliminate comb filter distortion Align acoustic image Contents THE DIGITAL DELAY ADVANTAGE...1 - Why Digital Delays?...