AdBm Demonstration at Butendiek Offshore Wind Farm with Ballast Nedam
|
|
|
- Roderick Dickerson
- 6 years ago
- Views:
Transcription


1 AdBm Demonstration at Butendiek Offshore Wind Farm with Ballast Nedam AdBm Butendiek Demonstration Report, 2014 AdBm Corp 1
2 Executive Summary A demonstration of the AdBm Technologies underwater noise abatement system was conducted July 11 12, 2014 during pile driving operations for monopiles BU 32 and BU 21 in the Butendiek Offshore Wind Farm. The panel-based noise abatement system was deployed and recovered four times without incident. Acoustic testing was conducted at three locations ranging from 285 meters to 750 meters from the monopile being driven. Measurements were collected on 668 hammer strikes at a distance of 285 meters from the monopile. Attenuation of up to 36.8 db was realized across all hammer strikes at this location. At 750 m from the monopile, 136 hammer strikes were analyzed and the noise radiated from the pile driving was attenuated to the level of ambient noise near the recording vessel, which ranged on average from db re 1 µpa. The results from this test strongly suggest that this system alone will be sufficient to meet the required sound exposure level of 160 db at 750 m. Project Under contract from WPD, Ballast Nedam began pile driving operations for the Butendiek Offshore Wind Farm on the 1 st of April, Operations were based out of the port of Esbjerg, Denmark. AdBm engaged Ballast Nedam to demonstrate our panel-based noise abatement system. Originally AdBm had planned to ship the system via surface transport; however, due to time constraints from the fact that Ballast Nedam was one month ahead of schedule AdBm shipped the system via air freight and met the accelerated schedule on time. Key Personnel and Equipment AdBm Mark Coplen Vice President of Sales, Project Manager for the demonstration Kevin Lee Research Scientist from Applied Research Laboratories, University of Texas at Austin (ARL:UT) and Science Advisor to AdBm Andrew McNeese Engineering Scientist from Applied Research Laboratories, University of Texas at Austin (ARL:UT) Ballast Nedam Offshore Jarko Snaar Ballast Nedam Senior Project Engineer. Jarko championed the project inside Ballast Nedam and was instrumental in making the demonstration happen. Arne Hartogsveld Ballast Nedam Senior Planner/Logistics Coordinator. Arne was our main point of contact at the port and coordinated all logistics for receiving the system at the port, getting the system to and from the project site, and making arrangements for the AdBm staff for offshore accommodations. Captain Mark Rawdon of the Multicat Mena C and crew were excellent hosts and extremely helpful in preparing the system for deployment, and assisting with deployment of the panel. Captain Patrick Nowee of the HLV Svanen and crew provided lodging and food, and assisted with offloading gear from Mena C and trans-loading to the Viking for transport back to port. Vessels directly involved with the demonstration HLV Svanen Ballast Nedam s installation vessel Multicat Mena C of Rhu GSS Marine Services, under contract to Ballast Nedam AdBm Butendiek Demonstration Report, 2014 AdBm Corp 2

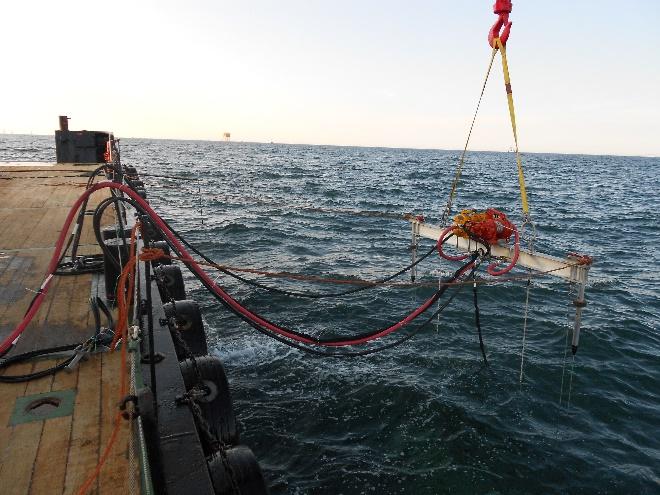
3 Demonstration Noise Abatement Panel AdBm s noise abatement system consists of a modular, collapsible framework, which houses and deploys submersible air-filled acoustic resonators. When fully deployed, the framework and acoustic resonators can be designed to extend and cover the entire water column; the collapsible nature of the framework allows the system to be stored in a compact manner. Fig. 1: Photograph of demonstration panel in collapsed state on deck of the Mena C. The various components of the system are labeled. Note that for the production version of this system, the hydrophone cables, winch control lines, and tag lines will not be present. The demonstration noise abatement system consisted of a scaled-down, single collapsible framework populated with 240 acoustic resonators. The resonators were designed to have a resonance frequency of 100 Hz and were fabricated specifically for this demonstration. The framework consisted of eight horizontal slats, each housing 30 acoustic resonators, that could expanded to a height of 7 meters. AdBm Butendiek Demonstration Report, 2014 AdBm Corp 3

4 When fully collapsed, the panel was less than 1.5 meters tall. A photograph of the demonstration panel in its fully collapsed state on deck of the Mena C is shown in Fig. 1. A photograph of the fully extended panel at an ARL:UT test tank is shown in Fig. 2. Fig. 2: Photograph of the fully extended demonstration panel in the ARL:UT test tank. Underwater photographs were made during the Butendiek demonstration; however, the test tank photo more clearly shows the system due to water clarity. The purpose of the Butendiek demonstration was two-fold: 1) demonstrate deployment and retrieval of the panel in North Sea conditions, and 2) demonstrate our technology s sound reduction effectiveness on pile driving noise. To enable the acoustic tests of the demonstration panel, two hydrophone arrays were used: a baseline array that measured the untreated pile driving noise and an array embedded with the demonstration panel to measure the panel effects on the noise. The demonstration is described below, followed by the key acoustic results. Demonstration Procedure The demonstration panel was deployed from the Mena C during the driving of two monopiles at the Butendiek offshore site: BU-32 and BU-21. The demonstration panel was deployed at a site approximately 385 m away from monopile BU-32 and at sites approximately 285 m and 750 m away from monopile BU-21. The Mena C s GPS system was used to determine the distance from its mooring location to the monopile. The panel, its embedded hydrophone array, and a baseline hydrophone array were deployed from the starboard side of the Mena C at each deployment location, and the Mena C was positioned such that its starboard side was facing the Svanen. The Mena C s thrusters were turned off during acoustic data collection to minimize the ambient noise levels at each site; however, its generators were left on. The test configuration is summarized in Fig. 3. AdBm Butendiek Demonstration Report, 2014 AdBm Corp 4
5 Fig. 3: Diagram depicting the deployment and test configuration for monopiles BU-32 and BU-21. At each test location the panel and baseline hydrophone array were deployed and left in the water during pile driving events until sufficient acoustic data were collected. Acoustic data were recorded simultaneously on hydrophones from both arrays so that a direct comparison could be made between the signals recorded on the unshielded array and those recorded on the array embedded in the noise abatement panel. This comparison provided a measure of the amount of sound absorption provided by the demonstration panel. After acoustic data collection was completed at each test site, the panel and baseline array were retrieved and stowed away for transport. Video of the system being deployed from the Mena C can be found here: Underwater video of the panel deployment can be found here: Acoustic Data Acquisition Equipment and Post-Analysis All acoustic data were recorded using High Tech Inc. HTI-90-U dual sensitivity hydrophones. The three hydrophones on each array were spaced at 1.2 m from each other at water depths ranging from 3.6 m to 6.0 m. The hydrophones were powered using custom electronics designed and built by ARL:UT. Unprocessed hydrophones signals were digitized at a sampling rate of 10 ksamples/s in 24-bit resolution using a Data Translation DT9826 USB Data Acquisition Module and stored on a laptop computer. Electrical interference from the ship s AC power system induced significant electrical noise into the measuring equipment via the hydrophone power supplies, which were initially connected to ship for the monopile BU-32 tests. Due to this noise, we utilized a custom-built, low-noise, two-channel hydrophone power supply, which we had brought as a backup and which minimized the electrical interference. This hydrophone power supply allowed us to collect data from two consecutive hydrophones rather than using the full array of six (three in baseline array and three embedded in the panel). During this phase of testing we collected data from four total hydrophones, two each at a time with one in the baseline array and one in the protected area of the noise abatement panel however; there was still electrical AdBm Butendiek Demonstration Report, 2014 AdBm Corp 5
6 noise present in this data. For the second monopile tested we utilized a pure-sine-wave power inverter connected to an automobile battery, which provided extremely clean power, allowing us to use our multichannel (5 channels each) hydrophone power supplies, which had been previously affected by electrical noise when connected to ship power. During this phase we collected data simultaneously from six hydrophones, three in the baseline array and three in the protected area of the noise abatement panel. For these reasons, we will focus on the data in this report from monopile BU-21, which was free of interference from non-acoustic electrical noise. The acoustic data were analyzed on a strike-by-strike basis. A computer algorithm was written to automatically detect and gate individual data for further processing. The data were high-pass filtered with a cutoff frequency of 20 Hz using a zero-phase forward and reverse digital filter to minimize the presence of low frequency pressure variation in the data due purely to surface water wave motion. Quiet gaps between strikes were used to obtain estimates of the ambient noise levels (non-pile-driving noise). Two metrics are used to quantify the demonstration panel s acoustic noise-reducing performance: peak sound pressure levels and third-octave band levels. Example monopile signals are plotted in Fig. 4. The signal from a signal hydrophone on the baseline array is plotted on top while the corresponding hydrophone from the panel-embedded array is plotted on bottom. There is a clear and significant reduction of the initial impulse radiated by the monopile. Fig. 4: Example raw acoustic data from a single event from monopile BU-21 recorded at a distance of 285 m from the monopile. The data from each hydrophone were recorded simultaneously. The acoustic signals correspond to the same hammer strike. The reduction in amplitude recorded by the panel embedded array is due to sound absorption by the acoustic resonators inside the panel. AdBm Butendiek Demonstration Report, 2014 AdBm Corp 6
7 Peak Sound Pressure Levels (SPL) The broadband peak sound pressure levels were determined for each individual pile strike at each test location using the standard definition: where p is sound pressure and a reference pressure of 1 µpa was used. The peak SPL is expressed in db referenced to 1 µpa. For a single measurement location peak levels for all strikes and hydrophones used were averaged to provide a degree of statistical confidence. The peak levels both inside and outside the panel are summarized in Table 1 along with the differences in levels. Pile Range (m) Number of Strikes Baseline (db) Panel (db) Difference (db) Max Reduction (db) BU ± ± ± 2.4* 36.8* BU ± ± ± 2.6* 29.6* * Reduced reduction at 750 m is because noise was fully reduced to ambient noise levels Table 1: Summary of peak SPL values averaged over all strikes at each measurement location. The uncertainties are given by standard deviation for each data set. Also note that for 750 m the received level in the panel was at or below ambient noise levels, so the actual reduction was likely higher than could be measured. A few comments need to be made on the BU-21 results. Only the panel hydrophone array signals recorded at 285 m were significantly above the ambient noise levels. At 750 m away from the monopile strike signal levels received inside the panel were at or below the non-piling ambient noise levels outside the panel. Hence, the apparent reduction at this location is lower than at the 285 m location, but in reality was likely comparable to the reduction measured at 285 m. Because of its high pile-signal to non-pile-noise ratio, the peak SPL values and difference computed from the data recorded at 285 m most accurately reflect the true sound reduction provided by the demonstration panel. The peak SPL values computed for the BU-32 data were severely affected by the aforementioned electrical noise issues, which had contaminated the acoustic signal, so these data are omitted here. The peak SPL data is plotted from both measurement locations along with the non-piling ambient noise levels for reference in Fig. 5. AdBm Butendiek Demonstration Report, 2014 AdBm Corp 7
8 Fig. 5: Peak sound pressure levels average over at least 100 pile strikes at each measurement location vs. range from the monopile. The 285 m and 750 m peak values come from data collected on BU-21. The error bars indicate the standard deviation in the measurements. Non-pile-driving ambient noise measurements are indicated by the grey diamonds with error bars for levels recorded outside the panel (black faces) and inside the panel (red faces). For the 750 m case, it can be seen that the measured levels inside the panel were at the level of ambient noise. One-Third-Octave Band Levels and Reduction To determine the frequency dependence of the sound attenuation provided by the panel, one-thirdoctave band levels were computed from the acoustic data for each pile strike. The raw hydrophone data was sent through a bank of digital filters each with one-third octave bandwidth and center frequencies specified by the most recent ANSI standard 1, and the peak pressure in each band was determined. Ambient noise bands levels were also computed from the quiet gaps in between the pile strikes. All of the third-octave band levels are plotted in Figs. 6 and 7 to show the amount of variation in the recorded data. From the baseline data, the noise radiated from the monopile has a broad peak in approximately the 50 Hz to 300 Hz frequency range, with a particularly sharp peak at 200 Hz, and without much acoustic energy observed above the non-piling ambient noise levels at frequencies of 1 khz and higher. It is assumed that the relatively low band levels at 1 khz and above is due to the effect of the noise 1 ANSI S , Specification for Octave Band and Fractional Octave Band Analog and Digital Filters (2004) AdBm Butendiek Demonstration Report, 2014 AdBm Corp 8

9 abatement treatments already in place at the installation site, while the energy below about 250 Hz is mostly untreated noise. The sharp peak at 200 Hz, which is seen in all of the data during an impact event but not between strikes, is indeed from pile driving and not from other sources such as electrical noise or ship noise, but the tonal characteristics of it are not yet understood. In addition, given this source condition in which the pile driving noise at frequencies above 300 Hz is only about 10 db above the ambient noise, only 10 db of noise abatement can be demonstrated. In this data it is apparent that indeed the levels above 300 Hz have been reduced to the ambient noise, but the demonstrated performance of the system could have been higher given a louder source condition. As demonstrated at the 285 m measurement location (Fig. 6), the demonstration panel reduced the sound levels at all frequencies above approximately 50 Hz. At 750 m away from the monopile (Fig.7), the received pile driving signal is essentially reduced to the non-piling ambient noise levels by the demonstration panel, which is the most reduction possible. Again it is believed that given a louder source condition, demonstrated noise reduction could have been greater. Without Noise Abatement Ambient Noise With Noise Abatement Ambient Noise Fig. 6: One-third-octave band levels for all monopile strikes recorded at the location 285 m away from monopile BU-21. The colored lines are the band levels corresponding to each pile strike. The grey lines are non-pile ambient noise band levels from the quiet sections of data between pile strikes. The horizontal axis is frequency, given in a logarithmic scale. AdBm Butendiek Demonstration Report, 2014 AdBm Corp 9
10 Without Noise Abatement Ambient Noise With Noise Abatement Ambient Noise Fig. 7: One-third-octave band levels for all monopile strikes recorded at the location 750 m away from monopile BU-21. Radiated noise from the monopile was reduced to the local ambient noise levels by the demonstration panel. AdBm Butendiek Demonstration Report, 2014 AdBm Corp 10
11 Fig. 8: Average one-third-octave band level reduction measured at each of the test locations for monopile BU-21. The slightly reduced noise abatement levels at 750 m were due to the fact that the noise was fully reduced to the ambient noise level. Average band level reduction values were computed from the one-third-octave bands to further quantify the attenuation provided by the demonstration panel. These reduction values were calculated for the data taken at 285 m and 750 m away from monopile BU-21 and were averaged over all pile strikes recorded at each location. Band level reduction was computed by subtracting the average band levels measured by the panel array from the average band levels measured by the baseline array, and it is plotted in Fig. 6. Positive values of this quantity correspond to a reduction in sound by the demonstration panel. The peak reduction occurs at in the band centered near 100 Hz, indicating that the part of the pile noise signals at this frequency were reduced on average by 36.8 db at the 285 m measurement location. The peak reduction occurs at this frequency because the acoustic resonators used in the demonstration panel were designed to resonate near 100 Hz and provide the most attenuation here. As seen in Fig. 6, the peak noise radiated by the pile also occurs near 100 Hz, coinciding with the highest reduction levels. The resonators were designed to target the peak frequencies associated with a pile driving noise source. The peak reduction calculated at the 750 m location was limited to 29.6 db; however, this is an artifact of the pile driving signal being buried in the ambient noise at these frequencies at this measurement location, as can be seen in Fig. 5. At the lowest frequencies the calculated band level reduction becomes negative, indicating a level increase. This can also be seen as the low frequency oscillation in the panel hydrophone signal in Fig. 4. Below the resonance frequency of the individual acoustic resonators in the demonstration panel, a collective AdBm Butendiek Demonstration Report, 2014 AdBm Corp 11
12 resonance of the entire panel is excited and the incoming sound wave can be coherently scattered, resulting in a net increase in sound pressure. This is a well-known phenomenon from the field of bubble acoustics 2. Fortunately, there is not much sound energy in the pile driving noise spectrum below 50 Hz so there is very little noise at low frequencies to be amplified. Furthermore, a full-sized panel would be much larger than the demonstration panel, and since the collective panel resonance scales inversely with panel size, that mode would be shifted to much lower frequencies where no sound energy would be present to excite it. Sound Exposure Level The total SEL measured at 285 m and 750 m was not reported here because the pile driving noise had already been treated by two noise abatement systems before it reached our test setup and the resulting SELs would be extraordinarily low. In the case of 750 m, it would be down to or even below the ambient noise level of the North Sea, and we decided that this information did not reflect the system s actual performance. Instead, sound pressure level reduction was our focus since we wanted to focus on just the effects of our noise abatement system. In doing so we determined the instantaneous level reduction as a function of frequency, which is a result that can be widely applied to predictions of future performance. For example, once it s known how the system filters the sound from the pile, that effect can be applied to any signal and propagated to a set distance using standard propagation models. At that point, the resulting SEL can be calculated. For future demonstrations in which the pile is untreated, source measurements will be taken very near the pile and we will produce estimated SEL levels at both 285 m and 750 m, as well as any other distances of interest. Conclusions A demonstration of the AdBm Technologies underwater noise abatement system at the Butendiek Offshore Wind Farm was described and the acoustic results were analyzed. The panel-based noise abatement system was deployed and recovered four times without incident in the North Sea. The acoustic data collected from the tests showed peak attenuation of up to 36.8 db when measured at 285 m and 29.6 db at 750 m. In both cases however it is expected that the actual overall reductions could have been larger given higher source levels, since in many cases the panel reduced the noise as much as possible, i.e., to the ambient levels, which at frequencies above 300 Hz were only 10 db above the ambient noise at the most. The results from this test strongly suggest that this system alone will be sufficient to meet the required sound exposure level of 160 db at 750 m. 2 A. Prosperetti, Bubble-related ambient noise in the ocean, J. Acoust. Soc. Am. 84, 1042 (1988).; W. M. Carey, Low-frequency noise and bubble plume oscillations, J. Acoust. Soc. Am. 82, 78 (1985). AdBm Butendiek Demonstration Report, 2014 AdBm Corp 12
13 Lessons Learned from Demonstration Deployment 1. For the demonstration panel we are limited to 2 meter sea swells: since the demonstration panel does not extend all the way to the sea floor it is subject to heaving up and down as the ship s crane moves due to wave action. This will not be an issue with production units as they will extend to and be anchored on the sea floor, yet still in this environment the panel was able to handle the extra stresses. Excess cable payed out at the surface will prevent the panel from being yanked up and down during swells. This issue will be completely eliminated when jack-up vessels are utilized for pile driving as the line will be under tension from the ballast all the way to the vessel mount. 2. Panel design needs to be slightly modified to improve stacking of panel slats when recovering system. When recovering the panel for the second time a large swell hit the panel just as it was being lifted out of the water. The swell picked up all of the slats and the seventh and eighth slats did not nest with each other properly when the swell lowered the slats. Ship heave occurred at the same time as the swell, which amplified the effect of the swell on the panel retrieval. The panel was still easily recoverable, and once on deck we manually lifted the top seven slats and nudged them to nest with the bottom slat. 3. Design of system for maintaining slat separation can be improved. We currently utilize rope to maintain 2 ft. (0.6 m) separation between slats in the panel. In photographs of the panel this is the white rope approximately 1/3 rd of the way in from each end of the panel. Currently the rope is free floating during recovery of the panel and it could potentially wrap around a resonator causing damage on subsequent deployments. After each deployment we manually dressed the rope to ensure it was not entangled inside the panel and didn t see this issue occur. This postdeployment procedure was intended for the low-cost, small-scale demonstration panel, which was easily accessible by the research crew on the deck of the deployment vessel; however, the full-scale panel design will avoid the need to redress lines after each deployment. 4. Electrical interference from the ship s AC power system induced significant electrical noise into the measuring equipment. Remedy: for the first monopile we utilized a custom-built, lownoise, two-channel hydrophone power supply, which we had brought as a backup and which minimized the electrical interference. This hydrophone power supply allowed us to collect data from two consecutive hydrophones rather than using the full array of six (three in baseline array and three embedded in the panel). During this phase of testing we collected data from four total hydrophones, two each at a time with one in the baseline array and one in the protected area of the noise abatement panel. For the second monopile tested we utilized a pure-sinewave power inverter connected to an automobile battery, which provided extremely clean power, allowing us to use our multichannel (5 channels each) hydrophone power supplies, which had been previously affected by electrical noise when connected to ship power. During this phase we collected data consecutively from six hydrophones: three in the baseline array and three in the protected area of the noise abatement panel. 5. Contrary to automobile batteries in the US, those purchased in the EU are not initially charged. We were unable to utilize the inverter/battery arrangement during the testing of the first monopile because the battery we procured from a local store was not initially charged. We were able to fully charge the battery and utilize it throughout the testing on the second monopile. The battery shall be fully charged prior to setting out on any future demonstrations. 6. The winches used for deploying and recovering the panel did not feed/recover cabling at the same rates, requiring monitoring by operators to ensure the panel was deployed evenly on each side. The pneumatic winches used on the panel were not the ideal solution. Going forward we will use hydraulic winches. AdBm Butendiek Demonstration Report, 2014 AdBm Corp 13
14 7. The brake from one of the pneumatic winches partially released while repositioning the panel from the Mena C to the Svanen, allowing one side of the panel to lower slightly. In the future panels should be secured using cargo straps to prevent unintentional unfurling when moved from one location to another. Lessons Learned/Observations for Full-Scale Utilization 1. When utilizing monopiles with lifting ears as utilized for this project, care needs to be taken to ensure that the AdBm panels do not become entangled with the ears. If monopiles were to be installed while the HLV Svanen were heaving, or if sea currents existed once the ears were under the surface the panel could make contact with the sides of the monopile during deployment, operation, or recovery. Contact with the large ears could result in damage to the noise abatement system. Potential solution: a plastic cap over the ears that prevented the panel from snagging would eliminate the opportunity for entanglement. 2. Engineering work is required for mounting the AdBm system to the Svanen. We looked at the template currently used on the Svanen for potential mounting options. Some mechanical engineering design work is needed to create an optimal deployment method. The current assumption is that a panel designed for 40 meter depth would stack to approximately a 4.5 meter height when fully collapsed, and that a total of five panels would be used: three that are either 10 meters or 12 meters in width, and two that are 6 meters. 3. Pneumatic winches are not ideal for our solution. Based on feedback from vessel personnel we will use hydraulic winches on future designs. Contact Information Mark W. Coplen Vice President of Sales, AdBm Technologies 3925 W. Braker Ln, 3 rd Floor Austin, TX mark.coplen@adbmtech.com +1 (512) AdBm Butendiek Demonstration Report, 2014 AdBm Corp 14
Signal to noise the key to increased marine seismic bandwidth
 Signal to noise the key to increased marine seismic bandwidth R. Gareth Williams 1* and Jon Pollatos 1 question the conventional wisdom on seismic acquisition suggesting that wider bandwidth can be achieved
Getting Started with the LabVIEW Sound and Vibration Toolkit
 1 Getting Started with the LabVIEW Sound and Vibration Toolkit This tutorial is designed to introduce you to some of the sound and vibration analysis capabilities in the industry-leading software tool
Localization of Noise Sources in Large Structures Using AE David W. Prine, Northwestern University ITI, Evanston, IL, USA
 Localization of Noise Sources in Large Structures Using AE David W. Prine, Northwestern University ITI, Evanston, IL, USA Abstract This paper describes application of AE monitoring techniques to localize
White Paper JBL s LSR Principle, RMC (Room Mode Correction) and the Monitoring Environment by John Eargle. Introduction and Background:
 and the Monitoring Environment by John Eargle. Introduction and Background:") White Paper JBL s LSR Principle, RMC (Room Mode Correction) and the Monitoring Environment by John Eargle Introduction and Background: Although a loudspeaker may measure flat on-axis under anechoic conditions,
White Paper JBL s LSR Principle, RMC (Room Mode Correction) and the Monitoring Environment by John Eargle Introduction and Background: Although a loudspeaker may measure flat on-axis under anechoic conditions,
SC24 Magnetic Field Cancelling System
 SPICER CONSULTING SYSTEM SC24 SC24 Magnetic Field Cancelling System Makes the ambient magnetic field OK for the electron microscope Adapts to field changes within 100 µs Touch screen intelligent user interface
SC24 Magnetic Field Cancelling System
 SPICER CONSULTING SYSTEM SC24 SC24 Magnetic Field Cancelling System Makes the ambient magnetic field OK for the electron microscope Adapts to field changes within 100 µs Touch screen intelligent user interface
THE EFFECT OF PERFORMANCE STAGES ON SUBWOOFER POLAR AND FREQUENCY RESPONSES
 THE EFFECT OF PERFORMANCE STAGES ON SUBWOOFER POLAR AND FREQUENCY RESPONSES AJ Hill Department of Electronics, Computing & Mathematics, University of Derby, UK J Paul Department of Electronics, Computing
Techniques for Extending Real-Time Oscilloscope Bandwidth
 Techniques for Extending Real-Time Oscilloscope Bandwidth Over the past decade, data communication rates have increased by a factor well over 10X. Data rates that were once 1Gb/sec and below are now routinely
Assessing and Measuring VCR Playback Image Quality, Part 1. Leo Backman/DigiOmmel & Co.
 Assessing and Measuring VCR Playback Image Quality, Part 1. Leo Backman/DigiOmmel & Co. Assessing analog VCR image quality and stability requires dedicated measuring instruments. Still, standard metrics
UB22z Specifications. 2-WAY COMPACT FULL-RANGE See NOTES TABULAR DATA for details CONFIGURATION Subsystem DESCRIPTION
 DESCRIPTION Ultra-compact 2-way system Wide projection pattern LF on angled baffles to maintain a wide upper/midrange beamwidth High output, high definition sound DESCRIPTION The UB22z is engineered for
DAT335 Music Perception and Cognition Cogswell Polytechnical College Spring Week 6 Class Notes
 DAT335 Music Perception and Cognition Cogswell Polytechnical College Spring 2009 Week 6 Class Notes Pitch Perception Introduction Pitch may be described as that attribute of auditory sensation in terms
FLOW INDUCED NOISE REDUCTION TECHNIQUES FOR MICROPHONES IN LOW SPEED WIND TUNNELS
 SENSORS FOR RESEARCH & DEVELOPMENT WHITE PAPER #42 FLOW INDUCED NOISE REDUCTION TECHNIQUES FOR MICROPHONES IN LOW SPEED WIND TUNNELS Written By Dr. Andrew R. Barnard, INCE Bd. Cert., Assistant Professor
A Matlab toolbox for. Characterisation Of Recorded Underwater Sound (CHORUS) USER S GUIDE
 USER S GUIDE") Centre for Marine Science and Technology A Matlab toolbox for Characterisation Of Recorded Underwater Sound (CHORUS) USER S GUIDE Version 5.0b Prepared for: Centre for Marine Science and Technology Prepared
Centre for Marine Science and Technology A Matlab toolbox for Characterisation Of Recorded Underwater Sound (CHORUS) USER S GUIDE Version 5.0b Prepared for: Centre for Marine Science and Technology Prepared
Clock Jitter Cancelation in Coherent Data Converter Testing
 Clock Jitter Cancelation in Coherent Data Converter Testing Kars Schaapman, Applicos Introduction The constantly increasing sample rate and resolution of modern data converters makes the test and characterization
THE DIGITAL DELAY ADVANTAGE A guide to using Digital Delays. Synchronize loudspeakers Eliminate comb filter distortion Align acoustic image.
 THE DIGITAL DELAY ADVANTAGE A guide to using Digital Delays Synchronize loudspeakers Eliminate comb filter distortion Align acoustic image Contents THE DIGITAL DELAY ADVANTAGE...1 - Why Digital Delays?...
Multiband Noise Reduction Component for PurePath Studio Portable Audio Devices
 Multiband Noise Reduction Component for PurePath Studio Portable Audio Devices Audio Converters ABSTRACT This application note describes the features, operating procedures and control capabilities of a
Calibrating Measuring Microphones and Sound Sources for Acoustic Measurements with Audio Analyzer R&S UPV
 Product: R&S UPV Calibrating Measuring Microphones and Sound Sources for Acoustic Measurements with Audio Analyzer R&S UPV Application Note 1GA47_0E This application note explains how to use acoustic calibrations
Using the BHM binaural head microphone
 11/17 Using the binaural head microphone Introduction 1 Recording with a binaural head microphone 2 Equalization of a recording 2 Individual equalization curves 5 Using the equalization curves 5 Post-processing
REPORT DOCUMENTATION PAGE
 REPORT DOCUMENTATION PAGE Form Approved OMB No. 0704-0188 Public reporting burden for this collection of information is estimated to average 1 hour per response, including the time for reviewing instructions,
CLASSROOM ACOUSTICS OF MCNEESE STATE UNIVER- SITY
 CLASSROOM ACOUSTICS OF MCNEESE STATE UNIVER- SITY Aash Chaudhary and Zhuang Li McNeese State University, Department of Chemical, Civil, and Mechanical Engineering, Lake Charles, LA, USA email: zli@mcneese.edu
Mastering Phase Noise Measurements (Part 3)
") Mastering Phase Noise Measurements (Part 3) Application Note Whether you are new to phase noise or have been measuring phase noise for years it is important to get a good understanding of the basics and
Mastering Phase Noise Measurements (Part 3) Application Note Whether you are new to phase noise or have been measuring phase noise for years it is important to get a good understanding of the basics and
The Syscal family of resistivity meters. Designed for the surveys you do.
 The Syscal family of resistivity meters. Designed for the surveys you do. Resistivity meters may conveniently be broken down into several categories according to their capabilities and applications. The
HEAD. HEAD VISOR (Code 7500ff) Overview. Features. System for online localization of sound sources in real time
 Overview. Features. System for online localization of sound sources in real time") HEAD Ebertstraße 30a 52134 Herzogenrath Tel.: +49 2407 577-0 Fax: +49 2407 577-99 email: info@head-acoustics.de Web: www.head-acoustics.de Data Datenblatt Sheet HEAD VISOR (Code 7500ff) System for online
HEAD Ebertstraße 30a 52134 Herzogenrath Tel.: +49 2407 577-0 Fax: +49 2407 577-99 email: info@head-acoustics.de Web: www.head-acoustics.de Data Datenblatt Sheet HEAD VISOR (Code 7500ff) System for online
GG450 4/12/2010. Today s material comes from p in the text book. Please read and understand all of this material!
 GG450 April 13, 2010 Seismic Reflection III Data Processing Today s material comes from p. 163-198 in the text book. Please read and understand all of this material! Reflection Processing We've been talking
DELTA MODULATION AND DPCM CODING OF COLOR SIGNALS
 DELTA MODULATION AND DPCM CODING OF COLOR SIGNALS Item Type text; Proceedings Authors Habibi, A. Publisher International Foundation for Telemetering Journal International Telemetering Conference Proceedings
MIE 402: WORKSHOP ON DATA ACQUISITION AND SIGNAL PROCESSING Spring 2003
 MIE 402: WORKSHOP ON DATA ACQUISITION AND SIGNAL PROCESSING Spring 2003 OBJECTIVE To become familiar with state-of-the-art digital data acquisition hardware and software. To explore common data acquisition
Instrumentation Grade RF & Microwave Subsystems
 Instrumentation Grade RF & Microwave Subsystems PRECISION FREQUENCY TRANSLATION SignalCore s frequency translation products are designed to meet today s demanding wireless applications. Offered in small
Results of the June 2000 NICMOS+NCS EMI Test
 Results of the June 2 NICMOS+NCS EMI Test S. T. Holfeltz & Torsten Böker September 28, 2 ABSTRACT We summarize the findings of the NICMOS+NCS EMI Tests conducted at Goddard Space Flight Center in June
Measurement of overtone frequencies of a toy piano and perception of its pitch
 Measurement of overtone frequencies of a toy piano and perception of its pitch PACS: 43.75.Mn ABSTRACT Akira Nishimura Department of Media and Cultural Studies, Tokyo University of Information Sciences,
DSP Monitoring Systems. dsp GLM. AutoCal TM
 DSP Monitoring Systems dsp GLM AutoCal TM Genelec DSP Systems - 8200 bi-amplified monitor loudspeakers and 7200 subwoofers For decades Genelec has measured, analyzed and calibrated its monitoring systems
Please feel free to download the Demo application software from analogarts.com to help you follow this seminar.
 Hello, welcome to Analog Arts spectrum analyzer tutorial. Please feel free to download the Demo application software from analogarts.com to help you follow this seminar. For this presentation, we use a
Advanced Techniques for Spurious Measurements with R&S FSW-K50 White Paper
 Advanced Techniques for Spurious Measurements with R&S FSW-K50 White Paper Products: ı ı R&S FSW R&S FSW-K50 Spurious emission search with spectrum analyzers is one of the most demanding measurements in
Technical Data. HF Tuner WJ-9119 WATKINS-JOHNSON. Features
 May 1996 Technical Data WATKINS-JOHNSON HF Tuner WJ-9119 WJ designed the WJ-9119 HF Tuner for applications requiring maximum dynamic range. The tuner specifically interfaces with the Hewlett-Packard E1430A
Interface Practices Subcommittee SCTE STANDARD SCTE Measurement Procedure for Noise Power Ratio
 Interface Practices Subcommittee SCTE STANDARD SCTE 119 2018 Measurement Procedure for Noise Power Ratio NOTICE The Society of Cable Telecommunications Engineers (SCTE) / International Society of Broadband
Getting started with Spike Recorder on PC/Mac/Linux
 Getting started with Spike Recorder on PC/Mac/Linux You can connect your SpikerBox to your computer using either the blue laptop cable, or the green smartphone cable. How do I connect SpikerBox to computer
Loudness and Sharpness Calculation
 10/16 Loudness and Sharpness Calculation Psychoacoustics is the science of the relationship between physical quantities of sound and subjective hearing impressions. To examine these relationships, physical
DETECTING ENVIRONMENTAL NOISE WITH BASIC TOOLS
 DETECTING ENVIRONMENTAL NOISE WITH BASIC TOOLS By Henrik, September 2018, Version 2 Measuring low-frequency components of environmental noise close to the hearing threshold with high accuracy requires
Model 7330 Signal Source Analyzer Dedicated Phase Noise Test System V1.02
 Model 7330 Signal Source Analyzer Dedicated Phase Noise Test System V1.02 A fully integrated high-performance cross-correlation signal source analyzer from 5 MHz to 33+ GHz Key Features Complete broadband
Using the new psychoacoustic tonality analyses Tonality (Hearing Model) 1
 1") 02/18 Using the new psychoacoustic tonality analyses 1 As of ArtemiS SUITE 9.2, a very important new fully psychoacoustic approach to the measurement of tonalities is now available., based on the Hearing
02/18 Using the new psychoacoustic tonality analyses 1 As of ArtemiS SUITE 9.2, a very important new fully psychoacoustic approach to the measurement of tonalities is now available., based on the Hearing
Hugo Technology. An introduction into Rob Watts' technology
 Hugo Technology An introduction into Rob Watts' technology Copyright Rob Watts 2014 About Rob Watts Audio chip designer both analogue and digital Consultant to silicon chip manufacturers Designer of Chord
Signal Stability Analyser
 Signal Stability Analyser o Real Time Phase or Frequency Display o Real Time Data, Allan Variance and Phase Noise Plots o 1MHz to 65MHz medium resolution (12.5ps) o 5MHz and 10MHz high resolution (50fs)
Troubleshooting EMI in Embedded Designs White Paper
 Troubleshooting EMI in Embedded Designs White Paper Abstract Today, engineers need reliable information fast, and to ensure compliance with regulations for electromagnetic compatibility in the most economical
Natural Radio. News, Comments and Letters About Natural Radio January 2003 Copyright 2003 by Mark S. Karney
 Natural Radio News, Comments and Letters About Natural Radio January 2003 Copyright 2003 by Mark S. Karney Recorders for Natural Radio Signals There has been considerable discussion on the VLF_Group of
Monitoring Of Drag Anchor Embedment Parameters. Roderick Ruinen, Vryhof Anchors BV
 Monitoring Of Drag Anchor Embedment Parameters. Roderick Ruinen, Vryhof Anchors BV Introduction. Drag embedment anchor installation typically consists of applying a pre-determined load to the mooring line
MODEL PA II-R (1995-MSRP $549.00)
") F O R T H E L O V E O F M U S I C MODEL PA II-R (1995-MSRP $549.00) OWNER'S MANUAL AND INSTALLATION GUIDE INTRODUCTION To aid in the exciting and custom installs which installers are performing all over
F O R T H E L O V E O F M U S I C MODEL PA II-R (1995-MSRP $549.00) OWNER'S MANUAL AND INSTALLATION GUIDE INTRODUCTION To aid in the exciting and custom installs which installers are performing all over
Proceedings of Meetings on Acoustics
 Proceedings of Meetings on Acoustics Volume 12, 2011 http://acousticalsociety.org/ 161th Meeting Acoustical Society of America Seattle, Washington 23-27 May 2011 Session 3aSP: Signal Processing in Acoustics
INSTRUCTION SHEET FOR NOISE MEASUREMENT
 Customer Information INSTRUCTION SHEET FOR NOISE MEASUREMENT Page 1 of 16 Carefully read all instructions and warnings before recording noise data. Call QRDC at 952-556-5205 between 9:00 am and 5:00 pm
Practical Application of the Phased-Array Technology with Paint-Brush Evaluation for Seamless-Tube Testing
 ECNDT 2006 - Th.1.1.4 Practical Application of the Phased-Array Technology with Paint-Brush Evaluation for Seamless-Tube Testing R.H. PAWELLETZ, E. EUFRASIO, Vallourec & Mannesmann do Brazil, Belo Horizonte,
Song Meter SM2M Marine Recorder User Manual. Wildlife Acoustics, Inc.
 Song Meter SM2M Marine Recorder User Manual Wildlife Acoustics, Inc. www.wildlifeacoustics.com Copyright 2012 Wildlife Acoustics, Inc. Rev. 5/24/12 All rights reserved. Wildlife Acoustics is registered
DA E: Series of Narrowband or Wideband Distribution Amplifiers
 DA1-150-10-E: Series of Narrowband or Wideband Distribution Amplifiers Key Features Dual A and B inputs. Automatic or manual switchover, configured by the Ethernet port. 1-150 MHz wideband operation. Other
SC26 Magnetic Field Cancelling System
 SPICER CONSULTING SYSTEM SC26 SC26 Magnetic Field Cancelling System Makes the ambient magnetic field OK for electron beam tools in 300 mm wafer fabs Real time, wideband cancelling from DC to > 9 khz fields
Boosting Performance Oscilloscope Versatility, Scalability
 Boosting Performance Oscilloscope Versatility, Scalability Rising data communication rates are driving the need for very high-bandwidth real-time oscilloscopes in the range of 60-70 GHz. These instruments
Data flow architecture for high-speed optical processors
 Data flow architecture for high-speed optical processors Kipp A. Bauchert and Steven A. Serati Boulder Nonlinear Systems, Inc., Boulder CO 80301 1. Abstract For optical processor applications outside of
DP1 DYNAMIC PROCESSOR MODULE OPERATING INSTRUCTIONS
 DP1 DYNAMIC PROCESSOR MODULE OPERATING INSTRUCTIONS and trouble-shooting guide LECTROSONICS, INC. Rio Rancho, NM INTRODUCTION The DP1 Dynamic Processor Module provides complete dynamic control of signals
Benchtop Portability with ATE Performance
 Benchtop Portability with ATE Performance Features: Configurable for simultaneous test of multiple connectivity standard Air cooled, 100 W power consumption 4 RF source and receive ports supporting up
7000 Series Signal Source Analyzer & Dedicated Phase Noise Test System
 7000 Series Signal Source Analyzer & Dedicated Phase Noise Test System A fully integrated high-performance cross-correlation signal source analyzer with platforms from 5MHz to 7GHz, 26GHz, and 40GHz Key
PCM ENCODING PREPARATION... 2 PCM the PCM ENCODER module... 4
 PCM ENCODING PREPARATION... 2 PCM... 2 PCM encoding... 2 the PCM ENCODER module... 4 front panel features... 4 the TIMS PCM time frame... 5 pre-calculations... 5 EXPERIMENT... 5 patching up... 6 quantizing
StepArray+ Self-powered digitally steerable column loudspeakers
 StepArray+ Self-powered digitally steerable column loudspeakers Acoustics and Audio When I started designing the StepArray range in 2006, I wanted to create a product that would bring a real added value
DISTRIBUTION AMPLIFIER
 MANUAL PART NUMBER: 400-0045-005 DA1907SX 1-IN, 2-OUT VGA/SVGA/XGA/UXGA DISTRIBUTION AMPLIFIER USER S GUIDE TABLE OF CONTENTS Page PRECAUTIONS / SAFETY WARNINGS... 2 GENERAL...2 GUIDELINES FOR RACK-MOUNTING...2
Electrical and Electronic Laboratory Faculty of Engineering Chulalongkorn University. Cathode-Ray Oscilloscope (CRO)
") 2141274 Electrical and Electronic Laboratory Faculty of Engineering Chulalongkorn University Cathode-Ray Oscilloscope (CRO) Objectives You will be able to use an oscilloscope to measure voltage, frequency
2141274 Electrical and Electronic Laboratory Faculty of Engineering Chulalongkorn University Cathode-Ray Oscilloscope (CRO) Objectives You will be able to use an oscilloscope to measure voltage, frequency
THE KARLSON REPRODUCER
 THE KARLSON REPRODUCER The following is a description of a speaker enclosure that at one stage was at the centre of attention in the US because of its reputedly favourable characteristics. The reader is
The Distortion Magnifier
 The Distortion Magnifier Bob Cordell January 13, 2008 Updated March 20, 2009 The Distortion magnifier described here provides ways of measuring very low levels of THD and IM distortions. These techniques
How to Obtain a Good Stereo Sound Stage in Cars
 Page 1 How to Obtain a Good Stereo Sound Stage in Cars Author: Lars-Johan Brännmark, Chief Scientist, Dirac Research First Published: November 2017 Latest Update: November 2017 Designing a sound system
CTP 431 Music and Audio Computing. Basic Acoustics. Graduate School of Culture Technology (GSCT) Juhan Nam
 Juhan Nam") CTP 431 Music and Audio Computing Basic Acoustics Graduate School of Culture Technology (GSCT) Juhan Nam 1 Outlines What is sound? Generation Propagation Reception Sound properties Loudness Pitch Timbre
CTP 431 Music and Audio Computing Basic Acoustics Graduate School of Culture Technology (GSCT) Juhan Nam 1 Outlines What is sound? Generation Propagation Reception Sound properties Loudness Pitch Timbre
FCC PART 15 CLASS B MEASUREMENT AND TEST REPORT. Tritech Technology Ltd.
 FCC PART 15 CLASS B MEASUREMENT AND TEST REPORT For Tritech Technology Ltd. Unit 8B,Chung pont Commercial Building No.300 Hennessy Road, Wanchai, HongKong Model: 0-545-24967-8, 0-545-24986-4 Report Type:
TL-2900 AMMONIA & NITRATE ANALYZER DUAL CHANNEL
 TL-2900 AMMONIA & NITRATE ANALYZER DUAL CHANNEL DATA ACQUISITION SYSTEM V.15.4 INSTRUCTION MANUAL Timberline Instruments, LLC 1880 S. Flatiron Ct., Unit I Boulder, Colorado 80301 Ph: (303) 440-8779 Fx:
Using Extra Loudspeakers and Sound Reinforcement
 1 SX80, Codec Pro A guide to providing a better auditory experience Produced: December 2018 for CE9.6 2 Contents What s in this guide Contents Introduction...3 Codec SX80: Use with Extra Loudspeakers (I)...4
ECE 4220 Real Time Embedded Systems Final Project Spectrum Analyzer
 ECE 4220 Real Time Embedded Systems Final Project Spectrum Analyzer by: Matt Mazzola 12222670 Abstract The design of a spectrum analyzer on an embedded device is presented. The device achieves minimum
Application Note AN-708 Vibration Measurements with the Vibration Synchronization Module
 Application Note AN-708 Vibration Measurements with the Vibration Synchronization Module Introduction The vibration module allows complete analysis of cyclical events using low-speed cameras. This is accomplished
Design Project: Designing a Viterbi Decoder (PART I)
") Digital Integrated Circuits A Design Perspective 2/e Jan M. Rabaey, Anantha Chandrakasan, Borivoje Nikolić Chapters 6 and 11 Design Project: Designing a Viterbi Decoder (PART I) 1. Designing a Viterbi
Digital Integrated Circuits A Design Perspective 2/e Jan M. Rabaey, Anantha Chandrakasan, Borivoje Nikolić Chapters 6 and 11 Design Project: Designing a Viterbi Decoder (PART I) 1. Designing a Viterbi
GALILEO Timing Receiver
 GALILEO Timing Receiver The Space Technology GALILEO Timing Receiver is a triple carrier single channel high tracking performances Navigation receiver, specialized for Time and Frequency transfer application.
White Paper Measuring and Optimizing Sound Systems: An introduction to JBL Smaart
 White Paper Measuring and Optimizing Sound Systems: An introduction to JBL Smaart by Sam Berkow & Alexander Yuill-Thornton II JBL Smaart is a general purpose acoustic measurement and sound system optimization
DT9857E. Key Features: Dynamic Signal Analyzer for Sound and Vibration Analysis Expandable to 64 Channels
 DT9857E Dynamic Signal Analyzer for Sound and Vibration Analysis Expandable to 64 Channels The DT9857E is a high accuracy dynamic signal acquisition module for noise, vibration, and acoustic measurements
Sensor Development for the imote2 Smart Sensor Platform
 Sensor Development for the imote2 Smart Sensor Platform March 7, 2008 2008 Introduction Aging infrastructure requires cost effective and timely inspection and maintenance practices The condition of a structure
Application Note AN-LD09 Rev. B Troubleshooting Low Noise Systems. April, 2015 Page 1 NOISE MEASUREMENT SYSTEM BASELINES INTRODUCTION
 Troubleshooting Low Noise Systems April, 2015 Page 1 INTRODUCTION The exceedingly low level of electronic noise produced by the QCL family of drivers makes narrower linewidths and stable center wavelengths
PulseCounter Neutron & Gamma Spectrometry Software Manual
 PulseCounter Neutron & Gamma Spectrometry Software Manual MAXIMUS ENERGY CORPORATION Written by Dr. Max I. Fomitchev-Zamilov Web: maximus.energy TABLE OF CONTENTS 0. GENERAL INFORMATION 1. DEFAULT SCREEN
clipping; yellow LED lights when limiting action occurs. Input Section Features
 ELX-1A Rack-Mount Mic/Line Mixer Four inputs, one output in a single rack space Very-highery-high-quality audio performance High reliability Extensive filtering circuitry and shielding protect against
Vibration Measurement and Analysis
 Measurement and Analysis Why Analysis Spectrum or Overall Level Filters Linear vs. Log Scaling Amplitude Scales Parameters The Detector/Averager Signal vs. System analysis The Measurement Chain Transducer
CHAPTER 8 CONCLUSION AND FUTURE SCOPE
 124 CHAPTER 8 CONCLUSION AND FUTURE SCOPE Data hiding is becoming one of the most rapidly advancing techniques the field of research especially with increase in technological advancements in internet and
2 MHz Lock-In Amplifier
 2 MHz Lock-In Amplifier SR865 2 MHz dual phase lock-in amplifier SR865 2 MHz Lock-In Amplifier 1 mhz to 2 MHz frequency range Dual reference mode Low-noise current and voltage inputs Touchscreen data display
Concept of Operations (CONOPS)
") PRODUCT 0-6873-P1 TxDOT PROJECT NUMBER 0-6873 Concept of Operations (CONOPS) Jorge A. Prozzi Christian Claudel Andre Smit Praveen Pasupathy Hao Liu Ambika Verma June 2016; Published March 2017 http://library.ctr.utexas.edu/ctr-publications/0-6873-p1.pdf
PRODUCT 0-6873-P1 TxDOT PROJECT NUMBER 0-6873 Concept of Operations (CONOPS) Jorge A. Prozzi Christian Claudel Andre Smit Praveen Pasupathy Hao Liu Ambika Verma June 2016; Published March 2017 http://library.ctr.utexas.edu/ctr-publications/0-6873-p1.pdf
FCC Part 15 Subpart B Test Report. FCC PART 15 Subpart B Class B: 2014
 Shenzhen CTL Electromagnetic Technology Co., Ltd. Tel: +86-755-89486194 Fax: +86-755-26636041 FCC Part 15 Subpart B Test Report FCC PART 15 Subpart B Class B: 2014 Report Reference No...: CTL1408272147-F
Re: ENSC 370 Project Physiological Signal Data Logger Functional Specifications
 School of Engineering Science Simon Fraser University V5A 1S6 versatile-innovations@sfu.ca February 12, 1999 Dr. Andrew Rawicz School of Engineering Science Simon Fraser University Burnaby, BC V5A 1S6
Psychoacoustic Evaluation of Fan Noise
 Psychoacoustic Evaluation of Fan Noise Dr. Marc Schneider Team Leader R&D - Acoustics ebm-papst Mulfingen GmbH & Co.KG Carolin Feldmann, University Siegen Outline Motivation Psychoacoustic Parameters Psychoacoustic
Underwater Noise Levels
 TO: FROM: Rick Huey Jim Laughlin (206) 440-4643 SUBJECT: Port Townsend Dolphin Timber Pile Removal Vibratory Pile Monitoring Technical Memorandum. Underwater Noise Levels This memo summarizes the vibratory
Full Disclosure Monitoring
 Full Disclosure Monitoring Power Quality Application Note Full Disclosure monitoring is the ability to measure all aspects of power quality, on every voltage cycle, and record them in appropriate detail
Aerial Cable Installation Best Practices
 Aerial Cable Installation Best Practices Panduit Corp. 2007 BEST PRACTICES Table of Contents 1.0 General... 3 2.0 Introduction... 3 3.0 Precautions... 4 4.0 Pre-survey... 5 5.0 Materials and Equipment...
APPLICATIONS OF DIGITAL IMAGE ENHANCEMENT TECHNIQUES FOR IMPROVED
 APPLICATIONS OF DIGITAL IMAGE ENHANCEMENT TECHNIQUES FOR IMPROVED ULTRASONIC IMAGING OF DEFECTS IN COMPOSITE MATERIALS Brian G. Frock and Richard W. Martin University of Dayton Research Institute Dayton,
PRACTICAL APPLICATION OF THE PHASED-ARRAY TECHNOLOGY WITH PAINT-BRUSH EVALUATION FOR SEAMLESS-TUBE TESTING
 PRACTICAL APPLICATION OF THE PHASED-ARRAY TECHNOLOGY WITH PAINT-BRUSH EVALUATION FOR SEAMLESS-TUBE TESTING R.H. Pawelletz, E. Eufrasio, Vallourec & Mannesmann do Brazil, Belo Horizonte, Brazil; B. M. Bisiaux,
CHARACTERIZATION OF END-TO-END DELAYS IN HEAD-MOUNTED DISPLAY SYSTEMS
 CHARACTERIZATION OF END-TO-END S IN HEAD-MOUNTED DISPLAY SYSTEMS Mark R. Mine University of North Carolina at Chapel Hill 3/23/93 1. 0 INTRODUCTION This technical report presents the results of measurements
Calibrate, Characterize and Emulate Systems Using RFXpress in AWG Series
 Calibrate, Characterize and Emulate Systems Using RFXpress in AWG Series Introduction System designers and device manufacturers so long have been using one set of instruments for creating digitally modulated
POSITIONING SUBWOOFERS
 POSITIONING SUBWOOFERS PRINCIPLE CONSIDERATIONS Lynx Pro Audio / Technical documents When you arrive to a venue and see the Front of House you can find different ways how subwoofers are placed. Sometimes
SNG-2150C User s Guide
 SNG-2150C User s Guide Avcom of Virginia SNG-2150C User s Guide 7730 Whitepine Road Revision 001 Richmond, VA 23237 USA GENERAL SAFETY If one or more components of your earth station are connected to 120
Mr. Chris Cocallas University Architect and Director Capital Planning and Construction Colorado School of Mines th St. Golden, Colorado 80401
 Mr. Chris Cocallas University Architect and Director Capital Planning and Construction Colorado School of Mines 1801 19th St. Golden, Colorado 80401 Re: GRL and GRLA Building Noise Study Wave #1434 Dear
Broadcast Television Measurements
 Broadcast Television Measurements Data Sheet Broadcast Transmitter Testing with the Agilent 85724A and 8590E-Series Spectrum Analyzers RF and Video Measurements... at the Touch of a Button Installing,
PS User Guide Series Seismic-Data Display
 PS User Guide Series 2015 Seismic-Data Display Prepared By Choon B. Park, Ph.D. January 2015 Table of Contents Page 1. File 2 2. Data 2 2.1 Resample 3 3. Edit 4 3.1 Export Data 4 3.2 Cut/Append Records
Binaural Measurement, Analysis and Playback
 11/17 Introduction 1 Locating sound sources 1 Direction-dependent and direction-independent changes of the sound field 2 Recordings with an artificial head measurement system 3 Equalization of an artificial
RESOLUTION MSC.333(90) (adopted on 22 May 2012) ADOPTION OF REVISED PERFORMANCE STANDARDS FOR SHIPBORNE VOYAGE DATA RECORDERS (VDRs)
 (adopted on 22 May 2012) ADOPTION OF REVISED PERFORMANCE STANDARDS FOR SHIPBORNE VOYAGE DATA RECORDERS (VDRs)") MSC 90/28/Add.1 Annex 21, page 1 ANNEX 21 RESOLUTION MSC.333(90) THE MARITIME SAFETY COMMITTEE, RECALLING Article 28(b) of the Convention on the International Maritime Organization concerning the functions
MSC 90/28/Add.1 Annex 21, page 1 ANNEX 21 RESOLUTION MSC.333(90) THE MARITIME SAFETY COMMITTEE, RECALLING Article 28(b) of the Convention on the International Maritime Organization concerning the functions
Critical Benefits of Cooled DFB Lasers for RF over Fiber Optics Transmission Provided by OPTICAL ZONU CORPORATION
 Critical Benefits of Cooled DFB Lasers for RF over Fiber Optics Transmission Provided by OPTICAL ZONU CORPORATION Cooled DFB Lasers in RF over Fiber Optics Applications BENEFITS SUMMARY Practical 10 db
Linrad On-Screen Controls K1JT
 Linrad On-Screen Controls K1JT Main (Startup) Menu A = Weak signal CW B = Normal CW C = Meteor scatter CW D = SSB E = FM F = AM G = QRSS CW H = TX test I = Soundcard test mode J = Analog hardware tune