Citizen Advisory Panel on Merriweather Post Pavilion
|
|
|
- Wesley Hubbard
- 5 years ago
- Views:
Transcription
1 Citizen Advisory Panel on Merriweather Post Pavilion Final Report
2 Introduction On August 12, 2004, County Executive Jim Robey signed Executive Order No (attached as Appendix 1), which appointed 16 leaders of the business and arts communities in Howard County to serve on the Merriweather Citizens Advisory Panel (the Panel). He asked the Panel to advise him on whether Howard County (the County) should purchase Merriweather Post Pavilion from The Rouse Company (now General Growth Properties (GGP)), which had announced that Merriweather was for sale provided that the purchaser agrees to meet certain provisions. He asked the Panel to answer five questions: 1. Is there a public service purpose for Howard County to purchase Merriweather Post Pavilion? 2. If there is a public service purpose for the County to purchase Merriweather, what should be the primary purpose of the facility (e.g., a concert venue, an all-purpose arts facility, etc.), what other activities should be permitted and what organizations should have access? 3. Does Merriweather need to be renovated, and if so what type and scope of renovation would be necessary for it to most successfully and effectively achieve the determined primary purpose? 4. What type of management and control structure should be put into place for the operation of this facility? 5. What level of public oversight should exist? In addition, the County solicited proposals for consultant services for a Feasibility study associated with the possible purchase and renovation of Merriweather Post Pavilion. The County received five proposals it deemed to be acceptable. Following interviews with the firms that submitted those proposals, the County hired the team of Ziger/Snead LLP Architects, Webb Management Services, Inc. and Theatre Consultants Collaborative LLC (the Ziger/Snead team) to perform the following tasks: 1) Conduct an industry review; 2) Perform a review of the current operations at Merriweather; 3) Review the physical condition of the venue; 4) Determine whether there are any unmet facility needs in the Howard County arts community; and 5) Prepare a business plan for Merriweather. 1
3 Rouse s (General Growth Properties) Conditions Representatives of Rouse (GGP) indicated in mid 2004 to County Executive Robey that they would consider selling Merriweather to the County, provided certain conditions were met. These conditions included: 1. Venue Merriweather would need to be converted into an indoor venue. 2. Price a purchase price was given, but was not disclosed for public dissemination. 3. Timing a decision would need to be given to GGP before the end of Parking the Crescent property (an undeveloped parcel of approximately 51 acres located south and west of the Merriweather property) would not be available for concert parking in the future. 5. Access once the Crescent property was developed, GGP would ensure that new easements were established to permit continued access to the Merriweather property. 2
4 Executive Summary Following its appointment, the Panel met six times between August of 2004 and February of At the October meeting, the Panel provided an opportunity for the public to speak, and almost all who testified urged the Panel to keep Merriweather as an outdoor concert venue. The Panel heard two presentations from the Ziger/Snead team, who advised that: 1. Based upon the 2004 season results reported by the current operator, I.M.P., Merriweather is profitable and is expected to remain profitable in the future. 2. Merriweather should not be converted into a smaller, enclosed venue because there would be too much competition from similar venues in the region and because the Ziger/Snead team s survey of demand in the region does not indicate a market for such a facility. 3. The County should put a long-term operator in place in order to provide operational, financial and management stability. A number of such public/private partnerships already exist in other parts of the country. 4. The venue needs to be renovated in order to remain functional. These renovations are estimated to cost $19.5 million, could be constructed in phases over a five-year period, and probably could be financed by Merriweather s projected rental income and operating profits. 5. The renovations will help to substantially increase the facility s profits beginning with completion of the second phase of renovations. From discussions at these meetings, the Panel came to envision Merriweather as the key component in the County s long-term ability to meet future requirements of the arts community in Howard County. It anticipates that a series of smaller enclosed venues could be constructed, and potentially privately financed, on the eastern portion of the property. These facilities would not deter from the overall open-air operating capability, but would position Merriweather as a center for the arts, education and culture on a very diverse operating platform. It would be an important cultural force with a regional impact. Also, the importance of the physical improvements recommended by the Ziger/Snead team should be emphasized, because they would preserve the ambiance of Merriweather, enhance its long-term functionality, and help keep it economically viable. However, The Panel does not recommend that the County accept GGP s condition that the operating venue be an enclosed, smaller facility because the regional competition for an enclosed facility would be significant and Merriweather would not be sustainable financially. For that reason the County should proceed with negotiations with GGP only if the company is willing to accept the current open-air venue at its current size. While the current maximum capacity of Merriweather is approximately 19,000, this capacity is seldom utilized. The average attendance, on a successful basis, would be approximately 10,000. However, the ability to provide larger capacity in a unique open-air operating venue is a critical factor in the ongoing future competitive success of Merriweather. In accordance with the Ziger/Snead team s recommendations, the facility needs to be renovated in order to remain functional. The Ziger/Snead team estimates that the renovations would cost $19.5 million. While this amount is substantially less than building a new building, it does concern the Panel that the County, in purchasing the property, would be committing itself to 3
5 this significant financial burden. The Panel believes that the majority of this expense may be covered/financed through entering into a long-term contract with an operator; however, the amount that the operator can afford would not be formalized until such time as the contracts were bid out. A major concern of the Panel is the expected loss of approximately 4,600 on-site parking spaces when GGP develops the adjacent Crescent property on which most of that parking is located. The panel recommends that the County replace those spaces by formalizing the use of existing spaces at the GGP office buildings along the north side of Little Patuxent Parkway and the southern portion of the Mall parking near Merriweather; by constructing a parking garage on nearby property owned by the Columbia Association; or by constructing a parking garage jointly with GGP at the Columbia Mall. Another possible solution could be presented if the Crescent parcel is developed as a mixed-use project such that up to 2,000 vehicles could be accommodated for evening events as part of the eventual build-out of the property. The Panel believes that the increased activity that would come from a mixed use on the Crescent property would help the vitality of the area and of Merriweather. Failure to formalize the available parking agreement with GGP would jeopardize the County s ability to lease out Merriweather to an operator and would severely limit the long-term viability. Without solving the parking capacity issue, the County should not proceed with the purchase of Merriweather. The Panel believes that Merriweather Post Pavilion plays a vital role in the community, that this role should continue, and that in the future the venue s community role could be expanded through the addition of small arts venues on the existing property. These venues would help meet future requirements of the arts community in Howard County by positioning Merriweather as a center for the arts, education and culture and making it an important regional and cultural force. Information provided by the Ziger/Snead team indicates that Merriweather is profitable, that needed renovations to the facility will increase profitability, and that this increased profitability combined with the rent paid by the operator should be sufficient to pay those costs. The Panel recommends that the County consider purchasing Merriweather, but only if it can make suitable arrangements for parking and only if the venue would not constitute a financial burden on the County. Finally, the Panel wants to point out that there is more than one solution to the goal of retaining Merriweather as an important part of the community. County acquisition of the facility is one method, but other possible methods include a public/private partnership in which the County would purchase Merriweather jointly with a private entity, acquisition by a private entity, or even the retention of ownership by GGP. These last two possibilities should be accompanied by an appropriate commitment that eliminates the possibility of Merriweather closing in the future. Regardless of the method used, the Panel feels that it is important to ensure that Merriweather remains an important part of Columbia and Howard County. 4
6 Panel Process The Panel held 6 meetings between August of 2004 and February of 2005, including an October 20 session in Ellicott City where members of the public were invited to address the panel. The Panel began its work on August 31 by hearing from a representative of Merriweather s current owner, The Rouse Company (now General Growth Properties), who provided the conditions of sale previously outlined above. Those reasons included a desire to use the venue on a year-round basis and a belief that the changed demographics of Columbia and the declining number of shows at Merriweather demonstrate that it is no longer a viable outdoor venue. The members also began discussion of whether there is a public purpose for the county to acquire Merriweather; the majority felt that having Merriweather as a public arts venue is clearly in the interest of the public, while some felt that this is an area better left to the private sector. The next Panel meeting was held at Merriweather Post Pavilion on September 22. The panel toured the venue, heard a presentation by general manager Jean Parker on Merriweather s history and the need for renovations, and heard comments by Seth Hurwitz, of current promoter I.M.P. The members discussed the use of Merriweather and agreed that a sharing of the facility between arts uses and an operator of the pavilion would be desirable. There also was discussion as to whether it would be possible to manage Merriweather as both a multi-use arts facility and a concert venue, and whether the addition of separate, small arts venues would be a solution. The desired facilities mentioned included rehearsal space, performance space, exhibit space, and an area for children s art groups, all of which should be affordable, available for year-round use and encourage a bustling arts community with art opportunities for children. On October 20 the Panel met at the George Howard Building in Ellicott City. Howard County Director of Finance Sharon Greisz discussed the County s options for financing the purchase of and capital improvements for Merriweather. The members continued the previous meeting s discussion on the types of uses that should be permitted. The Panel heard from several citizens who stated that Merriweather should be converted to an indoor facility with seating of 2,000 to 3,000. Following the meeting, the Panel held a public hearing to take testimony regarding Merriweather. Approximately 60 people attended the hearing, and almost all who testified urged the Panel to keep Merriweather as an outdoor concert venue. The next Panel meeting was held on December 7 at the Howard County Center for the Arts in Ellicott City. The Ziger/Snead team presented Phase 1 of its report (attached as Appendix 2), which included an industry overview, a review of the operations at Merriweather, and a review of the physical condition of the facility. The Ziger/Snead team concluded that the current Merriweather operation is in good shape, that I.M.P. has improved the physical condition of venue, that the 2004 Merriweather season was profitable, and that the prospects for continued profitability at the venue are good. In addition, the Ziger/Snead team recommended that Merriweather not be converted into a smaller, enclosed venue because there would be too much competition from similar venues in the area and because a survey of demand in the region does not indicate a market for such a facility. On January 11 the Panel met to discuss the issue of parking. Information presented to the members showed that, excluding the spaces available on the adjacent Crescent property owned 5
7 by GGP, there are approximately 4,600 parking spaces located within a half mile of Merriweather, which would provide enough parking for 12,500 patrons. Jean Parker said that this amount of parking is sufficient for most shows, but not for the two to four large shows a year that allow Merriweather to turn a profit for the entire season. A number of possible solutions were discussed, including: constructing a parking garage on adjacent property owned by the Columbia Association, which would be used jointly with the Association; jointly constructing a parking garage with GGP on the Columbia Mall parking lot; requiring GGP to make available at least 2,000 parking spaces as part of their ultimate build-out of the Crescent property; and utilizing unused land owned by the State that is located in an area near Route 29. The final Panel meeting was held on February 22. The Ziger/Snead team presented the business plan for Merriweather (attached as Appendix 3), which concluded that: 1. The County should put a long-term operator in place in order to provide operational stability and management stability. In addition, a long-term contract should allow an operator to pay a higher rent than the current price. 2. The venue needs to be renovated in order to remain functional. These renovations are estimated to cost $19.5 million, could be constructed in phases over a five-year period, and probably could be financed by Merriweather s projected rental income and operating profits. 3. The renovations will help to substantially increase the facility s profits beginning with completion of the second phase of renovations. The Panel formalized its recommendations through and conference calls during the week of February 28 March 4. Finally, it should be noted that the Panel s recommendations represent the view of the majority of the members, but there were minority views on some issues. The Panel s process was one of building consensus while hearing all sides of the issues that were considered, but given the diverse backgrounds and experiences of the members it was not always possible to achieve unanimity. 6
8 Vision The Panel envisions Merriweather as the key component in the County s long-term ability to meet future requirements of the arts community in Howard County. It anticipates that a series of smaller enclosed venues could be constructed, and potentially privately financed, on the eastern portion of the property. These facilities would not deter from the overall open-air operating capability, but would position Merriweather as a center for arts, education and culture on a very diverse operating platform. It would be an important cultural force with a regional impact. In discussing future uses of Merriweather the panel members were emphatic that the current community contributions of the facility (e.g., hosting high school graduation ceremonies, serving as a venue for arts performances) are greatly appreciated in the community, and with the County s ownership the number of reserved dates for such events could be increased. In addition, they feel that it would be possible to expand the number of arts events by managing Merriweather as both a multi-use arts facility and a concert venue. A representative of I.M.P. confirmed that such an arrangement would be feasible regardless of whether the additional arts venues envisioned by the panel are added to the property. The Panel feels that future facilities at Merriweather should include rehearsal space, performance space, exhibit space, and an area for children s art groups, and that these spaces should be affordable, available for year-round use, and encourage a bustling arts community with art opportunities for children. If possible, the future facilities could be financed with the profits produced by continued operation of Merriweather as an outdoor concert venue or alternatively by securing private funding through donations, grants etc. The importance of the physical improvements recommended by the Ziger/Snead team should be emphasized, because they would preserve the ambiance of Merriweather, enhance its long-term functionality, and help keep it economically viable. Operation The Panel does not recommend that the County accept GGP s condition that the operating venue be an enclosed, smaller facility (i.e. 2,000 seats). A need has been identified within the County for additional rehearsal space and for a 400- to 600-seat enclosed theatre. However, the regional competition for a 2,000-seat enclosed facility would be significant and Merriweather would not be sustainable financially. The findings from the Ziger/Snead team, the consultants hired by the County to study Merriweather, support this conclusion. Therefore, the County should proceed with negotiations with GGP only if the company is willing to accept the current open-air venue. While the current maximum capacity of Merriweather is approximately 19,000, this capacity is seldom utilized. The average attendance, on a successful basis, would be approximately 10,000. However, the ability to provide larger 7
9 capacity in a unique open-air operating venue is a critical factor in the ongoing future competitive success of Merriweather. The County should enter into a competitively bid, long-term contract to put an experienced operator in place at Merriweather; this would provide operational, financial and management stability. The Ziger/Snead team discussed with the Panel a number of successful examples of such publicly-owned and privately-managed facilities. Also, a long-term contract should allow an operator to pay a higher rent than the current price, which would in turn increase the County s ability to pay for needed renovations to the facility. Physical Improvements The report by the Ziger/Snead team indicated that the Merriweather facilities are outdated and in need of substantial improvements in order for the venue to remain functional. The Panel members witnessed this need on a walk-through of the facility -- for example, the concrete slabs that underlie the reserved seating areas have deteriorated in a number of locations and the public restrooms have deteriorated due to rot, mold, damaged finishes and plumbing failures. The Ziger/Snead team identified numerous improvements that must be made in order to keep the 38-year-old facility functional. They include: 1. Constructing a new roof for the winged portions of the facility. The winged areas currently are covered by loge tents. These tents are costly to install, dismantle and maintain; replacing them with permanent roofs would reduce the venue s operating costs. Also, the tents guy wires impede the circulation of patrons at ground level and the fixed masts that support the tents obstruct views from the loge seating. 2. Raising the roof of the main stage. The existing roof is not high enough to accommodate the equipment used by many of the performing artists who would attract crowds of 15,000 and up; Merriweather s current operator estimates that a higher roof would substantially increase revenues by allowing the venue to host such performers. This is significant because the current operator stated that hosting two such shows a year enables the venue to be profitable for the entire season, and that the addition of another two or three such shows would generate significant profits. 3. Readjusting grades. The current grades are not optimal, and in some areas (e.g., between the lots and the main gate) the grades are not handicapped accessible. 4. Replacing and reconfiguring the seating base and eliminating the concrete barrier walls to each side of the pavilion. The existing base is deteriorating and needs to be replaced before it becomes a safety problem. The concrete barrier walls also restrict circulation. 5. Constructing new restrooms and concession stands to replace the existing facilities. These facilities are too small, are deteriorating, and have inadequate utilities. In addition, the concession stands have vastly inadequate kitchen areas. 6. Upgrading utilities. The site s water, stormwater, sanitary, electrical and telephone utilities are inadequate, and in some cases close to the end of their useful life, and need to be upgraded or replaced. It is vital that these improvements be made in a manner that retains the ambiance of Merriweather -- time and again the Panel heard from members of the public, the Ziger/Snead 8
10 team, and the venue operators that the nature of Merriweather, especially its wooded setting, is a component that distinguishes it from other concert venues and contributes to its success. During the property s renovations, it must be brought up to the current ADA (Americans with Disabilities Act) standards. It is anticipated that these improvements could be completed over a multi-year period, but once initial improvements are commenced, the grandfathered status of the current facility with regard to ADA standards would be in jeopardy and an improvement program must be formalized. It is important to note that the renovations would need to be phased in over time (Ziger/Snead recommends a five-year period) and would need to be completed in the off-season so that they do not interfere with the venue s operation. The Ziger/Snead team estimates that the renovations would cost $19.5 million. While this amount is substantially less than building a new building, it does concern the Panel that the County, in purchasing the property, would be committing itself to this significant financial burden. The Panel believes that the majority of this expense may be covered/financed through entering into a long-term contract with an operator; however, the amount that the operator can afford would not be formalized until such time as the contracts were bid out. Parking The Panel recommends that, as part of the acquisition negotiations, the County also negotiate formal parking easements with GGP to satisfy the long-term parking requirements of Merriweather. Utilizing a ratio of 2.7 people per vehicle, the average show (attendance of 10,000) would require approximately 3,700 parking spaces. At full capacity of 19,000, this parking requirement increases to approximately 7,000 spaces. Currently, parking for the larger events is achieved by parking on the adjacent 51-acre Crescent parcel, limited on-site VIP parking, adjacent parking easements on Columbia Association-owned land (Symphony Woods) and an informal parking arrangement with GGP-owned office buildings and the mall, both located to the north of Little Patuxent Parkway. With the proposed development of the Crescent parcel, that portion of the parking capacity would be temporarily unavailable and, depending upon the final property use, may not be available at all. The County would need to formalize a parking easement on the Crescent parcel until such time as the property is developed. While some overflow parking would be expected onto the mall property and adjacent businesses during large events (typically only two per year), the majority of the 3,700 parking spaces required for the typical 10,000-seat event could be accommodated as follows: on-site (+/- 500), formalizing an agreement with the Symphony Woods office building owner (Liberty Property Trust) for 340 (+/-) spaces; formalizing an easement agreement with GGP for 10/20/30/40/50/60/70 Columbia Corporate Center, and 10320, Little Patuxent Parkway and the American City Building. This combination, in total, would provide approximately 3,700 spaces within an 8-11 minute walk, assuming evening or weekend events. It should be emphasized that these potential solutions would require the County to obtain additional access easements from the Columbia Association, which owns the property that surrounds Merriweather. 9
11 This capacity does not utilize any of the mall parking and/or office and retail parking to the north and east and beyond the 11-minute walk that would be available for overflow on larger events. It may be that GGP would not be favorably inclined to provide a formal easement agreement for parking on the mall. Therefore, any additional parking requirements that could not be met through formalized agreements with GGP could be met with the construction of parking garages that would require easements from the Columbia Association on the adjacent Symphony Woods property. Preliminary studies indicate that up to 2,500 cars could be located adjacent to the Merriweather property in a newly constructed structured parking garage, at a cost of approximately $7,500 per car (not including land costs). Some portion of this cost could be financed by a small increase in the parking fee that is currently included in the ticket costs. Failure to formalize the available parking agreement with GGP would jeopardize the County s ability to lease out Merriweather to an operator and would severely limit the long-term viability. Without solving the parking capacity issue, the County should not proceed with the purchase of Merriweather. In order to help solve this situation, the Panel believes that it would be desirable that any future development of the Crescent parcel be of a mixed-use type such that up to 2,000 vehicles could be accommodated on evening events, as part of the eventual build out of the property. The Panel believes that the increased activity that would come from a mixed use on the Crescent property would help the vitality of the area and of Merriweather. 10
12 Conclusion The Panel s answers to the county executive s questions are: 1. Is there a public service purpose for Howard County to purchase Merriweather Post Pavilion? Answer Yes. A majority of the Panel feels that Merriweather already serves the community as a cultural arts venue, and that this public service could be increased substantially if the County owns the venue and uses the operating profits to construct a series of small, enclosed venues on the eastern portion of the property. These facilities would not detract from the overall open-air operating capability, but would position Merriweather as a center for the arts, education and culture on a very diverse operating platform. However, the Panel feels strongly that the facility should not be a financial burden on the County and therefore the cost of physical improvements should be funded by the venue s rental income and operating income. Given the financial information provided by the Ziger/Snead team and I.M.P. (attached as Appendix 3), the Panel is comfortable that these costs would be more than covered by the rental and operating income. In keeping with the desire that Merriweather not be a financial burden on the County, the Panel feels that the purchase price should be negotiated to a minimal amount. A somewhat controversial aspect of the Panel s discussion of this subject was the issue of subsidization of the arts -- the Ziger/Snead team advised that a significant number of existing venues around the country need operating subsidies in order to stay open, with some venues receiving public subsidization and some using private fund-raising to supplement their operating budget. However, that concept was rejected by the Panel and, as noted in the previous paragraph, the Panel believes that the venue should be self-supporting. The Panel is aware that the County is seeking approval of state legislation that would allow it to form a revenue authority and that the County may wish to use such an authority to acquire and operate Merriweather. However, the Panel feels that advising the County Executive on the method by which the County should acquire the venue is beyond its purview. 2. If there is a public service purpose for the County to purchase Merriweather, what should be the primary purpose of the facility (e.g., a concert venue, an all-purpose arts facility, etc.), what other activities should be permitted and what organizations should have access? Answer The facility should continue to be operated in its current configuration as an open-air venue. Currently the facility is used for high school graduation ceremonies and for public programs by community-based arts groups. These uses should be continued and opportunities for expanded utilization as a multi-use arts facility should be added as well. If possible, operating profits and rental income could be used to finance the future addition of separate, small arts venues, with the long-term goal of adding facilities to the property to meet the future requirements of the arts community in Howard County. These facilities could also include rehearsal space, performance space, exhibit space, and an area for children s art groups, and if developed should be affordable and available for year-round use. County ownership could provide opportunities for raising private contributions for such facilities. 11
13 3. Does Merriweather need to be renovated, and if so what type and scope of renovation would be necessary for it to most successfully and effectively achieve the determined primary purpose? Answer The venue needs to be renovated in order to remain functional as an outdoor concert venue; it is almost 38 years old and the annual cycle of freeze and thaw has done considerable damage to the facilities. The Ziger/Snead team estimates the cost of the renovations at $19.5 million, but that cost is based on a worst-case scenario and conceivably could be lower. Regardless of the cost, it must be kept in mind that the phasing of the renovations over several years will be necessary in order to pay for the renovations. In addition, the work must be accomplished during the off-season when bad weather could be a problem. The needed improvements and their estimated costs are described in Appendices 2 and 3 of this report. Also, it should be emphasized that the recommended physical improvements are vital, because they would preserve the ambiance of Merriweather, enhance its long-term functionality, and help keep it economically viable. 4. What type of management and control structure should be put into place for the operation of this facility? Answer The County should enter into a competitively bid, long-term contract to put an experienced operator in place at Merriweather; this would provide operational, financial and management stability. The Ziger/Snead team discussed with the Panel a number of successful examples of such publicly-owned and privately-managed facilities. Also, a long-term contract should allow an operator to pay a higher rent than the current price, which would in turn increase the County s ability to pay for needed renovations to the facility. 5. What level of public oversight should exist? Answer The Panel did not discuss this issue in detail, but feels that at a minimum the County should conduct an annual financial audit of the facility s operation in order to protect the county s interests. In addition, any long-term lease would likely include profit sharing override provisions beyond certain profit levels, which would require open book disclosure and certified statements from the selected operator. 12
14 Summary The Panel believes that Merriweather Post Pavilion plays a vital role in the community, that this role should continue, and that in the future the venue s community role should be expanded through the addition of small arts venues on the existing property. These venues would help meet future requirements of the arts community in Howard County by positioning Merriweather as a center for the arts, education and culture and making it an important regional and cultural force. Information provided by the Ziger/Snead team indicates that Merriweather is profitable, that needed renovations to the facility will increase profitability, and that this increased profitability combined with the rent paid by the operator should be sufficient to pay for the renovations. The Panel recommends that the County consider purchasing Merriweather, but only if it can make suitable arrangements for parking and only if the venue would not constitute a financial burden on the County. Finally, the Panel wants to point out that there is more than one solution to the problem of retaining Merriweather as an important part of the community. County acquisition of the facility is one method, but other possible methods include a public/private partnership in which the County would purchase Merriweather jointly with a private entity, acquisition by a private entity, or even the retention of ownership by GGP. These last two possibilities should be accompanied by an appropriate commitment that eliminates the possibility of Merriweather closing in the future. The Panel encourages the County to stay involved in any potential ownership scenario in order to ensure the fulfillment of the Panel s recommendations and that Merriweather continues its role as a key component of the cultural richness of the county. Regardless of the method used, the Panel feels that it is important to ensure that Merriweather remains an important part of Columbia and Howard County. 13
15 Appendix 1 County Executive Of Howard County, Maryland -14- Executive Order: Dated: August 12, 2004 Subject: Advisory Panel on Merriweather Post Pavilion WHEREAS, the Merriweather Post Pavilion in Columbia has been a part of the cultural and social fabric of Howard County since it opened in 1967, hosting a diverse range of artists and events, and offering the best in contemporary entertainment; and WHEREAS, Merriweather was designed by the world-renowned architect Frank Gehry, whose design met the goal of causing the least possible disturbance of the natural topography of the site, and when it opened its acoustics were considered by many in the industry to be the best among outdoor venues; and WHEREAS, Merriweather has contributed to the community in numerous ways, including its tradition of hosting graduation ceremonies for students from Howard Community College and Howard County high schools, its work with non-profit groups, and its contributions to the county s economy as a leading tourism attraction; and WHEREAS, Howard County desires to ensure that Merriweather remains a vital part of the community for many years to come, and to that end plans to study the possibility of acquiring Merriweather Post Pavilion. NOW, THEREFORE, BE IT ORDERED by the County Executive of Howard County, Maryland that an Advisory Panel on the feasibility of acquiring Merriweather Post Pavilion is established. The Panel is responsible for giving advice on the following issues: 1. Is there a public service purpose for Howard County to purchase Merriweather Post Pavilion? 2. If there is a public service purpose for the County to purchase Merriweather, what should be the primary purpose of the facility (e.g., a concert venue, an all-purpose arts facility, etc.), what other activities should be permitted and what organizations should have access? 3. Does Merriweather need to be renovated, and if so what type and scope of renovation would be necessary for it to most successfully and effectively achieve the determined primary purpose? 4. What type of management and control structure should be put into place for the operation of this facility?
16 5. What level of public oversight should exist? AND BE IT FURTHER ORDERED that the following individuals shall serve on the Advisory Panel: 1) Rand Griffin Chairman 2) Steve Alms 3) Sandy Adkins 4) Rachelina Bonacci 5) Tom Buescher 6) Frances Dawson 7) Mo Dutterer 8) Valerie Lash 9) Chip Lundy 10) Toby Orenstein 11) Donna Richardson 12) Lee Richardson 13) Buddy Roogow 14) Paul Skalny 15) Anne Stuart 16) Coleen West AND BE IT FURTHER ORDERED that the following individuals shall serve as ex officio, non-voting members of the Advisory Panel: 1) Jean Parker Merriweather Post Pavilion 2) Dennis Miller Rouse Company 3) Sharon Greisz Howard County, Director of Finance 4) Gary Arthur Howard County, Director of Recreation & Parks 5) Jim Irvin Howard County, Director of Public Works. IN WITNESS WHEREOF, I, James N. Robey, as County Executive of Howard County, Maryland have hereunto set my hand and caused the seal of Howard County to be affixed this eleventh day of August, James N. Robey County Executive Appendices 2 and 3 Are Under Separate Cover -15-
17
18 Industry Overview industry overview As a part of our study on the future of the Merriweather Post Pavilion, Webb Management Services has completed an overview of the live entertainment industry to bring some perspective to the question of what s next for the Pavilion. This is an attempt to describe the history, the current conditions and the prospects for live entertainment as an industry. History There is much debate as to when theatre arrived in America. It is clear that there were performances in the early s with performances given in a regular theater in Williamsburg, VA and other colonial communities. There may have been earlier, less formal performances as early as the 1660 s. In the early 1700 s, troupes of English actors came to America and performed Shakespearean dramas and comedies. Theatre quickly became more popular in the southern colonies as with other English customs, whereas the puritanical attitudes of the north made theatre illegal for many decades, and later frowned upon by community leaders. Even as late as 1850 there was only one theater in Brooklyn, with the next one named the Academy of Music so as to avoid the impropriety of the word theatre. Also in these earliest colonial years there were musical concerts given by and for members of the aristocracy. These were amateur performances for small and select audiences presented in private residences. The performing arts and entertainment only started their rapid growth in the later part of the 19 th century with the development of a middle class inclined to afford and enjoy what was perceived as popular entertainment. Communities across the country developed Academies, Opera Houses and Theaters to host touring actor/managers and their presentations of the finest works of the time. Over a period of time, the minstrel man and concert hall comedian went from social outcast to some level of respectability, bringing entertainment to the masses in the form of burlesque, followed by the development of vaudeville and touring shows of serious and comedic pieces, as presented by increasingly larger and more powerful producers and promoters. 1 Hornblow, Arthur: A History of the Theatre in America, Volume 1. Philadelphia: J.B Lipincott Company Webb Management Services, Inc. 1 October 2004
19 Industry Overview One of these firms was Klaw and Erlanger. In the 1890 s, they drove the development of the Theatrical Trust (often referred to as the Syndicate ) that came to control the touring theatrical and entertainment industry. By 1903, they controlled 83 first-class theaters, including 20 in New York City and Brooklyn. They developed partnerships with many of the leading actor-managers, and were in a position to intimidate local papers that dared to print negative reviews of their productions. 2 The demise of the Syndicate was brought on largely by public reaction to their ambitions and the efforts of emerging competitive groups. Ironically, it was the Shubert Organization that lead this charge, and then went on to assume that same level of monopolistic control that they earlier fought. By the 1920 s, the Shubert s controlled a massive empire, producing live entertainment and controlling facilities all over the country. That dominance was challenged in the 1920 s with a strike by Actor s Equity and a building public resentment of their strong-arm tactics. And now, some eighty years later, we have Clear Channel Communications, which was, prior to 1999, the largest owner of radio stations and billboards in the country. But with the acquisition of SFX Entertainment in that year, Clear Channel suddenly became a dominant player in the presentation and promotion of live entertainment. SFX was built by over a decade of aggressive acquisitions all over the United States, fueled by cheap access to capital and an ambition to become the largest provider of live entertainment in the country. By 1999, there were divisions of the company devoted to music, theatre, family entertainment, sports marketing, athlete representation, motor sports, multi-media entertainment and television. These pieces were assembled from many of the most successful facilities, promoters, agencies and service providers in the country. The prospect of the live entertainment industry being so dominated by Clear Channel has made many in the world of facility management uneasy. Monopolies are often viewed as a bad thing because they can reduce the supply of product available in a market, increase the cost of that product and, given the lack of competition, allow the quality of that product to decline. Not that all of these things have yet happened, but there is significant anxiety in the industry. Most facility managers are learning to deal with them, accepting that they are powerful and controlling, but also that they have played a role in expanding the overall live entertainment industry. Paralleling the development of live theater and other popular entertainment was the import of classical music, opera and dance to North America. The 2 Fields, Armond and L. Marc: From the Bowery to Broadway Lew Fields and the Roots of American Popular Theater. New York: Oxford University Press, Webb Management Services, Inc. 2 October 2004
20 Industry Overview New York Philharmonic was established in 1842, but by 1900 there were only seven orchestras founded. Also interesting is the fact that the Baltimore Symphony, founded in 1916, was the first municipal orchestra supported by public funds. Opera was first performed in the United States on January 22, 1896, with a performance of Verdi's first Falstaff, at the original Metropolitan Opera. Ballet was also slow to arrive. The Chicago Opera Ballet was the first ballet company established in America, founded in This short history lesson is relevant for two reasons: 1. From the outset, there has been a distinction between popular entertainment with its commercial orientation as opposed to artistic or cultural programming and its need for philanthropic or community support. Commercial programming works on a commercial basis, meaning that there is a return on investment. Cultural programming is more difficult to define. Some may be commercially viable, but mostly it is not mostly it is produced and presented for reasons other than the potential financial gain. We often refer to cultural programs and activities as being mission-driven, meaning that there is a positive, educational, community-serving reason for their existence. This then validates community investment in the program through grants, donations, sponsorship or other forms of support. 2. The commercial side of the live entertainment industry has twice before come close to monopolistic control. But in both of these cases, public outcry followed by public sector actions loosened monopolistic control of the industry, creating new opportunities for entrepreneurs to stake a claim in the sector. Prospects for Clear Channel should be considered in this context. Facilities for Live Entertainment Facilities have evolved in concert with the types of popularity of various disciplines. 300 years ago, there were small theaters for the spoken word and variety shows in North America. These became larger and more ornate with the development of vaudeville, as various producers and promoters developed chains of facilities around the country to house their acts, often running on an almost continuous basis. The greatest challenge for live event facilities was the emergence of film, leading to the development of huge movie palaces that were well-beyond the scale and reach of the live performer. From the 1920 s through the 1960 s, communities were more likely to take on the development of large halls for the presentation of live events, both locallyproduced and touring. Many of these, with names like the War Memorial or the Municipal Auditorium, were grand and imposing structures that were Webb Management Services, Inc. 3 October 2004
21 Industry Overview lacking in intimacy. Over the last 40 years, facility development has taken a series of positive turns: The development of multiple-hall performing arts centers, starting with facilities such as Lincoln Center and the Kennedy Center. The return to traditional design in the development of these halls, with reduced seating capacities and more attention to design that created greater intimacy and improved acoustical characteristics. New attention to the restoration of old theaters, often as part of downtown revitalization efforts Playhouse Square in Cleveland is a fine example. But more recently, a series of trends have again altered the landscape. Most important of these has been the increasingly difficult challenge of developing facilities that can serve both commercial and cultural programming. On the commercial side, increasing costs of production and promotion have motivated presenters to seek larger and larger halls. At the same time, cultural organizations have not seen audiences increasing, and are increasingly concerned that they must focus of creating a high-quality, intimate environment for the presentation of their work. Facility developers often face a fork in the road the local Broadway presenter insists on no less than 3,000 seats, while cultural programming like Ballet can only sell (and afford to rent) 1,800 seats, and is horrified at the prospect of audiences some 300 feet away from the stage. All of this means that it is more likely that separate facilities are built for commercial versus cultural programs. And given that there is a potential return on investment in the development of facilities for commercial programming, it is often these facilities that are being built first. That being said, there have been numerous attempts over the years to develop facilities that are convertible to serve different sizes of audiences and types of program. And the other important factor is that the costs to develop all performing arts and entertainment facilities over the past twenty years have escalated at a rate well beyond the rate of inflation. There is no single culprit, but many reasons, which include the increasing complexity of the process of developing facilities, the trend towards using signature architects, the desire for superb acoustics and theatrical capabilities, and the introduction of new regulatory requirements and legislation such as the Americans with Disabilities Act. Appendix A is a spreadsheet that describes twelve large indoor facilities, selected on the basis of their capacity and the option they represent for Merriweather Post. Following are insights from that survey. These facilities vary in age, purpose and level of success. There are outstanding examples of actively programmed and successful halls, but Webb Management Services, Inc. 4 October 2004
22 Industry Overview also a series of building that have failed to perform successfully or even stay open. There is a wide-range in capacity. At the low end is the 4,249-seat Arie Crown Theater in Chicago, a cavernous municipal auditorium. At the high end is the 7,030-seat Sundome in Phoenix, which is now closed and facing an uncertain future. The more interesting models are in the middle-range of capacity; facilities like the 4,400-seat Rosemont Theater and 4,600-seat careerbuilder.com Oakdale Theater, both operated by Clear Channel, and the 3,400-seat Kodak Theatre in Los Angeles, operated by Anschutz Entertainment. There is no one model as to how these facilities are owned and operated. Certainly there are more commercial operators than one sees for smaller facilities. Clear Channel, Anschutz and House of Blues are all active in the operation of these facilities, or at least in the presentation and promotion of events. These facilities are programmed very differently, with varying levels of activity and types of product. At the core they depend on largecommercially oriented events to attract larger audiences. We are unable to collect a lot of financial information on these facilities, but our sense is that the well-run facilities generate a significant profit. Some of these facilities support cultural programming, when it relates to their mission or funding. Those programs are not for making more money, but to serve broader objectives of the operator, facility owner or community. The idea of a large indoor hall is not, then, a new one. Some of the older facilities, like the Shrine Auditorium, have been very successful for a long time. But the recent buildings, including the conversion of the Universal Amphitheatre, are changing the competitive landscape in a number of markets. Outdoor Facilities Theatre began outdoors, and the form flourished with the development of the Greek Amphitheaters. In North America, there were few outdoor facilities before the early 1900 s. Early examples include such well-known amphitheaters as Red Rocks (opened in 1911) and the Hollywood Bowl (1919). In the 1920 s, an outdoor drama movement was lead by a group of avant garde theatre professionals and designers, followed by the development of many more facilities in the 1930 s built by the Works Progress Administration and Civilian Conservation Corps. It was at that point that outdoor facilities became a part of mainstream American culture. Webb Management Services, Inc. 5 October 2004
23 Industry Overview It is important to distinguish between different types of outdoor facilities. First of all, there are the less-formal spaces developed for and by the community for special events. This includes lots of bandshells and pergolas in municipal parks that hark back to a time of citizens on a weekend promenade. Then there are the outdoor facilities developed for the presentation of outdoor drama, whether that be an annual Shakespeare festival (see the Oregon Shakespeare Festival in Ashland), historical dramas (for example The Lost Colony production in Manteo, North Carolina) or religious pageants such as The Black Hills Passion Play in Spearfish South Dakota. The third segment, and the one relevant to our analysis, is the large pavilion, shed or bowl that presents some combination of commercial and cultural programming, mostly some kind of music. Appendix B is a second spreadsheet. It describes 19 outdoor facilities similar in size to Merriweather Post. Following are insights from that survey: Like Merriweather Post, many of these facilities have different seating combinations, usually with a covered, fixed-seating portion and then a larger lawn-portion. In many cases, portions of the lawns have virtually no view of the stage. Of this set of facilities, Clear Channel is the dominant operator. But almost as many are operated by 501(c)(3) nonprofit organizations. Several are also government operated, with programming relationships with commercial promoters. Commercially-operated facilities are programmed almost exclusively with commercial entertainment and are expected to generate significant operating profits. Facilities operated by a nonprofit add varying levels of cultural programming and contributed income in order to balance their budgets. Most of these facilities pay a lot of attention to parking and easy access for patrons, using both on-site and off-site options. Landscape architect Linda Jewell recently completed a study on early outdoor facilities and their relationship to their environment. 3 She says: There have been few theaters built since 1950 that address the landscape in a thoughtful manner or that might be considered exemplary in any aspect of their design. In the past twenty years, many of the older theaters have been carelessly updated, impairing their connections to their natural surroundings. Though Ms. Jewell has not specifically studied Merriweather Post, her comments are certainly relevant as it regards the current condition of the facility and its potential relative to newer competitive facilities. 3 Jewell, Linda Great SiteWorks A Selection of American Outdoor Theaters (1997) Webb Management Services, Inc. 6 October 2004
24 Industry Overview Part Two: The Current Industry In order to describe the current industry, let s focus on a series of issues and events. The For-profit and Non-profit Divide As we ve already discussed, there is a fundamental divide between those parts of the business that are commercially viable and those parts of the business that require contributed income. On the commercial side of live entertainment, we have large-scale touring programs of everything from country music to Broadway musicals. On the non-profit side we have touring theatre, music, dance and opera. What defines the difference is whether or not the revenues generated by the event are more than sufficient to cover operating costs and amortize capital expenditures. This tends to have something to do with the popularity of the event. We know, for example, that 6% of adults attend a ballet performance in a given year, as opposed to 25% attending a musical theatre performance 4. More important than popularity, though, is the sense that some works are important or significant for communities, such that funders, whether from the public or private sectors, are prepared to underwrite the cost of bringing a show to the community. Someone decides that the community would benefit from the presentation of these cultural events. Potential benefits include the enhanced quality of life of residents, prospects for cultural tourism, the ability to recruit new businesses and workers to the area, or economic development efforts that are aided by the presence of cultural programs and facilities. All of this is to say that there is for-profit and non-profit programming and facilities that are viable for different reasons. For-profit events and buildings succeed when they finds a large enough audience to generate profit and a positive return on investment. Non-profit programming and facilities succeed when the combination of earned income and contributed income is sufficient to fund operating expenses and pay-off capital expenditures. Note also that we need not match the type of program with the type of facility. Forprofit programs are a big part of non-profit facilities (see Wolf Trap). And commercial facilities can accommodate non-profit users. One of the other key distinctions between the for-profit and nonprofit sectors is the issue of venue capacity. Commercial audiences will come by the thousands to see their favorite artist perform in a huge shed and be satisfied with greatly amplified sound and an electronic image of the performer on the big screen. Cultural audiences are not satisfied with this sort of experience. Amplified classical music generally does not work well, and the audience must be close enough to the actual performer to experience 4 National Endowment for the Arts: Survey of Public Participation in the Arts. Washington D.C., 2002 Webb Management Services, Inc. 7 October 2004
25 Industry Overview connection and impact with the work. Thus, the nonprofit event matches expensive production costs with limited revenue potential, generally guaranteeing the need for supplementary funding. The Economic Dilemma of the Arts The great challenge for the non-profit sector today is a fundamental economic challenge defined some 40 years ago. In 1966, the economists William J. Baumol and William G. Bowen wrote a groundbreaking study on the state of the performing arts. Commissioned by the Twentieth Century Fund and titled Performing Arts The Economic Dilemma, the study discussed the performing arts inability to improve labor productivity. Baumol and Bowen began their seminal study with the line, In the performing arts, crisis is apparently a way of life. This study was the first (although certainly not the last) to use verifiable and accurate data to illustrate the difficulties the performing arts industry faces, both financially and socially. The conclusions reached in the study surprised few in the performing arts industries, but resulted in an awakening in the public and business sectors. Or, perhaps more accurately, the studies marked a turning point in the battle to educate the public and business sectors about the financial difficulties in the arts and the fact that those difficulties are not short-term or solvable, but are, in fact, chronic. The study s most important conclusion was that the performing arts have a limited ability to improve productivity. At no fault to the managers, performers, or facilities, Baumol and Bowen pointed out that plays, operas, and concerts require the same number of performers and take the same length of time no matter where or when they are performed: Haydn s The Creation still takes the same number of musicians and singers and the same amount of time when performed in 2004 by the New York Philharmonic as it did in 1798, on its opening night. However, the costs associated with performing artists (salaries) and the technical aspects (violin strings, space rental, point shoes, ticket printing, etc.) have grown exponentially. Compare that with the production of cars: how much time, labor, and cost did Ford s assembly line save? Those same cost saving measures cannot be applied to Haydn or to Puccini, Shakespeare or even Gilbert & Sullivan. And so, Baumol and Bowen conclude, with costs constantly rising, resistance to ticket price increases and few cost-saving efficiencies, the performing arts will always experience an income gap. And that gap, they hypothesize, will widen as the years go by. This then becomes the most fundamental challenge for financial managers in the performing arts to manage the cost squeeze with some appropriate balance of earned and contributed income. And it makes clear the basic fact that fundraising, and in particular the development of endowments, will become even more important to the future of the performing arts. The Arts and Community Development Webb Management Services, Inc. 8 October 2004
26 Industry Overview Whereas the arts were once seen as serving exclusive audiences with esoteric work, they are increasingly seen as a community development tool, which encourages communities to invest in cultural development. As we ve already suggested, investments in the arts and culture are warranted for many different reasons, including: Positive impacts on the quality of life New educational opportunities for children Prospects for cultural tourism Support of efforts to recruit companies and workers to move to a community Role in downtown revitalization or other redevelopment efforts Increasing understanding and tolerance of different people and cultures Fundamentally, communities see a positive return on their investment in arts and culture, sometimes measured in dollars, but often measured in a more qualitative manner. This is the good news for nonprofits that the viability of the sector depends not on bottom-line, event-specific returns, but on longer-term benefits to communities that justify investment in the arts on the part of the public and private sector. Clear Channel and the For-profit Players The for-profit sector of the arts and entertainment world today is characterized by the following features: There are a few dominant players, with smaller firms exiting the industry or being taken over by larger rivals. Larger firms, whether engaged in producing, presenting or promoting, are more likely to take a corporate view of the field. That means more planning, greater emphasis on promotion and partnerships rather than the choice and promotion of specific work. The implication is that the job of picking shows and supporting certain artists is becoming less personal and intuitive. A related issue is that as the stakes of the game increase in a corporate setting, the players become more risk averse, which most certainly affects what work is developed and why. All of this means that companies like Clear Channel become larger and more conservative, while companies like I.M.P. must be faster, smarter and more in touch with their markets to survive. Having said that, there are still lots of Webb Management Services, Inc. 9 October 2004
27 Industry Overview players in the live entertainment industry. Here s a quick survey of some of the other key players in the concert and touring theatricals segments. Anschutz Entertainment Group The #2 concert promoter (which means 10% to 15% of market share).they promote largely the same type of show as Clear Channel, and are very competitive. The Division is part of a publicly traded company engaged in many parts of the business, with TV stations, an NHL franchise, a movie studio and so on. They would love to control more venues, but came to this segment a bit late. House of Blues - The #3 concert promoter (say 5% of share) Started in the club business but has aspirations to develop and control larger venues. They are partners in several amphitheaters already. JAM This Chicago-based group has both theatrical and concert divisions. It s a small, privately-owned company. They buy shows and run tours and invest in a number of Broadway productions. They are less aggressive on the concert side. Fantasma A small, private concert promotion company based in Florida that is very active in that State and growing beyond. Disney Entertainment Disney only came into the theatrical world 12 years ago, but started with a bang. They are a bit less active now, but Lion King is still a huge asset. There is some mystery about what they might do next, but fundamentally they have a treasure chest of product that might ultimately make it to the stage. Nederlander This family business has both concert and theatrical divisions. On the theatre side, they produce shows, present in large venues in several major markets, and are the 2 nd largest theater owner in New York. The concert division is not as big but is still competitive and willing to promote in many different segments. The Shubert Organization Still a very big player in theatre, mostly as the largest owner of theaters in New York City, as well as other markets. They invest in some shows, but much less active than they used to be. Turmoil in the Concert Business This is a difficult time to consider the future of Merriweather Post given the current state of the concert business, as evidenced by the following: Total tickets sold in the first half of 2004 were 12.8 million, down from 13.1 million in the first half of The top 50 arenas sold 800,000 more tickets, but ticket sales at the top 50 amphitheaters dropped by 35%. Webb Management Services, Inc. 10 October 2004
28 Industry Overview A major part of this is the fact that the average price of a concert ticket grew from $51.81 to $ According to industry insiders, there is a vicious cycle at play that began with the proliferation of amphitheaters and arenas in markets already saturated with concert venues. Then, the acquisition of these venues by promotion/production companies have lead to bidding wars for artists, leading to overbooked venues, overpaid artists and overcharged audiences. Part Three: Prospects For the Performing Arts In 2001, the Rand Corporation published The Performing Arts in a New Era, a comprehensive report on the state and future of the performing arts as an industry 5. Chapter 8, entitled Where are the Performing Arts headed? is attached as Appendix C. The report suggests that the division between the for-profit sector producing mass appeal entertainment and the nonprofit sector producing high art will evolve more along the lines of big versus small organizations and firms that target broad versus niche markets. They suggest an industry characterized by the following segments: A large commercial sector characterized by a few very large firms catering to mass markets. A small commercial sector with small firms targeting niche markets within the recorded branches of the performing arts. A small number of large nonprofits providing high quality live performing arts in major markets. A much larger number of small nonprofits catering to local and specialized markets. An even larger and growing number of amateur performing arts organizations. A sizable number of nonprofit presenting organizations that provide access to live performing arts in smaller markets. This includes university-based presenting. The report suggests that the group most at risk is the middle tier of organizations (opera, symphony, ballet and theatre companies) serving small and medium-sized cities. They are most vulnerable to the Baumol and Bowen cost-squeeze, aging audiences, escalating costs and static funding streams. 5 Brooks, Arthur, Julia Lowell, Kevin McCarthy and Laura Zakaras, The Performing Arts in a New Era (Washington, D.C.: The Rand Corporation, 2001) Webb Management Services, Inc. 11 October 2004
29 Industry Overview The report also takes the position that though there is likely to be an increase in the quantity of artistic productions, the number of professional-level live performances will likely decline. Finally, the authors name three critical functions to be served by the performing arts in the modern world : 1. The arts act as a source of entertainment, enrichment, and fulfillment for individuals 2. The arts serve as a vehicle for the preservations and transmission of culture 3. The arts provide a variety of instrumental benefits to society at the individual, community, and national level. The benefits in that third category are substantial. At the individual level, the arts promote openness to new ideas and creativity as well as competence at school and work. At the community level, they provide economic and social benefits such as increasing economic activity, creating a more livable environment, and promoting a sense of community pride. And at the broadest level they promote an understanding of diversity and pluralism, reinforce national identity in our cultural products, and provide a source of the nation s exports. The underlying idea is that the future of the performing arts depends on providing these benefits to individuals, groups, and society as a whole. And it can be said that performing arts facilities are the critical means by which these benefits are delivered. They are the physical place where entertainment, enrichment, and fulfillment are delivered from artist to audience. Managers and their staffs seek out and present works from many different cultures. Education and outreach programs impact the lives of more and more people in their communities. Active facilities attract economic activity and commercial development. And all of these successes become a point of pride and identity for the community and country. Thus, the fundamental challenge for nonprofit facilities and their organizations is to focus on the delivery of benefits that prove their worth to individuals, communities, and society and justify ongoing support from both the public and private sectors. For the Concert Business As one might expect, there are a number of divergent opinions about the future of the sector. We might see further consolidation of the key players and closure of venues to bring the demand and supply equation back into balance. But it is also likely that we may see increasing attention on the marketing of venues that are more interesting and personal, and a real attempt to promote artists. Webb Management Services, Inc. 12 October 2004
30 Industry Overview Artist Manager Rob Light of CAA made the keynote speech at the Concert Industry Congress last February. 6 Overall, he takes the position that the concert industry has faced similar challenges in the past and has always managed to bounce back through the innovation and entrepreneurship of its key players. As he says, Technology changes, obstacles have always existed, stagnation tries to hold an industry back, complainers and negativity always abound. And yet, through the clutter of the noise, every generation manages to find its innovators and entrepreneurs. For Clear Channel and its Competitors We told the tale of Klaw and Erlanger and the Shuberts to suggest that there have been two previous attempts to gain monopoly control over the presentation of live entertainment in this country, but that neither of those situations lasted long. Though Clear Channel is a large and powerful company with strong connections to the current administration in Washington, it is unlikely that they will continue to assert monopolistic control on the live entertainment sector, for the following reasons: The American economy is based on competition, and competition will emerge either through regulatory controls or new generations of entrepreneurs. Creative enterprises like those involved in entertainment, no matter how profitable, do not thrive under corporate control. Success depends as much on risk-taking and intuition as it does on scale and access to capital. We should also note that Clear Channel is facing a series of inquiries and legal battles. In July 2003, an Assistant United States Attorney General announced that the Department of Justice has initiated two separate antitrust inquiries concerning Clear Channel. One considers whether the Company has violated laws in one of its radio markets. The other looks at whether the Company has limited the airplay of artists who do not use its concert services, in violation of antitrust laws. A third inquiry, in Missouri in September 2003, concerns commercial advertising on behalf of offshore and/or online gambling businesses. And there is a lawsuit now under appeal, first against the Company in June 2002 regarding unfair trade practices, defamation, and other counts. This is not an unusual level of litigation for a company of the size and scope of Clear Channel. In fact, we have heard the view expressed several times that it is very surprising that the company is not facing more scrutiny and inquiries given their dominant positions and aggressive tactics in a number of major markets. 6 Pollstaronline.com/cic2004/keynote Webb Management Services, Inc. 13 October 2004
31 Industry Overview For the Development and Operation of Facilities Our discussion on facilities and trends in their development has already made clear that a huge effort is required to build and run both indoor and outdoor facilities. There are several implications: Fewer communities are willing and able to build large palaces of the arts with multiple facilities and tenants. They are at least as complicated and expensive as hospitals to build, and they require significant ongoing financial support. These days, facility developers are more likely to pursue smaller facilities, hybrid facilities, cultural districts and partnerships between the nonprofit sector, the commercial sector, government, the educational sector and government. The exception to this is developers with commercial product. In that segment, there is a very strong motivation to build extremely large facilities with limited atmosphere but fantastic concessions. Thus, the challenge to build facilities that serve both the cultural and commercial sectors is extreme. The multi-form facility has come in and out of favor many times over the last 300-years. It is not a new idea, but it remains our holy grail. There are some facilities that are convertible in terms of their capacity. Others change shape in order to accommodate different kinds of programs. And others convert from outdoor to indoor facilities. Technologies have evolved to improve the quality of convertible halls, but the cost can be extreme, and the choice must be considered as a cost-benefit analysis. In terms of operation, performing arts facility managers have been forced to become very aggressive in the way they program their facilities. They cannot sit back and wait for renters to call. They must aggressively present and often produce to fulfill their missions, and have developed large and sophisticated marketing, fundraising and education departments. The effort of convincing a consumer to get up off the couch is tough and getting tougher. We are all bombarded with opportunities to spend our leisure dollar, and we are both picky and lazy in our choices. Live entertainment presenters, particularly on the non-profit side, must sell a much broader experience than just watching a show. It s about how easy it is to buy tickets, to get to the venue, to park, the eat/drink/shop as a part of the experience, the experience of the place, the level of customer service, and getting back home again. Within that set of issues, the place is critical, as it must contribute to an experience that is both unique and easy. Webb Management Services, Inc. 14 October 2004
32 Industry Overview Finally, we would suggest that the most important factor in the successful operation of any kind of live entertainment facility is the product the show. Despite what we ve just said, consumers will crawl through broken glass to see the artist or group they want to see, wherever they re playing. But a venue without a show, or without the right show for the market, is in deep trouble. Thus, the most important consideration in the success of a venue is the ability of the operator to supply the right product to animate the building. Part Four: Case Studies In this final section we describe three facilities and operations taken from our first level of analysis and expanded because we felt that these specific projects and facilities exemplify many of the challenges facing the industry today, as well as the specific challenges and choices available to Merriweather Post. Universal Amphitheatre Universal City, California Once an outdoor stunt stage for Universal Studios Hollywood, the Universal Amphitheatre reopened in 1982 as a state-of-the-art indoor theater. Nestled on top of a hill on the lot of Universal Studios Hollywood, the Amphitheatre is equally convenient to both Los Angeles and the San Fernando Valley. It has its own on and off ramps to the Hollywood Freeway, is easily accessible to all of Southern California, and is just minutes from downtown Los Angeles, Century City, Beverly Hills, Hollywood, and the Burbank Airport. 7 Universal Amphitheatre is owned by Universal Studios and exclusively programmed and promoted by House of Blues (HOB). Co-founded by former Blues Brother Dan Aykroyd, HOB owns and operates seven House of Blues clubs; owns, operates, or exclusively books 20 larger venues across North America; and promotes several national tours. The company has recently put a hold on plans to expand the number of its clubs, as well as its proposed media. In 2002 the company laid off employees while it explored the idea of selling out to such rivals as Anschutz Entertainment and Clear Channel Entertainment. No such deal was ever brokered, however, and HOB took itself off the market. Several investment groups, including JP Morgan Chase, currently back the company. 8 The Amphitheatre has a flexible capacity that allows it to go from 6,189 seats (with general admission Orchestra Pit), to 6,089 seats (without general Hoover's Company In-depth Records. HOB Entertainment, Inc., Hoover's Company Profiles, 6 October Webb Management Services, Inc. 15 October 2004
33 Industry Overview admission Orchestra Pit), and finally down to a reduced capacity with intimate seating of approximately 3,900 seats. This flexibility allows House of Blues to program events 125 nights per year. The Amphitheatre would not be considered arts-friendly nor would the programming be deemed culturally oriented. Typical events include George Carlin, Banda el Recodo, Paulina Rubio, Morrissey, Korn, Cake, Tears for Fears, George Lopez, the MTV Music Awards, VH1 Honors, the Academy of Country Music Awards, HBO's Comic Relief, and AIDS Project Los Angeles' Commitment to Life. In addition to concerts, the Amphitheatre is also available to rent Sunday through Thursday for incentive or sales conferences, new product reveals, stockholder meetings, fundraising events, religious events, television/film production, and pull-out-all-the-stops convention spectaculars. Every area of the Amphitheatre is available for rental including the auditorium, the semicircular sky-lit concourse, smaller areas for private meetings, and breakout space. It has a special events staff that will coordinate ticketing, advertising, production sets, special equipment, rentals, entertainment, catering, etc. The staff has the capacity to book artists for the rental events, reserve a block of seats from their regular concert season, and offer special lease rates to all non-profit organizations. Finally, the special events staff will plan and execute private parties for 100 to 5,000 people and arrange everything food, flowers, decorations, and entertainment. 9 HOB competes with Clear Channel Entertainment and Anschultz Entertainment Group, amongst others, in this market. In 2002, HOB strengthened its position in the Los Angeles metropolitan market by entering into a 10-year contract with Nederlander Producing Company to jointly book and market the Greek Theatre and Universal Amphitheatre concert seasons. This arrangement is only in effect during the Greek Theatre season from April 15 to October 31. This agreement has eased competitive booking practices between the two venues while allowing each to focus on how best to serve its customers. Under the terms of the contract, Nederlander/HOB has to pay rent to Los Angeles totaling $1.2 million per year or 8% of gross receipts and 6% of ancillaries, whichever is greater. The two companies also book their respective venues cooperatively, though buyers for each amphitheater negotiate their deals separately. The Greek and Universal also combined their subscription series into the Premiere Marquee Club, which allows concertgoers to pre-purchase shows at both venues. From a booking standpoint, it has been beneficial to artists because they get to choose among two 6,000-seat venues and whether they want to play indoors or outdoors, says Ken Scher, senior VP of Nederlander Concerts. The Premiere Marquee 9 Webb Management Services, Inc. 16 October 2004
34 Industry Overview Club also helps expose our artists to as many fans as possible. Alex Hodges, executive VP for HOB, adds that comparing calendars avoids fractionalizing the market. One of the key advantages is to avoid having similar artists playing on the same day at both venues. That's not fair to the artists. We're able to help them achieve the best circumstances in Los Angeles. 10 This agreement allows Nederlander and HOB to not only cooperate, but also not compete to book acts. One might assume that this gives the buyer more leverage but HOB executive VP of talent Alex Hodges disagrees, We are paying top dollar and are proud to do so, because we know if you don't pay an artist their worth, they'll skip your venue or go somewhere else. Any venue is a competitor; it doesn't have to be the same size. You take arenas and cut them down; take smaller venues and do multiple shows. 11 Tweeter Center at the Waterfront Camden, New Jersey Opened in June 1995, the Tweeter Center at the Waterfront is owned by the New Jersey Economic Development Authority (NJEDA). The NJEDA is an independent, self-supporting state entity dedicated to building vibrant, diverse communities by financing businesses and nonprofits, offering real estate development and technical services, supporting entrepreneurial development, and financing quality public schools. 12 The NJEDA raised $25 million from various public sources to acquire the property and to make the necessary site improvements. The private partners, Blockbuster, PACE Entertainment and Sony, under the auspices of Pavilion Partners, invested $31 million to build the facility. 13 NJEDA now gross leases the property to Clear Channel Entertainment (replacing Blockbuster, PACE Entertainment and Sony) and to the South Jersey Performing Arts Corporation (SJPAC), a 501(c)(3) nonprofit. The SJPAC mission is as follows: South Jersey Performing Arts Center (SJPAC) brings artists and audiences together. SJPAC serves its Camden City home and the surrounding region by showcasing high-quality, diverse performers from around the world and around the corner, and also by offering outreach and education programs that enrich the arts experience for the community Jill Kipnis, The Greek gets a face-lift. (Touring), Billboard, Volume 116; Issue 36, 4 September Linda Deckard Calif. venues strike alliance: Universal Amphitheatre, Greek Theatre in booking and marketing deal, Billboard, Volume 114; Issue 20, 18 may Webb Management Services, Inc. 17 October 2004
35 Industry Overview The Tweeter Center is the first of its kind a year-round facility built with airport hanger doors that slide up and down to transform it from an outdoor amphitheater to an indoor theater. The Center is a 25,000-person capacity outdoor amphitheater during the summer months that encompasses a huge lawn with giant video screens, state-of-the-art computerized sound enhancement, and views of the Philadelphia skyline and Ben Franklin Bridge. In the fall and winter, the Tweeter Center converts to a fully enclosed, climate controlled, flexible capacity theater for 1,600-7,000 guests. 15 Cooper s Ferry Development Association is a nonprofit development corporation created by the city of Camden and corporate funders to convert the Camden waterfront, an economically depressed area, to viable use. The Tweeter Center was one component of the Camden Waterfront Master Plan. Cooper s Ferry required that the facility have the capability to be enclosed to create a space that could be used year-round. According to Anthony Perno, Project Manager at Cooper s Ferry, Clear Channel Entertainment (CCE) would prefer that it not have this capability. CCE finds it difficult to program in the winter and a challenge to convert to an indoor space, with the theater needing to be spruced up with carpeting, lights, etc. to not look like a shed once enclosed. The Tweeter Center is the second highest grossing amphitheater for CCE in the United States; the first is the Tweeter Center in Boston. There is no property tax on it; in lieu of this there is a pilot payment that is required. This pilot payment was abated for the first 10 years to compensate for the additional costs incurred to allow the facility to be enclosed. Ticket surcharges levied on patrons help CCE and SJPAC to assist in the retirement of debt for the project and compensate the city of Camden. Over the next 30 years, CCE is required to pay the city of Camden $0.50 per ticket with this amount scaling up to $2.50 per ticket according to a schedule set forth in the gross lease agreement. The Tweeter Center will generate $23.2 million in payments to the city over a 30-year period. 16 CCE has first priority over programming in the summer, with SJPAC allowed to fill in dates not already booked by CCE. The reverse is true in the winter, as SJPAC has priority over programming in the winter and CCE can program around the SJPAC dates. SJPAC tends to showcase local performance groups, whereas CCE features national and international blockbuster performers. According to Mr. Perno, CCE is frustrated by the arrangement and claims it could do more in the winter if it were not for the fact that SJPAC has priority over the winter schedule. However, SJPAC s participation in the project attracted greater public funding sources and Webb Management Services, Inc. 18 October 2004
36 Industry Overview helped further leverage long-term repayment schedules for other public assistance. 17 In the season, SJPAC will present three performances at the Tweeter Center: Fred Hammond, A Garfield Christmas, and Leahy. Between June and September 2004, during the season, CCE presented performers such as the Pixies, The Cure, John Mayer, and Maroon 5. According to Mr. Perno, at this time there is no competition for CCE in the Philadelphia market. CCE owns and/or operates all of the competition both outdoor and indoor. These facilities include: Electric Factory Club, Ford Pavilion at Montage Mountain Amphitheater, Hershey Star Pavilion Amphitheater/Stadium, Merriam Theater, Theater of the Living Arts, and Music Tower Theater. Mr. Perno recounted that the region used to be controlled by the Electric Factory until CCE came in and bought the Electric Factory. There are approximately 8,400 parking spaces in well-lit, secured lots within the immediate vicinity of the Tweeter Center. General parking fees range from $10-$20 per car depending on location of the lot and type of show (standard evening concerts are $10-$15 and festival concerts are $15-$20). Prices for early arrival or oversized vehicles (busses and limos) may be higher. 18 In addition to arrival by car, there is passenger ferry service between Penn's Landing and the Camden Waterfront. Cynthia Woods Mitchell Pavilion The Woodlands, Texas Opened in April 1990, The Cynthia Woods Mitchell Pavilion is owned and operated by The Center for the Performing Arts at The Woodlands, a nonprofit 501(c)(3) corporation. It is located in The Woodlands, 27 miles north of downtown Houston, Texas. Similar to Columbia, MD, The Woodlands is a master-planned community planned and developed in response to criticisms of urban sprawl since the 1960s. These developments represent a best-case scenario for private-sector development: they had big land areas, rich developers, and cutting-edge professionals. 19 The mission of The Center for the Performing Arts at The Woodlands is: to provide a diversity of the very best in the performing and visual arts in order to entertain and enrich the lives of a broad regional audience; to serve as a catalyst for new audiences by enhancing the public s knowledge of and Ann Forsyth, Planning lessons from three U.S. new towns of the 1960s and 1970s: Irvine, Columbia, and The Woodlands, Journal of the American Planning Association, October 1, 2004, Volume 68, Issue 4. Webb Management Services, Inc. 19 October 2004
37 Industry Overview appreciation for the performing and visual arts; to serve as a resource for enhancing education about the performing and visual arts for young people and providing training and performance opportunities for young artists; to foster and create opportunities for the presentation of new and innovative work in the performing and visual arts; and to provide programs and activities while at the same time being certain to maintain the fiscal integrity of the organization. 20 The Pavilion has slightly more than 16,000 seats, including 3,000 reserved seats covered by a fabric roof; 1,900 reserved uncovered seats; and 12,000 more on the lawn. The season runs from March 1 to November 1 and typically includes 75 shows. Of these 75 shows, events are produced and promoted by Clear Channel Communications. In 1992, due to a generous gift from Cynthia and George Mitchell to the Houston Symphony s endowment fund, The Cynthia Woods Mitchell Pavilion became the official summer home of the Houston Symphony. The remaining performing arts events are produced and promoted by The Pavilion s management organization. In addition to the Symphony, past performers include the Houston Ballet and Houston Grand Opera, David Bowie, Green Day, Bette Midler, Van Halen, Elton John, Rod Stewart, Britney Spears, Clint Black, Cher, and denominational and non-denominational church events. The Pavilion typically keeps a portion of the funds from the Clear Channel events, other times Clear Channel has a strict rental agreement. While most individuals recognize The Pavilion as a rock house, proceeds from these contemporary shows help offset the costs it incurs producing performing arts events and educational outreach programs. Annually, it needs to raise more than $1 million from local corporations, foundations and individuals to continue its mission. According to Guidestar, in 2003 revenues for The Center for the Performing Arts at The Woodlands were $22,300,552, ticket income was $14,777,305, and parking income was $385,998. The Center for the Performing Arts at The Woodlands ran a deficit of $948,332 in Jeff Young, Vice President of Operations at the Cynthia Woods Mitchell Pavilion states that this is the only outdoor amphitheatre in the Houston area and it faces no competition from other outdoor facilities. He went on to say that it is a very diverse venue which is a positive thing and it can offer everything from rock to Bach. He asserts that since The Woodlands is a planned community it is fairly easy to get in and out of and that access to the Pavilion is good. It receives positive feedback from both artists and patrons the tickets are relatively inexpensive for the patrons and it is a nice facility for the artists. Finally, there is a long-term relationship with the production staff and they try to go above and beyond when serving both the 20 Webb Management Services, Inc. 20 October 2004
38 Industry Overview artists and patrons. Mr. Young considers the Pavilion to be similar to Tanglewood and Ravinia and believes that Wolf Trap is different, as it doesn't have the popular element and it is a state-owned facility. Jerry MacDonald, president and chief executive officer of The Cynthia Woods Mitchell Pavilion Center for the Performing Arts, said a committee of Town Center businesses is studying solutions for the parking problems in Town Center [the business district surrounding the Pavilion]. "I think it is something that definitely needs to be addressed," MacDonald said. MacDonald believes that parking is generally not a problem for the pavilion during most concerts, but there are a few major concerts a year, attracting up to 12,000 people, where parking needs are at a premium. MacDonald has agreements with surrounding office buildings to use 5,000 parking spaces and the pavilion has a 932-space garage adjacent to its facility. MacDonald said parking generally fills up in the mall corner nearest the pavilion, but there are many unused spaces on the north side of the facility. He suggested shuttles could be used to distribute parking more evenly. "We have to look at how we can move cars to where the parking is available," MacDonald said. 21 In addition to the performance events, the Center has an exhaustive educational component. Events include the Texas Music Festival, Jazz Day, the Fine Arts Education Series, Young Talent Spotlight, the Twilight Cabaret Series, and Pavilion Talk. Additionally, the volunteer organization of the Center organizes, implements and awards scholarships valued at $1,000 each to graduating high school seniors who plan to major in the Fine Arts and to previous scholarship recipients currently majoring in the Fine Arts. The grounds of The Cynthia Woods Mitchell Pavilion also include the Woodforest Bank Club. The Club is a 1,600-square-foot, state-of-the-art facility that is available for rentals. The facility has a 10-foot video screen and four 27-inch monitors with DVD and multimedia presentation capabilities. The Woodforest Bank Club has an outdoor covered patio and the Woodforest Bank Event Tent provides comfortable outdoor surroundings for 200 to 500 guests. The Woodforest Bank Club and Event Tent are yearround facilities. Conclusion Different facilities make different choices in regards to their physical space, how it is operated, how it is programmed and how it is funded. Those choices reflect the facility as it exists and the market in which it operates, which are the next two components of our analysis. 21 Beth Kuhles, Parking problems continue on south side of mall area / Local entities shift valet lots, study options to alleviate crunch, Houston Chronicle, 16 September Webb Management Services, Inc. 21 October 2004
39 Chapter Eight WHERE ARE THE PERFORMING ARTS HEADED? In the previous chapters we have described the current shape of the performing arts environment and identified major trends that bear watching in each of the four domains of the performing arts world: audiences, artists, organizations, and financing. In this final chapter, we first present a picture of America s future performing arts environment and then discuss what this might mean for the quantity, quality, and availability of the performing arts. Next, we discuss how arts policy might be refocused in light of those developments. Finally, we suggest what future research would help answer many of the unresolved issues we have identified. A VISION OF THE FUTURE The art world we envision for the future remains highly segmented, but the divisions are not the same as those that existed during most of the 20th century. Instead of a sharp demarcation between a nonprofit sector producing high art and a for-profit sector producing mass entertainment, the major divisions in the future will be along the lines of big versus small arts organizations, and firms that target broad versus niche markets. Specifically, if current trends continue, we envision an arts environment that is increasingly segmented into distinct sectors, each specializing in a particular type of product or artistic experience, targeting a different market, and responding to specific financial pressures. We describe these sectors below: A large commercial sector characterized by fewer but increasingly larger firms catering to popular mass markets, often on a global scale. Faced with an environment in which the rewards of success and the costs of failure can be enormous (and the latter outnumber the former by a significant margin), this sector will seek to minimize its risks by choosing conservative programming that relies on established stars and formats and is designed to appeal to the broadest possible audiences. It will continue to serve as the 107
40 108 The Performing Arts in a New Era principal purveyor of popular entertainment for the mass market a market that will continue to grow in response to population and income growth. A small commercial sector characterized by small firms that target niche markets within the recorded branches of the performing arts. Often these firms will move into areas, such as classical recordings, that the large commercial firms have abandoned because they simply don t provide the margins and volume that larger for-profit firms require. The low costs of entry into this sector, combined with technological changes (such as the Internet and e-commerce) that relax the traditional constraints of geographically based market thresholds, will also enable these firms to serve a wider variety of smaller and more specialized markets. Indeed, lower entry costs and the ability to serve spatially dispersed specialized markets will provide firms within this sector the opportunity to be more adventuresome in the variety of programming they offer. Whether they will choose to do so may well depend upon their ability to identify and market to newly emerging specialized submarkets for the performing arts. A small number of large nonprofits providing high-quality live performing arts in major metropolitan centers. Like their large commercial-sector counterparts (and for many of the same reasons), these organizations too will seek to maximize their earned revenues from ticket sales and related business income. They will rely on advertising and marketing campaigns promoting celebrity performers and traditional materials designed to attract the broadest share of what appears to be a relatively stable market those individuals who can pay premium prices to attend the highest-quality live performances. A much larger number of small nonprofit performing arts organizations catering to local and specialized markets, particularly ethno-cultural and specialized markets. Although earnings constitute a small fraction of these organizations revenues, their low costs and access to contributed income and volunteer labor enable them to survive and, in some cases, prosper. For many small and midsized communities, these organizations will provide the major source of live professional performing arts even if they do not feature the stars and grand productions that typify the large nonprofit sector. An even larger and growing number of amateur performing arts organizations. These organizations fill what appears to be a growing segment of the performing arts market the demand for hands-on participation for avocational artists. As is true of small nonprofit organizations, earnings are not an important source of revenue for these institutions. Instead, they rely very heavily on local volunteers, not only for contributed income but also for
41 Where Are the Performing Arts Headed? 109 performing and administrative labor. Because these organizations are primarily grass-roots organizations that are closely tied to their local communities, they may also be supported by local governments. Their numbers will be closely tied to the future size of the market for hands-on participation. Again, like their small nonprofit counterparts, these organizations will have little in common with the larger nonprofits in terms of programming, audience demographics, or the professional status of their artists. A sizeable number of nonprofit presenting organizations that provide access to the live performing arts to residents outside major metropolitan areas. As we noted in Chapter Six, we do not know enough about these organizations because they are typically embedded within non-arts organizations. But they are likely to become an increasingly important source of high-quality performing arts if, as we predict, the top-echelon live arts become concentrated in major metropolitan areas. University-based presenting organizations are likely to be especially important to the future of the performing arts because they serve multiple functions within the performing arts world. Not only are they major presenters, but they also play significant roles in training new artists and fostering innovation in the creation of new work. The biggest challenge we foresee relates to the middle tier of nonprofit arts organizations, particularly those opera companies, symphony orchestras, ballet companies, and theater groups that service small and medium-sized cities across the country. The realities of aging audiences, escalating costs, and static or even declining funding streams will force these organizations into a serious rethinking of their primary mission, the audiences they want to reach, and their organizational structure. Some will choose to pursue increased local funding to keep up professional standards, go for the smash hit and superstar marquee, and aspire to become regional or national brand-name institutions. Others may opt to fill specialized niches based on particular kinds of programming that target specialized markets. Still others will decide to focus on their immediate community, using local talent to keep costs down and targeting programming to encourage participation by local audiences. Finally, some will simply wither away, unable to reconcile conflicts among their various stakeholders. We currently have too little information on a number of issues to accurately gauge how closely this profile will accord with the actual future. The shape of change within the commercial sectors, for example, may well hinge on how critical intellectual property and e-commerce issues are resolved. Moreover, although middle-tier nonprofits face special challenges, they are often viewed by their communities as important civic assets. Thus, they may be able to generate sufficient public and private funding to sustain their operations. Finally, our projection of future demand assumes that observable trends will continue.
42 110 The Performing Arts in a New Era Given historical patterns of demand, this assumption appears to be reasonable. However, as we note below, policy interventions could increase future demand for the arts. It is important to remember that we have been describing the performing arts system in very broad strokes and with highly aggregated data. Although such an approach may bring out connections among different parts of the arts world that are not captured in more focused studies, it cannot account for the diversity and particularity of the experience of different artistic subcultures. Even if some of our predictions about demand and organizational demographics turn out to be valid for the performing arts as a whole, the arts in different parts of the country and in different disciplines and subdisciplines may evolve in their own distinct way. IMPLICATIONS FOR THE PERFORMING ARTS We return to the question posed at the beginning of this report: Is the future we describe likely to be the best of times or the worst of times for the performing arts? Specifically, what are the likely effects on the quantity, quality, and availability of the arts if performing arts organizations continue to specialize as we predict? As far as the quantity of artistic productions is concerned, the future looks bright. New and improved production, recording, and distribution technologies will allow American audiences to continue to enjoy a wide variety of performing arts, both whenever and wherever they like. Most arts programming will still be targeted at mass audiences, but some observers argue that the widespread popularity of mass entertainment not only in the United States, but around the world attests to its worth. The number of professional-level live performances of the high arts, on the other hand, is likely to decline. It is not clear, however, whether this trend poses a threat to the public interest. If more people wanted to attend professional live performances in any community, the performers and presenters would not face financial problems there. This will surely be the case in major metropolitan areas where large institutions will continue to offer productions that feature the best that money and talent can offer. In addition, touring artists and performing arts companies will provide an opportunity for fans to attend live performances in the many smaller cities and towns that would otherwise not be able to sustain top-level performing arts. And for those who are not able to attend the live performance, high-quality digital recordings will provide an improved, if still imperfect, substitute for the live experience.
43 Where Are the Performing Arts Headed? 111 For Americans with less traditional artistic tastes, the future promises greater opportunities than ever before. The number of live performances in local communities is likely to grow. These will be mainly low-budget productions of great cultural and artistic diversity performed by artists on a volunteer basis. The number and range of non-live artistic productions should also increase as cable television, satellite broadcasting, and the Internet knock down geographic barriers to audience development. The ability to reach far-flung audiences has created healthy markets for forms of art that had previously been unable to attract economically significant demand. Although the commercial success of such ventures remains to be proven, it seems likely that in the future, niche arts markets will be not only possible but profitable. And for those who want to be directly involved in the creation of music, opera, theater, or dance, the proliferation of community-based groups will offer more and greater opportunities for direct participation in the performing arts at the amateur level. How the quality of the arts will be affected by changes in the performing arts system is more difficult to analyze, primarily because quality is a subjective criterion. Still, it is an unavoidable issue when evaluating the continued vitality of the arts in America. The question of quality can be posed in at least two ways: First, will artists find sufficient opportunities to develop their skills within the future performing arts system? And second, will that system encourage the creation of original works of enduring value? The polarization of artists incomes (created by the superstar phenomenon), the greater concentration of large nonprofits, and a possible contraction in the number of midsized organizations are all trends that could reduce the opportunities for talented young people to pursue professional careers in the performing arts. In particular, many observers view midsized arts organizations as a vital training ground for actors, ballet dancers, opera singers, and classical musicians, preparing them for the leap to the big leagues. If this middle tier contracts, many aspiring young talents could be forced to take jobs in the small nonprofit and volunteer sectors, where standards of production are far less professional. These concerns, however, may be overblown. When a similar contraction of the middle tier took place in professional sports, for example, the decline in the minor league infrastructure was offset by the increasing importance of the university as a developer of young talent. A similar phenomenon could well occur within the performing arts. The broader question about quality is whether the growing role of the marketplace in the arts will make it more difficult for original works of enduring value to be produced and performed. As we noted in Chapter One, opinion on this point is divided. On one hand, advocates for the market, such as Tyler Cowen
44 112 The Performing Arts in a New Era (1998), assert that by serving a wide variety of tastes, market forces promote innovation across artistic styles. In making this case, they point out that creative geniuses like Shakespeare, Mozart, and Beethoven all had a broad popular following in their day. On the other hand, commentators like Robert Brustein of The New Republic already bemoan the destructive effects of commercialism on American theater: The products of the non-profit theaters... have been growing almost indistinguishable from Broadway (and off-broadway) in their dependence on the box office and in the lowered ambitions of their work (Brustein, 2000). The truth is, without more data on programming and institutional expenditures, it is very hard to determine the effects of the marketplace on what is produced and performed. One could argue that the new era will be able to avoid the tyranny of the majority because artists can now directly reach sophisticated niche audiences through computer-mediated communications. But the highly decentralized nature of the Internet is likely to make it more difficult to reach the attention of more than a small circle of admirers. Indeed, the major problem with such a decentralized distribution system may well be a lack of quality control rather than a lack of quality per se. There will simply be too much material available for consumers to distinguish works of exceptional merit from all the others. To those convinced that the high arts form an aesthetic pinnacle, the new world of the arts that we envision will be inferior because popular tastes rather than true artistic excellence will become the primary arbiter of what does and does not get performed in the nonprofit as well as the for-profit sector. Once again, to the extent that midsized organizations offer centers of creativity and innovation, the potential decline of the middle tier could pose a particular threat. The decline of the middle tier could eliminate the set of organizations that provide the R&D necessary for the continuing growth of creativity and innovation in the arts. On the other hand, the niche markets served by growing numbers of small nonprofit and for-profits could serve as incubators of innovation. Ultimately, of course, the quality of a work of art can only be determined over time. The historical evidence suggests that, during any given period, art of longlasting value is rare and is often not recognized as exceptional either by the public or by critics at the time it is first produced. It is not unreasonable to assume that the same is true of our time. What is crucial, then, is not where a work is first performed but whether it is performed at all and thus has the opportunity to pass the test of time. If exceptional works of art can find expression, then they will be judged, as all works have been, by future generations. Where are such works likely to be per-
45 Where Are the Performing Arts Headed? 113 formed in the performing arts system of the future? The largest nonprofits, although they feature celebrity artists and grand productions, do not rely entirely on traditional programming. Some of the largest nonprofits, such as the Metropolitan Opera and the New York City Ballet, offer some of the most sophisticated and innovative programming in an effort to educate their audiences and maintain their prestige as leading centers of the arts. It seems likely, however, that such practices will remain the exception rather than the rule among most large nonprofits. In contrast, smaller for-profit and nonprofits catering to specialized niche audiences although not necessarily amateur organizations may well be more daring in their programming if they can identify and market to specialized niche markets. The key here is to identify such markets and the products that might appeal to them. Once again, the university sector may play a critical role in making sure that new artistic voices are heard. Because universities, particularly in their research and training (as opposed to their presenter) roles, are much less sensitive to the demands of the market, they will be better able to foster innovation and creativity. In other words, the university may increasingly serve the same basic research role in the arts that it has traditionally played in the natural sciences. According to the natural sciences model, universities, supported by subsidies from the public and private sectors, perform the basic research that is later supported directly by the private sector after the applicability of the basic concepts has been demonstrated and a market established. The final criterion for assessing the implications of current trends for the future is how they will affect access to the performing arts. The most important loss of access to live performances will be in those regions of the country that may lose the midsized organizations that now produce professional performances of the high arts. In other respects, however, availability of the performing arts is likely to increase. Technological advances and the expansion of the small nonprofit and volunteer sectors will provide increasing numbers of productions of a growing variety of creative works. Internet-based arts, however, will not increase access equally, since not all people have access to or familiarity with the new technologies that deliver these performances. In discussing the quantity and availability of artistic productions, it is important to recognize that over time supply will respond to increased demand. Thus, future public involvement in the performing arts will be constrained less by supply of the arts than by public interest in the arts that is, by demand. Indeed, the critical challenge for increasing all aspects of the supply of the arts (quantity, quality, and access) is stimulating greater demand for the arts. How to address this challenge, however, is not altogether clear. Despite the best efforts of scores of institutions and the investment of countless dollars, the
46 114 The Performing Arts in a New Era profile of the average audience for live performances has changed very little over time (Schuster, 1994). Moreover, there is a lack of systematic research on what influences people to take an interest in the arts. What we do know, however, is that the more knowledgeable individuals are about the arts, the more likely they are to participate. Indeed, demand for the arts, like that for other leisure activities, increases with familiarity and experience (Kelly and Freysinger, 2000). This finding, however, begs the question of how to increase the public s involvement and familiarity with the arts. Again, the sparseness of the literature offers few definitive clues for how to accomplish this, beyond noting that early exposure to the arts and to arts education at all levels of formal education can have a lasting effect on individual involvement with the arts. Arts education can, of course, take several forms including arts appreciation, educating people who teach art, and training artists. More attention should be given to arts education in all of its forms particularly in locations where such education is largely undeveloped. Another option is to attempt to build greater crossover between the public s interests and involvement in the popular arts and the high arts. For example, although American teenagers (the dominant demographic groups targeted by multimedia conglomerates) may have had only minimal exposure to theater and classical music, they are much more likely to have purchased recordings of popular music and tickets to films. While it is not clear how to expand those experiences to the more traditional performing arts, it is clearly an issue that should be given more attention by arts organizations. 1 CONSIDERATIONS FOR POLICY The objective of this research was not only to improve our understanding of how the performing arts world operates and where it may be headed, but also to address what this understanding might mean for policy. The arts community has expressly recognized both the need to develop a policy-analytic capability for the arts and the importance of articulating a clearer rationale for a governmental arts policy (American Assembly, 1997). Despite these developments, however, it is doubtful that an adequate framework now exists for setting policy in the arts. Policy, after all, is about choosing the appropriate actions to further public objectives. Thus, a policy framework should be based on a clear understanding of the public interests involved, the roles that government (versus others) could play in promoting those interests, and the strategies that government at every level has at its disposal. The following discussion develops these points and offers some thoughts about the directions future policy might take. 1 Moreover, as we noted in Chapter Four, crossover effects within the performing arts appear to be limited. However, as we also noted, more work needs to be done on this topic.
47 Where Are the Performing Arts Headed? 115 From a public policy perspective, the critical question raised by this analysis is how future developments in the arts are likely to affect the broader public interest. This is a question that has not been given adequate attention by the arts community. Indeed, as the American Assembly acknowledges, the arts community has traditionally viewed arts policy in terms of its impact on arts organizations and artists rather than on the American public. In response, the Assembly has called for a much more explicit consideration of the public benefits of the arts. We agree. As a first step, the arts community needs to devote effort to demonstrating why the arts should be considered an appropriate subject for public policy. In this light, we suggest that the performing arts serve three essential functions for society: 2 1. The arts serve as a source of entertainment, enrichment, and fulfillment for individuals. 2. The arts serve as a vehicle for the preservation and transmission of culture. 3. The arts provide a variety of instrumental benefits for society. These benefits exist at the individual, community, and national level. The first category recognizes that one of the primary functions of the arts is the value they offer to individuals. Indeed, if there were no private demand for the arts, they would not exist. In this sense the arts are a private good that benefits individuals and, in turn, society. Second, the arts serve as a source of culture in the sense that they incorporate the best which has been thought and said in the world (Arnold, 1869). Access to the arts preserves and transmits this culture and thus provides direct public benefits both for current and future generations. Third, the arts provide a wide variety of instrumental or indirect benefits at the individual, community, and national level that are of direct benefit to society in general. For example, at the individual level the arts may promote an openness to new ideas and creativity as well as promoting competencies at school and at work. At the community level, the arts can provide a variety of economic and social benefits, such as increasing the level of economic activity, creating a more livable environment, and promoting a sense of community pride. At the national level, the arts can promote an understanding of diversity and pluralism, reinforce national identity in our cultural products, and provide a source of the nation s exports. 2 The societal interests we identify here include virtually all of the public purposes identified in the American Assembly report, but we have classified them differently.
48 116 The Performing Arts in a New Era These public benefits suggest that the public has a stake in what happens to the arts, and they thus provide a rationale for government policy. But articulating these potential benefits is only the first step. The arts community needs to be able to document them something it has not yet systematically done. Too often, advocates have either asserted their existence or accepted available estimates uncritically. As a result, it is difficult to evaluate and prioritize the various benefits claimed and to develop programs to promote them. Recognizing that the government has a legitimate role in the arts still leaves two important policy issues to address: first, the role government plays in promoting these interests and second, the strategies it employs to do so. In this context, it is important to recognize the unique nature of America s public-private partnership in support of the arts. Unlike the situation in many other countries, the arts in the United States are by and large provided in the private sector. Only rarely is the government directly involved in the production and distribution of the performing arts 3 and, as we have demonstrated, government financing of the arts is a relatively minor component of total revenues. Indeed, the most important government policy in providing financial support for the arts is the tax deductibility of private charitable contributions a policy through which individual donors rather than government officials make funding decisions. The public s long-standing resistance to direct government involvement in setting standards for the arts suggests the ambivalence with which the public views a direct government role in the arts. In a future environment in which the market will play an increasingly important role in determining what art gets produced and distributed, it is appropriate to ask how the responsibility for policy should be divided between the public and private sectors. Schuster (1994) has suggested several roles the government might play. First, government policy might be used to promote market efficiency that is, to prevent the market from producing less than the socially optimal amount of a good. Central to this efficiency argument is the economic principle that whenever social benefits exceed private benefits, the market, because it focuses on the wants of individuals, underproduces such goods. This efficiency rationale is particularly relevant to the instrumental or indirect benefits of the arts, such as increasing the level of economic activity, creating a more livable environment, and promoting competencies at school and at work. It is also relevant to the transmission of culture because the desires of future generations are unlikely to be considered by the market. 3 Even where the government is directly involved in production, as is the case in government-owned facilities, the revenues that support those facilities are often jointly provided by public and private sources.
49 Where Are the Performing Arts Headed? 117 A second role of government policy is to promote equal access to the arts. Issues of access can arise from several sources, including unequal geographic access to the arts, market neglect of the tastes of minority groups, problems arising from poor education, or income disparities. To the extent that the market fails to provide equal opportunities on any of these grounds, it creates an issue of equity that government policy, in principle, can address. Arguments for government support of local arts institutions in small and midsized cities as a matter of civic pride are motivated, at least in part, by this objective. A third role of government policy is to ensure that individuals have sufficient information to make their consumption choices. Government support for the development of the Internet and related protocols are examples of policies that support this objective. In addition, enforcement of antitrust regulations, particularly when they are designed to prevent the selective dissemination of information by small groups of producers and distributors, also serve this purpose. 4 A final role of government policy is to promote the arts because they are inherently good for society a benefit that economists refer to as a merit good. Implicit in this argument is the notion that the arts promote the public welfare and that the societal benefits of the arts are greater than the sum of the private benefits. Although difficult to measure, examples of such merit goods are the effects of the arts in promoting an understanding of diversity and pluralism and expressing a sense of national identity. Unlike other roles, which call for government intervention only when the market fails to function properly, the merit good argument asserts that the arts are intrinsically worthy of government support. Judging the value of the arts relative to other merit goods, however, requires a much more careful assessment of the public benefits of the arts. Within this framework, there is still a question about how the division of responsibility for executing these roles should be divided among federal, state, and local governments. Some of these roles, such as implementing antitrust regulation and policies related to the Internet, clearly fall within the purview of the federal government. Others, such as those relating to public access and to the arts instrumental benefits at the community and individual levels, may be more appropriate for the state or local government. Because preferences for these benefits differ from one part of the country to another, it seems reasonable from a political standpoint for decisions to be relegated to the level of government that is closest to the region the policies will affect. Such a decentralized approach is also consistent with Americans ambivalence toward a single fed- 4 We recognize that enforcement of antitrust regulations is often driven by other considerations.
50 118 The Performing Arts in a New Era eral standard for the arts and their preference for decentralized government decisionmaking. The final element in a policy framework is a set of guidelines or strategies for choosing among the policy tools available. These strategies can be distinguished in two ways: whether they focus on the supply of or the demand for the arts and whether they affect behavior directly or indirectly. Policies that address the supply of the arts focus on influencing the quantity and quality of arts available principally by affecting the behavior of the suppliers of art that is, artists and arts organizations. Policies that address demand, on the other hand, focus on increasing the access and exposure of consumers to the arts. By and large, the focus of most arts policies since at least 1965 has been on supporting the supply of the arts (Chapman, 1992). This focus is reflected at the federal level in the form of direct NEA grants to artists and arts organizations and at the state and local levels both in support for local arts organizations and in the construction of venues to present the arts. However, policies designed to increase the quantity and availability of the arts might be more appropriately targeted at demand. Indeed, if policy discussions are redirected to emphasize the public benefits of the arts, then it seems appropriate to give more attention to strategies aimed at stimulating demand. Both the private and instrumental benefits of the arts are contingent on getting individuals to become involved in the arts i.e., increasing the number and range of people who participate and increasing the intensity of their participation. The transmission and promotion of culture, on the other hand, involve not just increasing public involvement with the arts but also ensuring that high-quality work is created and produced. If one believes that an increasing reliance on the market and popular tastes will not support such creativity, a strategy that focuses on artistic suppliers may be more effective. It is important to recognize, however, that such a supply-side approach inevitably generates public controversy about which organizations, artists, and content the government should support. Unlike the environment for the arts in much of Europe, the expenditure of public funds on the arts in America is often viewed as legitimate grounds for criticizing and censoring artistic content. Regardless of whether policies are focused on supply or demand, policymakers must judge which strategies are most likely to achieve their objectives. In fact, policymakers have a wide variety of strategies, both direct and indirect, to choose from. The most obvious example of a direct approach to support production of art is government grants to the arts; the most important example of an indirect approach is the deductibility of charitable contributions that encourage private donations to the arts. Although these two tools of government policy have received most of the attention of the arts community, there are
51 Where Are the Performing Arts Headed? 119 other approaches. Examples of direct strategies are government funding of arts venues and enforcement of antitrust laws. Indirect strategies include copyright and patent regulations that encourage artists to create new work by protecting their rights to control their work; support for public education, which promotes demand for the arts; and support for development of the Internet as a platform for the arts. These indirect approaches are more diverse, and many of their effects may not be immediately apparent. Choosing an appropriate strategy for policy, of course, requires an understanding of the objectives that policy is designed to achieve. Given the diversity of participants and the multiplicity of interests that characterize the performing arts system, it will be a challenge for that community to agree on what the objectives of arts policy should be. Consider, for example, that in describing trends in the performing arts, we distinguished among consumers, artists, arts organizations, and funders and noted that each of these categories could be distinguished in a variety of ways. Arts institutions themselves differ along multiple dimensions including discipline, sector, size, type, and mission. As in other areas of American society, the risk is increasing Balkanization becoming a nation of niche markets and splintering interest groups which makes it increasingly difficult to articulate the common good. Despite the absence of a policy framework and a clear set of policy goals, we believe the analysis presented in this report offers a direction for arts policy a subject to which we now turn. As we noted above, the central policy issue over the past few decades has been the level of direct federal support for the arts. We believe this focus is misplaced. Although federal funding for the arts has clear symbolic importance as a signal of the arts public legitimacy, it represents a very small (and shrinking) portion of performing arts organizations revenues. Second, the federal government s indirect financial support for the arts through the deductibility of charitable contributions is much more important financially than its direct subsidies. Third, direct federal funding of the arts brings with it increased pressures for artistic standards and cries of outrage from vocal citizens who are offended by specific works of art. Finally, battles over federal funding have diverted energy and attention from other issues that are appropriate to the new era of the performing arts we have delineated in this report. We believe more attention should be given to policy strategies that focus on stimulating demand for the arts. This focus is consistent with the recognition of the need to emphasize the public benefits of the arts and with the increasing role that public demand will play in determining what art gets produced and distributed. Efforts to diversify and broaden arts audiences are also less likely to be subject to the criticisms that have been raised about public subsidies going to arts organizations whose consumers are, on average, more affluent than the public at large. Strategies that focus on stimulating demand are also more likely
52 120 The Performing Arts in a New Era to increase the quantity, accessibility, and diversity of arts that is, to expand the market for the arts than are policies directed largely at supply. Other important issues such as technological change, increasing concentration in the commercial performing arts sector, uncertainty surrounding intellectual property laws, and a potential decline in employment opportunities for new artists have been largely relegated to the periphery of policy discussions. It is time to address them more directly, formulate policy objectives, and assess policy options. Finally, in an arts environment in which private actors will continue to have a major role in determining the future course of events, governmental strategies that rely primarily on direct actions to shape private behavior may not be adequate. Instead, we suggest that the arts policy community explore more creative ways in which government policy can provide incentives that encourage arts organizations and others to support innovative programming, to hire and train new artists, and to increase public involvement in their activities. All these issues will require future research and data collection, as we suggest below. RECOMMENDATIONS FOR FUTURE RESEARCH Throughout this report, we have emphasized the limitations of the data and research on the arts. Here we recommend specific areas in which further data collection and research would be particularly useful. Given the relatively undeveloped state of research on the arts (at least in comparison with such areas as education and health care), it is important to set priorities to focus resources where they can be most effective. We have called for more attention to policies that stimulate public involvement in the arts rather than focusing exclusively on promoting supply of the arts. Little research has been done, however, on how interest in the arts develops, either in general or in specific disciplines, or why people choose certain forms of participation. Most studies of demand have been based on cross-sectional surveys of the national population and focus on estimating levels and correlates of participation. Such studies fail to address the process through which tastes for art are formed or how those tastes can be influenced. We recommend future research in this area. It would be particularly useful to develop and test models that explain how tastes for the arts are formed and how they change and to conduct this research in such a way that it can help inform policy and help arts practitioners who are trying to extend the reach of artistic programs in their own communities. 5 Future research should also examine the role of education in general, and arts education in particular, in the formation of artistic tastes. 5 See McCarthy and Jinnett (2001) for a discussion of how increased understanding of the decisionmaking process can be used to influence participation behavior.
53 Where Are the Performing Arts Headed? 121 Our recommendation that arts policy focus more on addressing demand for the arts reflects the importance that we and others place on the public benefits of the arts. Despite recent efforts to articulate the importance of these benefits, however, no systematic study exists that documents what we know about those benefits or how they relate to arts participation behavior. As a result, it is difficult to evaluate the benefits claimed by arts advocates, much less to draw lessons that will help design effective programs to promote these benefits. What is needed is a systematic analysis of the evidence that exists about the benefits of the arts and how these benefits are related to patterns of arts participation. As we suggested in Chapter Five, although artists are at the center of the creative process, we probably know less about them than about any other part of the performing arts environment. For example, we know that a simple dichotomy between artists who pursue their art on a vocational basis and those for whom it is an avocation greatly oversimplifies reality, but we do not have enough information about artists career patterns, earnings, skill levels, and employment conditions to make finer distinctions. We also know very little about how the institutions and sectors in which artists work affect their employment conditions and career patterns. As a result, although we know that the number of self-defined artists appears to be increasing and that more artists appear to be pursuing their art on an avocational basis, we cannot make any definitive statements about what this might mean for artists employment prospects or working conditions. Most important, we cannot assess what such changes imply for the quality, quantity, and availability of the performing arts. The major constraint on improving our knowledge of these issues is the absence of data. As we noted in Chapter Five, the basic source of data on artists is the Decennial Census of Population. But Census data on artists rely on selfdefinition; fail to distinguish among work done as a performer, other artsrelated employment, and non-arts employment; and contain very little information about employers and virtually none on career dynamics. Although some data exist on such issues, they are neither comprehensive nor systematic. We believe that this situation is unlikely to improve dramatically until better data are collected. In particular, we recommend that systematic employment data be collected that distinguish among the different categories of employment (performing, other arts-related, and non-arts) and describe in sufficient detail the characteristics of employers to which the employment conditions pertain. We also believe that longitudinal data are needed on such elements of the career process as training and experience, career motivations, employment patterns, and institutional experience and how these factors have changed over time. In discussing how the characteristics and financing of arts organizations have been changing, we pointed out several gaps in our existing knowledge. We
54 122 The Performing Arts in a New Era noted, for example, that the major sources of information on the organizational and financial characteristics of arts organizations, namely, the Economic Census and IRS Form 990 data, are much more likely to capture large than small nonprofit organizations and typically contain almost no information on organizations in the volunteer sector. This selectivity is particularly troubling with respect to the volunteer sector, which appears to be an order of magnitude larger than the large nonprofit sector and is growing rapidly. A more accurate description of the trends affecting the performing arts system will require a dedicated data-gathering effort focused on very small performing arts groups especially those in the volunteer sector. 6 A second major gap in our knowledge of arts organizations is the absence of systematic information about institutional expenditures. Although we are able to determine the amount and sources of revenues for nonprofit organizations over time, and thus determine that the earnings gap facing nonprofits appears to be relatively stable, a more complete picture of their financial situation (as well as that of the for-profit sector) requires information on expenditures. In fact, a true test of Baumol and Bowen s cost disease hypothesis requires such information. The absence of expenditure (and cost) data also hampers any discussion of the strategies nonprofit and for-profit firms are employing to deal with changing financial pressures. Although proprietary concerns limit the willingness of for-profit firms to disclose more complete information about their revenues and expenditures, more could and should be done to collect systematic information on nonprofit arts organizations financial situation. Indeed, The Ford Foundation conducted a systematic study of a sample of arts organizations in the 1970s (The Ford Foundation, 1974) and that study could be used as a model for future data gathering and research. Finally, we recommend systematic collection of information on organizational programming and output. As we noted in our discussion of the changing organizational structure of the arts (Chapter Six), we were unable to determine whether the declining average size of most nonprofit arts organizations is a product of the entry of new firms or reductions in size of existing firms. Similarly, in discussing changes in programming strategies of arts organizations, we were forced to rely on anecdotal and specialized studies of existing institutions rather than systematic data on actual programming. In this case, unlike several 6 Important efforts are already under way in this area, such as the Unified Database of Arts Organizations, which is being constructed through the joint efforts of the Urban Institute s National Center for Charitable Statistics (NCCS), the NEA, and NASAA; and the National and Local Profiles of Cultural Support project, which is being cosponsored by The Pew Charitable Trusts, Americans for the Arts, and the Arts Policy and Administration Program of Ohio State University.
55 Where Are the Performing Arts Headed? 123 others, the problem may stem less from the absence of such data than from the way existing data are collected and maintained by service organizations. Some service organizations collect information on programming and output but generally do not report that information. Although more systematic procedures could be used in collecting and compiling such information, the organizations involved will need to be convinced that there are benefits to doing so. We recommend that this case be made.
56 Appendix A: Large Indoor Theaters State Name URL/Contact Info Capacity How is it owned and operated? What goes on there in a given year? How do they perform on a financial basis? How is the private sector involved? Are there other large facilities in their market and how do they position themselves? How and why do they succeed? How culturally-oriented is the program? Is the building perceived as being artsfriendly? Anecdotes "Our seating can vary from 1,900 to 5,000 for concerts, 5,500 AZ Dodge Theatre, Phoenix / Bob Machen, (602) 379- for sporting or corporate events, and with innovative moving 2090 sidewalls, provides an intimate setting for proscenium events." Privately funded - named after Dodge Trucks Phoenix Symphony, Sinbad, Brian Wilson, Megadeth. "Broadway to boxing" Designed to maximize revenues, believe that 6,000 seat theaters are very successful Privately funded Cricket Pavilion Amphitheater 19,910 - Music Moving walls provide flexibility to go from 5,500 seats to 2,500-3,000 to an intimate 1,900 seats Moderate Moderate Cost of maintaining it and trying to sell AZ ASU's Sundome, Sun City West (Phoenix) (480) (Annie) 7,030 Owned by Arizona State University; Managed by ASU Public Events Management Team shows has been the burden. Has never done well financially, because it is so hard to Symphony of the West Valley, Musicals, ASU Wind Symphony, Graduations, sell 7,030 seats. It is now closed - after this Carol Channing, Ms. Senior AZ year, transitioning from ASU ownership/operation to either the County Not really involved ASU's Gammage Auditorium 3,000 - Grand Opera, Musicals, Theater, Organ Recitals and Lectures The Sundome has not been successful High Yes No obstructed view - no pillars Built by Dell E. Webb used for marketing purposes with small model homes set up in the lobby - bused people in and sold them their houses. Sold Sundome it to the State of AZ for $1 or State Yes - in the past they have had a lot of ballets & operas - not as much lately CA Shrine Auditorium, Los Angeles / (213) General Manager's Office (213) Fraternity Office 6,300 Ballet, opera, awards shows, two ring circus, graduations. This is the Many other large facilities - this one is truly grand. It was Owned by the Shriners Fraternity, a nonprofit organization. Operator - Al headquarters of the Al Malikah Temple, a division of the Ancient Arabic the largest when it was built and has a very impressive The biggest - 6,300. Historic building, they are just known in the Malaikah Shrine Auditorium Company. also under the Fraternity, but Order of Nobles of the Mystic Shrine. "The Shrine Auditorium is where the More than breaking even - everything is Auditorium company operates the building - appearance both inside and out. industry, known because of their history of being the Shrine separated for financial reasons. Rentals to people who call for concerts, entertainment industry holds many of its awards presentations. The separate. rents auditorium and expo center Wiltern Theater 2,310 - Music Auditorium. Have repeat clients that come in every year at the international concerts, Dick Clark Productions, CCE (management would Academy Awards, The Grammy's, and the American Music Awards have all Staples Center Arena - Sports & Live Entertainment same time - awards shows, etc. not turn down the opportunity to have a standing operator). been held here in recent years." Kodak Theatre 3,600 - Music, Theatre & Awards Moderate - dwindling as of late. because these groups are not "In 2002, they finished a $10 million restoration of the Shrine which has approaching the Shrine for rental brought back a lot of the old Hollywood grandeur to the fading opportunities. Management believes auditorium, replacing the seats, restoring the wood floors and making the auditorium is too big for operas and ballets interior once again a bright, colorful venue. The exterior of the building is attempt to host Russian Ballet was cancelled now beige with gold domes (instead of the previous faded white)." due to poor ticket sales. Open rental policy any organization that can afford to use the facility will be accommodated, schedule permitting. "Since opening in November 2001, the theatre has hosted a range of CA Kodak Theatre, Los Angeles 3,400 prestigious artists and events including the Academy Awards Ceremonies, Very successful in every event they bring in - Owned by Eastman Kodak, operated thru Amschutz Entertainment (AEG) - Celine Dion, Prince, Elvis Costello, Barry Manilow, American Ballet Theatre, Most of the programming comes thru AEG majority of them are sold out. Shut down for Staples and Home Depot Moscow Stanislavsky Ballet, AFI Life Achievement Award to Tom Hanks, ESPY live the entire month of February Awards, American Idol finals, GREASE starring Frankie Avalon, Dixie Chicks Wiltern Theater 2,310 - Music Staples Center Arena (cut down) Shrine Auditorium 6,300 It s the Kodak Theater! They are famous for hosting the Academy Awards - located in the center of Los Angeles, etc. Very Yes $94 million project completed in 2001 and more." "What was once an outdoor stunt stage for Universal Studios Hollywood 6,189 seats (with general admission Orchestra Pit) has become the theater that young performers dream to play and from 6,089 seats (without general admission Orchestra Pit) which many careers have catapulted to superstar status after wowing the CA Universal Amphitheatre Universal City (LA area) Reduced capacity intimate seating = Approximately 3,900 seats ttp:// "In 1982 Universal Amphitheatre reopened as a state of the Owned by Universal Studios and House of Blues is the exclusive promoter art indoor venue with the best sight lines and acoustics in the industry." Pop, Rock, Latin Music Making money - would not have a venue if not making money Operated by HOB. Wiltern Theater 2,310 Music Staples Center Arena (cut down) Kodak Theatre 3,400 Shrine Auditorium 6,300 Program 125 nights per year. Competes with CCE, AEG amongst others Artists/managers determine some of the venue location information for how they want to run their tour Not really Not really crowds." "Nestled atop the hill on the lot of Universal Studios Hollywood, the Amphitheatre is equally convenient to both Los Angeles and the San Fernando Valley. With its own on and off ramps to the Hollywood Freeway, the Amphitheatre is easily accessible to all of Southern California-and just minutes from downtown, Century City, Beverly Hills, sp Hollywood and the Burbank Airport." CT Now.com (Meadows) Amphitheater 24,600 Music CT Oakdale Theatre, Wallingford CT Conventional proscenium configuration. Open all year round, Oakdale now has 4,600 seats Clear Channel Entertainment, Inc. Touring Theater, Music, Familiy Programming CCE CT Now.com (Oakdale) Theater 4,800 Music Bushnell Theater ~1000 seats Somewhat - Broadway touring shows Somewhat Mohegan Sun Arena DC DC Armory, Washington Seating Capacity: 10,000 - sports/theater, 4,500 - "The D.C. Sports & Entertainment Commission, an independent agency of cabaret/formal dining "The Armory also can be adapted to the District of Columbia government, is responsible for the management "The D.C. Armory is Washington's auditorium, arena, big top and ballroom. audiences of varying sizes from 1,000 to 10,000 people. Its and operation of Robert F. Kennedy Memorial Stadium, the D.C. Armory Under this huge dome, the people of the nation's capital come to enjoy the Mr. cavernous interior can be readily transformed into an elegant and their adjacent facilities and for presenting and promoting sports, nation's extravaganzas. It's a year-round parade of exciting events in an Harper, Operations Manager setting for formal social affairs. Food service runs the gamut entertainment and special events in the District and the Washington, D.C. historic showplace. The D.C. Armory has played host to conventions, oharper@dcsec.com from finger sandwiches to crystal champagne fountains. Its metropolitan area. The Commission is overseen by an 11-member board circuses, inaugural balls, horse, home, car, and food shows. You name it entrance may become a handsome carpeted theater lobby of directors, led by Chairman John Richardson." and the Armory can handle it." which guests enter via a canopy." Not really involved. Yes - but this is more like a stadium or arena. Revenues from the RFK stadium events and rentals. Limited No "Parking Capacity: 10,000+ cars, 300 buses" D.C. Armory Rental Rates Arena: $7, per day Move In and Out: - $1, Allstate Arena Arena 17,500 - Music Arie Crowne Theater - Theatrical Ford Center Theater for the Performing Arts Oriental Theater 2,253 - Theatrical IL Rosemont Theater, Rosemont, IL (847) , Ron Stern, General Manager: 4,402 Clear Channel Entertainment, Inc. Chicagoland Pops Orchestra, Bill Cosby, Broadway musicals CCE is the promoter Shubert Theater 1,870 - Theatrical CCE dominates the market Moderately Moderately ronstern@rosemont.com The Cadillac Palace Theater 2,344 - Theatrical The Tweeter Center Chicago Amphitheater 28,000 - Music United Center Arena 20,000 - Music There are three seating arrangements with capacity = 4,249, 2,741 and 2,034. "Striking new architectural elements provide IL Arie Crown Theater Chicago the most visible changes to the 4,249-seat Arie Crown Theater. The masts and sails bring the side walls inward while new clouds lower the once high ceiling to improve the acoustic Owned by a municipal corporation est. by state statute - Metropolitan Pier A lot of corporate events (227 days/year) part of the McCormick Place - the (312) (production and reduce the volume of space by 30%. Elegant box seating and Exposition Authority jointly governed by the city and the state. Rental country's largest convention center. Other half are concerts (no rap, mostly offices) has been added beneath the sails. The result is a more house, director does the programming. R&B, pop, ethnic) and plays intimate theater with dramatically improved acoustics and state of the art sound reinforcement system." Performing very well financailly Other than renting it, no. Auditorium Theater - Roosevelt University 3,996 Chicago Theater 3,600 Mostly the difference is the convention business (industrials) = 40- Civic Opera House 3,500 50% of the business. Location, being attached to the convention Ford Center Theater for the Performing Arts Oriental center Theater 2,253 The Cadillac Palace Theater 2,344 Very Yes - home of all the major Broadway shows. 1st class legitimate theater. =52 "Radio City Entertainment, a part of the Cablevision family of companies NY Radio City Music Hall feedback@radiocity.com and a division of Madison Square Garden, is a worldwide entertainment company recognized for its signature combination of event production and entertainment marketing. Radio City Entertainment presents and promotes live entertainment events at Radio City Music Hall, Madison "For most events, the seating capacity is approximately 6,000, "Today, the Music Hall still premieres selected films, but is best known as the Square Garden, and the Theater at Madison Square Garden. In however, this capacity does change depending on the scaling country's leading hall for popular concerts, stage shows, special attractions addition, Radio City Entertainment develops events and attractions that of the event." and media events." appear nationally and internationally. Radio City Entertainment produces A Christmas Carol and the world-renowned Radio City Christmas Spectacular, the National Tour of The Scarlet Pimpernel and co-produces the Broadway musical Footloose." "Radio City Entertainment also presents concerts in other cities and venues, among them Carnegie Hall, Avery Fisher Hall, Town Hall, The Meadowlands and Constitutional Hall in Washington, D.C. In live family entertainment, Radio City Entertainment is a Yes. Radio City Music Hall is the largest space of its kind leading promoter. The recent line up of one-of-a kind attractions, in the New York Metropolitan Area. includes sell-out shows such as Rugrats, Barney, Riverdance, Sesame Street Live, The Harlem Globetrotters, Lord of the Dance, Disney on Ice, and many more." Moderately Yes Webb Management Services, Inc. Page 1 12/21/2004
57 Appendix A: Large Indoor Theaters State Name URL/Contact Info Capacity How is it owned and operated? What goes on there in a given year? How do they perform on a financial basis? How is the private sector involved? Are there other large facilities in their market and how do they position themselves? How and why do they succeed? How culturally-oriented is the program? Is the building perceived as being artsfriendly? Anecdotes Privately owned by Paul Allen and operated by the Oregon Arena OR Theater of the Clouds at the Rose Quarter in Portland, Ore Event Booking (503) theater-within-an-arena Arena = 20,000 Theater of the clouds = 3,000-6,000 Corporation, also owned by Allen. "Allen's company tried but failed to talk nightclub operator House of Blues to open a venue there in Allen's company filed for protection with the U.S. District Bankruptcy Court in Portland on 2/27/04. The proposed reorganization plan would allow a "According to the Chapter 11 filing, new company -- called NewCo in the court papers -- to buy its assets for although the company had revenues of $50 million. The Multnomah County assessor's office says the true market Theatre-of-the-clouds holds smaller concerts, panel discussions, speakers, more than $40 million in 2002, it lost more value of the properties is more than $105 million. The company still owes no plays. Arena is a sports arena that also has large rock and pop concerts. than $2.5 million that year." bondholders more than $130 million. According to company President Steve Patterson, the Chapter 11 filing is intended to allow the company to gi?id=23310 continue operating while it renegotiates what he considers a crushing debt load. The filing listed estimated corporation debts at more than $100 million and company assets at between $10 million and $50 million." Mr. Paul Allen Have some orchestra, manheim The Rose Garden and the coliseum are the largest. In steamroller concert, michael flatley dancing, competition with Clark County Amphitheater in Competition w/ amphitheater, not very popular team but have lots lots of basketball and hockey games - book Washington state for pop and rock concerts and theatre of new players so hopeful but ticket sales have dropped off. out whole arena more frequently than the during the summer season theatre in the clouds. yes "We were one of the first venues to do more than just hang a curtain across the back of the stage to cut down the arena," says Jay Isaac, senior VP of sales and marketing for the Rose Quarter complex. "We spent a lot of money on our programmable acoustic ceiling--what we call an 'acoustic cloud'--plus full curtaining to accommodate audiences of as few as 2,000 to as many as 6,500 in an intimate theater setting. The acoustic cloud is the only dual-sided, moveable and completely programmable arena ceiling in the world. "Sound engineers come into the building and actually tune the ceiling to fit their sound system and the type of music," Isaac says. "Many sound engineers have told us that we have the best sounding large venue in the world."" Ray Waddell, Billboard "Since its February 2002 opening, the facility has hosted many great concerts by the EAGLES, Enrique Iglesias, Carlos Santana, B.B. King, TX Nokia Live at Grand Prairie (formerly NextStage) - (972) Grande Prairie (Dallas/Fort Worth Metroplex area) "NOKIA Theatre s proprietary 6,350-seat design combines Coldplay, Jeff Foxworthy, Luis Miguel, Alanis Morissette, REO Speedwagon, "NOKIA Theatre is operated by the Anschutz Entertainment Group (AEG), the best features of today's performing arts centers, sports Pink, Travis Tritt, Styx, Jo Dee Messina, Bonnie Raitt, Lyle Lovett, Jewel, Marc one of the leading sports and entertainment companies in the United arenas and amphitheaters with the latest in entertainment Anthony and many more. Other great shows have included The Radio City States." technology." Christmas Spectacular starring the World-Famous Rockettes and family No Not really shows like Blues Clues and Sesame Street LIVE." Webb Management Services, Inc. Page 2 12/21/2004
58 Appendix B: Large Outdoor Theaters State Name URL/Contact Info Capacity How is it owned and operated? What is the operating season? What goes on there in a given year? How do they perform on a financial basis? How is the private sector involved? Are there other large facilities in their market and how do they position themselves? How and why do they succeed? Parking Anecdotes Current seating capacity of just under 18,000 - benches Own programming office - lease the bowl from the county Dept of Rec end of June - Oct 16 Lease events - Sting and Annie Lennox, REM, Rod Stewart. KD Generate a profit and surpassed their goals by $500K. Donor sponsorships The biggest outdoor facility in LA - Greek Theater seats In LA, home of the Philharmonic - alluring to hear classical music 2000 parking spaces w/18000 seats. Good park and ride program for $2.50 from CA Hollywood Bowl Los Angeles Matthew in the Press Office (213) , and box seats and Parks (25 more years to go). LA Philharmonic Association is a nonprofit 501 c 3 Lang, Harry Connick Jr, World, Jazz music, Frank Sinatra. "The Hollywood Bowl has been the summer home of the Los Angeles Philharmonic since its official opening in 1922." Indoor: Shrine Aud next has 6300, Staples Center outside in LA - only had to cancel 4 concerts in the history of Hollywood. many locations throughout LA proper. CA Verizon Wireless Amphitheater Irvine (LA area) (949) ,300 Clear Channel Entertainment, Inc. Summer season only Music Hyundai Pavilion at Glen Helen Amphitheater 65,000 Music Wiltern Theater 2,310 Music Universal Amphitheatre indoor amphitheater "Perhaps the crowd missed the expected response because most were there to see Young, or perhaps it was because the sound at Verizon may be the worst of all southland venues." By Karl Peterson, Daily Forty-Niner 12,500 : 7,932 reserved seats; 4,568 lawn seats Clear Channel Entertainment, Inc. operates the facility, but it is April-October Home & garden shows, RV shows- in parking lot in October. "During CCE has the exclusive booking rights Fillmore Auditorium Theater 1,189 Music Approx 5000 spaces "Nestled in the foothills of Mount Diablo, the Chronicle Pavilion at owned by the city of Concord. the past quarter century, the historic Pavilion has built a reputation there. Mountain Winery Amphitheater 1,750 Music Concord is an entertainment showplace that has been enjoyed by within the performing arts industry for combining commercial success Punchline-San Francisco Club 175 Music millions of people since first opening its doors in Located in with public service. The Philharmonic Orchestra of New York and Shoreline Amphitheater Amphitheater 25,000 Music Concord, California, 28 miles northeast of San Francisco, the Chronicle Pavilion CA Concord (San Francisco area) Los Angeles, Cher, The Dave Matthews Band, Shania Twain, Tony Bennett, Aerosmith, Destiny's Child, R. Kelly, and Diana Krall are just a few of the top performers at the pavilion over the years." Warfield Theatre Theater 2,587 Music Pavilion plays a key role in the performing arts of the San Francisco Bay Area, home to more than six million people in one of the world s leading live entertainment markets. In 1996, the Pavilion began a new era after a $19.3 million renovation designed by world-renowned architect Frank O. Gehry, the building s original architect ,189 seats (with general admission Orchestra Pit) Owned by Universal Studios and House of Blues is the promoter Year-round Pop, Rock, Latin Music Hyundai Pavilion at Glen Helen Amphitheater 65,000 Music The biggest outdoor facility in LA - Greek Theater seats Paid parking within the venue "What was once an outdoor stunt stage for Universal Studios 6,089 seats (without general admission Orchestra Pit) Wiltern Theater 2,310 Music Indoor: Shrine Aud next has 6300, Staples Center Hollywood has become the theater that young performers dream to reduced capacity intimate seating = Approximately 3,900 play and from which many careers have catapulted to superstar status seats after wowing the crowds." CA Universal Amphitheatre Universal City (LA area) "In 1982 Universal Amphitheatre reopened as a state of the art indoor venue with the best sight lines and acoustics in the industry." nfo.asp Tad Bowman Facility "Up to 9450 people can be seated in the amphitheatre, Serve as a landlord - CCE & House of Blues agreements that they April-October Beastie Boys, Blues Traveler, Norah Jones, REM, James Taylor, Even with all the competition in town, if you look at the Promoter, they are a governmental Fiddlers Green - Coors Amphitheater (typical shed - House of Spectacular location - unique and beautiful. Doesn't have all the Parking lots are gravel on site - require that the promoter collects parking fee in the "Nestled in the Rocky Mountain Foothills fifteen miles west of Manager, (303) , tad.bowman@ci.denver.co.us and every seat has an unobstructed view of the stage will do a certain # of shows, "Red Rocks Amphitheatre is owned by Opening band then to the Film, pop/rock events, CO Symphony tries concert competitions in town - Denver/Boulder - Red Rock agency and have some corporate Blues), Pepsi Center (arena), Invesco Field (stadium), Botanic amenities of the Pepsi Center with all the new and shiny but just ticket price - $3.50 added to the top of the price. Bundled into the price per ticket. Denver, there stands a symbol of nature's unparalleled majesty. Red and perfect acoustics!" the City and County of Denver and is operated by the Division of to do a couple but have been rained out the last couple of years - still has more summertime concerts than any of the other sponsors (Coors, etc.) Gardens (2000 seats), City Lights Amphitheater/Pavilion 4,400 what it is - people enjoy it. Performers want to play it - Gypsy Kings Rocks is a geologically formed, open-air Amphitheatre that is not Theatres and Arenas (has a booking department), which also Opera on the rocks and the Patriotic Concert near 4th of July venues. Absolutely successful. Music said you guys don't understand b/c you're here all the time, but to us duplicated anywhere in the world. With Mother Nature as the CO Red Rocks Amphitheater Morrison (Denver area) ml#faq18 manages The Historic Denver Coliseum, and The Denver Performing Arts Complex." Denver Fillmore Auditorium Theater 3,000 Music and everybody around the world this is where you want to play. architect, the design of the Amphitheatre consists of two, three hundred-foot monoliths (Ship Rock and Creation Rock) that provide acoustic perfection for any performance." Peter (203) built to be enclosed - airport hanger doors that can come Clear Channel Communications Inc. Open seasonally, approx. May-Oct. every once in a while they have a Mostly Rock & Pop Music - no classical CCE owns, operates and books. CCE owns both the careerbuilder.com Oakdale and the Have about 5 lots that they own, and some renegade lots outside the company that ctnow.com Meadows down for winter shows - never close the doors in the winter event - not enough tours for a winter show Meadows. have a parking lot or company that came up as a result of excess - just charge on CT Music Theatre summer, probably built this way for winter shows. 24,600 includes lawn. 6,500 with airport hanger doors - show nights just have heat no a/c. 20,000 - The covered pavilion has 9,500 seats and the Music - contemporary Christian artists Opened July 2004 Opened July "The most important test of the new amphitheater, lawn has a capacity of 10,500. "The Ford Amphitheatre of course, was the sound, and thanks to additional speakers at the is the largest concert complex in Tampa Bay, so it only edge of the lawn, the music was as crisp in the general-admission seems natural that everything associated with it would area as in the lower levels. It was refreshing to hear lyrics clearly after FL Ford Amphitheatre Tampa Bay be bigger, too. There were three banks of restrooms, with more than twice as many toilets and urinals as years of them getting lost in a muddied jumble at sports arenas. It wasn't quite the "CD-quality acoustics" that the venue's press comparable venues." Rod Harmon, Sarasota Herald- releases claimed, but it was a marked improvement." ROD Tribune HARMON, Sarasota Herald-Tribune IL - Curt Adams, Director of Facilities (847) 266- Pavilion seats 3,400, includes the lawn seating capacity Owned by a nonprofit trust, IL np corporation w/a Board of volunteers. Summer June 1 to Labor Day but Ravinia Festival presents its "Ravinia s 3,200-seat open-air, covered Pavilion is the summer home "Been doing okay lately." 2003 revenues = $22,842,551, 5000 in excess of 18,000-20,000. The lawn capacity has no Run by the staff that the Board has put in place. Rising Stars concert series October through May in Bennett Gordon of the Chicago Symphony Orchestra, jazz luminaries and legends, expenses = $19,683,108, net gain = $3,159,443 view of the stage. Hall. The series features the best young artists in classical music. and some of the greatest pop, folk, blues and country musicians of About 20 pop concerts per year - Tony Bennett, Don Henley today. Since the early 1900 s, Ravinia has presented opera in concert. Today, it continues that tradition with rare productions of world music, as well as concert performances of opera with supertitles and musical theater." Ravinia Highland Park, north of Evanston (Chicago area) Donors and sponsors about 1/2 of the Millennium Park home of another orch, wants the Chicago In the past had the Chicago Symphony, you could picnic or you Biggest problem that we have - we can park 1/2 of capacity on-site. Then there is revenue for support. Symphony - all events are free (Ravinia is the home of the could buy everything for dinner there - come right from work with a remote park and ride system where they use municipal lots and use buses from Chicago Symphony Orchestra). Chicago wanted something nothing or with a full picnic. Able to keep the prices really low - MTA to move the people. Use money from on-site lots to pay for the park and ride downtown. No pops shows, only classical last summer so no lawn used to be $6 now it's up to $ Donations have remained system - it's about a wash. immediate effect. Tweeter Center is about 75 miles from about the same, but costs have gone up. Have a contract with the Ravinia in Tinley Park - Ravinia doesn't book the same kind of Chicago Symphony and pay the symphony whereas the city would acts. Ravinia doesn't have the capacity and doesn't like to not. Has a year round program with education and community charge those kinds of prices - mission oriented to serve the outreach. community. Allstate Arena Arena 17,500 Music Ford Center Theater for the Performing Arts Oriental Theater Theater 2,149 Theatrical Rosemont Theater Theater 4,402 Music Shubert Theater Theater 1,870 Theatrical The Cadillac Palace Theater Theater 2,350 Theatrical The Tweeter Center Chicago Amphitheater 28,000 Music United Center Arena 20,000 in the round Music J Pritzker Aphitheater (Millenium Park) 11,000 Arie Crown Theater Petrillo Music Show - Grant Park 12,421, capacity of the shed is 5,125 seats Boston Symphony Orchestra, Inc. a 501 c 3 nonprofit July 1 - September 5 Dave Brubeck, Harry Connick, BSO, Mark Morris Dance, Prairie Cannot separate Tanglewood financials from BSO Donor sponsorships Avalon Club 1,350 Music Similar to Ravinia and Hollywood Bowl they are the home to the "Tanglewood offers a wide range of visitor facilities and activities area=tgl Home Companion financials on guidestar Charles Playhouse (main stage) Theater 725 Theatrical Boston Symphony Orchestra including tours of the grounds, exhibits at the Visitor Center, services Colonial Theatre Theater 1,704 Theatrical for disabled patrons, two cafés, two gift shops, special event planning FleetBoston Pavilion Amphitheater 5,000 Music such as group picnics and receptions - all of this amidst the inspiring MA Tanglewood Shed Orpheum Theatre Theater 2,700 Music Paradise Club Club 850 Music sounds of musicians performing throughout the Tanglewood grounds." Tweeter Center for the Performing Arts Amphitheater 19,500 Music Wilbur Theatre Theater 1,223 Theatrical The amphitheatre has a 19,900 capacity with Clear Channel Entertainment, Inc. Summer season only Music Avalon Club 1,350 Music CCE owns and/or operates the competition as well. "For all events at the Tweeter Center, only passenger vehicles are permitted to "Video screens on the lawn and at our concession areas make sure 7,000 reserved covered seats in the pavilion, 7,000 open Charles Playhouse (main stage) Theater 725 Theatrical park in our lots. Box trucks, trailers, or other large commercial type vehicles are you don't miss a moment of the show. Please note, all of our MA Tweeter Center for the Performing Arts Mansfield (Boston area) air uncovered seats (Reserved seats or GA-General Admission, depending on the show), and general admission on the lawn (which means first come- first served) Colonial Theatre Theater 1,704 Theatrical FleetBoston Pavilion Amphitheater 5,000 Music Orpheum Theatre Theater 2,700 Music Paradise Club Club 850 Music prohibited. Buses and recreational vehicles are allowed. Please know 'nothing in tow' is allowed. We do not allow tents to be put up in our parking lots." performances are rain or shine." Wilbur Theatre Theater 1,223 Theatrical 15,274 Total *7,202 pavilion, *8,072 lawn seats. Clear Channel Communications Inc. DTE Energy Music Theater is open from May to September. On Music " Named America's Top-Grossing Amphitheater Clutch Cargo (Pontiac, MI) Club 1,400 Music CCE owns and/or operates the competition as well. There are 6,000 parking spaces at DTE Energy Music Theatre with 52 "Since taking over ownership and management of DTE Energy average DTE Energy Music Theater has approximately 70 to 80 - Amusement Business " Historic St. Andrews Hall Club 1,000 Music handicapped locations near the East Entrance. Music Theatre in November, 1990, Palace Sports & Entertainment events each summer. Meadowbrook Music Festival Amphitheater 7,619 Music has invested more than $23 million to renovate and refurbish every 9=el3&pageid=692 State Theater Theater 2,800 Music facet of the facility. In 2001, DTE Energy Music Theatre was named DTE Energy Center The Palace at Auburn Hills Arena 15,000 (5) Music Top Outdoor Concert Venue for tickets sold by Pollstar as well as MI Clarkston (Detroit,/Ann America's Top-Grossing Amphitheater by Amusement Business. Arbor/Flint area) See the complete list of awards." Webb Management Services, Inc. Page 1 12/21/2004
59 Appendix B: Large Outdoor Theaters State Name URL/Contact Info Capacity How is it owned and operated? What is the operating season? What goes on there in a given year? How do they perform on a financial basis? How is the private sector involved? Are there other large facilities in their market and how do they position themselves? How and why do they succeed? Parking Anecdotes Sean Smith (314) , Municipal 10,813 - completely open air They are a nonprofit proforma corporation - pre-date 501 c 3. They mid June- mid August Musical Theater, rock & roll in the past 2003 revenues = $10,104,981 ($7,362,448 in ticket sales), Donors and sponsors Competition is set up to do the one night shows - don't really Sit in the middle of Forest Park - zoo, history museum, art museum - There are a couple of parking lots around them - push from the park is to maximize "the nation's oldest and largest outdoor theatre" - Theatre Association of St. Louis have their own programming and producing division net gain = $153,857. Very fortunate in the past compete with them too much because it is a different type or rock shows don't fit into this scene. Invested money into bringing it the green space - mainly street parking. All parking within the park is free - can completed 86th season When we were doing rock and roll shows, MO The Muny St. Louis couple of years they have been a little above breaking even - shows pay for themselves might have 2 that lose money but then they have 5 that make money. Have crowd. The ones who would compete with are more traditional back up to the original situation. Could host the rock shows now, indoor theater. but have positioned themselves now differently. park on the side of the street and walk. they did not produce, it was a production group and were used a rental facility. enough to cover overhead. (314) or Can "accommodate nearly 20,000 per show. UMB Bank Owned and operated by Clear Channel Entertainment Summer season only "UMB Bank Pavilion provides a musical variety of rock, alternative, "With Over 350,000 patrons pouring through it's gates CCE owns, operates and books. Approx 25 miles outside of St. Louis "Parking lots typically open 2 hours prior to show time. To give patrons more time jeniferstumpf@clearchannel.com Pavilion holds approximately 7,000 reserved seats, with pop, country, jazz and rhythm & blues along with special events annually, UMB Bank Pavilion has established itself as The American Theater 2,000 Music to enter on sold out shows, parking lots will open 3 hours prior to show time on another 13,000 lawn seats providing a picnic-like setting and festivals of all kinds." one of the premier outdoor concert venues in the country!" The Pageant Theater 2,500 Music these selected shows. Two entrances and more than enough parking spaces in under the stars." The Fox Theater well-lit secured lots make access to UMB Bank Pavilion easy. No parking fees UMB Bank Pavilion Powell Symphony Hall are collected upon arrival at the lots. All ticket prices include parking fees. MO Maryland Heights (St. The MUNY Premier Parking is available for $15. For more information on Premier Parking, Louis) Savvis Center - hockey rink visit the Directions/Parking page. Specialized spaces have been designated, Edward Jones Dome - football arena including disabled parking and parking for motorcycles. Ask the parking attendant for more information." (856) , Curt The first-of-its-kind year-round facility serves as a 25,000 New Jersey Economic Development Authority (NJEDA) owns it and Year-round String Cheese Incident with special guests Ratdog, the Pixies, 2nd largest grossing amphitheater for CCE in the US (1st Gross lease the facility to CCE All competitors in this market are now booked, owned or CCE owns and/or operates the competition as well. The area used There approximately 8400 parking spaces in well-lit, secured lots within the Coopers Ferry, nonprofit development corp., that was created by Voss, Dir of Operations at Tweeter Center; Anthony Perno capacity outdoor amphitheater during the summer months gross leases it to Clear Channel Entertainment, Inc. CCE has Music - rock & pop is the Tweeter Center in Boston). There is no property tax operated by CCE. to be controlled by the Electric Factory, CCE came in and bought immediate vicinity of the Tweeter Center. General parking fees range from $10-$20 Camden and corporate funders to develop the Camden waterfront. (perno@camdenwaterfront.com) and Joe Meyers which features a huge lawn with giant video screens, priority over programming in the summer and SJ Performing Arts on it, in lieu of this there is a pilot payment that is required. Electric Factory Club 3,000 Music the Electric Factory and promoted their CEO to a Vice Pres within per car depending on location of the lot and type of show (standard evening They wanted it converted to viable use from an economically (meyers@camdenwaterfront.com) at Coopers Ferry (856) 757- state-of-the-art computerized sound enhancement, and Center has priority over programming in the winter (tends to showcase CCE currently has to pay the city of Camden $0.50 per Ford Pavilion at Montage Mountain Amphitheater 17,500 Music CCE. concerts are $10-$15 and festival concerts are $15-$20). Prices for early arrival or depressed area. CCE doesn t like the fact that they were forced by NJ Tweeter Center at the Waterfront Camden (Philly) 9154 spectacular views of the Philadelphia skyline and Ben local groups). CCE is frustrated by the arrangement and claims they Franklin Bridge to the West and North. In the fall and could do more in the winter if it weren't for SJPAC. winter, the Tweeter Center converts to a fully enclosed, climate controlled, flexible capacity theatre for 1,600- ticket at beginning going up to $2.50 per ticket - this is in place for 30 years. CCE keeps the parking and food sales, tix and merchandise goes to the artist. Hershey Star Pavilion Amphitheater/Stadium (counted as amphitheater) 7,500/25,000 Music Merriam Theater 1,870 Theatrical Theater of the Living Arts Theater 810 Music oversized vehicles (busses and limos) may be higher. Designated "Accessible Coopers Ferry to have an enclosed, year-round facility (8000 seats). Parking" spaces are available in the "Preferred Parking" lot adjacent to the main They find it hard to program in the winter and hard to convert into an entrance of the facility. Parking lots open 2 hours prior to show time. indoor space - need to bring in things (carpet, lights, etc) to spruce it up so it doesn't just look like a shed. 7,000 guests offering a variety of concerts, Broadway Tower Theater Theater 3,067 Music theatrical productions and family entertainment. and (732) "The amphitheatre accommodates 17,500 guests and "The amphitheater is owned by the NJHA and operated by GSAC "The concert season begins late in May and continues through "The concert season begins late in May and continues through "PNC Bank Arts Center has been among the Top Five CCE is the operator of the facility Beacon Theatre Theater 2,849 Music "Secure, well-lit parking is available directly on site for most shows. For capacity features both reserved and general admission seating. Partners, a wholly owned subsidiary of Clear Channel September featuring between 45 and 55 performances by artists September featuring between 45 and 55 performances by artists most successful amphitheatres in the country each year Ford Center for the Performing Arts Theater 1,812 Theatrical crowds, additional parking is available in lots adjacent to the Arts Center." There are 7,000 comfortable theatre-style seats in the Entertainment." representing every musical style including rock, pop, country, jazz, representing every musical style including rock, pop, country, jazz, since 1990." Hammerstein Ballroom Theater 3,600 Music open-air pavilion and room for another 10,500 fans on the rhythm and blues, oldies and more. The special events and festivals rhythm and blues, oldies and more. The special events and festivals Irving Plaza Theater 1,121 Music gently sloping lawn." are also featured each season." are also featured each season." Mohegan Sun Arena Arena 9,000 Music PNC Bank Arts Center Amphitheater 17,500 Music Tommy Hilfiger at Jones Beach Theatre Amphitheater 14,400 During the winter months, The PNC Bank Arts Center is home to Music New Jersey's premiere holiday light-park, the Holiday Light Westbury Music Fair Theater 2,870 Music NJ PNC Bank Arts Center Holmdel (NY area) Spectacular. The Holiday Light Spectacular provides a brilliant presentation of over one million lights, and over 130 displays of holiday spirit, viewed during the two-mile drive from the comfort of your own car. In addition to the holiday light displays, this park features a Holiday Village. The Village located at the end of the drive invites families to step out of their cars for refreshments and pictures with Santa. The Holiday Light Spectacular is fun for everyone who loves the holiday time of year. Make this event a holiday tradition for years to come. Pack up the kids, families and friends today and enjoy the largest holiday light park in the N contact: 14,400 - seats 14,000 people comfortably Clear Channel Entertainment, Inc. Summer season only "Tommy Hilfiger at Jones Beach Theater presents world-class "Tommy Hilfiger at Jones Beach Theater is currently one Beacon Theatre Theater 2,849 Music "Tommy Hilfiger at Jones Beach Theater is located within Jones Lisaschwalbe@clearchannel.com entertainment in a beautiful park setting. Artists such as Jimmy of the top ranked amphitheaters in the country and plays Ford Center for the Performing Arts Theater 1,812 Theatrical Beach State Park in Wantagh, NY. The most renowned of all State Buffett, Paul Simon, The Who, Aerosmith and a host of others have host to today's top artists and celebrity attractions as well Hammerstein Ballroom Theater 3,600 Music parks, it derived its name from Major Thomas Jones who came to appeared." as festivals and fine arts performances." Irving Plaza Theater 1,121 Music Long Island in 1692 and built the first brick house on the Island and Mohegan Sun Arena Arena 9,000 Music eventually acquired 6,000 acres of which part are on the grounds of Tommy Hilfiger at Jones PNC Bank Arts Center Amphitheater 17,500 Music the current park. The original theater was constructed in the early NY Beach Theatre Tommy Hilfiger at Jones Beach Theatre Amphitheater 14, 's and was renovated in 1945 and again in In 1998 the Wantagh (NY area) Music theater was expanded to its current configuration and now seats Westbury Music Fair Theater 2,870 Music 14,000 people comfortably." The Pavilion seats 5,281 beneath its roof, while another Musical Arts Association (Cleveland, Ohio) 501 c 3 nonprofit. Late June through Labor Day "Each summer the annual Blossom Festival presents a series of Cannot separate Blossom financials from Musical Arts Donor sponsorships and rentals Odeon Night Club Club 1,000 Music Similar to Ravinia and Hollywood Bowl they are the home to the "Parking for all Blossom Festival concerts is free and is available on a first-come, "At the heart of Blossom Music Center is the Blossom Pavilion, 13,500 patrons can be accommodated on the expansive weekend concerts with The Cleveland Orchestra and other classical Association financials on guidestar Tower City Amphitheater 5,000 Music Boston Symphony Orchestra first-served basis in Blossom's four large paved lots. The northern section of Lot B situated at the base of a natural bowl. The architect for this award- hillside lawn seating area. and pops artists from late June through Labor Day. In addition, House (closest to the entrance gates) is reserved for Blossom Festival subscribers. winning structure, widely celebrated for its distinctive architecture and of Blues Concerts Inc. Handicapped parking is provided free in paved lots B, C, D, and E. Wheelchair superb acoustical qualities, was Peter van Dijk; the acoustician was ( presents a series of accessible trams are in service before and after all Blossom Festival Heinrich Keilholz, with preliminary acoustical design by Christopher OH Blossom Music Center Cleveland concerts by popular rock, country, and jazz artists at Blossom from May through September each year." performances to transport patrons with disabilities between the Pavilion and the parking lots. For more information on Blossom Festival parking, please call the Jaffe and studio engineering by Vladimir Maleckar. The Pavilion seats 5,281 beneath its roof, while another 13,500 patrons can be Severance Hall Ticket Office during regular weekday business hours at (216) 231- accommodated on the expansive hillside lawn seating area." 1111 or (800) " ,500 VSMM-LE and Clear Channel Entertainment, Inc. Summer season only Music Electric Factory Club 3,000 Music Hershey Star Pavilion Amphitheater/Stadium (counted as amphitheater) 7,500/25,000 Music PA Ford Pavilion at Montage Mountain Merriam Theater 1,870 Theatrical Theater of the Living Arts Theater 810 Music Tower Theater Theater 3,067 Music Tweeter Centre by the Waterfront Amphitheater 25,254 Music Jeff Young - jyoung@woodlandscenter.org - Vice President of 16,000 - Suburban to Houston, parking problem, has an "Founded in 1990, The Cynthia Woods Mitchell Pavilion is part of Operations agreement with a mall across the street The Center for the Performing Arts at The Woodlands, a nonprofit 501 (c)(3) organization that provides diverse, high-quality performing arts events for the entertainment and enrichment of a broad regional audience. Through numerous educational and community outreach programs, The Center is a catalyst for attracting new audiences to the performing arts and building strong ties between the arts and Cynthia Woods Mitchell educational institutions." TX Pavilion Woodlands id=53 March 1 to November 1 David Bowie, Green Day, Houston Symphony, Houston Ballet, 2003 revenues = $22,300,552., 2003 ticket income = The private sector makes up the majority There are other large facilities but they are the only outdoor Very diverse venue - positive thing - can offer everything "from rock Free guest parking is available in lighted and patrolled lots convenient to The MacDonald said parking generally fills up in the mall corner nearest Texas Music Festival, Britney Spears, Children's events, $14,777,305, parking income = $385,998, ran a deficit of of their donor population events per amphitheatre in the area. They also have a 15 year track record to Bach" planned community, fairly easy to get in and out of - access Pavilion. For most events, lots open 90 minutes prior to the performance. the pavilion, but there are many unused spaces on the north side of denominational and non-denominational church events, golf events, $948,332. Guidestar year are booked by CCE. Pavilion keeps that speaks to the quality of their events - both classical and is good. Relatively inexpensive - positive feedback from guests Tailgating is not allowed in Pavilion parking lots. "Jerry MacDonald, president the facility. He suggested shuttles could be used to distribute parking and events booked by a local Christian promoter. "While most individuals recognize The Pavilion as a rock a portion of the funds, and sometimes pop events. (artists and patrons). Nice facilities for artists, long-term and chief executive officer of The Cynthia Woods Mitchell Pavilion Center for the more evenly. "We have to look at how we can move cars to where house, proceeds from these contemporary shows help CCE has a rental agreement. relationships with the production staff - try to go above and beyond. Performing Arts, said a committee of Town Center businesses is studying the parking is available," MacDonald said. "There are definitely more offset the costs we incur producing our performing arts solutions for the parking problems in Town Center. "I think it is something that people down here as The Woodlands grows."" events and educational outreach programs. Annually, we definitely needs to be addressed," MacDonald said. MacDonald said parking is need to raise more than $1 million from local corporations, generally not a problem for the pavilion during most concerts, but there are a few Consider themselves similar to Tanglewood and Ravinia. Wolf Trap foundations and individuals to continue our mission of major concerts a year, attracting up to 12,000 people, where parking is at a would be different, as it doesn't have the popular element and it is a enhancing the education of our youth and spreading the premium. MacDonald has agreements with surrounding office buildings to use state owned facility. power and beauty of the performing arts to every corner of 5,000 parking spaces and the pavilion has a 932-space garage adjacent to its our community." facility. The new waterway taxis also are available to handle some of the load, and MacDonald said he has found more people actually walking to events from nteers.html new townhomes and lofts on the waterway. Webb Management Services, Inc. Page 2 12/21/2004
60 Review of Operations review of operations The second component of our study is a review of operations at Merriweather Post Pavilion. Here we consider the history of the venue and its activity, current operations, types and levels of programming, distribution of audiences, financial performance of the current operation and prospects for the future. History Merriweather Post has a rich history that is very important to our consideration of what comes next. The Pavilion, which opened in 1967, was likely the idea of Jim Rouse. It was seen as being part of the overall concept to attract people to the community with two other key pieces the Columbia Mall and Clyde s Restaurant. There are two other notable facts about the original concept: 1. It was intended to be the summer home of the National Symphony Orchestra. 2. Marjorie Merriweather Post was to donate funds to the construction in return for having her name on the facility. Those funds were never delivered, but the name stuck. The NSO came to the Pavilion for several years as a renter, but soon faded away. The Rouse Corporation was the initial operator of the Pavilion until 1971, when the Nederlander organization got an exclusive operating lease. That organization ultimately became a part of Clear Channel Entertainment, though the same day-to-day management team has effectively been in place for 25 years. In the late 70 s, when Columbia was 10 years old, there was another effort on the part of local groups to bring classical music to the facility. Thus, from 1977 to 1982 there was an arrangement with the non-profit group Pro- Cantari to present classical music, while at the same time the popular music shows were gaining audiences. From 1982 to1986, there was only popular music at the Pavilion. These were good years for a generation of big rock bands on the road, leading to the development of a series of music sheds. Webb Management Services, Inc. 1 October 2004
61 Review of Operations In 1987, on the Pavilion s 20 th anniversary, the NSO came for a special event. This was very successful (due in large part to corporate sponsorships). Because of that success, the Columbia Festival of the Arts was formed as a nonprofit to present culturally-oriented events at a series of venues, including Merriweather Post. That organization is still active, but is not hosting the Symphony locally. As the 90 s continued, Wolf Trap started to become a bigger player in the contemporary music scene, and then the Nissan Pavilion opened in Northern Virginia. That competition and a recession lead to a reduction in the number of shows down to 42, then to 30 and, by the end of the decade, to 25. It was in 1999 that SFX became Clear Channel, which stayed as the operator until It is notable that the Baltimore Symphony came to Merriweather Post in 2001 and They were apparently great to work with, but these concerts were not repeated. In 2003, Rouse was on the verge of renewing Clear Channel s contract. But with increasing dissatisfaction in the community and an informal approach from IMP, Rouse decided to invite bids from other operators. IMP s bid was accepted, and they have been the operator now for one season. It should be noted that IMP is not a stranger to Merriweather Post, having successfully promoted shows at the Pavilion over the years. They became interested in a more formal arrangement when Clear Channel started diverting shows to the Nissan Pavilion, which presented an opportunity to do better. The IMA/IMP Operation IMP is a private commercial venture started 23 years ago by Seth Hurwitz and Rich Heinecke. They own the 9:30 Club in Washington D.C., which has a 1,200-seat capacity. They also book and promote live music in other venues, including the Patriot Center at George Mason University, MCI Center, Constitution Hall, Recher Theater and First Mariner Arena. The actual lessee of Merriweather Post is IMA Inc. ( Its My Amphitheater ), a wholly-owned subsidiary of IMP. The focus and strength of IMP is its ability to pick bands on the way up and develop strong relationships with them. Those relationships are critically important to IMP, and musicians are more likely to stay with them as opposed to accepting potentially higher fees to play another venue with a different promoter. Webb Management Services, Inc. 2 October 2004
62 Review of Operations Here is a listing of full-time staff and their tenure at Merriweather Post: Jean Parker General Manager: Started working there in Became the Manager in Brad Canfield Mike McKenny Carol Marrion Davey Knott Lou Frey David Steed Operations Director and Production Manager: Part-time since 1982, full-time since 1989 Box Office Manager: Since 2000 Office Manager: Since 1993 Co-maintenance Director: Since 1996 Co-maintenance Director: Since 1987 Controller: Since 2003 That level of experience is extraordinary in a business as volatile as this. A key strength of the operation is the longevity of the management team. IMP s lease arrangement is short-term in nature, but the message from Rouse has been that as long as the venue remains active, the lease can be extended. IMP pays a base rent of $500,000 plus property tax (approximately $70,000) and is responsible for the physical maintenance of facilities. Historical Activity Summary Attached as Appendix A is a spreadsheet that summarizes events at the Pavilion from 1993 to data comes from Merriweather Post management. For prior years, data comes from Pollstar, an industry tracking service that shows attendance, ticket sales and ticket prices for most of the concerts at the facility. Using this information in addition to our complete count of shows since 1993, we are able to develop a rough estimate of total attendance and gross revenues by annualizing numbers with the averages in place. Whereas Pollstar reports capacity sold according to an adjustable capacity reported by the promoter, we use a fixed average capacity of 15,000 seats. The following chart summarizes those findings. Webb Management Services, Inc. 3 October 2004
63 Review of Operations Activity Summary Shows Ave Cap Sold 80% 60% 69% 55% 55% 79% 68% 67% 54% 41% 54% 46% Capacity 15,000 15,000 15,000 15,000 15,000 15,000 15,000 15,000 15,000 15,000 15,000 15,000 Total Attend 515, , , , , , , , , , , ,902 Average Gross $ 263, , , , , , , , , , , ,365 Total Gross $ 11,348,692 $ 11,470,000 $ 7,775,625 $ 4,496,000 $ 5,080,769 $ 7,566,304 $ 7,033,333 $ 7,923,500 $ 4,639,167 $ 4,185,000 $ 5,441,538 $ 7,133,477 Ave Top Ticket Price $ $ $ $ $ $ $ $ $ $ $ $ Let s look a bit closer at several trends. Concerts The number of concerts declined from 1993 to 1996, but has been relatively stable since then. Total Attendance 600, , , , , , Total attendance has moved with the number of events. It is interesting that despite 2004 being a so-called disaster for the industry, attendance has been low but stable since Average Top Ticket Price $60.00 $50.00 $40.00 $30.00 $20.00 $10.00 $ The average top ticket price for concerts has increased significantly over the last 12 years, from an average of $29 in 1993 to $52 in IMP s price jump in 2004 was significant. Webb Management Services, Inc. 4 October 2004
64 Review of Operations Total Gross $14,000,000 $12,000,000 $10,000,000 $8,000,000 $6,000,000 $4,000,000 $2,000,000 $ Finally, the most volatile and significant trend is the change in total gross revenues from concerts, here based on annualizing the gross from the reported events. Most important is the positive trend since 2002, and in particular, the increase in The 2004 Operation 2004 was a challenge for IMP because of lack of lead time to prepare for that first season. Nevertheless, and by all accounts, the season was a success. There was positive media coverage of the concerts and its new promoters, physical improvements to the space, better concessions and a positive attitude on the part of bands and ticket buyers. IMP put a local concessionaire in place last year; Charm City Hospitality, like IMP, is on a year-to-year basis. From their perspective, a multi-year deal would be better, justifying investments in equipment and facilities. When IMP took over in the Fall of 2003, they retained Gilco Sports in Baltimore to develop sponsorships for 2004 season concerts. Senior management was actively involved in that effort. These deals should be easier to put in place in 2005, though a longer-term arrangement with the facility would allow management to explore a series of additional opportunities, including facility naming and multi-year sponsorships. There continues to be some rental activity at Merriweather Post. The Capital Jazz Festival was a rental, as was the Mega-fest Latino Festival, the Walthur Roots Music Festival and the WPOC Country Music Festival. There was some risk-sharing associated with that last festival. The Columbia Festival of the Arts has a favorable deal in that they can present an artist at the facility and pay only out-of-pocket expenses. Their cost ends up at around $15,000 for a 3-hour event, plus costs of production, the artist and promotion. This last season, they had a risk-sharing arrangement with the Pavilion to reduce their costs. Webb Management Services, Inc. 5 October 2004
65 Review of Operations Graduations are the only event not shown on the activity summary. In 2004, there were 12 such events, 10 for High Schools and 2 for the community college. Those 12 events occurred over only 6 days. There are no published rental rates for the facility everything is negotiable. Pavilion management views rental activity as being a positive thing to do that is also profitable. The facility and its management team have a generally good relationship with the community. They have been open for five decades and are now seen as being locally-managed. There have been noise issues and complaints from certain neighborhoods over the years, but management has been fairly proactive in addressing these issues and there were no complaints this last season. From the perspective of the artists, Merriweather Post is a success because of the tradition it represents and that, when they are performing there, they know where they are. Audience Distribution Appendix B is a series of maps that show the distribution of audiences for a series of concerts this last summer at Merriweather Post. Using data provided by management, we have selected six concerts representing the diversity of events at the venue and mapped the distribution of audiences by zip codes. These do not quite match total attendance, as they reflect information on just the ticket buyer and do not include walk-ups. We also show the location of Nissan Pavilion and Wolf Trap for reference purposes. There are 30, 60 and 90-mile radii around the facility (those rings would be truly round if the world was flat). The maps are very interesting, suggesting the following: The distribution and key locations of audiences are very different from event to event, confirming in our minds the basic fact that the particular show is the determining factor in drawing audiences to the venue. The Travis Tritt (country) audience is concentrated within the 30-mile ring, and is mostly to the north, east and southeast of the venue. The audience for the second day of the Capital Jazz event, by contrast, is more dispersed, but has a concentration of audiences south in Washington. Diana Krall, characterized as a jazz vocalist/torch singer, attracted a somewhat smaller audience close to Columbia and northwest of Washington. Harry Connick s smaller audience is much more localized, and also north of Columbia. Webb Management Services, Inc. 6 October 2004
66 Review of Operations Norah Jones, with a larger audience, is more dispersed to the Southwest, with an interesting concentration at Wolf Trap. Evanescence, a very popular band with younger audiences, finds its audiences west, east and north of the Pavilion. Counting Crows, the band attracting the largest audience, still attracts most of that group from within 30-miles, but from all directions Financial Performance Appendix B is a one-page summary of financial performance provided by Merriweather Post management and verified as an accurate representation of 2004 results. A slightly earlier version was shared at a public meeting in September, an attempt by the operator to dispute a claim made by the Rouse Corporation that the Pavilion operation was no longer profitable. Following are highlights and conclusions from the Income Statement: The statement combines actual results from the first nine months of the year with projected results for the final quarter to suggest overall performance for the year. Concert revenue is the key revenue source, most of which came in the third quarter. This is a net number, subtracting artist fees, direct production costs and promotion from box office. There is said to be no mark-up to IMP on these expenses. Concert revenue is supplemented by small box office fees to renters and the sale of premium seating and services to VIP s. Sponsorship income came from a series of season-based sponsors covering products like beer, wine, insurance and soft drinks. A number of sectors (including cars, telecommunications, banking and healthcare) were not represented, suggesting significant additional potential in this area. Some single-production sponsorships are also possible, though more likely for non-profit events. Personnel costs are significant and appropriate for a facility like this. Capital expenditures totaled $181,000 for a series of incremental upgrades and improvements to the Pavilion. The $250,000 is the only payment to IMP in addition to profits. The fee is a fair cost for their effort to book, promote and manage acts coming to the Pavilion. Overall, the $140,000 is a small but reasonable return on IMP s first year of operation at Merriweather Post. Webb Management Services, Inc. 7 October 2004
67 Review of Operations Competition Merriweather Post faces significant regional competition. Following is a brief review of key competitors. Nissan Pavilion: This 25,000-person outdoor music shed was first conceived in the mid-80 s when the plan for Disney s America was in its earliest stages. There was a plan to widen I-66 to 8 lanes and there would also be a Metro connection to the area. Cellar Door, one of the original entities subsumed by Clear Channel, bought the land, and even though the Disney project did not proceed, a new amphitheater was developed. Nissan Pavilion, with its massive capacity and Clear Channel operation, hosts most of the major acts coming through the area. Looking at the comparative activity profiles in Appendix D, Nissan had fewer performances than Merriweather Post, but would have attracted more attenders on the basis of that larger capacity. There is not much difference in the seasons at Nissan and Merriweather Post, with a couple of acts even playing both venues. Merriweather Post books a fewer number of the larger classic-rock acts in favor of a few more new music groups. The Filene Center at Wolf Trap: This is the other key competitor for Merriweather Post; a 7,000-person capacity, partially-covered venue located on National Parks Service property in Northern Virginia. The Filene Center, which originally opened in 1971 and was re-built in 1984, is part of the Wolf Trap Foundation for the Performing Arts, a 501(c)(3) nonprofit organization that also programs the Barns at Wolf Trap and runs extensive education programs. The Foundation, which had an annual operating budget of $25.4 million in 2002, earns 73% of that budget, and is thus raising $6.6 million annually in the region to sustain operations. Only in recent years have they started to present more popular programs, partly driven by a desire to increase earned income. In 2004, the Filene Center set a record for ticket sales, with over $15 million earned on 99 performances. Again looking at Appendix D, we see a very diverse set of culturally and commercially-oriented programs. Merriweather Post management suggest that there are only five events annually they wish they d host instead of Wolf Trap, but clearly the Filene Center is significant as a high-quality competitor with a very strong reputation that is attractive to artists. It has also been suggested that Wolf Trap s nonprofit approach has the affect of increasing prices for all artists coming to the area. Webb Management Services, Inc. 8 October 2004
68 Review of Operations Pier 6: A 4,500-seat amphitheater in Baltimore with 3,000 seats under cover. Clear Channel is also the operator here, and the programming is more urban contemporary in focus. It has a great location, but it is now rumored to be losing money. Constitution Hall: This 3,700-seat hall is located in downtown Washington and is occasionally used for live music. It is owned by the Daughters of the American Revolution, thus there are many restrictions on what can be done there. Arenas: There are a number of regional arenas doing summer shows, including the MCI Center in Landover, the Patriot Center at George Mason University in Fairfax and the Mariner Center in Baltimore. These facilities, like many other arenas, are very keen to offer their venues to summer tour promoters as an alternative to outdoor facilities. Conclusions: There is no shortage of competition for Merriweather Post. There are larger, smaller and better facilities that are generally becoming more active and aggressive in a sector once dominated by this one facility. The response must be to focus on the significant competitive advantages of the facility, including its excellent regional location, natural setting and efficient access and egress, particularly in relation to Nissan. Prospects for IMP at Merriweather Post 2005: Next year, IMP should be in a strong position to match or exceed their performance this year. They will be in the second year of their relationship with the concessionaire and will further develop sponsors. Media reports indicated that audiences responded well to physical improvements at the Pavilion, which should bring them back. The larger issue is that while IMP has only a year-to-year arrangement at Merriweather Post, it will be difficult for them to justify significant capital expenditures to continue with needed improvements. Competition: Nissan Pavilion, Wolf Trap and other regional facilities represent significant competition for IMP at Merriweather Post. The key for IMP at Merriweather Post is to secure high-quality product at a good price and then sell the unique atmosphere of the facility to a loyal audience. Clear Channel has the ability to buy an entire tour and place it in Clear Channel facilities around the country, but IMP can buy specific shows with artists who have/will succeed in this market and with whom there is a personal relationship. There will be some effort to diversify programs, with some more culturally-oriented performers (like Diana Krall and Harry Connick Jr.) to bring new audiences to the Pavilion. Webb Management Services, Inc. 9 October 2004
69 Review of Operations One option will be to book acts with a smaller potential audience. IMP management has come to the conclusion that the facility works well for events that sell only 3,000 to 4,000 seats. Thus, it is likely that they will book more acts to sell that capacity. Access to Product: A key related issue, and the most important test for anyone operating Merriweather Post, is whether or not they can guarantee sufficient product to keep the facility going. Seth Hurwitz makes much of the fact that he will refuse to get into a bidding war for particular acts. And Clear Channel s recent behavior of paying whatever is needed has driven up fees all across the country. But these are not new challenges for Seth Hurwitz and others in the industry. In fact, IMP is in as strong a position as any other independent promoter. Because of the 9:30 Club, they have good relationships with acts and agents who are thus more likely to book through IMP. The desire on the part of agents and their acts to play the 9:30 Club creates some leverage to bring them to Merriweather Post. And there is loyalty on the part of well-established acts that covers both IMP and Merriweather Post, given their history there. Rentals: IMP has expressed a desire to do more rentals, focusing on community events and shows outside their areas of expertise. Graduations will continue to be supported at cost (labor plus other out-of-pocket expenses). Talks are also planned with the Baltimore Symphony about a series of concerts next summer. From the operator s perspective, these arts rentals are also an important selling feature to potential acts it matters to some that a Symphony has played here. Physical Improvements: As mentioned earlier, it is difficult to imagine that IMP will continue to invest in physical improvements to the facility until such time as a long term deal is in place. As they point out, incremental improvements should continue. As to their ultimate vision for the Pavilion, IMP representatives have expressed a goal of expanding the covered section of the Pavilion to 7,500 covered. In fact, such a plan has been considered a number of times and was almost executed when the Nederlanders were operating the facility in The Long Term Deal: For IMP, it really does come down to this. For as long as they are there on a year-to-year basis, physical improvements will be negligible, sponsorship potential will be limited, booking strategy will be constrained, and Seth Hurwitz will continue to talk about plans to develop a competitive large facility in the market area. Webb Management Services, Inc. 10 October 2004
70 Review of Operations As to what kind of deal, IMP has suggested that it would like to own Merriweather Post. But they have not ruled out the possibility of a long-term lease. Conclusions Despite all of the controversy swirling around Merriweather Post at present, we would suggest that the operation is in good shape. Programming is active and profitable. The physical condition of the facility, though far from perfect, is better than it was a year ago. IMP is a new operator, but they have, through their staff and promoting history, more knowledge and history with the facility than anyone else. And they are in as strong a position as anyone to continue to program the facility for the benefit of the community. Note that this review has not considered how the arts are accommodated by Merriweather Post and other facilities. That is the work to be covered in our Needs Assessment. Webb Management Services, Inc. 11 October 2004
71 Appendix A: Review of Activity Meriweather Post Review of Activity 2004 Act (26 of 26 Shows Reporting) Tix sold Gross Capacity Sold Top Ticket 1 Jazz Festival 10, ,000 72% $ Jazz Festival 8, ,000 56% $ Indigo Girls 3, ,000 23% $ Dashboard Confessional 4, ,000 30% $ Harry Connick Jr. 3, ,000 21% $ Diana Krall 4, ,000 29% $ Kenny Chesney 17, , % $ Dave Mathews Band 18, , % $ Fuel w/sr-71, Charlie Mars, Evenout ,645 6% $ Doors Down/Nickelback 10, ,000 70% $ Counting Crows 8, ,000 57% $ Evanescence 6, ,000 43% $ Twista w/nina Sky, Tha Jones Boyz 588 7,265 4% $ The Cure 7, ,000 50% $ Alanis Morissette/Barenaked Ladies 7, ,000 51% $ Sarah McLachlan 10, ,000 72% $ Live w/lake Trout, ebo & Sonicult 1,574 17,190 10% $ Norah Jones 6, ,000 44% $ Method Man 324 3,930 2% $ Mega Festival 12, ,000 82% $ Acoustic Planet 2, ,367 19% $ Cake 3,344 37,515 22% $ Kid Rock 3, ,215 25% $ Jack Johnson 12, ,920 82% $ Radio Show Festival 6, ,445 46% $ Incubus 6, ,985 44% $ Average Values: 6, ,365 46% $ Median Values: 7, ,500 50% $ Total Shows 2003 Act (13 of 20 Shows Reporting) Tix sold Gross Capacity Sold Top Ticket 1 Kenney Chesney 10, ,000 72% $ Brooks & Dunn 6, ,000 43% $ The Dead 16, , % $ Jackson Browne 2, ,000 19% $ Iron Maiden 8, ,000 57% $ Eddie From Ohio 1,724 21,000 11% $ Mariah Carey 4, ,000 30% $ , ,000 54% $ Radio Show Festival 9, ,000 64% $ Radiohead 17, , % $ Tori Amos 4, ,000 31% $ Sprite Liquid Mix Tour 10, ,000 67% $ Crosby Stills & Nash 4, ,000 33% $ Average Values: 8, ,077 54% $ Median Values: 8, ,000 54% $ Total Shows 2002 Act (26 of 26 Shows Reporting) Tix sold Gross Capacity Sold Top Ticket 1 Radio Show Festival 8, ,000 55% $ Radio Show Festival 8, ,000 55% $ Radio Show Festival 7, ,000 50% $ Alanis Morissette 4, ,000 30% $ One Love Festival 2,283 50,000 15% $ Bad Company 6, ,000 41% $ Trey Anastasio 7, ,000 50% $ Webb Management Services, Inc. Page 1 12/21/2004
72 Appendix A: Review of Activity 8 Travis Tritt/Keith Urban/Phil Vasser 10, ,000 71% $ Scorpions/Deep Purple 5, ,000 35% $ Widespread Panic 6, ,000 43% $ Jeep World Outside Festival 7, ,000 50% $ Chris Isaak/Natalie Merchant 5, ,000 35% $ The String Cheese Incident 5, ,000 35% $ Phil Lesh & Friends 5, ,000 39% $ Weezer 7, ,000 51% $ Blondie 3,842 92,000 26% $ Santana 10, ,000 67% $ Bonnie Raitt/Lyle Lovett 6, ,000 41% $ Yes 5, ,000 34% $ Daryl Hall & John Oates 3,123 93,000 21% $ The Allman Brothers 5, ,000 37% $ Goo Goo Dolls 8, ,000 53% $ Radio Show Festival 12, ,000 80% $ Alicia Keys 4, ,000 30% $ Aaron Carter 2,877 56,000 19% $ Alice Cooper 1,490 35,000 10% $ Average Values: 6, ,962 41% $ Median Values: 6, ,000 40% $ Total Shows (+15-day Nightmare Woods Halloween Fest) 2001 Act (18 of 19 Shows Reporting) Tix sold Gross Capacity Sold Top Ticket 1 Radio Show Festival 8, ,000 54% $ The Black Crowes/Oasis 4, ,000 33% $ James Taylor 10, ,000 68% $ Dido 5, ,000 37% $ The Allman Brothers Band 8, ,000 58% $ Depeche Mode 9, ,000 63% $ Moby 12, ,000 82% $ Widespread Panic 9, ,000 65% $ Roxy Music 3, ,000 23% $ Blink , ,000 65% $ Trey Anastasio 11, ,000 77% $ Barenaked Ladies 11, ,000 79% $ Phil Lesh & Friends 6, ,000 43% $ Tim McGraw 16, , % $ Crosby Stills & Nash 6, ,000 43% $ Degrees 3,055 36,000 20% $ Stevie Nicks 5, ,000 40% $ Alice Cooper 2,430 51,000 16% $ Average Values: 8, ,167 54% $ Median Values: 8, ,000 56% $ Total Shows (+20-day Nightmare Woods Halloween Fest) 2000 Act (16 of 26 Shows Reporting) Tix sold Gross Capacity Sold Top Ticket 1 Blink , ,000 61% $ No Doubt 4, ,000 28% $ The Cure 11, ,000 74% $ Britney Spears 15, , % $ Widespread Panic 5, ,000 40% $ Michael Flatley's Lord of the Dance 2, ,000 18% $ David Benoit 4, ,000 33% $ Nickelodeon's All That & More 4,347 96,000 29% $ Jimmy Buffett 19, , % $ Jimmy Buffett 19, , % $ Creed 16, , % $ Webb Management Services, Inc. Page 2 12/21/2004
73 Appendix A: Review of Activity 12 Counting Crows/Live 11, ,000 78% $ Christina Aguilera 7, ,000 49% $ Phish 18, , % $ Def Leopard 5, ,000 35% $ Kiss 4, ,000 29% $ Average Values: 10, ,750 67% $ Median Values: 8, ,000 55% $ Total Shows 1999 Act (21 of 25 Shows Reporting) Tix sold Gross Capacity Sold Top Ticket 1 Busta Rhymes 5,885 84,000 39% $ Santana 6, ,000 43% $ Hootie & The Blowfish 5, ,000 38% $ Brandy 9, ,000 63% $ Motley Crue 9, ,000 64% $ The Allman Brothers 6, ,000 41% $ Phish 19, , % $ Brian Setzer 2,920 75,000 19% $ Widespread Panic 6, ,000 40% $ Lilith Fair 16, , % $ Jewel 6, ,000 44% $ Barenaked Ladies 17, , % $ Black Sabbath 10, ,000 68% $ Goo Goo Dolls 10, ,000 68% $ Alanis Morissette/Tori Amos 9, ,000 63% $ Jimmy Buffett 19, , % $ Jimmy Buffett 19, , % $ Raitt/Browne/Colvin/Hornsby 8, ,000 56% $ REM 14, ,000 94% $ Lenny Kravitz 6, ,000 43% $ Tom Petty & The Heartbrakers 4, ,000 30% $ Average Values: 10, ,333 68% $ Median Values: 9, ,000 63% $ Total Shows 1998 Act (23 of 25 Shows Reporting) Tix sold Gross Capacity Sold Top Ticket 1 Radio Show Festival 8, ,000 55% $ Al Jarreau 16, , % $ Al Jarreau 16, , % $ Grand Funk Railroad 4,178 57,000 28% $ The B52's/The Prestenders 6, ,000 45% $ Aretha Franklin 5, ,000 38% $ Metallica 15, , % $ The Allman Brothers Band 10, ,000 67% $ Widespread Panic 5, ,000 35% $ Lilith Fair 17, , % $ Lilith Fair 17, , % $ Third Eye Blind 10, ,000 68% $ Matchbox Twenty 10, ,000 69% $ Phish 21, , % $ Jimmy Buffet 19, , % $ Jimmy Buffet 19, , % $ Gipsey Kings 4,395 88,000 29% $ Gipsey Kings 4,395 88,000 29% $ Backstreet Boys 12, ,000 80% $ Elton John 16, , % $ Creed 9, ,000 64% $ Mana 4,534 78,000 30% $ Webb Management Services, Inc. Page 3 12/21/2004
74 Appendix A: Review of Activity 23 Pearl Jam 16, , % $ Average Values: 11, ,652 79% $ Median Values: 10, ,000 69% $ Total Shows 1997 Act (13 of 25 Shows Reporting) Tix sold Gross Capacity Sold Top Ticket 1 John Mellencamp 3, ,000 26% $ The Allman Brothers 8, ,000 58% $ Santana 10, ,000 67% $ My Utmost For His Highest 4,595 84,000 31% $ Boston 4,193 81,000 28% $ Lilith Fair 17, , % $ Counting Crows/The Wallflowers 16, , % $ Steve Miller Band 5,237 59,000 35% $ Live 9, ,000 63% $ Alice Cooper 2,422 46,000 16% $ Rage Against the Machine 18, , % $ Sheryl Crow 3, ,000 22% $ Barenaked Ladies 2,495 62,000 17% $ Average Values: 8, ,231 55% $ Median Values: 5, ,000 35% $ Total Shows 1996 Act (9 of 24 Shows Reporting) Tix sold Gross Capacity Sold Top Ticket 1 Styx 6, ,000 41% $ Bob Seger & The Silver Bullet Band 8, ,000 55% $ The Moody Blues 4, ,000 28% $ The Allman Brother Band 8, ,000 55% $ Lynard Skynyrd 4,884 97,000 33% $ Radio Show Festival 5,889 93,000 39% $ Alanis Morissette 18, , % $ King Crimson 1,884 66,000 13% $ Pearl Jam 17, , % $ Average Values: 8, ,333 55% $ Median Values: 6, ,000 41% $ Total Shows 1995 Act (8 of 33 Shows Reporting) Tix sold Gross Capacity Sold Top Ticket 1 Toad The Wet Sprocket 10, ,000 73% $ Boston 8, ,000 53% $ Yanni 8, ,000 59% $ The Allman Brothers 5, ,000 40% $ Vince Gill 7, ,000 51% $ Tom Petty & The Heartbreakers 14, ,000 98% $ Van Halen 8, ,000 57% $ Live 17, , % $ Average Values: 10, ,625 69% $ Median Values: 8, ,000 58% $ Total Shows 1994 Act (9 of 45 Shows Reporting) Tix sold Gross Capacity Sold Top Ticket 1 Meatloaf 7, ,000 49% $ Lynyrd Skynyrd 6, ,000 41% $ Janet Jackson 13, ,000 87% $ Janet Jackson 13, ,000 87% $ Brooks & Dunn 7, ,000 51% $ Spin Doctors 12, ,000 81% $ Bonnie Raitt 11, ,000 77% $ Barry Manilow 5, ,000 37% $ Travis Tritt 4, ,000 27% $ Webb Management Services, Inc. Page 4 12/21/2004
75 Appendix A: Review of Activity Average Values: 8, ,889 60% $ Median Values: 7, ,000 51% $ Total Shows 1993 Act (13 of 43 Shows Reporting) Tix sold Gross Capacity Sold Top Ticket 1 Midnight Oil 10, ,000 69% $ Kenny G 9, ,000 65% $ Lynyrd Skynyrd 7, ,000 47% $ Jimmy Buffett 17, , % $ Jimmy Buffett 17, , % $ Jimmy Buffett 17, , % $ Spin Doctors 17, , % $ ,000 Maniacs 12, ,000 80% $ Steve Miller Band 8, ,000 56% $ Van Halen 16, , % $ Barry Manilow 6, ,000 43% $ The Allman Brothers Band 9, ,000 62% $ The Beach Boys 5,969 90,000 40% $ Average Values: 11, ,923 80% $ Median Values: 10, ,000 69% $ Total Shows Webb Management Services, Inc. Page 5 12/21/2004
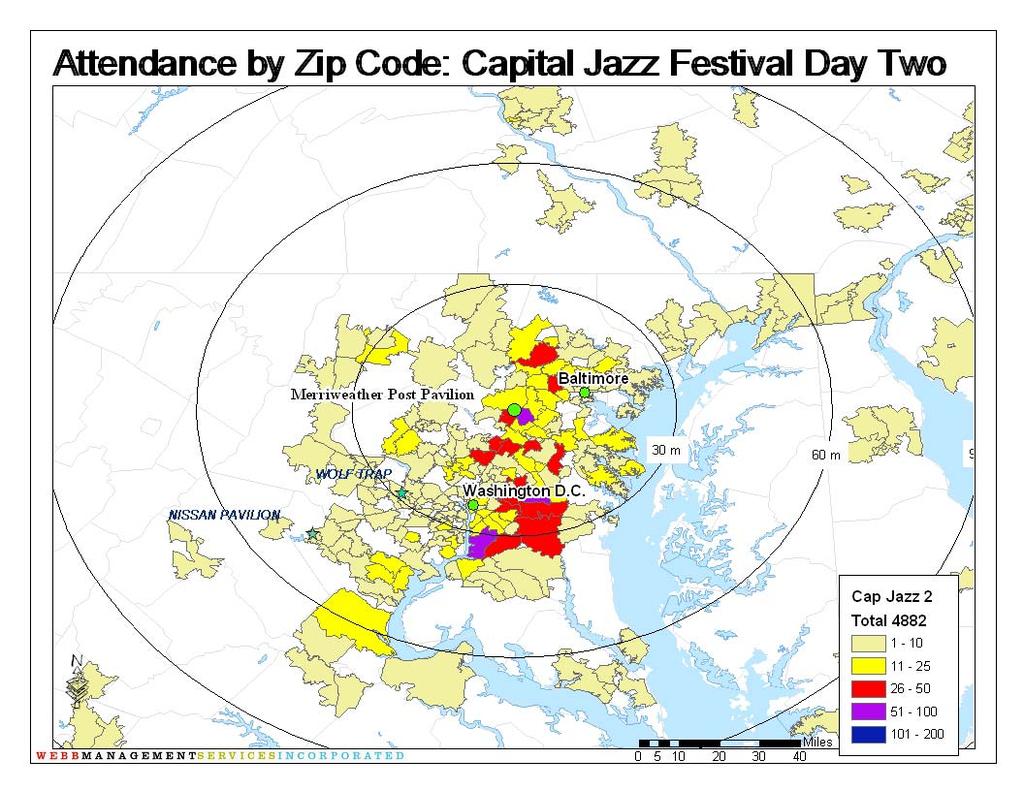
76
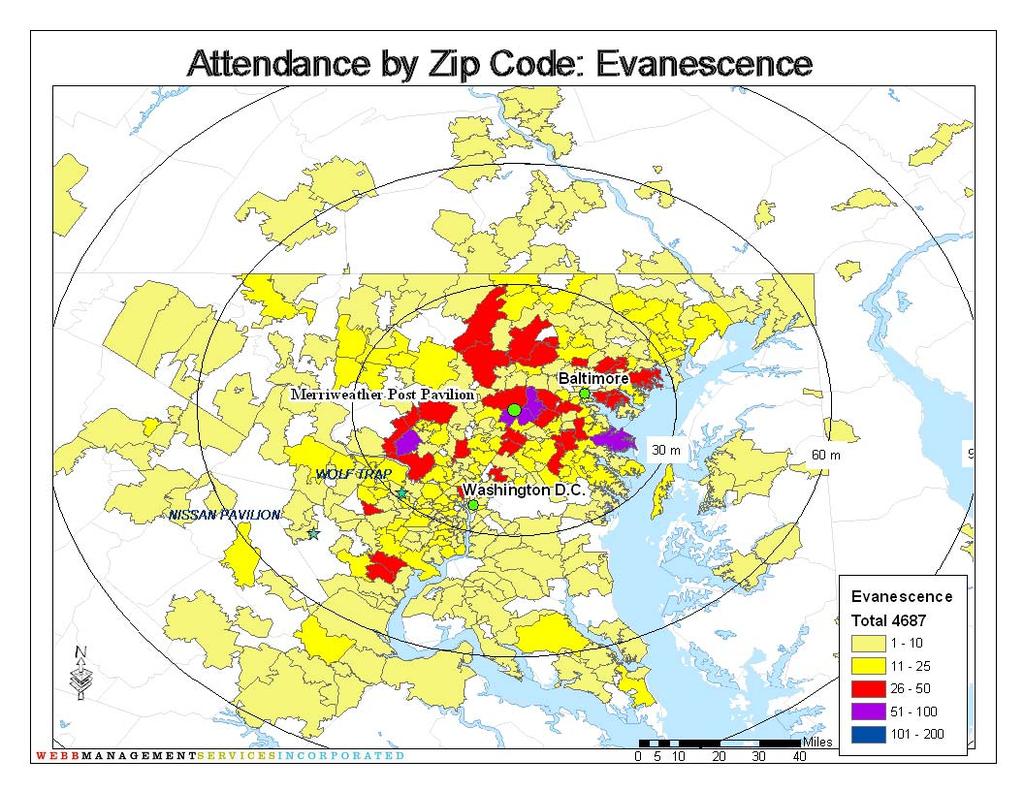
77
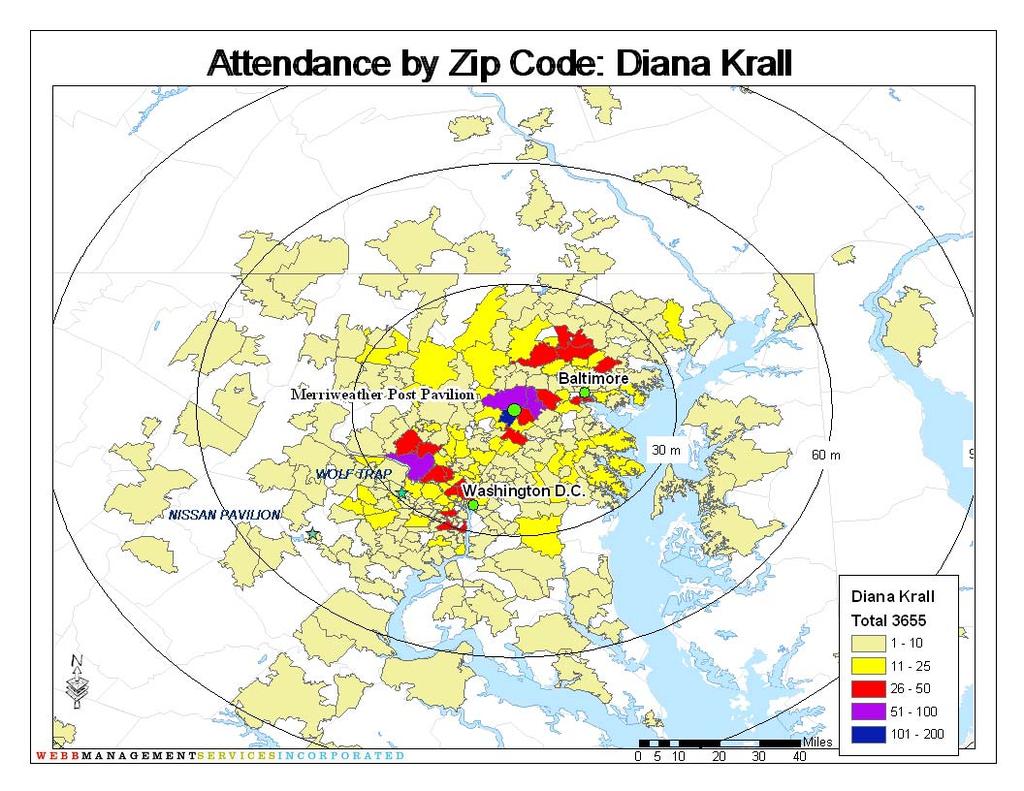
78
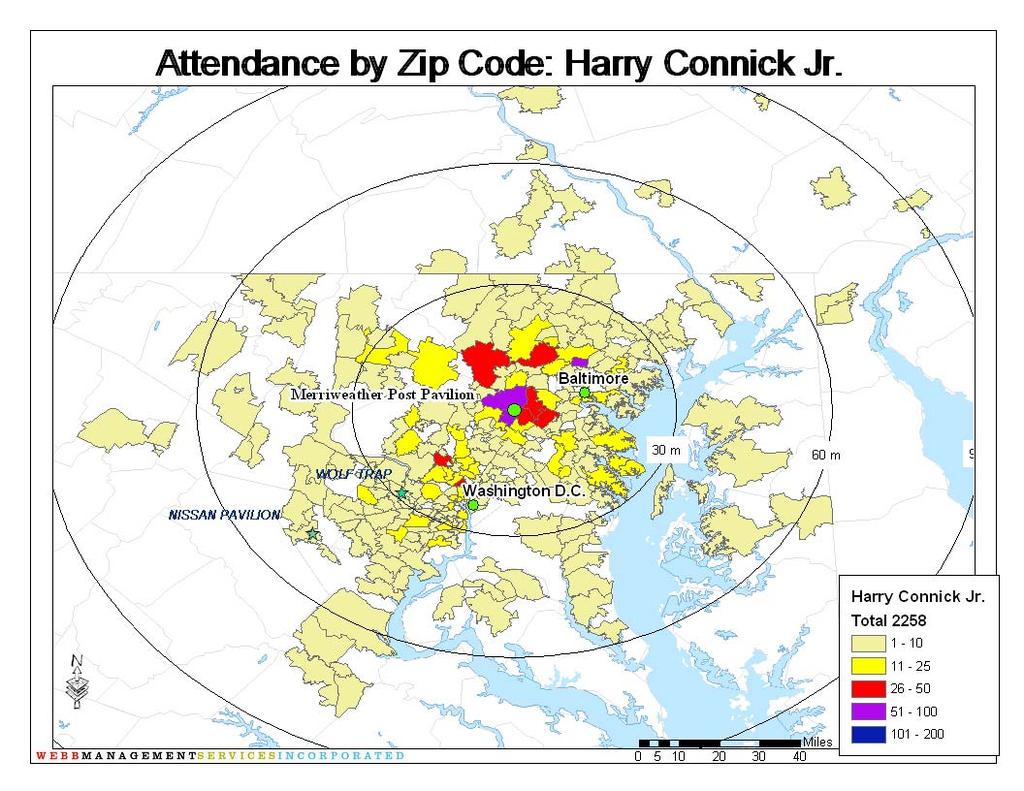
79
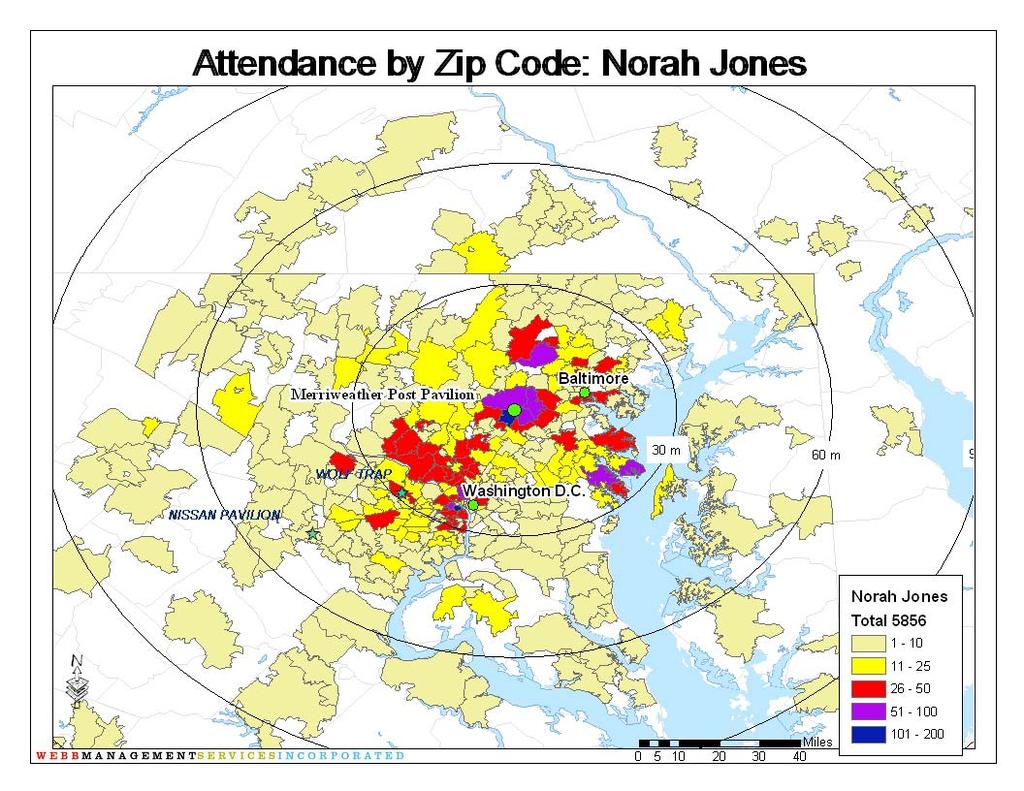
80
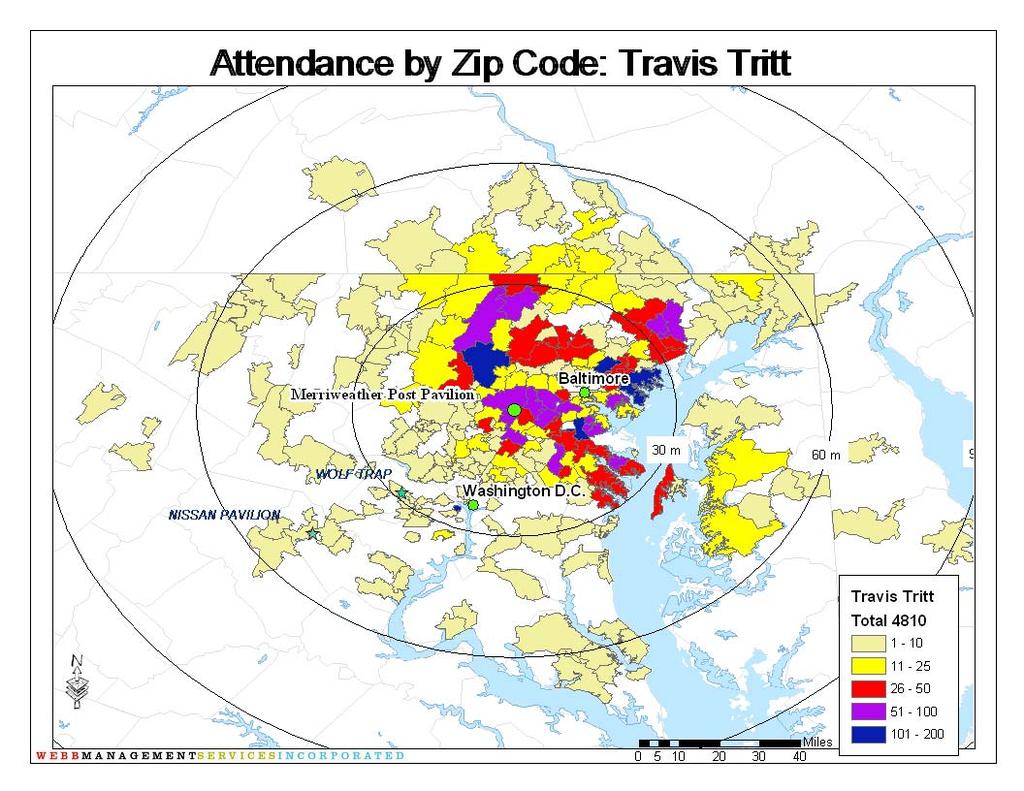
81
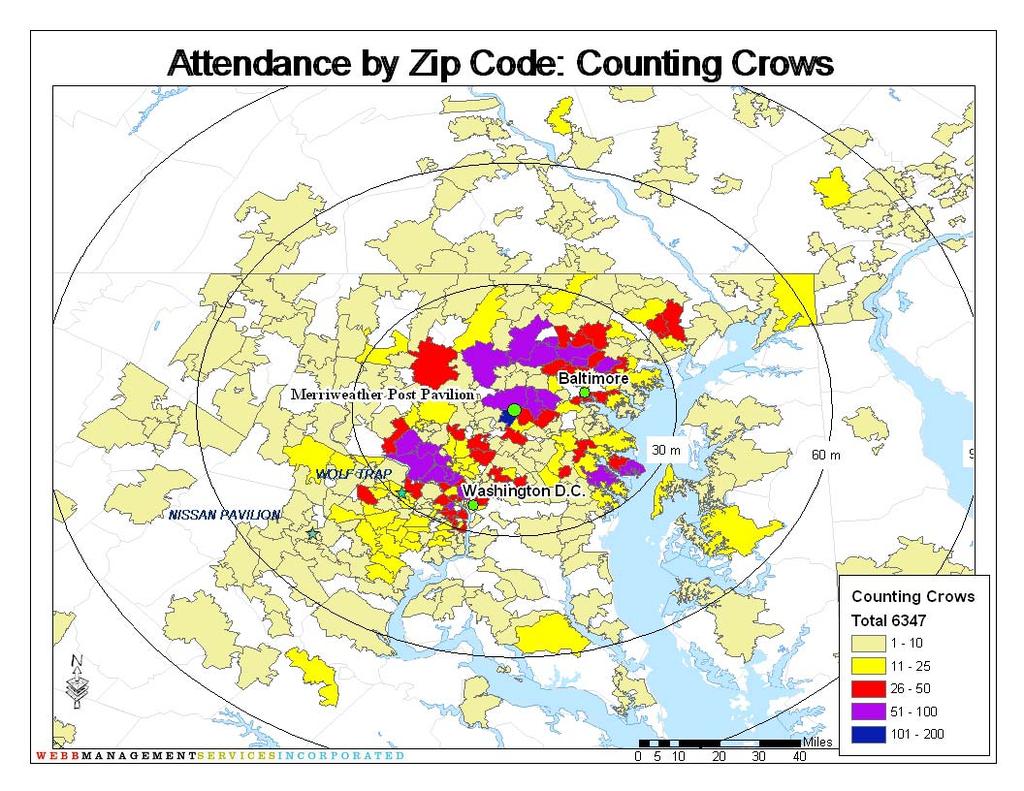
82
83 Appendix C: Income Statement Merriweather Post Pavilion Income Statement - One Year 2004 actual actual actual forecasted Qtr 1 Qtr 2 Qtr 3 Qtr 4 Totals Net Revenue Concerts 0 164,264 1,602, ,766,891 Box Office 0 2,996 5, ,559 VIP Sales 150,312 72,611 47, ,821 Sponsorships 0 106,000 88, ,163 Total Sales 150, ,870 1,743, ,240,434 Gross Profit 150, ,870 1,743, ,240,434 Operating Expenses Salaries and wages 131, , , , ,965 Employee benefits 7,215 7,215 7,215 7,215 28,860 Payroll taxes and processing 5,258 5,258 5,258 5,258 21,030 Rent , ,000 Utilities 11,266 11,266 11,266 11,266 45,064 Repairs and maintenance 6,806 27,224 27,224 6,806 68,060 Contracted Services 14,310 20,745 14,310 14,310 63,673 Insurance 28,427 28,427 28,427 28, ,709 Travel & Petty Cash ,000 Telephone 6,450 6,450 6,450 6,450 25,798 Postage and Delivery 756 3,024 3, ,561 Office/Staff supplies 7,967 10,223 10,223 2,556 30,969 Equipment Leases/Rentals 3,196 6,696 3,196 3,196 16,282 Seasonal Rentals/Leases 0 26,403 79, ,610 Non-event Advertising 0 6, ,949 Printing ,250 Professional fees 2,900 6,766 6,766 2,900 19,331 Property Tax ,144 70,144 Donations 0 0 1, ,139 Dues & Subscriptions 524 1,222 1, ,491 Loge Tent - up/down 0 6,006 6, ,012 Capitals 45, , ,700 Booking Fee 0 125, , ,000 Total Operating Expenses 272, , , ,171 2,100,595 Operating Income (122,301) (221,267) 1,275,239 (791,832) 139,839 Interest income (expense) 0 Other income (expense) 0 Total Nonoperating Income (Expense) Income (Loss) Before Taxes (122,301) (221,267) 1,275,239 (791,832) 139,839 Webb Management Services, Inc. 12/21/2004
84 Appendix D: Review of Activity at Competitive Facilities 2004 Activity Comparison Merriweather Post Nissan Pavilion Filene Center Jazz Festival (2) Reba McEntire/Phil Vassar The Mikado (2) Indigo Girls Blink 182/No Doubt US Marine Band Dashboard Confessional Jessica Simpson Lynyrd Skynyrd Harry Connick Jr. Styx/Frampton Diamond Rio/Patty Loveless Diana Krall Hall & Oates/Michael McDonald Prairie Home Companion (2) Kenny Chesney Jimmy Buffett The Moody Blues Dave Matthews Band Boston Hootie and the Blowfish Fuel w/sr-71, Charlie Mars, Evenout Chicago/Earth Wind & Fire Bonnie Raitt 3 Doors Down/Nickelback Annie Lenox & Sting Dirty Dozen Brass Band and More Counting Crows Dave Matthews Band Johnny Mathis Evanescence Michael W. Smith Kingston Trio/Smothers Brothers Twista w/nina Sky, Tha Jones Boyz Ozzfest Bill Cosby The Cure KISS/Poison Boney James Alanis Morissette/Barenaked Ladies O'jays/Temptations/4 Tops/Whispers Jonny Lang Sarah McLachlan Josh Groban Rite of Strings Live w/lake Trout, ebo & Sonicult Rush Jazz & Blues Festival Norah Jones Vans Warped Tour Parsons Dance company Method Man Linkin Park/Korn Riverdance (4) Mega Festival Kenny Chesney Willie Nelson and Chris Smither Acoustic Planet The Dead Tom Jones Cake John Mayer Oklahoma Kid Rock Allman Brothers/Little Feat Journey Jack Johnson Brooks & Dunn Ben Folds/Guster/Rufus Wainwright Radio Show Festival Linda Ronstadt Incubus The Irish Tenors Bacilos Shaggy Lyle Lovett Abba-the music Linda Eder Choral Arts Society of Washington Emil de Cou conducting Tchaikovsky Cowboy Junkies/Shawn Colvin Oliver Mark Morris Dance Group Blues Traveler Renee Fleming Marvin Hamlisch, Bravo Broadway By Felix, Mischa Santora conductor The Doobie Brothers Gipsy Kings (2) La Boheme Mary Chapin Carpenter (2) Cyndi Lauper Carole King Itzhak Perlman Bugs Bunny on Broad Boston Pops Huey Lewis & The News Peter, Paul & Mary (2) Tony Bennett Aloha Hawaii Festival Bruce Hornsby George Benson/Will Downing Judy Collins' Wildflower Festival Beach Boys Pittsburgh Ballet Theatre Eddie From Ohio B.B. King Blues Festival The King and I (6) International Children's Festival (2) Webb Management Services, Inc. 12/21/2004
85 Review of Operations Review of Operations Physical Review Integral to our review of the operations of the Merriweather Post Pavilion was a physical review of the structures and their condition, technical accommodations, the site, parking, access, and other conditions influencing the physical operation of the Pavilion. Our findings are summarized in this section. It should be kept in mind that our focus was intended to be on the larger physical issues affecting Merriweather s long term viability rather than detail conditions concerned with ongoing maintenance and upkeep. The examination process involved three visits to the site, including one performance, to observe existing conditions and interview the operator. The limited construction documentation obtainable was reviewed as were summary condition reports assembled by the operator and its contractors. Detailed cost investigations were also beyond the scope of this study; the budget allowances we have identified are for the purposes of a general scope of magnitude only. For the benefit of readers less familiar with the facility, we begin with a brief chronology of its physical development since its construction. The tranquil woodland environs which grace the Merriweather Post site together with the enveloping Columbia Association property are becoming increasing rare in the midst of Howard County s burgeoning development. And the amphitheatre itself, dating to the inception of the Columbia plan has remained a defining amenity in the community. Simply and economically conceived, the shed retains much of its original design and structural integrity. And given the current operator s enthusiasm for a continuing role in its life, there seems to be good reason to believe that the facility could regain its former vitality and once more play an active civic role. But there are currently serious issues requiring resolution before any future for Merriweather becomes certain. Most important of these issues is the apparent impending loss of public parking for the facility as the Rouse Company moves to develop the fields historically dedicated to this purpose. With an actual property area that encompasses little more than the fenced enclosure around the venue, there are no real options for satisfying parking needs on the Merriweather site without radically altering its character and function. Some sort of compromise is essential with either Rouse or the Columbia Association, or both, to satisfy future parking and access needs. In addition to the above parking question, other issues involve concerns with gradual deterioration of a thirty-five year old facility that has experienced year-round exposure to the elements. Still others stem from a lack, to date, of long term planning for improvements and an associated insubstantiality characterizing the construction many of the added components. I. Physical History Designed for the Rouse Company in 1966 by noted architect Frank Gehry with the firm of Gehry, Walsh, and O Malley, and opening in 1967, the Merriweather Post Pavilion was intended to play a crucial role in the Rouse Company s vision for their new green community called Columbia. This new city was being carefully conceived as a collection of residential-scaled town centers gathered around a municipal center with a larger scale, higher density, and broader diversity of retail, office, and entertainment options. An important component in the plan was a performing arts Ziger/Snead, LLP 1 October, 2004
86 Review of Operations facility, and, located in Symphony Woods, Merriweather was to serve as an outdoor venue for a variety of performance types but most importantly classical music; Merriweather was to be the summer home for the National Symphony. The Merriweather Post soon became widely known for its minimalist configuration, a simple shed, a single lowly-sloped roof spanning over both audience and performers, with no fly tower. A broad lawn for additional informal seating, open to the sky, was created behind the covered seating area. Only limited accommodations for a stagehouse control room, two small crew restrooms, two small dressing rooms, a few offices, and some space for miscellaneous storage were to be provided within the structure. All other facilities including administration, ticket sales, public restrooms, concessions, first aid, etc. were to be located in small scale, independent outbuildings ringing the amphitheatre including a handful of historic farm structures which had existed prior to the Columbia development. The model was a festival in which all support services appeared to be only temporarily placed in the woodland during the concert season. With the exception of the Pavilion itself, the existing grading around the venue was only minimally modified, maintaining as many of the mature existing trees on the site as possible. Paving was essentially applied to the surface of these existing grades. Over the years during the warm weather months the pavilion has hosted classical and popular music concerts, school graduations, fund raisers, and a variety of other civic events. Mostly, though, the pavilion has served as a regional venue for pop groups playing to audiences of between 5,000 and 20,000 from the Columbia/Baltimore/Washington area. Originally, operation of the venue was managed by the Rouse Company, but by 1971 a promoter had been contracted to book groups and stage the events. At one time these reached a high of fifty events per summer. With experience of hosting shows at the Pavilion over the years, operators found that alterations and improvements were needed to enhance operating profitability. And so the venue has been expanded and modified; but it has always managed to retain its informal woodsy ambiance. As popular music events soon began to outpace classical, the original acoustical orchestra shell lining the stagehouse was eventually removed, and a conversion to support more amplified events instituted, with additional speakers and different sound treatments. In 1970 additional concrete risers and canvas awnings were added to the sides of the original reserved seating area to boost covered seating from 3,500 to 5,000. Though possibly envisioned as a lost-cost, short-term solution, these tented Loges, with movable folding chairs, are still maintained as an important component of the covered seating count. In the mid-1980 s additional earth fill was installed over the lawn seating area raising the rear of the lawn approximately 10 feet to improve sightlines for those viewers. Around 1990 a double-wide manufactured building, ie. trailer, was installed at the rear of the sound stage to expand dressing facilities for visiting performers. Later, covered and screened-in decks of treated lumber were constructed behind the dressing facilities to serve as dining and recreation space for performers and hands. In 1997 the covered Loading area immediately adjacent to the stage was expanded to accommodate 6 trucks simultaneously and increase covered load-in space. Ziger/Snead, LLP 2 October, 2004
87 Review of Operations At some point additional steel beams were installed between the trusses above the stage to expand flexibility for suspension of lights, speakers, and flats. Box seat platforms were installed in two areas to diversify opportunities for audience seating and ticket subscriptions. In 2003, when I.M.P. Productions, Inc, the current operator, contracted to run Merriweather for the 2004 season they invested in a number of new projects to improve both the performer and audience experience. These included remodeling of the dressing rooms, replacement of some of the aging original seating, installation of a trio of large format video screens, upgrade of the sound system for the lawn seating areas, facelifts for toilet rooms and other audience service areas, installation of a number of pieces of monumental sculpture, as well as other smaller projects to infuse new life into a facility that had begun to show its age. II. Description of the Site and Structures See also Photographs and drawings in Appendix E A. The Site The Merriweather Post Pavilion is situated on an extensive, largely undeveloped expanse of land to the south of the Columbia Mall roughly bounded by Little Patuxent Parkway to the north, Broken Land Parkway to the west and south, and South Entrance Road/Symphony Woods Road to the east. This gently rolling woodland is bisected by a stream valley and varies in elevation from 300 to 370 feet. Ownership of the land is principally divided between the Merriweather Post Business Trust, the Columbia Association, and Howard Development and Research. Tobys General Partnership and Liberty Property are also listed as owners of smaller parcels to the east side of the land. The Merriweather Post Business Trust parcel under consideration, zoned New Town / Open Space (FDP 4-A III), is comprised of the 10.8 acres within a perimeter closely defined by the amphitheatre and its various outbuildings. Contained within the site are facilities for performance and seating, catering, concessions, toilet rooms, administration, box office, and miscellaneous storage. Administration parking and performer parking are also located on the Merriweather Post property. Completely encompassing the Merriweather property in the shape of a large ring is a second property known as Symphony Woods, owned by the Columbia Association and totaling 36.2 acres. This community-owned parcel includes the stream and adjacent ponds (wetland and 100-year flood plain area) in addition to the picnic grounds adjacent to Little Patuxent Parkway. Also situated within or passing through this surrounding property are the ADA parking for the Pavilion, temporary support trailers for site concessions, all entrance roads and paths, and all supporting utilities including electrical power, telephone, water, sanitary, and storm water. Easements are recorded to the Merriweather Trust by the Columbia Association for many if not all of these. There is no gas or cable TV service to the Pavilion nor are there currently any stormwater management utilities. Nearby Lake Kittamaqundi, is listed as the stormwater runoff management utility. Ziger/Snead, LLP 3 October, 2004
88 Review of Operations A 65.7 acre parcel immediately to the south and west of the Merriweather/Columbia properties, and owned by Howard Research and Development, a subsidiary of the Rouse Company, includes several large open fields which have historically served as parking lots for up to 7,000 audience vehicles. These lots are at a distance of 500 feet, an approximate 2 to 3 minute walk from the Pavilion Box Office and Main Entrance gate. B. The Pavilion 1. General: The original trapezoidal shaped pavilion shed is open on three sides beyond the stagehouse and has a simple long span roof structure comprised of deep steel trusses supported on eight columns. The main trusses, spanning over 140 feet, are fanned to extend the plan of the stage out over the fixed audience seating. Flanking the original shed structure on each side are waterproof seasonal tents protecting the Loge sections from the elements. These are supported on steel cables from fixed masts and removed at the end of each season and placed into storage. Wrapping the side and rear portions of the stage are lower, wood-framed saddle bag spaces housing the control room, dressing rooms, toilets and offices. 2. The House Reserved seating areas, accommodating 5,000 covered seats are all situated on a concrete slab-on-grade in stepped risers. The roughly 3,500 fixed seats in the original shed are riser-mounted type with cast iron frames; with the exception of the odd replacement and several entire rows up front, these are the original furniture. The approximately 1,500 newer Loge seats are heavy-duty movable folding chairs. The step sections through the original seating concrete risers and the newer Loge risers have slightly different profiles and the concrete cheek wall which formed an edge to the original seating, remains in place. This forms a continuous barrier to circulation between the Center and Loge seating. Box seating platforms were created at center and left front Loge. Dedicated ADA seating for three or four is located in the middle right Loge as well as additional individuals at the top and bottom perimeters of the seating risers. Primary lighting, sound, and camera control locations are presently in right center and right rear. Additional control locations are above center orchestra and above the rear of the center seating area on both the left and right sides. The control above the center seating is accessed from a hatch in the roof and the remaining two are accessed via ladder from the ground. Unreserved Lawn Seating is without cover and is natural grass with an irrigation system. 3. The Stagehouse The open working area of the stage is trapezoidal in plan and roughly 60 feet deep by 56 feet wide at the rear increasing to 87 feet wide at the proscenium. The performance area in the same shape, wood-framed with a strip wood flooring finish over a crawlspace, is approximately 53 feet deep and 46 feet wide at the rear growing to 77 feet wide at the proscenium. Perimeter floor areas of the stage are concrete slab on grade. The proscenium opening is 67 feet wide by 30 feet high to the underside of the deep truss Ziger/Snead, LLP 4 October, 2004
89 Review of Operations supporting both the stagehouse roof trusses and long span house roof trusses. The clear height of the stage is an average of 36 feet. There are no grid iron or catwalks above the performance area and the number of performance lighting fixtures is extremely limited. A small number of head blocks and battens are suspended from the roof trusses and controlled with hand-raised hemp lines from a traditional wood pin rail above each wing. These are used to support light flats used as backdrops during high school graduations and similar small scale productions. The predominance of visiting shows work around these provisions, however, bringing in their own lines, blocks, lifts, battens, flats, trusses, performance lighting, etc. and rigging either directly to the roof structure or to the supplementary steel beams installed in between the trusses. Beside and behind the open portions of the stage are an electrical control area enclosed in wire mesh, two small dressing rooms, a promoters office and toilet room, a stagehands office and toilet room, a laundry room with two residential washers and dryers, and separate access to the adjacent dressing rooms and the loading area. Open to the outside of the stagehouse are men s and women s restrooms for catering staff. Attached to the west of the original stagehouse is the 30 foot by 75 foot loading platform serving six docks. A simple orchestra pit area at seating level in front of the stage has been boarded over and long abandoned. The primary Performer Dressing suites are located immediately behind the stagehouse in a double-wide manufactured unit accessed via a short enclosed connector. This facility lacks a structural foundation but is served with plumbing and communications provisions and air conditioning by means of multiple packaged units with exposed flexible ductwork under floor. Behind this structure are two additional wood frame deck-type structures with roof and screen enclosures serving as a dining facility for performers and hands. C. Administration Building and Box Office Outside the enclosure fence for the pavilion are the operator s offices and the box offices located in separate structures. The operator s offices are accommodated in a two story frame farmhouse which existed prior to the construction of the Pavilion. Approximately 450 feet away from the administration building, adjacent to the Main Entrance gate is a small frame structure for the Box Office. Earlier located in a historic building on the Little Patuxent Parkway side of the property, the present Box Office is accessed by footpath from the parking fields and lacks vehicular access. D. Accessory Structures Ringing the Pavilion on three sides and clustered at varying distances of between 40 and 350 feet from the shed are a collection of freestanding wood frame structures serving as toilet facilities, concession and food sales booths, V.I.P. club, first aid station, storage, etc. Grouped with these in rather ad hoc fashion are fenced enclosures shielding the public s view from walk-in coolers, ice machines, air conditioning units, and a variety of other functions associated with an informal collection of basically independent operations. Ziger/Snead, LLP 5 October, 2004
90 Review of Operations III. Evaluation of the Site and Structures See also Photographs and drawings in Appendix E A. Site Evaluation 1. Parking Public Parking: Clearly a major consideration in the evaluation of Merriweather s potential as a vital performance venue is the availability of convenient parking. And the lots owned by Howard Research, accommodating up to 5,000 cars, have historically played a crucial role in the equation. Used for both parking and tailgate recreation associated with the summer events at the Merriweather, they are just sufficiently removed from the amphitheatre to maintain the Pavilion s woodland ambiance yet close enough to limit walking time to a few minutes. Without convenient parking, however the Pavilion would not to survive. If the Pavilion s seating were to be reduced as part of a reconfiguration, the requirements for audience parking would accordingly drop as well. But issues associated with pedestrian access between parking and a modified facility might arise. These are briefly identified elsewhere in this report.. ADA Accessible Parking: Currently about 31 spaces are located on the Columbia Association property to the west of the Pavilion and served by a convenient entrance. Provided the associated easements have been formalized and are extendable, the location of ADA parking seems satisfactory. But, per ADA requirements, the number of spaces in order is at least double the number currently provided. Performer Parking: Largely due the expansion of backstage facilities, performer parking, occupies significantly less space than originally, and it is now well undersized. Because the backstage parking lot lies close by the property line, and the 100 year flood plain just beyond, convenient expansion options are limited. Administration Parking: Located adjacent to the Administration building, this appears to be adequate. Concessionaire s parking, less formally defined, appears to suit current needs. 2. Access Vehicular Access: Authorized vehicles enter the Merriweather property either from little Patuxent Parkway or South Entrance Road and must pass through Columbia Association property in either case. The backstage, ADA parking, concessions booths, and north visitor gate are accessed from the former, while the Administration building and concessionaires offices and booths are all accessed from the latter. Formalized existing easements should be verified at each access point for both restrictions and lifespan. With the exception of cars bearing a handicapped symbol, there is no public vehicular traffic currently permitted within the Pavilion grounds, and public arrival/drop-off is a largely informal experience. While this suits the relaxed, warm-weather operation of the Pavilions summertime concert series, a more commodious and easily recognizable means of gaining entrance to the venue would be expected if patrons were possibly to arrive after dark and/or in inclement winter weather. This dictates that if the facility were Ziger/Snead, LLP 6 October, 2004
91 Review of Operations to be enclosed, substantial enhancements in access would be necessary. These might include a more formal entrance drive with brighter lighting, easily visible signage, and a dedicated area for efficient drive-thru and drop-off. Pedestrian Access: Since its inception, the Merriweather Pavilion has retained as a central part of its informal, woodsy aesthetic its mature existing trees wherever possible and in so doing also maintained the existing grading around the amphitheatre. While this has fostered a picturesque ambiance, it has made for occasionally difficult footing as one negotiates the significant natural slopes between venue and parking, restrooms, etc. The principal pedestrian access to the Pavilion is via a single footpath from the parking fields to the south, leading over the bridge and to the box office and south gate. The slight 20 foot descent from the fields down to a bridge over the stream and 20 foot climb back up to the entrance gates is likely considered by most visitors a delightful part of the summertime Merriweather experience. But it should be noted that the grades encountered between the lots and the main gate are not currently handicapped accessible, nor would they be optimal during inclement winter weather. Even once inside the main gates the public must negotiate a fairly steep compound slope before reaching the front of the venue. And as a result individuals with various disabilities find that certain parts of the Merrweather site are inaccessible to them. Though the pavilion s operators have, over the years, made good faith attempts at maintaining convenience access to selected concessions, restrooms, and seating locations, the site retains significant accessibility issues. Alternate routes of accessing the pavilion grounds on foot are available from Little Patuxent Parkway, a route that is quite level, and up the driveway from South Entrance Road, quite steep. 3. Utilities As previously described, all utilities serving the Merriweather property pass through land owned by the Columbia Association. This includes electrical power, telephone, water, sanitary and storm water. The electrical transformers for the facility are in Symphony Woods near the Little Patuxent entrance road. Some of these underground utilities, most notably the sanitary and telephone lines, are per the operator, reaching an end to their practical life. Though no stormwater management has been required to address site runoff to date, consideration should be given to the possible change in this situation should coverage of the Merriweather site be substantially increased either by new facilities or new paving if the facility is modified or replaced. 4. Storm Water Drainage: Although there is a large infiltration-type trench drain at the foot of the lawn seating area behind the covered seating, much of the storm runoff for the site simply makes its way across grass and paved areas undirected in a sheet flow down to the bottom edge of the site. Not only does this cause ongoing erosion of earth areas, but it has created an occasional problem with temporary flooding around the backstage area due to the bowled contour of the facility. Drainage must be better controlled via swales or underground conductors to resolve these issues. Ziger/Snead, LLP 7 October, 2004
92 Review of Operations B. Pavilion Evaluation 1. General The Pavilion itself, as described above, has a number of basic components: the covered House seating area, the stagehouse, the attached loading docks, and the adjacent dressing and catering structures. The main superstructure of the Merriweather shed appears to retain much of its original framing and board cladding, and in terms of condition and expected life there appear to be few pressing issues associated with the enclosure. In no locations was the steel framing observed to be either deteriorated or overstressed. The wood roof decking appears sound, and the modified bituminous builtup roof, replaced fairly recently, is in good shape. The roof drainage appears to be functioning properly and in satisfactory condition. Only the fiberglass shingles on the saddlebag perimeter of the stagehouse are in need of replacement; during the same work all existing associated flashings should be replaced as well. The seasonal Loge tents are not a desirable long term solution for weather cover to the side seating however. Costly to install, dismantle and maintain on a yearly basis, these canvas awnings have served only as a perpetually temporary solution. The guy cables stabilizing the temporary masts impede circulation at ground level, and the fixed masts installed to support the inside edge of each Loge tent, four on each side, obstruct views from the Loge seating. The Pavilion lacks sprinkler fire protection. A fully supervised system should be installed serving at least the stagehouse, loading docks, dressing and catering areas. A discussion with the local authority having jurisdiction would define exact requirements on full sprinklering of the open-air house. 2. House Covered Seating Risers: The concrete riser slabs which underlie the reserved seating areas are problematic from a number of perspectives including deterioration/settlement and restricted accessibility. Subjected to 30 years of use, yearly freeze-thaw cycles, and full rain/ice weathering near the shed s perimeters, the slabs are experiencing areas of spalling, cracking, and general wear. Riser mounted seats anchored to the slab occasionally work loose and require substrate repairs and reinstallation. Though not a critical issue in itself the concrete s deterioration raises a parallel question of a configuration with safety issues and large inaccessible sections. Constructed in 1967 the seating layout of the Merriweather Post Pavilion lacks both handrails and the more broad distribution of available seating now required by law for accommodation of the disabled in new performance facilities. Although the small area of dedicated H/C accessible seating presently exists in the west Loge, and both the front and rear of the reserved seating areas are accessible, there is no location at the center of the amphitheatre that is configured for handicapped accessibility. And the number of accessible seats required by the ADA for accommodation far exceeds the number currently dedicated. Audience Sightlines: Sightlines from the original reserved seating area and from much of the lawn are quite good. However much of the Loge seating experiences a somewhat obstructed view of the stage resulting from both the tight aspect in plan relative to the Ziger/Snead, LLP 8 October, 2004
93 Review of Operations proscenium opening as well as the location of the steel masts within the seating area which support the Loge tents. View restrictions range from an obstructed upstage corner at the rear of the seating to a loss of the entire rear of the stage at the seating down front. For this reason we understand from the operator that performers usually try to set up their shows toward the front of the stage. The condition of the house lighting is poor. All fixtures should be replaced. As described earlier, audience services are located remotely from the shed. In an enclosed or convertible venue this would not be acceptable. 3. Stagehouse As stated above, the roofing and enclosure above the stagehouse appears to be in sound condition with the exception of the fiberglass shingles and associated flashings on the lower portions requiring replacement. It is not clear whether a professional review was performed at the time of the installation of the auxiliary grid steel between the roof trusses to verify adequate structural capacity, but if a record does not exist, an engineer should be contracted to perform this examination. As visiting performers continue to stage increasingly elaborate shows the facility must be verifiably up to the task of supporting them. The existing proscenium opening dimensions and clear height-to-structure in the stagehouse have all been identified by the current operator as limiting for concerts. Also of some concern is the tapered configuration of the loft space above the stage which limits flexibility in rigging shows within the depth of the stage. The stagehouse has a poor configuration to support either theater or dance. Though the width of the proscenium could be marginally increased without undue cost to improve sightlines and sound wings, substantial increases in the other clearances would be quite expensive in view of the longspan nature of the roof structure. Most of the functional spaces in the rear and wing portions of the stagehouse have received superficial remodeling and infill over the years and are in need of renovations to their finishes, fixtures, and lighting. The existing 2,400 Amp electrical service to the stage is reported by the operator to be adequate. No access to the crawlspace below the stage floor could be attained at the time of the field examinations. But a 11/03 report contracted by the operator cited some corrosion issues observed during an examination of the sate floor framing in this area. A proper inspection of the crawlspace by a structural consultant is highly recommended. 3. Loading Area The 1997 modifications to the dock area greatly improved conditions for loading shows in and out. Up to 4 large trailers can simultaneously unload under cover with space on the dock for temporary laydown. 6 trucks can actually be accommodated, but this would likely make for some overcrowding. The existing 60 Amp shore power panel at the Ziger/Snead, LLP 9 October, 2004
94 Review of Operations Loading Area is said by the operator to be undersized. See comments related to site parking for additional evaluation of the loading functions. 4. Dressing Area Installed around 1990, the dressing trailers added significant space and flexibility to the performer s accommodations, and the operator has worked hard to maintain them in acceptable shape. However these manufactured units lack substantial construction, even suitable foundations, and upkeep is a constant effort to maintain water-tightness, structural integrity, temperature control, and finish continuity. These should be replaced with a permanent addition. 5. Catering Structures Similar to the Dressing trailers the two catering decks are essentially screened-in porches made from treated lumber framing with fiberglass shingle roofs. They function well within the casual summertime environment associated with the summer concert series, but would clearly be problematic in any but temperate weather. Their expected life is limited in any event, and they should be replaced with more permanent construction. C. Administration Building Evaluation The historic farmhouse currently housing the operators offices experiences all the maintenance issues normally associated with an aging residence. The operator has identified replacement of the single gazed, double hung windows with a more thermally efficient model for better energy performance as their highest priority for the structure. D. Box Office Evaluation The current Box Office suffers from severe water infiltration at its foundation and a sump pump is required to maintain its function. It experiences many of the conditions identified in the discussion of Outbuildings below. The location of the Box Office adjacent to the entrance gate requires that to purchase tickets in advance of a show, patrons must make the 5 minute woodland round trip on foot; a inconvenience that the current operators have identified as less than desirable. E. Outbuildings Evaluation Though all currently functioning on a highly stressed basis, each operation experiences difficulties stemming from insubstantial construction, lack of space, insufficient utility support, or combinations of the above. Most critical currently are problems with public restrooms as these suffer from deterioration due to rot, mold, damaged finishes, and multiple plumbing failures stemming principally from freezing over the winter season. The toilet rooms most used by the public are located adjacent to the main entrance gate, and these tend to be greatly over crowded. During the performance attended there were long lines exceeding 30 people waiting outside each of these restrooms during intermission. Other restrooms distributed over the property were only a bit less crowded. Ziger/Snead, LLP 10 October, 2004
95 Review of Operations Concessions currently cope with deteriorating enclosure and a shortage of adequate electrical power, kitchen services, and general back-of-house support space. The number of outbuildings and associated support equipment surrounding the Pavilion has proliferated greatly since the initial construction of Merriweather. And after 35 years of essentially ad-hoc development without an overall master plan, these facilities now lack a coherent visual or organizational integrity. A formerly limited number of strategically placed kiosks has grown into a confusing din of competing graphics, structural expressions, material uses, and varying scales. Some ordering and unification is definitely in order. IV. Conclusions It should be expected that the existing condition of the primary Merriweather Pavilion facility is characteristic of any 35 year old open-air building that has experienced yearly 100 degree temperature swings, and 35 winters of daily freeze thaw. Serving between 200,000 and 500,000 patrons a year without major structural renovations has taken its toll. While the basic superstructure appears to still be quite sound and capable of continuing to serve well into the future, a substantial amount of remodeling work is in order. Fortunately, having proven itself very adaptable, the shed should be able to accommodate renovations and carefully inserted additions once temporary tents and trailers and clutter of less substantial construction are cleared out. Surrounding the Pavilion, are a number of smaller scale existing outbuilding facilities and services that, in the not distant future, will all require complete replacement. The Howard County Department of Permits has indicated that issuance of an operations permit for the Merriweather facility to any new owner will be contingent upon agreement to bring all features up to current code requirements, including ADA provisions, according to an acceptable renovations timetable. This requirement would apply to the County, itself, if a decision is made to purchase the property. The predominance of these code-mandated improvements should be achievable within the course of the improvements recommended below. The evaluation of optional modification/replacement of the Merriweather Post as either a convertible or totally enclosed venue is obviously a much more complex one especially given the small size and significant grade differential of the site, the protected nature of the properties surrounding the site, and the presently undetermined parking status. We addressed some of the associated issues in the descriptions and evaluations above. But we are not yet able to make concrete recommendations on alternate configurations at this point in our study. Below are summarized the main tasks identified in the report pertinent to sustaining the existing operation. We have attempted to prioritize them with regard to urgency. Naturally, the availability of funding, efficient construction phasing, and other considerations may dictate a different sequence. A. Resolve the Parking Question. If the Pavilion continues to serve the current numbers at even some events, around 7,000 parked cars should be accounted for. ADA parking on Columbia Association property should be doubled in capacity. Ziger/Snead, LLP 11 October, 2004
96 Review of Operations Associating a budget cost with this item would be overly speculative at this point, subject entirely to negotiations with the Rouse Company and/or the Columbia Association. B. Replace Audience Restrooms: Demolish cramped, deteriorating existing facilities and replace with expanded, reconfigured structures to provide safer, more convenient access as well as increased fixture counts including ADA accessible fixtures. Renovate two existing historic facilities accordingly. Note that this has also been identified as a top priority by the operator. Budget Allowance: $1,320,000 C. Replace Aging Site Utilities: Replace site water, storm water, sanitary, electrical power, and telephone lines and telephone service to serve Pavilion and all newly configured outbuildings. Expand electrical network and capacity to new concession areas. Install new site lighting throughout. Budget Allowance: $1,000,000 D. Re-grade Site Pedestrian Access: Reduce steep slopes and minimize cross slopes with new paving, ramps, steps, retaining walls, railings, etc. where required to assure convenience, accessibility, and safety. Control storm runoff and reduce erosion by means of new swales, and subsurface drains. Budget Allowance: $700,000 E. Replace Temporary Loge Tents with Permanent Roof: Eliminate complex, maintenanceintensive assemblies of canvas, guy wires, and posts and replace with substantial roof structure visually compatible with existing. This will provide reliable cover long term while improving sightlines and access to seating. Install matching acoustical treatment and replace all house lighting throughout. Budget Allowance: 1,937,500 F. Replace and Reconfigure Seating Base: Remove deteriorating, access-restricted stepped concrete slab and replace with new, configured to provide safe and convenient access, solid seating anchorage, and more varied viewing options. Modify subgrade as necessary; install new underground utilities, safety railings, and step lighting as required. Repair existing concrete foundations. Install new arena-type seating. Budget Allowance: $3,090,000 G. Replace Temporary Performer Dressing and Catering Structures with New Addition: Remove space-inefficient, deteriorating quarters with permanent building incorporating proper enclosure, services, and finishes. Install sprinkler fire protection throughout, including stagehouse and loading areas. Budget Allowance: $1,090,000 H. Replace, Relocate, and Coordinate Box Office, Concessions, and Related Functions, including Associated Graphics: Address the practical needs of these essentially Ziger/Snead, LLP 12 October, 2004
97 Review of Operations permanent functions with proper enclosure and services organized and located as a part of a unified, readily-understandable design expression. The temporary festival in the woods is no longer a model that serves practical needs. Conveniently locate the Box Office so that it is accessible to motor vehicles. Budget Allowance: $2,375,000 I. Widen Proscenium Opening: Widen wood framed opening to improve sound wings to Loges. Budget Allowance; $300,000 J. Replace Windows in Administration Building Budget Allowance: $36,000 Total Budgeted Costs Less Parking Provisions: $11, 848,500 Add Soft 30% $ 3,554,550 Total with Soft Costs (as of 2004) $15,403,050 Clearly, all of the above renewals and upgrades would be most efficiently realized if performed in one integrated construction project. This may or may not prove to be practical from a financial or scheduling perspective. But fortunately, each appears to be of a nature that it could be accomplished incrementally over time. Provided approval is received from Howard County to proceed with Phase II of the study, we have proposed to move into a Concept Development phase. Under this phase, physical plans based on up to three development options might be produced to each include the following: a space program for each proposed development, a site plan showing additions and alterations to facilities including possible parking solutions, estimated construction and project costs for the recommended improvements, and a conceptual rendering that illustrates the improved facilities. Ziger/Snead, LLP 13 October, 2004

98 Review of Operations Appendix E Photographs and Drawings Aerial view of Merriweather Post Pavilion and surrounding region showing existing parking fields to the south on property to be developed by the Rouse Company, Symphony Woods owned by the Columbia Association immediately surrounding the site, and Columbia Mall to the north. Ziger/Snead, LLP 1 October, 2004

99 Review of Operations Composite Site Plan by Century Engineering, original date 9/8/89, showing proposed 2001 improvements. Enlarged portion of aerial view above showing limits of property under ownership by Merriweather Post Business Trust; property lines are roughly determined by the extent of the outbuildings serving the Pavilion. Note the concrete Loge seating without tents in this wintertime picture. Ziger/Snead, LLP 2 October, 2004


100 Review of Operations Merriweather Post Pavilion from Northeast Original historic structures used over time as restaurant, ticket office, restrooms, and storage Ziger/Snead, LLP 3 October, 2004


101 Review of Operations Main Entrance to Merriweather Grounds from parking fields to be developed View from Columbia Association bridge back to parking fields. Note pathway slope. Ziger/Snead, LLP 4 October, 2004


102 Review of Operations Main Entrance Gate at Opening Time Visitors approaching Pavilion from Main Entrance Plaza Ziger/Snead, LLP 5 October, 2004


103 Review of Operations Pavilion from Northeast Corner Stage Proscenium and center reserved seating with tented Loge beyond Ziger/Snead, LLP 6 October, 2004


104 Review of Operations Reserve seating showing box seats Sound/light control in reserved seating right Ziger/Snead, LLP 7 October, 2004

105 Review of Operations Original riser-mounted cast iron seating Original concrete cheek wall between original and added reserve seating on each side of Pavilion Ziger/Snead, LLP 8 October, 2004


106 Review of Operations Accessible seating at West Loge Guying for Loge tents at grade. Note bridge over stormwater swale. Ziger/Snead, LLP 9 October, 2004


107 Review of Operations Characteristic concrete deterioration at Pavilion base, east side Characteristic settlement cracking at perimeter of West Loge Ziger/Snead, LLP 10 October, 2004


108 Review of Operations Roof Drains over Stage House. Main roof is in good condition. Roof showing access to follow-spot booth over center of reserved seating area Ziger/Snead, LLP 11 October, 2004


109 Review of Operations Performer trucks at Loading Dock accomodating six trailers Limited parking back stage for performer busses Ziger/Snead, LLP 12 October, 2004


110 Review of Operations Dressing Rooms in manufactured building behind stage. Catering decks, bus parking beyond Performer catering decks back stage behind Dressing Ziger/Snead, LLP 13 October, 2004
111 Review of Operations Schematic Layout of Truck Docks by SWB & Company Architects, dated 4/4/97 Detail of Truck Dock Construction by SWB & Company Architects, dated 4/4/97 Ziger/Snead, LLP 14 October, 2004


112 Review of Operations Administration Building and parking Box Office at Main Entrance gate. Note grade cut close by at rear. Ziger/Snead, LLP 15 October, 2004


113 Review of Operations Concessions at Main Entrance Plaza Concessions at Main Entrance Plaza. Note significant cross slope. Ziger/Snead, LLP 16 October, 2004


114 Review of Operations Concessions at Main Entrance Plaza Steps down to restrooms at Main Entrance Plaza. Note slopes. Ziger/Snead, LLP 17 October, 2004


115 Review of Operations West side, ADA accessible, concession area including I.M.P. Club prior to showtime West side of Pavilion and Lawn Ziger/Snead, LLP 18 October, 2004

116 Review of Operations Trailers to support concessions operations, located on Columbia Association land adjacent to Administration Building Ziger/Snead, LLP 19 October, 2004
117 Needs Assessment needs assessment The third component of our study is an assessment of the need for new arts and entertainment facilities for Howard County in terms of potential audience support, user demand, the current inventory of facilities and the potential benefits and impacts of new facilities on the region. Following is a summary of our research, analysis and findings. Context As was discussed in the last round of work, Merriweather Post was conceived to be an arts facility that would be an anchor for Columbia and a destination for those living in the region. A series of efforts to bring the arts into the facility have not been successful, but the facility and its entertainment programming have been hugely successful in becoming a regional destination. Now, with the future of the facility uncertain, we must consider the need for cultural and entertainment facilities and the role that Merriweather Post can and should play in the fulfillment of those needs. Existing Facilities The first part of our analysis is to consider the existing inventory of facilities serving the market in order to judge if there are any pieces missing. The following sections consider the roles played by different facility types in serving the region. They are: 1. Community-oriented Arts Facilities 2. Regional Cultural Facilities 3. Regional Large Entertainment Facilities 4. Other Regional Facilities 1. Community-oriented Arts Facilities Jim Rouse Theatre The Jim Rouse Theatre is in the Wilde Lake High School. Although a school auditorium, the 750-seat Theatre is a professional quality performance space, with an entrance and lobby designed to operate independently from the school. In a creative partnership between the Howard County Arts Council and the Howard County Public School System, the existing school auditorium was renovated and re-opened in 1997 to provide state of the art facilities that would also benefit the community by providing non-profit arts organizations Webb Management Services, Inc. 1 December 2004

118 Needs Assessment a less expensive local venue than those available in Baltimore and Washington. Priority access is given to the school to meet arts and educational objectives of the district, followed by Howard County arts and sponsoring organizations. According to Sally Livingston, the Theatre Manager, the facility is required to accommodate at least one hundred event days of outside use each year. These include commercial rentals, but non-profit cultural activities are given priority access to scheduling over other renters. Non-profit arts organizations are also eligible for rental subsidies from the Howard County Arts Council. Approximately 6 to 8 organizations apply annually for user subsidies and receive grants depending on the availability of funds as well as the type and nature of the requests. According to its Manager, the facility tends to accommodate outside activities in excess of its mandate. However, local arts organizations cite difficulties in gaining scheduled access to the facility. Local arts events are primarily accommodated during weekends, where parking accessibility is not constrained by student and faculty usage. The 12,500 square foot venue is fairly intimate for its size, with the furthest seat 70 feet from the stage. With an ample stage area and sprung floor, the venue can accommodate a range of activities, from theatre, dance, orchestral and choral performances to corporate functions. Two significant constraints in accommodating diverse activities have been acknowledged by its Manager and by users of the facility. First, as a proscenium theater, it is not designed for un-amplified musical events. Although outfitted with a portable acoustical shell, classical presenters like the Candlelight Concert Society and Pro Cantare are dissatisfied with the acoustic performance of the facility. The second shortcoming relates to the sightlines from orchestra seating. Apparently, the raked seating slab was incorrectly laid, leading to obstructed views of the lower portion of the stage from the orchestra. This is seen as a particular detriment to dance presentations with significant floor work in their choreography. According to the findings of our interviews and surveys, performance constraints do not deter classical music and dance users from using the facility. Primary issues that discourage use by Howard County arts organizations are: scheduling constraints, difficulties in filling a 750-seat facility, and the cost to smaller organizations of a scenic build-out of a 50-foot wide stage. Webb Management Services, Inc. 2 December 2004
 for event users like the Columbia Festival.")
119 Needs Assessment Rental of the Jim Rouse Theatre also includes access to the school s dance studio, choral, band and dressing rooms, and the Mini Theater, a black box teaching space. The Mini Theater is occasionally used by renters as a performance space (roughly 200-seat capacity) for event users like the Columbia Festival. Howard Community College - Smith Theatre The primary performance facility made available for public use is the Smith Theatre, a 409-seat proscenium theater managed by the College s Arts and Humanities Division. Although a college facility, it shares similar scheduling constraints to that of using the Jim Rouse Theatre. Weekends are booked year-round with non-profit arts organizations given priority over commercial users. Weekdays are rarely available, given departmental access requirements and the lack of available parking during the school week. According to the College, demand on available performance times is higher than with the Rouse Theatre given the following: there is substantial programmatic demand to support the activities of the College s nearly 5,000 arts students; at 250 to 409-seats (with the ability to wall off two rear sections of seating) there is greater demand from Howard County arts organizations seeking a smaller venue than the Rouse Theatre; and the Smith Theatre is also home to Rep Stage, an Equity resident company which receives priority scheduling in advance of other nonprofit arts organizations. Scheduling is further constrained by the accommodation of the Columbia Film Festival, which presents at the Theatre for one weekend each month from September through June. Although the facility has a better reputation regarding its acoustic performance than the Rouse, it is an inferior facility for dance presentation in addition to a mechanized stage system creating uneven flooring conditions for dancers, wing space is constrained. It should be noted that the College is planning to renovate the facility to improve the wing condition as well as to extend the seating capacity from 500 to 600-seats. In reconfiguring the audience seating, the venue will no longer offer flexible seating capacity. To address the needs of the College, construction of the $19 million, 78,000 square foot Elizabeth & Peter Horowitz Visual and Performing Arts Instructional Building is currently underway, scheduled for completion in the fall of In addition to providing student training facilities, the new building will provide a flexible black box space with a 150 to 250-seat Webb Management Services, Inc. 3 December 2004
120 Needs Assessment capacity, as well as a 100-seat recital hall. According to the College, although the recital hall will be primarily used to support student and faculty activities, the new black box will be programmed in a similar fashion to the Smith Theatre, allowing access to outside renters on weekends. Howard County Center for the Arts Black Box The HCCA was developed as a community resource for Howard County residents, artists and arts organizations. The Center is operated by the Howard County Arts Council (HCAC), which uses the 27,000 square foot converted elementary school to provide youth and adult classes, children s summer camp, and a venue for artistic development and presentations. These activities are accommodated with a gallery and visual art studio spaces, classrooms, a dance studio and a 98-seat black box theater. In addition to supporting performance activities, over 30 artists and arts organizations make their home at the HCCA through residency or affiliated programs. With funding support from Howard County, the Maryland State Arts Council and The Columbia Foundation, the HCAC began renting the use of its black box theater in 1998 at low cost ($30/hour for non-profits) to performing arts and arts-in-education organizations in order to encourage and maintain a lively arts community in Howard County. The theater is made available to these renters when not in use to support HCAC (or partnership) programs which occur 3 day during the week from fall through spring, and 7 days per week for the duration of its summer camp program (mid June through early- September). According to the HCAC, the black box has been historically rented below its capacity with the exception of peak demand periods, which include the fall/winter holidays and the spring season (March - June). Dance presentations play a significant role in the increased demand during peek periods. The physical characteristics, rental rates and usage pattern of the theater point to a facility used for continued development of individual artists and arts organizations with limited resources. The theater is equipped with fixed risers and a 750 square foot performance area. The performance area accommodates a sprung floor, a fixed grid with no fly space, and only one operable wing. According to Amy Poff at HCAC, the facility works well as an incubator space for local arts organizations, especially for dance, and is regularly used for master class and recital activities by the Howard County and Maryland State Music Teachers Associations and their affiliated teachers. The venue is primarily booked for weekend activity, with a load in/tech day and one to two performances. The Chesapeake Shakespeare Company is the primary exception, running productions spanning 2 to 3 Webb Management Services, Inc. 4 December 2004
 is within Slayton House, the Wilde Lake Community Center.")
121 Needs Assessment consecutive weekends 1 to 2 times per year. During off-peak periods, weekend usage averages between 50 75% of available days. Slayton House - Gene Weiss Room The Gene Weiss Room (GWR) is within Slayton House, the Wilde Lake Community Center. The 2,050 square foot room is a multi-purpose space used for diverse community activities, ranging from wedding receptions, banquets and business meetings, to dance/exercise classes and presentations. The GWR has a 630 square foot elevated stage with performance lighting and sound. For performances, an electronically released riser system allows for a maximum seating capacity of 240 for theatre, dance and piano recitals. The room also maintains a retractable movie screen for film programs. Performer support spaces at Slayton House include a 1,570 square foot rehearsal hall (which doubles as a technical area for construction of minimal sets), two small dressing rooms and a 1,484 square foot dance studio. The Slayton House also maintains a gallery that is occasionally used in concert with activities in the GWR, as it was by the Columbia Festival. Slayton House facilities are rented by the hour, with discounted rates for Columbia residents who pay the CPRA assessment. Scheduling availability for local arts organization is somewhat constrained by activities sponsored in the GWR by the Wilde Lake Community Association. These activities include a classical movie series running Friday evenings from September through June, with audience discussions led by a guest presenter. The Association also presents puppet theatre performances by the Rainbow Theatre and provides a home to the Columbia Community Players, a non-profit community theatre organization. 2. Regional Cultural Facilities There are a number of cultural facilities serving the Washington and Baltimore markets, ranging in size and programmatic focus. The following chart details those with a capacity larger than 1000-seats. Webb Management Services, Inc. 5 December 2004
122 Needs Assessment Regional Cultural Facilities Location Capacity Type Schlesinger Hall & Art Center, NVCC Alexandria, VA 1,000 Performing Arts Center Weinberg Center Frederick, MD 1,180 Proscenium Theater Clarice E. Smith PAC at UMD College Park, MD 1,200 Performing Arts Center Lisner Auditorium, GWU Washington, DC 1,490 Concert Hall Mechanic Theatre Baltimore, MD 1,600 Proscenium Theater National Theatre Washington, DC 1,676 Proscenium Theater Ford's Theater Washington, DC 1,700 Proscenium Theater Warner Theatre Washington, DC 1,847 Proscenium Theater GMU Center for the Arts Fairfax, VA 1,935 Performing Arts Center Strathmore Hall Bethesda, MD 2,000 Concert Hall Carpenter Center Richmond, VA 2,043 Performing Arts Center Hippodrome Theater Baltimore, MD 2,280 Proscenium Theater Kennedy Center for the Performing Arts Washington, DC 2,454/2,300 + Performing Arts Center Meyerhoff Symphony Hall Baltimore, MD 2,462 Symphony Hall Constitution Hall, DAR Washington, DC 3,702 Auditorium Schlesinger Concert Hall & Art Center: On the Alexandria campus of Northern Virginia Community College, the Rachel M. Schlesinger Concert Hall and Arts Center opened in The Center is home to many local groups as well as college programming. Weinberg Center for the Arts: The Weinberg Center for the Arts was first known as the Tivoli, a movie palace that opened on December 23, After many starts and stops, the building was opened as the Weinberg Center for the Arts in A variety of disciplines, regional groups and presented programming is hosted at the Center. Clarice E. Smith Performing Arts Center at University of Maryland: The new Center, located on the campus of the University of Maryland, is home to the students and faculty of the School of Music, Department of Theatre, Department of Dance, and the Michelle Smith Performing Arts Library. There are also presented programs and community events. The Center s facilities include: 1,100-seat concert hall; 650-seat proscenium theater; and a 180-seat dance theater George Mason University Center for the Arts: The Center and its 2,000-seat theater opened in 1990 on GMU s Fairfax campus. The facility attracts annual audiences of 100,000 patrons, attending performances by local artists and ensembles, community activities, student and faculty productions, as well as productions by Theater of the First Amendment and a GMU presentation series. Lisner Auditorium, GWU: The 1,490-seat Lizner Auditorium, built during World War II, serves as both an educational facility for George Washington University and as an arts and cultural center for D.C. audiences. Cultural offerings include annual performance by the Washington Concert Opera and Opera International. Webb Management Services, Inc. 6 December 2004
123 Needs Assessment Mechanic Theatre: Located in Baltimore, the Mechanic is largely used as a Broadway roadhouse. The shows are generally not A shows, but are very popular and sell well. National Theatre: The National Theatre in Washington, D.C. is a Broadway touring house. The National is managed by the non-profit Shubert Organization who presents mostly first-run tours. Ford s Theatre: The theater where President Lincoln was assassinated is still operating. Often used for special events, the theater is run by a non-profit producing organization that also puts on several productions each year. Warner Theatre: Warner Theatre in Washington D.C. is used by many regional groups such as the Washington Ballet. It also presents several onenight engagements, such as George Carlin, music events, and dramatic shows. It generally stays away from big Broadway musicals. Strathmore Hall: Located outside Bethesda, MD, the Strathmore focuses on fine art and music, such as orchestral presentations. The facility is very busy with a variety of users and uses. Carpenter Center: Located in Richmond, the Carpenter Center is an historic movie house that has been transformed into a popular venue mainly for all types of music, from Ray Charles to the BSO. Hippodrome Theater: Just re-opened fall 2004, the Hippodrome Theatre in Baltimore is a mutli-million dollar effort by the City and Clear Channel to revitalize downtown. The theater has opened to great acclaim, and is programmed with blockbuster performances and shows for the first year. Kennedy Center for the Performing Arts: One of the Country s more famous performing arts venues, the Kennedy Center located in Washington D.C. hosts ballet, dance, music, galas, children s programming, and more. Meyerhoff Symphony Hall: Since 1982, the Meyerhoff has gained the reputation of being a premier acoustic venue located in Baltimore. It is an anchor of Baltimore's midtown cultural district, and hosts symphony orchestras and classical virtuosos, as well as popular entertainers. DAR Constitution Hall, Washington D.C.: Rich with history, every president since Calvin Coolidge has attended events at DAR. Dedicated in 1929, the National Symphony was founded at the Hall in 1930 and called it home for 41 years. The Hall has hosted numerous television events and a variety of popular and niche music and dance presentations. The venue seats 3,702. Webb Management Services, Inc. 7 December 2004
124 Needs Assessment 3. Regional Large Entertainment Facilities Entertainment Facilities Location Capacity Type Filene Center at Wolf Trap Vienna, VA 6,700 Pavilion D.C. Armory Washington, D.C 1,000-10,000 Arena 1st Mariner Arena Baltimore, MD 5,000-14,000 Arena Verizon Amphitheater Virginia Beach, VA 20,000 Pavilion Nissan Pavilion Bristow, VA 25,000 Pavilion Fort Dupont Summer Theater Washington DC not available Summer Stage Nissan Pavilion at Stone Ridge, Bristow, VA: Located in Bristow, Virginia, the Nissan Pavilion opened in 1994 with a capacity of 25,000. The venue is owned and operated by Clear Channel. Tickets are sold for either covered or lawn seating; patrons can rent lawn chairs or bring in blankets (no personal lawn seats allowed). There are two 30-by-40-foot video screens, one on either side of the stage, that attempt to make up for any deficiencies in the sightlines, and sound amplification well amplified to serve the expansive venue. Given its capacity and location, the Pavilion hosts large blockbuster acts and festivals such as Lollapalooza, HORDE Fest, Dave Matthews, Britney Spears, Rolling Stones, Celine Dion, and Jimmy Buffett shows. During the festival shows, concert-goers cycle between the main stage, art vendors and second-stage acts. During single-act shows, moving around the Pavilion from concessions to seats to restrooms is relatively easy. Miller Brewing Company sponsors the Pavilion, and wine and beer are sold at most concert events. In addition, there are a variety of concession options. Concerts are held rain or shine, and the venue does not give refunds unless under extraordinary circumstances. There are many complaints about the lack of convenience at Nissan Pavilion namely accessibility from major roads, parking and traffic flow. Many say it takes an hour or more just to get into and out of the parking lot before and after an event because there is only one exit and no traffic signs, markings or directors. Verizon Amphitheater, Virginia Beach, VA: The Verizon Wireless Amphitheater (formerly the GTE Virginia Beach Amphitheater) opened in 1996 and was built by a joint venture between the Virginia Beach Development Authority and Clear Channel. Total construction of the Amphitheater was about $13.8 million. The venue has 7,500 covered, reserved seats, and room for another 12,500 patrons on the sloped lawn. There are also two video screens on the side of the stage for those in reserved seating to view and three more video screens for the lawn seating. For many shows, one child under 12 is admitted free to the lawn for each adult ticket. There is ample parking space, but the parking is a long walk from the venue. For a venue of its size, traffic flow into and out of the parking lot is relatively Webb Management Services, Inc. 8 December 2004
125 Needs Assessment good. Beer, wine and concessions are sold in the venue. Guests are allowed to bring in blankets, but not lawn chairs, which are available for rent. The Verizon Wireless Amphitheater hosts popular genre acts such as Kenney Chesney, Blink 182, Linkin Park, The Roots, and John Mayer. They have a very busy season, hosting over 25 concerts a summer. Fort Dupont Summer Theater, Fort Dupont Park, Washington DC: With 376 acres, Fort Dupont Park is one of the largest in Washington. Opened yearround, park goers can take part in picnics, nature walks, Civil War programs, gardening, environmental education, music, skating, sports, and youth programs. Among many small stages, there is an outdoor summer stage, with lawn seating. The park presents a popular summer weekend jazz concert series. Concerts are free to the public. Patrons generally park around the perimeter of the park, in private neighborhoods. Shows begin at 8:00 pm and end by midnight at the latest. 1 st Mariner Arena, Baltimore, MD: Renamed in 2003, the 1 st Mariner Arena is more commonly known as the Baltimore Arena. Opened in 1962 as an anchor of the Baltimore Inner Harbor redevelopment, the Arena is Baltimore s largest indoor entertainment venue. There are 11,000 permanent seats, and maximum capacity can reach 14,000 depending on the event and the lay-out of temporary seating; the Arena can also be curtained down to a 5,000-seat capacity with a portable stage house. The 1st Mariner Arena is a City-owned building that is privately managed by SMG, a Philadelphia-based private management company. The Area went through major renovations in the late 1980 s, and the ice system was completely replaced in There is an adjacent 850-car parking garage, with remaining patrons either seeking parking nearby, or coming by the light rail which stops alongside the facility. The 1st Mariner Arena is host to 800,000 guests annually. The Arena is home to the Baltimore Blast MISL soccer team. The Arena also hosts a large number of family shows, including Sesame Street Live, Barney, and Disney's World on Ice. Other events include WWE Wrestling, Motorsports, closed circuit boxing, gymnastics, tennis, conventions, graduations, and large meetings. Concerts presented at the facility have included Elton John, Shania Twain, U2, Toby Keith and Britney Spears. D.C. Armory, Washington, D.C.: The D.C. Armory is a multi-purpose space that can be an auditorium, arena, big top or ballroom. The venue hosts conventions, circuses, inaugural balls, horse, home, car, and food shows. The Armory also can be adjusted to seat audiences from 1,000 to 10,000. There is ample parking for guests and buses. The building is available for rent for $7,500 a day. It has been a haunted house, a sports arena, a concert venue Webb Management Services, Inc. 9 December 2004
126 Needs Assessment and a social meeting place. The Armory is owned and operated by the D.C. Sports and Entertainment Commission, who also manage and own the RFK Stadium. Wolf Trap, Vienna, VA: Wolf Trap is a partnership between the Wolf Trap Foundation and the U.S. Department of the Interior, National Park Service; it is the only national park devoted to the performing arts in the United States. The Filene Center II at Wolf Trap is an open-air venue with 2,600 covered orchestra seats, 1,100 covered balcony seats, and 3,000 lawn seats. The sloping and grassed lawn is distant, but has a clear view of the stage over the head of the covered lower level audience. The original Filene Center opened in 1971 and burned to the ground in 1982; the reconstructed facility opened in 1984 and cost about $20 million. The Barns, a 352-seat theater also in the park, is open year-round and hosts a variety of events. More recently, Wolf Trap opened the $10 million Center for Education at Wolf Trap with advanced multi-media capabilities. The facilities are managed by the U.S. Department of the Interior National Parks Service, who maintain the grounds and buildings of Wolf Trap National Park and provide technical theater assistance for the Filene Center. Programming and operations are managed by the Wolf Trap Foundation. Wolf Trap presents opera, dance, symphony music, Broadway tours, all types of music (pop, country, rock, new world), film and avant garde performance art and multimedia presentations. The Wolf Trap Foundation also manages the Wolf Trap Opera Company, other performing companies, and educational activities. Most of these activities use The Barns, and occasionally perform in the Filene Center. The Filene Center season usually runs from the end of May to the beginning of September with an average of 90 performances each year and about 450,000 patrons. Total operating expenses in 2002 were almost $25.5 million supported with $19.3 million in earned revenues and contributed income of $5.3 million (with $700,000 in government grants, mostly from the Park Service). Wolf Trap is also available for rent to businesses, weddings and other social. Webb Management Services, Inc. 10 December 2004
127 Needs Assessment 4. Other Regional Facilities Other Regional Facilities Location Capacity Type The Show Place Arena Marlboro, MD 4,500 Arena G. Richard Pfitzner Stadium Woodbridge, VA 6,000 Stadium Patriot Center at GMU Fairfax, VA 10,000 Arena MCI Center Washington, D.C. 20,000 Arena Oriole Park Baltimore, MD 48,262 Stadium RFK Stadium Washington, D.C. 56,000 Stadium M&T Bank Stadium Baltimore, MD 69,000 Arena Washington Convention Center Washington, D.C not available Convention Center G. Richard Pfitzner Stadium, Woodbridge, VA: The Stadium is home to the Potomac Cannons, a single-a minor league baseball team formerly affiliated with the Cincinnati Reds, and recently signed a contract with the Montreal Expos. M&T Bank Stadium, Baltimore, MD: Home of the NFL s Baltimore Ravens. MCI Center, Washington, D.C.: The 20,000-seat Center is home of the NBA s Washington Wizards, the NHL s Washington Capitals, the WNBA s Washington Mystics and the Georgetown Hoyas basketball team. The venue also hosts some concerts, family shows and other sporting events such as Alan Jackson and Yanni. Oriole Park at Camden Yards, Baltimore, MD: Home of Major League Baseball's Baltimore Orioles. Patriot Center at George Mason University, Fairfax, VA: The 10,000-seat arena hosts GMU basketball games, commencement ceremonies, performances and special events. RFK Stadium, Washington, D.C.: Home to Washington's professional men's soccer club, D.C. United; women's soccer club, Washington Freedom; and occasionally used as a venue for concerts and other events. The Show Place Arena and Prince George's Equestrian Center, Upper Marlboro, MD: The Show Place Arena and Prince George's Equestrian Center are facilities of The Maryland-National Capital Park and Planning Commission -- Department of Parks and Recreation/Prince George's County. The venue opened in 1993 and seats approximately 4,500. The facility is rented to a variety of users, including cheerleader competitions, trade shows, sports tournaments and some concerts such as a jazz series. It is home to the Maryland Nighthawks, an American Basketball Association team. The Equestrian Center is well-fashioned to host a wide variety types of equestrian events. Webb Management Services, Inc. 11 December 2004
128 Needs Assessment Washington Convention Center, Washington, D.C.: The city's new 2.3 millionsquare-foot convention center is one of the largest in the country. Existing Facilities Inventory: Conclusions Performing arts facilities in Howard County are few in number and serve multiple markets, including education, community arts and cultural activities, and commercial renters. Local users consider the Jim Rouse Theatre and the Smith Theatre as the primary performance venues for Howard County arts organizations. Cumulative demand for these facilities is in excess of capacity. Demand for the Smith Theatre is the most acute, with local arts organizations competing for limited slots. The demand spike on the Smith Theatre is a product of two forces: the limitation on dates left available to community organizations once the schedules of its primary users have been established, and the desire of many local arts organizations to play a small-to-midsize performance venue. Availability of parking is perceived to be a critical issue for both facilities, one that deters weekday programming and has arts organizations competing primarily for weekend dates at these venues. It should be noted that the current un-met demand on the Smith Theatre and seasonal demand spikes in usage of the HCAC black box may be reduced in part by the construction of HCC s new black box, scheduled for completion in In regards to available facility types, there are two performing arts disciplines currently under-served by existing facilities. To begin, there is no facility in the County designed to support choral or symphonic presentations. Venues intended for these types of activities are typically designed to support un-amplified performances, with the appropriate volumes, shapes and surface qualities to support concert quality acoustics. Of the facilities in Howard County, the Rouse Theatre comes closest to providing the right stage and audience volumes, but its proscenium design and hard surfaces give rise to ample complaints regarding its deficiencies in this regard. The acoustics are deemed most problematic to musicians abilities to hear themselves play. Dance is the second discipline underserved by the inventory of Howard County facilities. Although the Jim Rouse Theatre and the HCAC black box are both equipped with sprung floors, both have additional constraints affecting the quality of dance presentations: orchestra sightlines are obstructed in the Rouse Theatre; and the black box theater has a small performance area with only one operable wing, significantly constraining production size and choreography. The Smith Theatre is considered to have good sightlines and intimacy for smaller dance productions, but uneven conditions when over-laying the stage with a dance surface makes it less than ideal. Regarding regional cultural facilities, there is an abundance of venues serving varying performance activity types in the neighboring Baltimore and Webb Management Services, Inc. 12 December 2004
129 Needs Assessment Washington markets. There is no apparent gap in this inventory that suggests a role for Columbia to provide facilities to support cultural organizations inadequately served in these regions. As to large entertainment facilities, there is no shortage of venues providing popular entertainment to Baltimore, Washington and surrounding markets. As noted above, these facilities vary greatly in terms of seating capacity, configuration, audience covering, amenities, operations and ownership. Market saturation of concert venues has led to bidding wars for artists and a related spike in artist fees, which has in turn led to a significant increase in the average ticket price, rising 13% between 2003 and Although ticket sales for the first half of 2004 were down as compared to the first half of 2003, the impact on venues has varied: sales to the top 50 arenas have risen while those of amphitheaters have fallen. Given the positive trends in number of concerts, total attendance and gross revenues at Merriweather Post (as detailed in the Review of Operations Report) a downward trend regarding amphitheater sales should not necessarily be viewed as a harbinger for these types of venues. Rather, it emphasizes the requirement for facilities actively competing in a market sector to focus on significant competitive advantages in order to succeed. Successful live entertainment presenters have acknowledged the importance of selling a much broader experience. Facets of this experience range from the amenities provided by the facility, like concessions, shops, parking, and entrance/egress, to the facility s location and its perceived added value to the overall experience. The added value can vary among audiences but has been known to include issues like proximity to home as well as the qualities of the site and its surrounding area, which include perceptions of safety, accessibility to other leisure activities (restaurants, etc.) and the aesthetic environment of the venue. User Demand for Facilities In this section we consider the potential demand for new facilities in terms of the needs of local and regional producing and presenting organizations. There are fewer than 20 local performing arts organizations of varying levels of professional development that share the inventory of performing arts facilities in Howard County. Many of them also use venues throughout the Baltimore-Washington corridor. Below is a chart of local arts organizations to whom we have reached out for information. We conducted interviews and surveys with organizations identified to us by the Howard County Arts Council to assess current facility use as well as demand for additional venues. Participating organizations are highlighted. Several attempts by phone, and fax were made to each of the remaining organizations to respond to our inquiries. Webb Management Services, Inc. 13 December 2004
130 Local dance users reiterated the constraints of using the Rouse Theatre and Smith Theatre as previously described. Dance organizations confirmed, however, that decreasing availability of local facilities was seen as the key issue driving activities outside of Howard County. Eva Anderson, Artistic Director of Eva Anderson Dancers, acknowledged that her organization continues to use the Jim Rouse Theatre, despite problems with its sightlines, but that availability constraints have limited the number of performances. Ms. Anderson remarked that they also program activity at the Baltimore Museum of Art theater, a 363-seat house, for events that would benefit from greater intimacy than the Rouse can provide. She emphasized that dance programs seeking an intimate venue are not accommodated in Howard County, given the constraints on the Smith Theatre to accommodate dance. Arte Flamenco informed us of their desire to perform annual concerts in Howard County, but an Merriweather Post Pavilion Study Needs Assessment Arts Organization Discipline Arte Flamenco Dance Backstage Dance Studio Dance Ballet Royale Academy Dance Candlelight Concert Society Music/Dance/ Theatre Columbia Community Theatre Players Columbia Concert Band Music Columbia Festival Multiple Columbia Jazz Band Music Columbia Orchestra Music Columbia Pro-Cantare Music Eva Anderson Dancers Dance Howard County Ballet Dance Howard County Music Children s Chorus Hua Sha Chinese Dance Dance Center Kinetics Dance Theatre Dance Peobody Children s Music Chorus REP Stage Theatre Showtime Singers Music Suzuki Music School of Music Mayland Venus Theatre Company Theatre inability to secure dates at either the Rouse or Smith Theatre since 2001 has forced them to find accommodations in College Park and Baltimore. Annual activities of responding dance organizations detail an overall limited demand for facilities larger than the Jim Rouse Theatre. Local music organizations were the other key user segment responding to our inquiries. Concert activities for these users are primarily held in the Jim Rouse Theatre with mixed reception from users regarding the quality of the venue. Annual events of these organizations again detail limited demand for facilities beyond the capacity of the Jim Rouse Theatre. Frances Dawson of Columbia Pro Cantare has been the most outspoken regarding the lack of appropriate venues in Howard County to support presentations of classical music events. She continues to program at the Jim Rouse Theatre, among other regional venues, as it is the most appropriate local facility to support the activities of a 100-person chorus. Given the opportunity, Ms. Dawson would prefer to present the Pro Cantare in a venue with concert hall acoustics with seating capacity around 1,000. The Columbia Orchestra also presents in the Rouse Theatre. According to board member Holly Thomas, although the orchestra currently does not fill the Rouse to capacity, they are growing their audience and could see working Webb Management Services, Inc. 14 December 2004
131 Needs Assessment in a slightly larger facility that would better accommodate the needs of a symphonic orchestra. Candlelight Concert Society is a chamber music presenting organization that also presents a performing arts series for children. The children s series includes music, theatre and ballet productions. Most of its events are held in the Smith Theatre, with some of its more popular offerings and galas held in the Rouse Theatre. According to Holly Thomas, Board President, the acoustics and sightlines of the Smith Theatre benefit its classical recitals as well as its performing arts series for children. She remarked that providing increased availability to a venue like the Smith Theatre would be of great value, with a slight increase in seats preferable. Although the Columbia Music Festival does use the Pavilion to accommodate a portion of its activities, a majority of the festival occurs in the Jim Rouse Theatre, with some events held in the Jim Rouse Mini Theater and the Smith Theatre. According to Nichole Hickey, a few Festival events would be better served by single shows in a 1,200-seat venue than two events in the 750-seat Jim Rouse Theatre. It is important to note, however, that the Festival receives access to the Jim Rouse Theatre as an in-kind service. Ms. Hickey remarked that the Festival would likely supplement their use of the Rouse Theatre with programming in alternate venues of higher capacity, but would do so intermittently, as rising operating costs from increased rental fees would affect their ability to provide affordable access to diverse communities. Two key issues cited as limitations to Festival presentations are the lack of fly space and the difficulty in attracting world-class performers to a high school facility. Ms. Hickey believes there to be significant community need for an additional intimate venue like the Smith Theatre, as access to the Smith is rarely accomplishable. From her perspective, providing community access to an intimate theater as well as to additional work spaces (studios and flexible spaces) is in greater demand than larger cultural venues. It should be noted that user interviews also provided opinions on the current suitability of Merriweather Post to support cultural performances. To begin, significant changes made to the Pavilion, as it evolved from its original design to adapt to the needs of amplified events, brings into question its current suitability for un-amplified performances. Although originally designed for use by a symphonic orchestra, two significant changes were made to accommodate larger shows: the original acoustic concert shell was removed with the over-stage area redesigned to accommodate increased equipment positions; and additional semi-permanent covered seating was provided on each flank of the originally designed audience area. It is the purview of a professional acoustician to provide critical evaluation of the current acoustic quality of the Pavilion. However, it should be acknowledged that the opinion of at least one professional artist respected in the community indicates the likelihood of its diminished acoustic quality: Frances Dawson, Webb Management Services, Inc. 15 December 2004
132 Needs Assessment Artistic Director of Columbia s Pro Cantare and organizer of many cultural events produced at the Pavilion, including Pavilions in Common (which brought the Baltimore Symphony Orchestra to the Pavilion) and Columbia s 20 th birthday celebration, has expressed her belief that changes made to the Pavilion have significantly diminished the quality of the venue for classical presentations. For the 20 th birthday concert, design documents for the original acoustic shell were solicited from the Pavilion s architect, Frank Gehry, so that a facsimile could be constructed for the concert. According to Ms. Dawson, the new shell (later removed and discarded) made a tangible improvement, but not to the level achieved by the original stage design and audience configuration. Ms. Dawson informed us that given the present configuration of Merriweather Post, Columbia Pro Cantare had no immediate desire to perform in that facility. Ms. Hickey also cited the difficulties she has experienced as a local arts presenter with budget limitations in bringing larger cultural activities to the Pavilion. In addition to limitations in the size, shape and technical capacity of the stage house, she noted that the cost to the Festival to open the facility, even without a rental fee, put significant stress on her budget. Regarding cultural organizations from other regions, competing facilities in established regional markets limit demand potential for Howard County facilities. In addition to there being no gap in the facility inventory, there is also no evidence of a cultural organization of significance seeking a change in residency status, apart from the Baltimore Symphony Orchestra and their impending move to the Music Center at Strathmore. Competing venues also specifically impact the amount of cultural activities available to the Pavilion. In addition to its physical limitations in accommodating large-scale cultural activities, like symphonies and ballets, competing venues with established reputations for cultural programming significantly limit the Pavilion s ability to attract cultural activities. This assessment is consistent with the findings of the Options for the Future, a report prepared for Howard County in 1978 to evaluate program and management options for the Pavilion at the end of Nederlander s first tenyear lease. In addition to discussing the physical limitations of the facility, the report states that, It is extremely unlikely that a major national company the Joffrey Ballet, for example would play the Kennedy Center or Wolf Trap and the Merriweather Post Pavilion in the same season. Because those two facilities have a decided edge in reputation, in aesthetic appeal, and in developed audience, it would be very difficult and very expensive to outbid them, and attract companies of national and international stature to the Merriweather Post Pavilion instead. Webb Management Services, Inc. 16 December 2004
133 Needs Assessment User Demand for Facilities: Conclusions Interviews and surveys of local arts organizations confirm that there is local demand unmet by Howard County arts facilities. The need expressed with the greatest resonance is for access to a facility similar to the Smith Theatre, an intimate venue with good sightlines and good acoustics. Demand exists for this type of facility to accommodate un-amplified events, like chamber music, as well as dance presentations. There is also a desire within the community for a venue appropriately designed for choral and symphonic presentations. Local organizations sponsoring activities in varying disciplines, especially those in music and dance, have expressed some desire for a capacity increase from what is available to them in the Rouse Theatre. However, annual demand for capacity in excess of 750-seats is relatively low. Local arts organizations have also expressed a moderate need for rehearsal and flexible event/exhibition spaces. In terms of Merriweather Post, interviewees suggested that efforts to physically accommodate cultural users, especially in term of acoustics, would be necessary for the facility to successfully attract cultural programming. In regard to cumulative demand from cultural organizations from outside of Howard County, it is timely to reiterate a comment made by Michael Spears of the Rouse Company in 1987, as quoted in HCAC s Arts Vision 2001, In my view it would be wasteful (and probably infeasible) to attempt to elevate the quality of Columbia, or what distinguishes it as a small city, by working to establish a great symphony, theater, or museum. In my opinion, we are too small a city to embrace such aspirations, and, moreover, these facilities are available in abundance and of very high quality in Baltimore and Washington. Although much has changed in the size and stature of the Howard County community in the last 17 years, proximity to Baltimore and Washington, and the attractiveness of their treasure troves of performing arts facilities to cultural arts organizations, has not. Regional Arts Audiences The following is an examination of the market for arts audiences in the City of Columbia and Howard County, using state and national statistics for comparison. Specifically, we want to know total population, projected growth, the demographics of the population now and demographic trends for the future. All statistics are drawn from the U.S. decennial census, unless otherwise noted. The Howard County population is growing. In 2000, Howard County had a total population 250,760; an increase of 32% from in The Webb Management Services, Inc. 17 December 2004
134 Needs Assessment population is projected to increase another 27.6% to 320,000 in 2030; the majority of that projected growth will occur before Performing Arts in a New Era, a study by the RAND Corporation based on the NEA Survey of Public Participation in the Arts and other data, found that arts audiences are growing in number due almost exclusively to increasing population (rather than more types of people attending). Applying that finding, arts audience numbers in Howard County are likely to increase by similar percentages as the population growth if the general make-up of the population remains similar to what it is today. Howard County and the City of Columbia are diverse areas. Howard County is 74.3% White and 14.4% Black, close to the national averages of 75% and 12.3%. Columbia, on the other hand, has a population of 66.5% White and 21.5% Black, more closely resembling the State of Maryland: 64% White and 27.9% Black. Those of Asian descent make up a greater percentage of the population than the national (3.6%) and state (4%) averages with 7.7% in Howard County and 7.3% in Columbia. Both Howard County and the City of Columbia, however, have a much lower percentage of Hispanics (3% and 4.1%) than the national average of 12.5%. Although it has been found that race does not necessarily affect propensity to attend arts events, it does affect what kind of programming one might attend. For example, Hispanics are more likely to attend family programming, and African-Americans are more likely to attend culturally significant programming, such as traditional dance. The median age in the areas studied USA, Maryland, Howard County, and Columbia all vary less than one year: 35.3, 35.5, 35.5, and 36.0, respectively. What differences there are lie in the percentage of the population in various age categories, as shown in the chart below. Both Howard County and Columbia have a higher percentage of family aged populations than national and state averages: those 14 years old and younger, and those between the ages of 25 and 54 years (parenting years). Both Howard County and Columbia also have significantly lower percentages than national and state averages of those aged 60 and higher. Arts participation increases significantly for those over the age of 65, and the median age of art attendees for every genre of performing arts is growing; however, the baby boomer population is aging, accounting for some of that shift. In Howard County, programming should be targeted to the base of younger and family audiences. Webb Management Services, Inc. 18 December 2004
135 Needs Assessment 85 years and over 75 to 84 years % Age 65 to 74 years 60 to 64 years 55 to 59 years 45 to 54 years 35 to 44 years 25 to 34 years 20 to 24 years USA MD Howard Columbia 15 to 19 years 10 to 14 years 5 to 9 years Under 5 years Of those 25 and older, Howard County and Columbia residents have very high levels of educational attainment. In Howard County, 52.6% have attained a Bachelor s degree and 23.4% have a graduate degree; in Columbia, those numbers raise to 59% and 28.7%, respectively. These figures compare very favorably to national (24.4% Bachelor s, 8.9% graduate) and state (31.40% Bachelor s, 13.4% graduate), figures. Education is the best predictor of arts attendance; so much so that all other categories age, sex, race, income are statistically insignificant when education is factored into the equation. The Howard County statistics, therefore, bode very well for arts participation. Median Household Incomes in the study areas follows the levels of educational attainment: Columbia, $71,524; Howard County, $74,167; Maryland, $52,868; and USA, $41,994. The following chart breaks down income distribution. Note the similarities between Howard County and Columbia in every category. Also note the differences between Howard County/Columbia and the state/national percentages in all categories lower than $50,000. Webb Management Services, Inc. 19 December 2004
136 Needs Assessment 25 Income Distribution % Less than $10,000 $10,000 to $14,999 $15,000 to $24,999 $25,000 to $34,999 $35,000 to $49,999 $50,000 to $74,999 $75,000 to $99,999 $100,000 to $149,999 USA MD Howard Columbia $150,000 to $199,999 $200,000 or more The other audience component to consider is the tourist market. Washington D.C. and Baltimore are both short drives, and both are significant tourist destinations. In comparison to other large U.S. cities, as shown below, the Washington metropolitan statistical area has the highest income, the highest levels of educational attainment and the greatest per capita expenditures on entertainment. There is the potential to attract visitors from these areas, but there is significant competition for arts & entertainment dollars in both cities. Metropolitan Statistical Area Population in 2000 Population in 2003 Projected Population by 2008 Number of Households Median Household Income 2003 Data % of Housholds Population with $75, Income Population 25 + with College Degree Median Value of Owner Occupied Households Per Capita Annual Household Expenditures on Entertainment Admission Fees Washington, DC-MD-VA-W 4,923,153 5,070,677 5,437,676 1,907,117 $ 72,781 48% 453,441 1,421,214 28% $ 216,423 $ Baltimore, MD 2,552,994 2,599,458 2,710, ,096 $ 55,897 33% 308, ,272 20% $ 143,314 $ Combined Total/Average 7,476,147 7,670,135 8,148,344 2,904,213 $ 64,339 41% 762,128 1,938,486 25% $ 179,869 $ Comparative Markets Philadelphia, PA-NJ 5,100,931 5,109,291 5,142,117 1,925,730 $ 55,192 34% 685, ,481 19% $ 140,576 $ Boston et al, MA-NH 6,057,826 6,119,968 6,282,248 2,347,382 $ 63,784 41% 769,162 1,448,298 24% $ 233,706 $ Chicago, IL 8,272,768 8,372,880 8,659,395 3,006,188 $ 63,096 40% 887,401 1,631,228 19% $ 172,333 $ New York, NY 9,314,235 9,381,503 9,593,568 3,500,261 $ 52,380 34% 1,110,324 1,793,195 19% $ 275,411 $ Los Angeles et al, CA 9,519,338 9,774,284 10,346,884 3,207,177 $ 50,203 31% 944,943 1,772,361 18% $ 255,377 $ Average 7,653,020 7,751,585 8,004,842 2,797,348 $ 56,931 36% 879,408 1,525,913 20% $215,481 $ Regional Arts Audiences: Conclusion The market for the arts is strong in Howard County. First and foremost, educational attainment is very high, the best predictor of arts attendance. The other socio-economic characteristics of the Howard County population indicate that family and cultural programming, in particular, may be an area of under-realized attendance. And, finally, the rapidly growing population means a larger market from which to draw. Webb Management Services, Inc. 20 December 2004
137 The Potential Impacts and Benefits of New Facilities Merriweather Post Pavilion Study Needs Assessment Arts Vision 2001 constituted a ten-year action plan for arts and culture in Howard County. Organized by the HCAC, the plan reflected the visions and concerns of local artists, arts organizations, educators, and community leaders. These issues were distilled into a program to respond to community needs with implementation strategies geared for their accomplishment. Several of these proposals have been carried successfully to fruition. Most notably was the creative partnership that led to the adaptive renovation of the Jim Rouse Theatre to service both the needs of the community and those of the Department of Education. Another was the continued renovation of the HCCA to provide a location for development and presentation of the arts in support of the Howard County arts community. In 2003, the HCAC collaborated with Vision Howard County on the development of Arts Vision: State of the Arts in Howard County This document built upon Arts Vision 2001 to assess the current state of the arts in Howard County and to provide a resource and planning guide for arts organizations, educators, funders and policy makers. The 2003 document was designed to parallel the original action plan, but was provided as an assessment of the current conditions and trends facing the arts and not as an action plan like Arts Vision The 2003 report was offered as a tool for individuals and organizations to identify goals and strategies relevant to their own missions and development. Given the breadth of the community s initial vision, there are several key goals and action steps of the original plan that remain relevant today. New facilities could play a distinctive and successful role in the realization of these objectives. This notion is supported by the fact that a majority of the survey respondents in the 2003 report believed that little or no progress has been made with regard to availability and affordability of rehearsal, work, and performance spaces even with the development of new spaces. Key Goals: 1. Strengthen arts organizations, thus enabling them to take artistic risks in serving a changing community 2. Enable artists to work at their profession 3. Create appropriate spaces for the arts Four of the action steps to achieve these goals were to: 1. Encourage artistic risks and assist both mature and emerging artists to develop professionally 2. Present the arts in appropriate spaces 3. Provide a variety of both work and performance spaces for artists 4. Community access to art spaces must be ensured As discussed previously in regards to community facilities, there are evident gaps in the facility inventory that impact the attainment of these goals. First, scheduling issues limiting availability of the smaller venues impacts Webb Management Services, Inc. 21 December 2004
138 Needs Assessment their accessibility to local arts organizations, which diminishes their ability to serve the local community. Second, existing facility types within the inventory do not appropriately serve certain artistic mediums, namely dance and classical presentation. Use of inappropriate facilities impacts the quality of presentations, and hinders the professional development of artists and arts organizations. Developing new (or significantly renovated) facilities would be the key to addressing these goals. Key Goal: Attract more people to come to the arts An action step of particular significance mentioned in the report was to recognize the importance of space to audience development. This is an important concept, as it imbues the performance venue with an important role in audience development initiatives. This is a key issue of discussion in many communities where development of new facilities intends to serve broader goals than that of providing a home for the arts. This issue responds to our earlier comment regarding the importance of providing a broader experience to attract arts attendees. Development of new facilities provides an opportunity to address this key issue. Key Goal: Forge productive relationships between arts institution in Howard County and arts, educational and civic institutions in the Baltimore- Washington corridor, in order to strengthen the arts in the region. A key strategic element to achieve this goal was to develop participation and performance possibilities. Activities in keeping with this goal included Pavilions in Common, established by Frances Dawson, which succeeded in bringing the Baltimore Symphony Orchestra to Merriweather Post for four summers. A desire to reintroduce such partnerships, including those within other artistic disciplines, like dance, could be served by new facilities capable of accommodating their needs. Needs Assessment: Conclusions HCAC s determination in the late 1980 s to proceed with a needs assessment and plan to secure a future for arts and culture in Howard County was a prudent decision. Desiring to strengthen the role of the arts in the community, HCAC looked for ways to provide developing organizations with cost effective access to appropriate venues to benefit both the user and audience. HCAC established creative partnerships to expand upon the service model in play with the Smith Theatre: both the Rouse Theatre and HCCA are facilities seeking to maximize facility usage by coupling weekday educational activities with weekend cultural usage. The model has worked fairly well for each of the facilities, providing economies of scale to keep rates relatively low, which allows HCAC and foundation support to have an even greater impact with minimal funding available to subsidize facility access. With the Rouse Theatre and Smith Theatre serving as the primary, professional performance spaces available to arts organizations of all disciplines in Howard County, there are facility gaps in service to particular performance disciplines, specifically dance and symphonic/choral music. Webb Management Services, Inc. 22 December 2004
139 Needs Assessment Although supported in the past by shared-access with educational institutions, scheduling demands of local arts organizations are exceeding what is made available to them. Scheduling limitations are causing organizations to seek performance accommodations outside of Howard County. Local arts organizations have also expressed a moderate need for rehearsal and flexible event/exhibition spaces. It is important to note that although the new Howard Community College black box will provide an additional performance resource, the facility is not of the type that will fill the gap in service to the disciplines discussed above. In addition, the added capacity it will provide as a shared resource, like the Smith Theatre, is unlikely to address scheduling needs in the near future as the characteristics and growth projections for Howard County suggest a propensity for incremental increases in arts participation, both in doing and attending. The decreasing availability of the Smith Theatre to local arts organizations and the expansion of Howard Community College arts facilities in the relatively short life span of the institution are prime examples of such an increase. In terms of Merriweather Post Pavilion, physical accommodation of cultural users, especially in term of acoustics, would be necessary for the facility to accommodate cultural programming. As to importing cultural activity, given its proximity to Baltimore and Washington and the inventory of established, respected venues currently serving regional cultural organizations, there is limited demand potential for these organizations to seek performance opportunities in Howard County. In adding capacity to the existing and planned inventory of arts facilities, Howard County would have the opportunity to: Provide venues that would address current facility deficiencies; Support the artistic and organizational growth of its arts organizations; and Better serve the needs of an expanding community and the goals established by Arts Vision 2001 & Recommendations New arts facilities that would further the artistic and community goals of Howard County are: 400 to 600-seat Performance Hall o Design Goal: Provide an intimate facility with recital hall quality acoustics to support soloists and small music ensembles, with appropriate sightlines and moderate flexibility to support Webb Management Services, Inc. 23 December 2004
140 Needs Assessment small to mid-sized dance presentations and technically-limited theatrical productions. Rehearsal Facilities o Design Goal: Provide additional, community-accessible practice facilities to support the continued development of local arts organizations. 1,000 to 1,200-seat Performance Hall o Design Goal: Provide concert hall environment to support symphonic presentations, with variable acoustics systems and moderate technical flexibility to support full dance company productions and entertainment presentations. Development of the larger facility is least pressing, as there is limited annual demand from local arts organizations for a facility larger than the Jim Rouse Theatre. The impetus for developing a theater of this size would be to: Provide an appropriate facility to support the development and presentation of choral and symphonic arts in Howard County; Accommodate the needs of a growing local audience base; and Provide a local venue with the capacity to support developing partnerships with regional arts organizations. Development of one or more community arts centers to support these facilities should be considered, as they can play an important role in ensuring continued community access to quality performance venues. Although Howard County has taken the initiative to lead this project, for which they should be commended, they need not shoulder the entire burden of acquiring, developing, improving and sustaining facilities: There is at least one operator (IMP) interested in ownership and possible improvements to the Pavilion; and The private sector may support the development and operation of facilities that are seen to serve a community interest. A possibility for one or more of the new performance and practice venues would be to develop new facilities with the Columbia Association on the property adjacent to Merriweather Post as: Webb Management Services, Inc. 24 December 2004
141 Needs Assessment Proximity to Merriweather Post suggests an opportunity for joint programming and promotion which could enhance Columbia as a cultural destination. An additional solution could be to develop the smaller auditorium and practice facilities in connection with new library projects. Howard County Library master plan calls for replacements and new facilities, including auditoria and multi-purpose rooms. They make good partners and are good at operating facilities for community benefit. They are dispersed within the County and enjoy a high participation rate, which would support audience development for local arts organizations. Merriweather Post Pavilion Recommendation Turning Merriweather Post into a cultural facility enclosed or otherwise is not recommended. There is no evidence of demand for a large (2,000+ seats) year-round cultural arts venue in Howard County. Investigating architectural acoustic solutions (like a temporary acoustic shell or panel system) to marginally improve the facility for cultural events is recommended. o This flexibility would support efforts to forge new relationships with regional cultural institutions in furtherance of expressed community goals. Phase I Conclusions 1. Merriweather Post is viable as a large entertainment facility. 2. Successful operation of the Pavilion depends on an active program that includes occasional blockbusters. 3. Physical improvements must be addressed. 4. Sufficient parking is a critical issue. 5. The option of creating a large indoor facility is not feasible. 6. There are separate needs for new cultural facilities, best approached as a separate project. Webb Management Services, Inc. 25 December 2004
142 Needs Assessment Next Steps Business Planning including a plan and process for acquisition, financing, improvement, operation and economic impacts of Merriweather Post and/or additional new facilities. Physical Planning advance program and design work for a series of scenarios in parallel with business planning, including look at Merriweather Post improvements for cultural programming. Webb Management Services, Inc. 26 December 2004
143
144 Merriweather Post Business Planning Merriweather Post business plan In the first phase of our work, we established that the Merriweather Post Pavilion is a successful operation that has been a positive force in the development of Howard County. We went on to suggest that the potential exists for Merriweather Post to continue as a strong contributor to the life of the county, subject to the need for physical improvements at the Pavilion and the particular challenge of solving the need for event parking. In this round of work, we will develop a preliminary business plan for the continued success of the Pavilion, and will propose a process by which a longterm operator is put in place. To inform this work, we have continued to work with Merriweather Post staff, and are grateful for their continued provision of information on the historical operation of the Pavilion. We have also continued our research on comparable arts and entertainment facilities on how they are operated and sustained. Comparable Projects - Operations In our first phase of work, we identified a series of large indoor and outdoor arts and entertainment facilities and assessed their programming and operations. Now, we come back to these same comparables to inform our business planning, considering how they are operated, how operating relationships are maintained and how the owner and operator sustain the enterprise. Here are brief summaries of key points from the most interesting of these other projects: The Hollywood Bowl: Among the most famous and successful of amphitheaters in the country, the Hollywood Bowl is owned by the Los Angeles County Department of Parks and Recreation, and is operated by the Los Angeles Philharmonic Association, a 501c3 on the basis of a long-term (25 years to go). The basis of the Bowl is that it has been the summer home of the Los Angeles Philharmonic since it opened in It s very hard to get a good handle on the cost of operating the Bowl, as staff and other resources are wrapped up in the Philharmonic budget. But we do know that they have a great long-term deal from the County and that corporate donations and sponsorships are key. Universal Amphitheater: this is one of the three operations we profiled in detail in the first part of our study. It is an interesting project because of it s success as an entertainment venue, with the operator House of Blues able to succeed in this very competitive market against such other players as Clear Channel even with a maximum capacity of only 6,200 seats. Part of that Webb Management Services, Inc. 1 February 2005
145 Merriweather Post Business Planning success must come from the way that rental activity is pursued, with a sales staff aggressively marketing every area of the Amphitheater for private and corporate events. It is also interesting that in their booking arrangement for the Greek Theater, House of Blues and Nederlander are paying rent to Los Angeles County based on the greater of $1.2 million or 8% of gross receipts and 6% ancillaries. The Tweeter Center at the Waterfront, Camden, NJ: Another of our case studies, the Tweeter Center in Camden is most interesting because of the operating deal that has Clear Channel and the South Jersey Performing Arts Center (SJPAC) as joint lessees from the New Jersey Economic Development Authority. Here, Clear Channel books and runs the space in its outdoor configuration in the summer while SJPAC books and manages the space in its winter indoor form. By all accounts, the summer outdoor facility is a success (it is the second highest grossing amphitheater from Clear Channel), justifying the private sector investment into its construction. At the same time, the winter indoor facility has not been working well, requiring significant annual funding to the extent that this is probably not a sustainable arrangement. This operating arrangement did arise from a competitive bid process. The Cynthia Woods Mitchell Pavilion: Our final case study is very informative, as this is a non-profit organization that owns and operates the Pavilion with a mix of cultural and commercial programming and significant annual fundraising. Despite the fact that this is the only large outdoor facility in Houston, it still requires more than $1 million a year in annual fundraising to sustain operations with this mix of programming. It is also interesting that occasional blockbusters are very important financial contributors, despite the parking challenges they create. Red Rocks Amphitheater: Red Rocks is a success first and foremost because it is a spectacular natural in an amazing location. It is owned by the City and County of Denver and operated by their Division of Theatres and Arenas, but the key is a booking arrangement with Clear Channel that guarantees a certain level of programming. There are a couple of cultural events each season for the local opera and symphony. The PNC Bank Arts Center: This New Jersey venue is owned by the State but operated by a Clear Channel subsidiary. Despite the name, the venue is dominated by commercially-oriented entertainment. Here also, corporate sponsorships are a critical source of income. The Kodak Theatre: This large indoor facility was developed by the private sector (Trizec-Hahn) but is operated by Anschutz Entertainment, winner of a competitive bid process prior to the signing of Kodak as principal sponsor. Those sponsorship proceed were used to pay down a portion of the $94 million project cost in 2001, funded entirely by the private sector. Webb Management Services, Inc. 2 February 2005
146 Merriweather Post Business Planning Conclusions: 1. Given the market opportunity for large-capacity entertainment events and the occasional cultural rental, a commercial operator still makes the most sense for Merriweather Post. And only a long-term arrangement would allow such an operator to take full advantage of the facility as a partner in its improvement and community service. 2. There is more than one kind of operating deal. The term of the deal may by flexible, as may the terms of payment. In some cases, a government owner may choose to share some risk in the operation. 3. The best deal for the owner probably depends on having a competitive bid process, motivating potential operators to put their best deal forward. 4. Successful operators have product and knowledge of the local market. These then are key criteria in the selection of an operator. 5. Funding for the acquisition and improvement of facilities comes from many sources in the private and public sector. 6. Sponsorship revenues are critical for the development, improvement and operation of these facilities. A Long-term Operator for Merriweather Post Along with the need for physical improvements, the greatest need at Merriweather Post is to put a long-term operator in place. Stability in operations is needed not just at the staff level but at the management level. Such arrangements will allow an operator to maintain strong relations with artists, sponsors, concessionaires, other service providers and local government. And a long term operator is much more likely to invest and take risks in programming an operations facing a longer horizon in which those investments can pay off. In the first round of our study, we suggested the IMP is doing a very good job as operator of Merriweather Post. They would like to have a long term lease to be the operator. And they are certainly the firm with the clearest and best chance of succeeding as operator of the Pavilion. But, given that the search for operator would start with Howard County government and that any potential operator should be motivated to put their best deal forward, we would recommend a competitive bid process to select a long-term operator. There are a number of advantages to such an approach, including: It is a familiar process for the County, in which many can be involved. Webb Management Services, Inc. 3 February 2005
147 Merriweather Post Business Planning It is an open process, allowing for all to understand the dynamics and challenges of operating the Pavilion. The very act of writing the Request for Proposals will be a positive step for the County and private sector leadership as a means to build consensus on project goals and objectives. The key to the process is that it can be set up in such a way as to invite creativity and innovation on the part of potential operators. The County need not define the operating deal within the RFP, but rather let potential operators design a structure and terms that meet the County s broader goals. This last point is very important, in that there are number of ways that a potential operator might approach the opportunity, and a number of variables to consider. Need the County be the owner of the Pavilion, or could the operator be a real or virtual owner? How should Pavilion operations support the issue of debt to finance improvements? How should the operator be motivated to increase the level of activity at Merriweather Post? The answers to these questions are best left to those invited to bid, given a set of parameters established by the County through the writing of the RFP. Pro-forma Operating Budget A key element of the business plan is projecting how Merriweather Post will perform in the future on a financial basis. This we do in order to assess the impact of a series of physical improvements recommended in our first round of work. In addition, future performance of the Pavilion helps us consider how some combination of the acquisition, addition of parking and improvement of parking might be financed with cash flows from operations. Methodology To develop financial forecasts for Merriweather Post, we have started with actual results from 2004 as presented by IMP, the current operator of the Pavilion. The IMP staff has been very helpful in helping us understand how those results were achieved, but they have not contributed to the development of forecasts for 2005 or beyond. Such a step would be perilous for them and the County, as they would not wish to be associated with projections perceived to be so optimistic as to scare away other potential operators or so pessimistic as to unfairly portray the operating potential of the venue. Thus, these projections have been developed exclusively by Webb Management Services based on our extrapolation of 2004 results, our sense of the operating potential of the venue and a series of operating impacts directly related to the physical improvement of the Pavilion. To understand the 2004 operating results and use them for future forecasts, we have developed a financial model that predicts how certain inputs (number of shows, attendance, etc) drive revenues and expenses. We tested these assumptions with IMP staff, saying, for example: Is it reasonable for Webb Management Services, Inc. 4 February 2005
148 Merriweather Post Business Planning us to assume that the average capacity sold was 95% for covered seating and 55% for lawn seating for blockbuster events. Then we took the actual 2004 results to back-into the model, comparing the actual result for each line item with the calculated result and noting any difference. This budget should be considered as a live model, one that can be adjusted based on changing circumstances and assumptions. It is fundamentally a tool to help the County anticipate the impact of improved facilities and to consider financing options. Format The budget shows actual results for calendar 2004 and then projects revenues and expenses through calendar The pro-forma budget, attached as Appendix A, is presented on five pages: 1. A summary page showing revenues, expenses and the result of operations from 2004 through A forecast of all activity at the Pavilion and the resulting sources of income. 3. A summary of staffing and projections of expenses through A schedule for the project that shows the chronology of capital improvements through a series of off-season rounds of work, the impact on the Pavilion for the following season and the resulting impacts on the operation of the Pavilion. 5. An estimate of the cost of physical improvements from the offseason through the off-season. Physical Improvements Ziger Snead has taken the list of physical improvements recommended in Phase One of the Study and developed a more integrated construction plan, grouping and ordering the tasks and scheduling them over a series of off-season periods. Following is a summary of key assumptions driving those choices: Only limited improvements are possible before the end of the 2006 season because of the time in the schedule required to design, fund and gain authorization for the renovation plan. The work is broken down into a series of projects that can be efficiently managed during each off-season, beginning on October 1 and ending April 30. Webb Management Services, Inc. 5 February 2005
149 Merriweather Post Business Planning The basic order of improvements is that they begin with the heavy construction at the core of the Pavilion and work outward. Though this sequencing does not align closely with the priorities listed in the Condition Report, it would likely offer optimal efficiency from a constructability standpoint. It was noted, too, that none of the priorities seemed to involve dire consequences if postponed for a limited time. Timing on the project will be critical in a number of areas. An RFP for architects must be issued well up in the schedule in order to provide an adequate period prior to the Phase One construction season for architect selection/negotiation, design, county review, bidding, construction manager selection/negotiation, mobilization, and ordering of long lead items (ex. long span trusses). Scheduling construction work during the winter months involves assumptions on the weather, and care has been taken not to be overly optimistic on the scope achievable each year. Nevertheless, there is limited time for a builder s unforeseen delays within the seven month window. A single construction management contract for the entire project is highly recommended. A major additional component of construction, increasing the stagehouse roof elevation and adding an operable lighting support grid, has been included in the project agenda. This change to the scope was made at the recommendation of the current operator based on their estimate of significantly enhanced revenues associated with this enhancement. The project budget now includes these estimated construction costs, and the work has been incorporated into the construction schedule. Ziger/Snead cautions that actual costs would depend on the outcome of full engineering. But based on a limited review of concept sketches and photographs by a structural consultant, Ziger/Snead judges that the scope of the work might be kept more limited. This would involve removing the stagehouse portion of the existing roof, installing auxiliary columns and footings and constructing a new, higher stagehouse roof with perimeter enclosure. The $1,725,000 estimate is based upon this limited scope and does include costs for an operable grid. Impacts on the Operating Budget We have chosen to keep the financial model as simple as possible, with a minimal number of variables changing over the years. This serves to highlight the significant impact of physical improvements on the operating budget, but also reflects an inherently conservative approach to the project. Following is a summary of all changes in the operating budget: Webb Management Services, Inc. 6 February 2005
150 Merriweather Post Business Planning All revenues and expenses are projected to increase 3% per annum through 2013 to reflect the impacts of inflation. The first unique change for the 2005 season is that we project sponsorship sales going from 10 to 12, simply a function of Pavilion management having more time this coming year to recruit and sign sponsors. The second change is that capital improvements undertaken by the Operator are reduced by half and then escalated by 3% in each successive year. There are no unique changes to the budget in For the 2007 season, there are several changes to the operating budget: 1. Improvement to seating (box seats, ADA seating, new seats with cup holders) and improved house aesthetics allows for a 2% increase in average ticket prices and a 2% increase in concessions income. 2. Reduced Loge tent, seating, and concrete maintenance costs reduce maintenance costs by 5% and seasonal staff costs by 5%. From this year forward there is also no cost of putting up and taking down the tent with a new permanent roof in these areas. 3. Facility insurance increases with building value, adjusted on a cost basis. For the 2008 season, there are several changes to the operating budget: 1. Stage-house work allows management to attract two additional blockbusters and two additional concerts for this and successive seasons. Sponsorships also increase by two for successive years. 2. One full-time staff person and part-time staff representing one additional full-time equivalent are added with this new activity. 3. Facility insurance increases with building value, adjusted on a cost basis. 4. The facility booking fee to the programmer is increased by 20%. For the 2009 season, there are several changes to the operating budget: 1. Improved concessions capacity and efficiency increases concessions income by 15% 2. Reduced site, concessions and restroom maintenance costs reduce maintenance and seasonal staff costs by 5%. 3. Facility insurance increases with building value, adjusted on a cost basis. For the 2010 season, there are several changes to the operating budget: Webb Management Services, Inc. 7 February 2005

151 Merriweather Post Business Planning 1. Improved concessions capacity and efficiency increases concessions income by 15% 2. Improved ticketing operations increase ticket sales by 1% for this and successive years. 3. Reduced site, concessions and restroom maintenance costs reduce maintenance and seasonal staff costs by 5%. 4. Facility insurance increases with building value, adjusted on a cost basis. For the 2011 season, there are two sets changes to the operating budget: 1. Reduced site, concessions and restroom maintenance costs reduce maintenance and seasonal staff costs by 5%. 2. Facility insurance increases with building value, adjusted on a cost basis. All in all, specific changes to the model are limited. But with these changes, and because of the relationship between activity, revenues and expenses, there are significant increases in the bottom line performance of the Pavilion over the 10-year period. The other critical fact of this pro-forma is that it extrapolates the performance of the current Pavilion management team into the future, paying rent to a separate owner and earning whatever profits are generated. Thus, we must consider what role these increasing profits play in the financing of improvements, and what kind of operating arrangement best motivates owner and operator towards their respective goals. Comparable Projects: Financing Before considering how improvements might be funded, let s consider funding and financing solutions at a series of other facilities. Hollywood Bowl, Los Angeles, California The County of Los Angeles Department of Parks and Recreation owns the Hollywood Bowl. The Los Angeles Philharmonic Association, in partnership with the County, is responsible for the operation and programming content of the venue during the summer concert season. In October 2003, the Hollywood Bowl began work to reconstruct its old shell structure. Webb Management Services, Inc. 8 February 2005

152 Merriweather Post Business Planning The new shell plan was designed to bring the venue up to current standards, improving shell acoustics and artist facilities while preserving the historic look that had become synonymous with the Hollywood Bowl. Specifically, the shell project would: preserve the recognizable, 1920s Modern concentric ring look of the existing shell; dramatically improve the shell's acoustics; create 30% more stage space to accommodate a full orchestra inside the shell; and allow lighting and sound technology to be integrated into the design, restoring the shell's clean, uncluttered look. In 1996, Los Angeles County voters earmarked $18 million for improvements at the Hollywood Bowl when the Proposition A measure was passed. County voters approved by a 65%-35% margin the proposal to establish a $319 million park-and-open-space property assessment to fund the acquisition and preservation of endangered wilderness lands, and to rehabilitate and improve dozens of park and recreational facilities throughout Los Angeles County. Dubbed Baby A, the measure was modeled on an earlier successful 1992 Proposition A parks measure that generated $540 million in funding for park improvements and open-space preservation. The $18 million in bond revenues was granted to the Department of Parks and Recreation for the development, improvement, restoration and rehabilitation of the Hollywood Bowl, including rehabilitation of facilities and aging infrastructure, improvement of public access and facilities and improvement of access for persons with disabilities, in accordance with the approved Hollywood Bowl Master Plan, and/or for grants to qualified Nonprofit Organizations for these purposes. Journal Pavilion, Albuquerque, New Mexico The final cost of building the 12,000-seat Mesa del Sol facility south of Albuquerque was $6.4 million, $2.35 million more than originally budgeted. The contract between SFX Entertainment Inc. and Bernalillo County called for the county to pay half the construction costs of the pavilion, originally budgeted at a little more than $4 million. The county's portion was just under $2.03 million, which according to Stella Lujan, the county's director of accounting it had paid by Due to the overage, the county was still responsible for paying an additional $1.2 million. Webb Management Services, Inc. 9 February 2005

153 Merriweather Post Business Planning Mesa del Sol opened in 2000 with a 24-show schedule that sold 180,000 tickets. The county's share is 6% of ticket sales and 10% of concession sales. The county had expected to use the income from the facility to pay off revenue bonds it issued to help build it and had also planned to use the money to make annual rent payments of $20,000 to the state Land Office, which owns the seven acres on which the facility is located. SFX withheld payments because the final cost of building the facility was more than originally budgeted. In January 2001, Journal Publishing Co. agreed to pay SFX more than $3 million over nine years for naming rights to Albuquerque's new amphitheater. The county is to receive 20% of net revenue. Most of it was to help repay a $1.8 million sales-tax revenue bond debt that financed construction of the amphitheater. According to a letter from Laura Clemmer, amphitheater executive director, naming rights would cost $300,000 the first year, with a 3 percent increase annually. In the ninth year, the cost would be $380,031. According to the SFX contract with the county, the first $50,000 in naming rights revenue goes to a nonprofit cultural activities board to be formed by the county for promoting and encouraging community-based cultural activities. Red Rocks Amphitheater, Denver, Colorado Fund-raising for the renovation of Red Rocks Amphitheater began in 1997, and ground was broken in fall Along with the new visitor center, major renovation was done to the amphitheater itself, including much-needed new restrooms. The total project, including the visitor center and restoration work on the original facility, cost $27.3 million. It includes the Ship Rock Grille, which serves upscale Mexican-influenced cuisine; the Rock Room, where private parties can be held; the Lower Terrace, a place for a summer evening cocktail party with terrific views; an upper terrace, which overlooks the amphitheater and stage; the 6450 Theater, which shows a new documentary film on Red Rocks; and the Red Rocks Hall of Fame. Webb Management Services, Inc. 10 February 2005
154 Merriweather Post Business Planning It was initially believed that city funds would cover half the cost of the project and income generated by the Division of Theatres and Arenas would cover the annual debt payment for the capital improvement costs. However, in 2001 rival rock promoters reached an accord on a deal that would raise $7.35 million to fund the renovation. Clear Channel Entertainment, along with partner Kroenke Sports, and House of Blues, with partner Nobody in Particular Presents, will each pay the city $525,000 annually in return for 10 priority dates for their bands. Red Rocks will still be owned by the city of Denver and will stay available to all concerts or groups who want to book it, said Fabby Hillyard, Denver's director of theaters and arenas. Denver will use the money to pay on the bonds to finance the renovation. Our intent from day one was to help the crown jewel of Denver which we think is Red Rocks to continue to thrive and grow and create a great environment for some wonderful shows, Chuck Morris, a CCE vice president said. CCE teamed up with Kroenke, the owner of the Pepsi Center, on the City Lights Pavilion, a 5,500-seat venue on the Pepsi Center grounds. The companies proposed the Red Rocks deal to calm Hillyard's worries that City Lights would be too competitive with Red Rocks. Tweeter Center at the Waterfront, Camden, New Jersey Opened in June 1995, the Tweeter Center at the Waterfront is owned by the New Jersey Economic Development Authority (NJEDA). The NJEDA is an independent, self-supporting state entity dedicated to building vibrant, diverse communities by financing businesses and nonprofits, offering real estate development and technical services, supporting entrepreneurial development, and financing quality public schools. The NJEDA raised $25 million from various public sources to acquire the property and to make the necessary site improvements. The private partners, Blockbuster, PACE Entertainment and Sony, under the auspices of Pavilion Partners, invested $31 million to build the facility. NJEDA now gross leases the property to Clear Channel Entertainment (replacing Blockbuster, PACE Entertainment and Sony) and to the South Jersey Performing Arts Corporation (SJPAC), a 501 (c) (3) nonprofit. Cooper s Ferry Development Association is a nonprofit development corporation created by the city of Camden and corporate funders to convert the Camden waterfront, an Webb Management Services, Inc. 11 February 2005

155 Merriweather Post Business Planning economically depressed area, to viable use. The Tweeter Center was one component of the Camden Waterfront Master Plan. The Tweeter Center is the second highest grossing amphitheater for CCE in the United States; the first is the Tweeter Center in Boston. There is no property tax on it; in lieu of this there is a pilot payment that is required. This pilot payment was abated for the first 10 years to compensate for the additional costs incurred to allow the facility to be enclosed. Ticket surcharges levied on patrons help CCE and SJPAC to assist in the retirement of debt for the project and compensate the city of Camden. Over the next 30 years, CCE is required to pay the city of Camden $0.50 per ticket with this amount scaling up to $2.50 per ticket according to a schedule set forth in the gross lease agreement. The Tweeter Center will generate $23.2 million in payments to the city over a 30-year period. Cynthia Woods Mitchell Pavilion, The Woodlands, Texas In the 1980s, Mr. and Mrs. Mitchell donated the money to build the Cynthia Woods Mitchell Pavilion and The Woodlands Corporation provided the land. The $7.5 million outdoor performing arts pavilion with its Arabian Nightslike tent top and grassy sloped hillside, is a dream plan Cynthia and her husband, developer George Mitchell, [had] been thinking of for eight or nine years, she said. But it was a project we had to put on hold when the economy slumped. In The Woodlands the town of 16,000 developed by The Woodlands Corp., a subsidiary of Mitchell Energy & Development Corp. the new pavilion lights up the sky and brings some of the world's greatest artists in the classical and pop realms right out into the trees. In 2000, the Pavilion determined that it was necessary to add 3,500 new seats; a 10,000- square-foot plaza behind the hill with 40 concession sales points, restrooms, entrance and exit and additional storage areas; a 10,000-square-foot dressing room facility with a kitchen and dining room for performers; and a 4,070- square-foot maintenance building to store equipment and supplies. To better serve our many thousands of guests and to remain competitive in attracting major artists to our venue, we feel this expansion is vital, said David Gottlieb, president and CEO of the Pavilion. Christine Scully, Director of Development at the Pavilion, said that no fundraising effort occurred for the renovations, We took on debt, debt, and Webb Management Services, Inc. 12 February 2005
156 Merriweather Post Business Planning more debt. According to Ms. Scully, Mr. Mitchell has made some substantial donations and the contemporary business have both helped to pay down the debt. The Town Center Improvement District has also created a special zone at the Pavilion that tacks an extra 1% to the existing 7.25% sales tax on items purchased at the site. Proceeds from the Town Center Economic Development Zone 1 would be given back in to the Pavilion to help pay for the expansion. This sales tax is imposed on items such as food, drinks and concert T-shirts but would not be levied on event tickets, said Frank Robinson, TCID president. The tax zone is expected to raise $1.35 million over 20 years to help fund a portion of the pavilion's $8 million expansion. Financing Plans As with the other research we ve completed on comparable projects, it is clear that there are a number of ways to approach the financing of the acquisition and improvements to the Pavilion. To us, the most logical approach is to relate capital requirements for the improvement of the Pavilion to the incremental revenues caused by those improvements, for the following reasons: The direct relationship between improvements and income generated suggests the viability of using County-issued revenue bonds. Revenue bonds are directly supported by income from operations, but can be backed by a County commitment to maintain a reserve fund and are flexible enough to consider a number of different ownership arrangements. There are precedents in the County for such an approach, most recently at the Golf Course. Howard County staff have thus taken our pro-forma and run the numbers to show how 25 or 30-year revenue bonds support our phased series of improvements. Appended are 4 pages that shows how bonds are issued for each phase of renovation and then paid down with operating income. Following are key assumptions and results: Page 1 shows how revenue bonds at 5.4% are paid down over 25 years, with semi-annual payments of principal and interest supported by projected net income. Note that for this and successive pages, projected net income comes from the pro-forma through 2013, with facility rent added back into income. But from 2014 on, net income is calculated as: what minimum income do we need to support the bonds for this term? Page 2 is the same run based on a 30-year term, again showing how much income is required in later years to support the bonds. Webb Management Services, Inc. 13 February 2005
157 Merriweather Post Business Planning Page 3 is based on 25-year bonds with the interest rate increased to 5.5%. Page 4 shows 30-years bonds with interest at 5.9% and Phases III and IV each delayed by one year. There are many more variables and options that might be considered, including accelerated or balloon payments. But, for the time being, this straight-forward approach shows that each of the successive bond issues is supported by cumulative cash flows from operations based on conservative income estimates. To some extent, we are well ahead of ourselves by even considering this approach, as the pro-forma is based on an extrapolation of current operating results, which many not be achievable by any other operator, including the County. We are still assuming that a rent is paid, as well as an amusement tax. And the forecast does not consider the potential for naming rights or other funding sources. But the basic exercise makes the point that funding for physical improvements can theoretically be supported by the incremental income generated by those improvements. Now it is up to potential operators, bond counsel, financial advisors and the County to work out a deal that funds improvements for a reasonable cost and risk in such a way that the operator is motivated to perform in a manner that serves the best interests of the County. Economic Impact Analysis One of the strongest arguments to build or improve arts and entertainment facilities is that they have a positive economic impact on communities. Economic impact is a measure of the economic benefits realized in a geographic region as a result of defined expenditures. Economic benefits are normally considered to be the increases in wealth and economic activity of individuals or businesses. Beneficiaries include employees of the venue, direct suppliers of goods and services, and local government, as well as businesses and individuals that profit from the consequent expenditures of employees, suppliers and patrons. Facility development projects create a series of impacts: The impact of construction the one-time impact of people, materials and services to build the facility, considering the jobs created, the materials provided and the services contracted in the community. The impact of operation the annual impact of local jobs created, materials purchased and services contracted to support the ongoing operation of the facility. The impact of ancillary spending patrons not only spend money on a ticket to attend an event, they spend an amount on top of that ticket price for dinner, gasoline, parking, baby-sitting, or even a visit to a hairdresser Webb Management Services, Inc. 14 February 2005
158 Merriweather Post Business Planning for a gala opening. Visitors from out of town may stay a night, or buy a souvenir for friends back home. The amount spent on top of the ticket price, from local, regional and visiting attendees, is the ancillary component of the economic impact and measures the affect on the businesses that cater to the patron s additional activities. Fiscal impacts - pertaining to the generation of additional tax revenues for local and State governments. All of these impacts are subject to a multiplier effect. The multiplier refers to the impacts of spending associated with the construction, operations and activity around the theater. This spending, and then re-spending, adds value to the local economy. The size of the multiplier reflects how much of a given expenditure is likely to be re-invested within the economic region (as opposed to leaking outside the economic area) and how many times those funds are re-spent within the economic region. For example, Performing Arts Companies have a multiplier in the Prince William County/Manassas/Manassas Park Market Area of , meaning that each dollar of sales in such a business ultimately results in $1.64 in value added to the economy. RIMS II The key calculation in this analysis, therefore, is estimating the total impact on the basis of estimated expenditures. In short, what are the right multipliers to get to the total impact of the project? To calculate multipliers, and thus get to the total impacts of the project, we have used RIMS II multipliers for Howard County, purchased from The Bureau of Economic Analysis within the Department of Commerce. RIMS, which stands for Regional Industrial Multipliers System, provides credible and specific multipliers for each of the relevant industry types based on 1997 benchmark accounts for the U.S economy, with 2001 regional updates (hence the II). The multipliers are then applied to construction cost estimates, ticket sales and ancillary spending estimates. We will explain each of these calculations and the resulting impacts in the following sections. Impacts of Construction For this project, construction impacts are based on an estimated budget of $18.8 million, the escalated cost of improvements over a series of years. With this input and a final demand multiplier of 1.534, the estimated total output Construction Impacts: Estimates Geography Howard County Industry Other Construction Project Costs $19,500,000 Final Demand Multipliers Project Outputs Output $29,913,000 Earnings $3,960,450 Employment is $29 million. That also allows us to suggest that the total increase in earnings in the County over the period of Webb Management Services, Inc. 15 February 2005
159 Merriweather Post Business Planning construction, totaling $3.8 million, and that there are 104 person-years of employment created as a result of the project. Impacts of Operation Annual operating impacts are based on our estimate of expenditures by the Pavilion organization in the local economy. We have done two runs of this, first showing the operating impacts of the organization in 2004 and then Bill of Goods Approach Final Demand Multipliers 2004 Impacts 2011 Impacts Category Output (dollars) Earnings (dollars) Empl't (jobs) 2004 Purchases Output ($000's) Earnings ($000's) Empl't (jobs) 2011 Purchases Output ($000's) Earnings ($000's) Empl't (jobs) Promoters of Performing Arts $250,000 $410,125 $64, $300,000 $492,150 $77, Advertising $300,000 $436,080 $64, $360,000 $523,296 $77, Hotels $15,000 $20,465 $2, $18,000 $24,557 $3, Local and Suburban Transportation $5,000 $7,577 $1, $6,000 $9,092 $1, Protective Services (Security) $20,000 $26,704 $5, $24,000 $32,045 $6, Insurance Carriers $114,000 $157,081 $19, $136,800 $188,497 $23, Retail Trade $500,000 $718,300 $95, $600,000 $861,960 $114, Legal Services $10,000 $15,300 $3, $12,000 $18,360 $4, Accounting Services $9,000 $13,019 $2, $10,800 $15,623 $3, Couriers and Messengers $8,000 $11,136 $1, $9,600 $13,363 $1, Office Administration Services $36,000 $51,822 $8, $43,200 $62,186 $10, Telephone and Communications $26,000 $38,883 $2, $31,200 $46,660 $3, Facility Support Services $113,000 $152,697 $26, $135,600 $183,236 $31, Equipment Rental and Leasing $131,000 $169,815 $11, $157,200 $203,778 $13, Services to Building $76,000 $113,947 $16, $91,200 $136,736 $19, estimating impacts in 2011 once physical improvements are completed. For each of these expenditures, there is a final demand output, an estimate of increased earnings, and an estimate of jobs created. In 2004, expenditures of $1.6 million lead to outputs of $2.3 million in the County, also adding $326,000 per annum in earnings and an additional 15 jobs. In 2011, incremental expenditures of $1.9 million, there are new outputs of $2.8 million in the County, also adding $391,000 per annum in earnings and an additional 18 jobs. Impacts of Ancillary Spending $1,613,000 $ 2,342,951 $ 325, $1,935,600 $ 2,811,541 $ 390, In June 2002, Americans for the Arts published The Arts and Economic Prosperity: The Economic Impact of Nonprofit Arts Organizations and Their Audiences, which establishes a series of national averages for expenditures on meals/refreshments, souvenirs/gifts, transportation and lodging in connection with attendance at performing arts events. Accepting that the expenditures in Howard County would depend to some extent on local conditions, we have used these national averages to demonstrate the significant impacts on spending by cultural and conference patrons on the local economy. Then, we apply the County multipliers for each of these four types of expenditures to show the total increase in final demand on the County economy. We use the published per capita expenditures for 2004, and then escalate them by 3% per annum to use them again for It is important to note that there are three sets of attendees: local, regional and visiting. Currently, Howard County residents represent 8.5% of advance tickets purchased. We increase that to 10% to reflect the notion that local residents are more likely to be among the small group who buy tickets on a walk-up basis. We also assume that 10% of ticket buyers are visitors, coming to Howard County and staying over at least partly based on a decision to Webb Management Services, Inc. 16 February 2005
160 Merriweather Post Business Planning attend a performance at the Pavilion. Here again we have run two sets of estimates, one based on actual 2004 attendance and another based on projected attendance in Although those attendees from inside the County do not qualify as new economic impacts, we include them to show the current and future impact of the Pavilion has on local expenditures. Overall, Ancillary Spending Impacts 2004 Attendance 2011 Attendance Total Attendance 204, ,000 Howard County 10% 20,400 25,000 Regional (non-county) Attendance 80% 163, ,000 Visiting Attendance 10% 20,400 25,000 these expenditures are very significant. In 2004, the Pavilion caused $3.7 million in new economic activity based on regional attendance and another $886,000 due to visitors. And by 2011, regional attenders will cause $5.2 million in economic output, with visitors responsible for $1.3 in new economic activity, all based on their local expenditures in conjunction with attendance at a Pavilion event. Fiscal Impacts Output Multiplier Total Expenditure Estimate 2004 Total Output 2004 Total Expenditure Estimate 2011 Total Output 2011 Howard County Attendees Eating and Drinking $9.99 $299,173 $12.29 $450,959 Retail Trade $1.15 $33,752 $1.42 $50,877 Transportation $2.39 $73,885 $2.94 $111,371 Overnight Lodging $2.13 $59,282 $2.62 $89,358 Sub-total $466,091 $702,564 Regional (Non-Howard County) Attendees Eating and Drinking $9.99 $2,393,380 $12.29 $3,607,669 Retail Trade $1.15 $269,621 $1.41 $406,414 Transportation $2.39 $591,079 $2.94 $890,964 Overnight Lodging $2.13 $474,253 $2.62 $714,866 Sub-total $3,728,333 $5,619,913 Visiting Attendance Eating and Drinking $15.12 $452,802 $18.60 $682,532 Retail Trade $1.32 $38,781 $1.63 $58,457 Transportation $5.74 $177,447 $7.06 $267,476 Overnight Lodging $7.80 $217,087 $9.59 $327,227 Sub-total $886,118 $1,335,692 Total Impact of Ancillary Spending $5,080,542 $7,658,170 Finally, there are fiscal impacts associated with the Pavilion operation. This starts with the County Amusement Tax, which works out to roughly 5% of gross admissions and is reflected in Net Concert Revenues. For 2004, that number was approximately $400,000. Webb Management Services, Inc. 17 February 2005
161 Merriweather Post Business Planning There are additional taxes generated by Pavilion operations, for which we use The Americans for the Arts Arts and Economic Prosperity Calculator to estimate taxes flowing to local and State government as a result of the operation of the Pavilion. The multipliers used for the calculator are based on comprehensive data collected from 91 communities across the country. Although this is not a geographically specific estimate, it is sufficient for our purposes. For more information on how the calculator works, go to Arts & Economic Prosperity Calculator The Economic Impact of Nonprofit Arts Organizations and Their Audiences Americans for the Arts Inputs: Population of the Howard County 260,000 Projected Expenses $ 2,100,000 Total Attendance 205,000 FTE Jobs Household Income Local Govn't Revenue State Govn't Revenue Impact of Organization 67 $ 1,741,929 $ 63,063 $ 99,540 Income of Audience 141 $ 2,557,355 $ 160,466 $ 319,545 Total Impact 208 $ 4,299,284 $ 223,529 $ 419,085 The calculator suggests current annual tax revenues to local government of $224,000 and State tax revenues of $419,000. Definitions Total Expenditures: FTE Jobs: The total dollars spent by your nonprofit arts organization and its audiences; event-related spending by arts audiences is estimated using the average dollars spent per person by arts event attendees in similarly populated communities. The total number of full-time equivalent (FTE) jobs in your community that are supported by the expenditures made by your arts organization and/or its audiences. An FTE can be one full-time employee, two halftime employees, four employees who work quarter-time, etc. Household Income: The total dollars paid to community residents as a result of the expenditures made by your arts organization and/or its audiences. Household income includes salaries, wages, and proprietary income. Government Revenue: The total dollars received by your local and state governments (e.g., license fees, taxes) as a result of the expenditures made by your arts organization and/or its audiences. Webb Management Services, Inc. 18 February 2005
162 Pro-forma Operating Budget Merriweather Post Pavilion Pro-forma Operating Budget Summary Actual Forecast Forecast Forecast Forecast Forecast Forecast Forecast Forecast Forecast Net Revenue Concerts $1,766,891 $1,819,240 $1,873,817 $1,950,814 $2,568,255 $2,879,654 $3,175,180 $3,270,436 $3,368,549 $3,469,605 Box Office $8,559 $8,704 $8,965 $9,234 $10,974 $11,303 $11,642 $11,991 $12,351 $12,722 VIP Sales $270,821 $279,449 $287,833 $296,468 $352,341 $362,911 $373,798 $385,012 $396,562 $408,459 Sponsorships $194,163 $243,000 $252,270 $261,818 $316,928 $328,746 $340,918 $353,456 $366,370 $379,671 Total Net Revenues $2,240,434 $2,350,393 $2,422,885 $2,518,333 $3,248,498 $3,582,614 $3,901,539 $4,020,895 $4,143,832 $4,270,456 Operating Expenses Salaries and wages $525,965 $543,840 $560,155 $573,777 $670,934 $686,779 $703,184 $720,166 $741,771 $764,024 Employee benefits $28,860 $30,369 $31,280 $32,218 $36,872 $37,978 $39,117 $40,291 $41,499 $42,744 Payroll taxes and processing $21,030 $21,754 $22,406 $22,951 $26,837 $27,471 $28,127 $28,807 $29,671 $30,561 Rent $500,000 $515,000 $530,450 $546,364 $562,754 $579,637 $597,026 $614,937 $633,385 $652,387 Utilities $45,064 $46,247 $47,634 $49,063 $55,713 $57,384 $59,106 $60,879 $62,705 $64,586 Repairs and maintenance $68,060 $70,452 $72,566 $71,114 $77,103 $75,561 $74,050 $72,569 $74,746 $76,988 Contracted Services $63,673 $65,096 $67,049 $69,060 $76,535 $78,831 $81,196 $83,631 $86,140 $88,725 Insurance $113,709 $116,390 $119,882 $131,805 $139,417 $147,648 $158,390 $165,354 $170,315 $175,424 Travel & Petty Cash $3,000 $3,090 $3,183 $3,278 $3,377 $3,478 $3,582 $3,690 $3,800 $3,914 Telephone $25,798 $26,572 $27,369 $28,190 $29,036 $29,907 $30,804 $31,728 $32,680 $33,661 Postage and Delivery $7,561 $7,788 $8,021 $8,262 $8,510 $8,765 $9,028 $9,299 $9,578 $9,865 Office/Staff supplies $30,969 $31,898 $32,855 $33,841 $34,856 $35,902 $36,979 $38,088 $39,231 $40,408 Equipment Leases/Rentals $16,282 $16,770 $17,274 $17,792 $18,326 $18,875 $19,442 $20,025 $20,626 $21,244 Seasonal Rentals/Leases $105,610 $107,050 $108,132 $109,245 $110,393 $111,575 $112,792 $114,046 $115,337 $116,667 Non-event Advertising $6,949 $7,157 $7,372 $7,593 $7,821 $8,055 $8,297 $8,546 $8,802 $9,066 Printing $1,250 $1,288 $1,326 $1,366 $1,407 $1,449 $1,493 $1,537 $1,583 $1,631 Professional fees $19,331 $19,910 $20,508 $21,123 $21,757 $22,409 $23,082 $23,774 $24,487 $25,222 Property Tax $70,144 $72,248 $74,416 $76,648 $78,948 $81,316 $83,756 $86,268 $88,856 $91,522 Donations $1,139 $1,173 $1,208 $1,245 $1,282 $1,320 $1,360 $1,401 $1,443 $1,486 Dues & Subscriptions $3,491 $3,596 $3,704 $3,815 $3,929 $4,047 $4,168 $4,293 $4,422 $4,555 Loge Tent - up/down $12,012 $12,372 $12,744 $0 $0 $0 $0 $0 $0 $0 Capital Improvements $180,700 $90,000 $92,700 $95,481 $98,345 $101,296 $104,335 $107,465 $110,689 $114,009 Booking Fee $250,000 $257,500 $265,225 $273,182 $327,818 $337,653 $347,782 $358,216 $368,962 $380,031 Total Operating Expenses $2,100,595 $2,067,560 $2,127,457 $2,177,414 $2,391,968 $2,457,335 $2,527,094 $2,595,009 $2,670,729 $2,748,721 Operating Income $139,839 $282,833 $295,428 $340,920 $856,529 $1,125,279 $1,374,444 $1,425,886 $1,473,103 $1,521,736 Interest income (expense) Other income (expense) Total Nonoperating Income (Expense) Income (Loss) Before Taxes $139,839 $282,833 $295,428 $340,920 $856,529 $1,125,279 $1,374,444 $1,425,886 $1,473,103 $1,521,736 Capitalization Rate Supportable Debt Level Webb Management Services, Inc. Page 1 2/28/2005
163 Pro-forma Operating Budget Merriweather Post Pavilion Activity and Revenue Worksheet Actual Forecast Forecast Forecast Forecast Forecast Forecast Forecast Forecast Forecast Covered Seating Capacity 5,000 5,000 5,000 5,000 5,000 5,000 5,000 5,000 5,000 5,000 Lawn Seating Capacity 14,300 14,300 14,300 14,300 14,300 14,300 14,300 14,300 14,300 14,300 Blockbuster Concerts Number of Events Capacity Sold Covered Seats 95% 95% 95% 95% 95% 96% 96% 96% 96% 96% Capacity Sold Lawn Seating 55% 55% 55% 55% 55% 56% 56% 56% 56% 56% Average Ticket Price Covered Seats $58 $60 $62 $65 $67 $69 $71 $73 $75 $77 Price Increase 3% 3% 5% 3% 3% 3% 3% 3% 3% Average Ticket Price Lawn Seating $34 $35 $36 $37 $38 $39 $41 $42 $43 $44 Price Increase 3% 3% 3% 3% 3% 3% 3% 3% 3% Gross Revenues $1,085,820 $1,118,395 $1,151,946 $1,198,196 $2,468,284 $2,578,586 $2,655,944 $2,735,622 $2,817,691 $2,902,222 Other Concerts Number of Events Capacity Sold Covered Seats 60% 60% 60% 60% 60% 61% 61% 61% 61% 61% Capacity Sold Lawn Seating 30% 30% 30% 30% 30% 31% 31% 31% 31% 31% Average Ticket Price Covered Seats $46 $47 $49 $50 $52 $53 $55 $57 $58 $60 Price Increase 3% 3% 3% 3% 3% 3% 3% 3% 3% Average Ticket Price Lawn Seating $32 $33 $34 $35 $36 $37 $38 $39 $41 $42 Price Increase 3% 3% 3% 3% 3% 3% 3% 3% 3% Gross Revenues $5,505,600 $5,670,768 $5,840,891 $6,016,118 $6,816,261 $7,196,115 $7,411,998 $7,634,358 $7,863,389 $8,099,291 Rental Events Number of Events Capacity Sold Covered Seats 65% 65% 65% 65% 65% 66% 66% 66% 66% 66% Capacity Sold Lawn Seating 35% 35% 35% 35% 35% 36% 36% 36% 36% 36% Average Ticket Price Covered Seats $33 $34 $35 $36 $37 $38 $39 $41 $42 $43 Price Increase 3% 3% 3% 3% 3% 3% 3% 3% 3% Average Ticket Price Lawn Seating $31 $32 $33 $34 $35 $36 $37 $38 $39 $40 Price Increase 3% 3% 3% 3% 3% 3% 3% 3% 3% Gross Revenues $1,049,620 $1,081,109 $1,113,542 $1,146,948 $1,181,357 $1,245,005 $1,282,355 $1,320,825 $1,360,450 $1,401,264 Average Rental Fee $5,000 $5,150 $5,305 $5,464 $5,628 $5,796 $5,970 $6,149 $6,334 $6,524 Rental Fee Increase 3% 3% 3% 3% 3% 3% 3% 3% 3% Rental Income $20,000 $20,600 $21,218 $21,855 $22,510 $23,185 $23,881 $24,597 $25,335 $26,095 Activity Summary Total Events Blockbuster Attendance 25,230 25,230 25,230 25,230 50,460 51,232 51,232 51,232 51,232 51,232 Other Concert Attendance 145, , , , , , , , , ,626 Rental Event Attendance 33,020 33,020 33,020 33,020 33,020 33,792 33,792 33,792 33,792 33,792 Total Attendance 204, , , , , , , , , ,650 Blockbuster Direct Costs and Net Costs as a % of Gross 75% 75% 75% 75% 75% 75% 75% 75% 75% 75% Total Direct Costs $814,365 $838,796 $863,960 $898,647 $1,851,213 $1,933,940 $1,991,958 $2,051,717 $2,113,268 $2,176,666 Net Revenue $271,455 $279,599 $287,987 $299,549 $617,071 $644,647 $663,986 $683,906 $704,423 $725,555 Other Concert Direct Costs and Net Costs as a % of Gross 90% 90% 90% 90% 90% 90% 90% 90% 90% 90% Total Direct Costs $4,955,040 $5,103,691 $5,256,802 $5,414,506 $6,134,635 $6,476,503 $6,670,799 $6,870,923 $7,077,050 $7,289,362 Net Revenue $550,560 $567,077 $584,089 $601,612 $681,626 $719,611 $741,200 $763,436 $786,339 $809,929 Rental Direct Costs and Net Costs as a % of Rental income 10% 10% 10% 10% 10% 10% 10% 10% 10% 10% Total Direct Costs $2,000 $2,060 $2,122 $2,185 $2,251 $2,319 $2,388 $2,460 $2,534 $2,610 Net Rental Revenue $18,000 $18,540 $19,096 $19,669 $20,259 $20,867 $21,493 $22,138 $22,802 $23,486 Concessions Income Gross Concessions Revenue per capita $8 $8 $8 $8 $9 $10 $12 $12 $13 $13 Revenue Increase 3% 3% 5% 3% 18% 18% 3% 3% 3% Gross Concessions Revenue $1,530,375 $1,576,286 $1,623,575 $1,704,754 $2,098,470 $2,534,987 $2,991,285 $3,081,024 $3,173,454 $3,268,658 Profit Margin on Concessions 55% 55% 55% 55% 55% 55% 55% 55% 55% 55% New Concessions Income $841,706 $866,957 $892,966 $937,614 $1,154,159 $1,394,243 $1,645,207 $1,694,563 $1,745,400 $1,797,762 Parking Income on Rental Activity Rental Attendance 33,020 33,020 33,020 33,020 33,020 33,792 33,792 33,792 33,792 33,792 Cars Per Attendance Parking Fee $8 $8 $8 $9 $9 $9 $10 $10 $10 $10 Revenue Increase 3% 3% 3% 3% 3% 3% 3% 3% 3% Parking Revenue $105,664 $108,834 $112,099 $115,462 $118,926 $125,357 $129,118 $132,992 $136,981 $141,091 Margin on Parking Revenues 80% 80% 80% 80% 80% 80% 80% 80% 80% 80% Net Parking Income $84,531 $87,067 $89,679 $92,370 $95,141 $100,286 $103,295 $106,393 $109,585 $112,873 Total Net Revenue $1,766,252 $1,819,240 $1,873,817 $1,950,814 $2,568,255 $2,879,654 $3,175,180 $3,270,436 $3,368,549 $3,469,605 Difference to number in P&L -$639 Box Office Fees Fees per event $325 $335 $345 $355 $366 $377 $388 $400 $412 $424 Fee Increase 3% 3% 3% 3% 3% 3% 3% 3% 3% Qualifying events Total $8,450 $8,704 $8,965 $9,234 $10,974 $11,303 $11,642 $11,991 $12,351 $12,722 Difference to number in P&L -$109 VIP Sales Season Seats Average Earned per Seat $97 $100 $103 $106 $109 $112 $116 $119 $123 $127 Fee Increase 3% 3% 3% 3% 3% 3% 3% 3% 3% Season Seat Revenue $138,710 $142,871 $147,157 $151,572 $180,138 $185,542 $191,108 $196,841 $202,747 $208,829 Box Seats Average Earned per Seat $51 $53 $54 $56 $57 $59 $61 $63 $65 $67 Fee Increase 3% 3% 3% 3% 3% 3% 3% 3% 3% Season Seat Revenue $132,600 $136,578 $140,675 $144,896 $172,203 $177,369 $182,690 $188,171 $193,816 $199,630 Total VIP Sales $271,310 $279,449 $287,833 $296,468 $352,341 $362,911 $373,798 $385,012 $396,562 $408,459 Difference to number in P&L $489 Sponsorship Income Average Sponsorship Price $25,000 $25,750 $26,523 $27,318 $28,138 $28,982 $29,851 $30,747 $31,669 $32,619 Price Increase 3% 3% 3% 3% 3% 3% 3% 3% 3% Number of Sponsorships Sold Total Revenue $250,000 $309,000 $318,270 $327,818 $393,928 $405,746 $417,918 $430,456 $443,370 $456,671 Direct Costs per sponsorship $5,500 $5,500 $5,500 $5,500 $5,500 $5,500 $5,500 $5,500 $5,500 $5,500 Total Direct Costs $55,000 $66,000 $66,000 $66,000 $77,000 $77,000 $77,000 $77,000 $77,000 $77,000 Net Sponsorship Income $195,000 $243,000 $252,270 $261,818 $316,928 $328,746 $340,918 $353,456 $366,370 $379,671 Difference to number in P&L $837 Webb Management Services, Inc. Page 2 2/28/2005
164 Pro-forma Operating Budget Merriweather Post Pavilion Staffing and Expense Worksheet Actual Forecast Forecast Forecast Forecast Forecast Forecast Forecast Forecast Forecast FT Personnel Average Salary $52,000 $53,560 $55,167 $56,822 $58,526 $60,282 $62,091 $63,953 $65,872 $67,848 Salary Increase 3% 3% 3% 3% 3% 3% 3% 3% 3% Total FT Salaries $468,000 $482,040 $496,501 $511,396 $585,265 $602,823 $620,907 $639,534 $658,720 $678,482 FTE of Seasonal Staff Average Seasonal Staff Salary $20,000 $20,600 $21,218 $20,794 $21,417 $20,989 $20,569 $20,158 $20,763 $21,386 Salary Increase 3% 3% -2% 3% -2% -2% -2% 3% 3% Total Seasonal Staff Salaries $60,000 $61,800 $63,654 $62,381 $85,670 $83,956 $82,277 $80,632 $83,051 $85,542 Total Salaries and Wages $528,000 $543,840 $560,155 $573,777 $670,934 $686,779 $703,184 $720,166 $741,771 $764,024 Difference to number in P&L $2,035 Personnel Summary Total FTE staff Employee Benefits FT Staff Benefits as % of Salaries 6% 6% 6% 6% 6% 6% 6% 6% 6% 6% Personnel Benefits $29,484 $30,369 $31,280 $32,218 $36,872 $37,978 $39,117 $40,291 $41,499 $42,744 Difference to number in P&L $624 Payroll Taxes and Processing Payroll Taxes as % of FT and PT Salaries 4% 4% 4% 4% 4% 4% 4% 4% 4% 4% Payroll Taxes $21,120 $21,754 $22,406 $22,951 $26,837 $27,471 $28,127 $28,807 $29,671 $30,561 Difference to number in P&L $90 Rent Annual Percentage Increase 3% 3% 3% 3% 3% 3% 3% 3% 3% Utilities Fixed Utility Charge $15,000 $15,450 $15,914 $16,391 $16,883 $17,389 $17,911 $18,448 $19,002 $19,572 Percentage increase 3% 3% 3% 3% 3% 3% 3% 3% 3% Utility Charge per Event $1,150 $1,185 $1,220 $1,257 $1,294 $1,333 $1,373 $1,414 $1,457 $1,500 Percentage increase 3% 3% 3% 3% 3% 3% 3% 3% 3% Variable Utility Charge $29,900 $30,797 $31,721 $32,673 $38,830 $39,995 $41,195 $42,431 $43,704 $45,015 Total Utility Charge $44,900 $46,247 $47,634 $49,063 $55,713 $57,384 $59,106 $60,879 $62,705 $64,586 Difference to number in P&L -$164 Repairs and Maintenance Fixed R&M Charge $45,000 $46,350 $47,741 $46,786 $48,189 $47,225 $46,281 $45,355 $46,716 $48,117 Percentage increase 3% 3% -2% 3% -2% -2% -2% 3% 3% Variable R&M Charge/Event $900 $927 $955 $936 $964 $945 $926 $907 $934 $962 Percentage increase 3% 3% -2% 3% -2% -2% -2% 3% 3% Variable R&M Charge $23,400 $24,102 $24,825 $24,329 $28,914 $28,335 $27,769 $27,213 $28,030 $28,870 Total R&M $68,400 $70,452 $72,566 $71,114 $77,103 $75,561 $74,050 $72,569 $74,746 $76,988 Difference to number in P&L $340 Contracted Services Fixed Contracted Services $32,000 $32,960 $33,949 $34,967 $36,016 $37,097 $38,210 $39,356 $40,537 $41,753 Percentage increase 3% 3% 3% 3% 3% 3% 3% 3% 3% Variable Contracted Services/Event $1,200 $1,236 $1,273 $1,311 $1,351 $1,391 $1,433 $1,476 $1,520 $1,566 Percentage increase 3% 3% 3% 3% 3% 3% 3% 3% 3% Variable Contracted Services $31,200 $32,136 $33,100 $34,093 $40,518 $41,734 $42,986 $44,275 $45,604 $46,972 Total contracted Services $63,200 $65,096 $67,049 $69,060 $76,535 $78,831 $81,196 $83,631 $86,140 $88,725 Difference to number in P&L -$473 Insurance Fixed Insurance Cost $80,000 $82,400 $84,872 $87,418 $90,041 $92,742 $95,524 $98,390 $101,342 $104,382 Percentage increase 3% 3% 3% 3% 3% 3% 3% 3% 3% Insurance Rate per Million in Value $1,100 $1,133 $1,167 $1,202 $1,238 $1,275 $1,313 $1,353 $1,393 $1,435 Percentage increase 3% 3% 3% 3% 3% 3% 3% 3% 3% Current Facility Value $30,000,000 $30,000,000 $30,000,000 $36,927,895 $39,882,340 $43,056,420 $47,862,845 $49,498,089 $49,498,089 $49,498,089 Facility-based insurance Cost $33,000 $33,990 $35,010 $44,387 $49,377 $54,906 $62,866 $66,964 $68,973 $71,042 Total insurance $113,000 $116,390 $119,882 $131,805 $139,417 $147,648 $158,390 $165,354 $170,315 $175,424 Difference to number in P&L -$709 Travel and Petty Cash Annual Percentage Increase 3% 3% 3% 3% 3% 3% 3% 3% 3% Telephone Annual Percentage Increase 3% 3% 3% 3% 3% 3% 3% 3% 3% Postage and Delivery Annual Percentage Increase 3% 3% 3% 3% 3% 3% 3% 3% 3% Office/Staff supplies Annual Percentage Increase 3% 3% 3% 3% 3% 3% 3% 3% 3% Equipment Leases/Rentals Annual Percentage Increase 3% 3% 3% 3% 3% 3% 3% 3% 3% Seasonal Rentals/Leases Fixed Seasonal Rentals/Leases $35,000 $36,050 $37,132 $38,245 $39,393 $40,575 $41,792 $43,046 $44,337 $45,667 Percentage increase 3% 3% 3% 3% 3% 3% 3% 3% 3% Additional Rentals/Leases per Event $2,800 $2,884 $2,971 $3,060 $3,151 $3,246 $3,343 $3,444 $3,547 $3,653 Percentage increase 3% 3% 3% 3% 3% 3% 3% 3% 3% Toal Variable Seasonal Rentals/Leases $71,000 $71,000 $71,000 $71,000 $71,000 $71,000 $71,000 $71,000 $71,000 $71,000 Total Seasonal Rentals/Leases $106,000 $107,050 $108,132 $109,245 $110,393 $111,575 $112,792 $114,046 $115,337 $116,667 Difference to number in P&L $390 Non-event Advertising Annual Percentage Increase 3% 3% 3% 3% 3% 3% 3% 3% 3% Printing Annual Percentage Increase 3% 3% 3% 3% 3% 3% 3% 3% 3% Professional Fees Annual Percentage Increase 3% 3% 3% 3% 3% 3% 3% 3% 3% Property Tax Annual Percentage Increase 3% 3% 3% 3% 3% 3% 3% 3% 3% Donations Annual Percentage Increase 3% 3% 3% 3% 3% 3% 3% 3% 3% Dues and Subscriptions Annual Percentage Increase 3% 3% 3% 3% 3% 3% 3% 3% 3% Loge Tent - up and down Annual Percentage Increase 3% 3% 3% 3% 3% 3% 3% 3% 3% Capitals Annual Percentage Increase 3% 3% 3% 3% 3% 3% 3% 3% 3% Booking Fee Annual Percentage Increase 3% 3% 3% 20% 3% 3% 3% 3% 3% Webb Management Services, Inc. Page 3 2/28/2005
165 Pro-forma Operating Budget Merriweather Post Pavilion Capital Project Worksheet Date Project Chronology Physical Improvements Following Season Impacts Operating Budget Impacts Mar-05 Plan approved by Howard County May-05 RFP for long-term operator May-05 RFP for Architect 2005 Season Budget: Jul-05 Architect contract signed +2 sponsorships sold for successive years Jul-05 Design phase begins Jul-05 Operator selected Sep-05 MOU on operating deal Nov-05 Operating contract signed Dec-05 Minor on-site improvements Site Improvements Include: 2006 Season Impacts: 2006 Season Budget: No Howard County funded capital improvements Minor Improvements None May season opens May-06 Designs documents completed Jun-06 Designs and budgets approved Jun-06 Design Documents out for Bids Aug-06 Construction Manager contract signed Sep-06 Long-lead construction items ordered Oct season closes Nov-06 Phase 1 construction begins Phase 1 Construction Includes: 2007 Season Impacts: 2007 Season Budget: Replace concrete seating base Box seats, ADA seating, new seats with cup holders Ave ticket price +2% Install permanent Loge roofs Improved audio/visual control from House Concessions +2% Replace house lighting Reduced Loge tent, seating, and concrete maintenance costs Maintnenance Costs -5% Improved audience safety and convenience Seasonal Staff Costs -5% Improved House aesthetics Stabilized existing structural foundation Facility insurance increases with building value Apr-07 Phase 1 construction completed May season opens Oct season closes Nov-07 Phase 2 construction begins Phase 2 Construction Includes: 2008 Season Impacts: 2008 Season Budget: Raise Stagehouse Roof Improved capacity to stage blockbusters Add 2 blockbusters for successive years Install operable Stagehouse grid iron truss Improved stagehand safety Add 2 additional concerts for successive years Install Stagehouse sprinkler Improved performer and crew fire safety Add 2 sponsorships sold for successive years Apr-08 Phase 2 construction completed Facility insurance increases with building value May season opens One full-time staff added for successive years Oct season closes One part-time FTE added for successive years Booking fee increased by 20% Nov-08 Phase 3 construction begins Phase 3 Construction Includes: 2009 Season Impacts: 2009 Season Budget: Replace west side concessions,toilets, paving, site lighting Improved concessions capacity and efficiency Concessions +15% Improved, ADA-accessible restrooms Improved site accessibility, safety, and aesthetics Facility insurance increases with building value Reduced site, concessions, and restroom maintenance costs Maintnenance Costs -5% Apr-09 Phase 3 construction completed Seasonal Staff Costs -5% May season opens Oct season closes Nov-09 Phase 4 construction begins Phase 4 Construction Includes: 2010 Season Impacts: 2010 Season Budget: Replace east side concessions,toilets, paving, site lighting Improved concessions capacity and efficiency Concessions +15% Replace box office Improved, ADA-accessible restrooms Improved site ADA accessibility, safety and aesthetics Facility insurance increases with building value Reduced site, concessions, and restroom maintenance costs Ticket Sales +1% for successive years Improved ticket sales convenience Maintnenance Costs -5% Reduced Box Office maintenance costs Seasonal Staff Costs -5% Apr-10 Phase 5 construction completed May season opens Oct season closes Nov-10 Phase 5 construction begins Phase 5 Construction Includes: 2011 Season Impacts: 2011 Season Budget: Replace dressing and catering with permanent structure Improved performer accomodations, improved catering efficiency Replace Administration windows Reduced dressing and catering maintenance costs Maintnenance Costs -5% Improved performer safety Seasonal Staff Costs -5% Reduced Administration energy costs Facility insurance increases with building value Apr-11 Phase 5 construction completed May season opens Webb Management Services, Inc. Page 4 2/28/2005
166 Pro-forma Operating Budget Merriweather Post Pavilion Estimated Construction Expense Worksheet 3 February, Phase 1 Construction - House Replace concrete seating base $3,090,000 Install permanent Loge roofs and house lighting $1,937,500 Subtotal $5,027, Phase 2 Construction - Stagehouse Raise Stagehouse roof $1,500,000 Install operable grid iron $225,000 Widen Proscenium $300,000 Install Stagehouse sprinkler system $60,000 Subtotal $2,085, Phase 3 Construction - West Side Replace utilities $400,000 Regrade pedestrian access $175,000 Replace restrooms $580,000 Replace concessions $1,025,000 Subtotal $2,180, Phase 4 Construction - East Side Replace utilities $600,000 Regrade pedestrian access $525,000 Replace restrooms $740,000 Replace concessions and Box Office $1,350,000 Subtotal $3,215, Phase 5 Construction - Dressing & Catering Construct permanent dressing and catering $1,030,000 Replace Administration windows $36,000 Subtotal $1,066,000 Soft 30% (Prorated on basis of Construction Cost) $1,508,250 $625,500 $654,000 $964,500 $319,800 Subtotal $6,535,750 $2,710,500 $2,834,000 $4,179,500 $1,385,800 3% per year from 2004 budget estimates $392,145 $243,945 $340,080 $626,925 $249,444 Total Construction Cost per Year $6,927,895 $2,954,445 $3,174,080 $4,806,425 $1,635,244 Total Estimated Construction Costs $19,498,089 Webb Management Services, Inc. Page 5 2/28/2005
167 Summary of CY Debt Service on 30 Years Revenue Bonds Interest Rate - 5.9% and Phases III and IV delayed one year. Annual Projected Debt Service CY Net Income* 8/15/ , ,713,162 ^ 1,508,727 2/15/2008 8/15/ , ,419,283 2,237,868 2/15/2009 8/15/ , ,704,916 3,080,219 2/15/2010 8/15/ , ,837,382 3,979,073 2/15/2011 8/15/2011 1,272, ,040,823 4,747,196 2/15/2012 8/15/2012 1,591, ,106,488 5,262,112 2/15/2013 8/15/2013 1,560, ,174,123 5,875,637 2/15/2014 8/15/2014 1,529, ,000 4,996,015 2/15/2015 8/15/2015 1,498, ,000 4,147,367 2/15/2016 8/15/2016 1,467, ,000 3,329,695 2/15/2017 8/15/2017 1,436, ,000 2,542,997 2/15/2018 8/15/2018 1,405, ,000 1,787,275 2/15/2019 8/15/2019 1,374, ,000 1,162,527 2/15/2020 8/15/2020 1,392, , ,230 2/15/2021 8/15/2021 1,358, ,000 61,857 2/15/2022 8/15/2022 1,324, ,300,000 37,410 2/15/2023 8/15/2023 1,295, ,275,000 17,035 2/15/2024 8/15/2024 1,261, ,250,000 5,880 2/15/2025 8/15/2025 1,226, ,225,000 3,945 2/15/2026 8/15/2026 1,270, ,270,000 3,590 2/15/2027 8/15/2027 1,231, ,230,000 2,175 2/15/2028 8/15/2028 1,245, ,245,000 1,322 2/15/2029 8/15/2029 1,227, ,230,000 3,392 2/15/2030
168 8/15/2030 1,184, ,190,000 9,122 2/15/2031 8/15/2031 1,193, ,190,000 5,135 2/15/2032 8/15/2032 1,151, ,150,000 3,200 2/15/2033 8/15/2033 1,104, ,105,000 3,465 2/15/2034 8/15/2034 1,052, ,050, /15/2035 8/15/2035 1,005, ,005, /15/2036 8/15/ , , /15/2037 8/15/ , , /15/2038 8/15/ , ,000 3,320 2/15/2039 8/15/ , ,000 3,745 2/15/2040 8/15/ , ,000 3,950 2/15/ , , *After rent deleted from expenses. ^ CY CY ,995,930 38,995,930
169 Merriweather Post Pavillion Phase I Construction Assumptions: $7 million in principal; 30 year term; semiannual interest payments 6,930, % 30 Total CY Principal Interest Total Pd Princ Balance Debt Service 8/15/ , ,435 6,930, ,435 2/15/ , , ,435 6,730,000 8/15/ , ,535 6,730, ,970 2/15/ , , ,535 6,530,000 8/15/ , ,635 6,530, ,170 2/15/ , , ,635 6,330,000 8/15/ , ,735 6,330, ,370 2/15/ , , ,735 6,130,000 8/15/ , ,835 6,130, ,570 2/15/ , , ,835 5,930,000 8/15/ , ,935 5,930, ,770 2/15/ , , ,935 5,730,000 8/15/ , ,035 5,730, ,970 2/15/ , , ,035 5,530,000 8/15/ , ,135 5,530, ,170 2/15/ , , ,135 5,330,000 8/15/ , ,235 5,330, ,370 2/15/ , , ,235 5,130,000 8/15/ , ,335 5,130, ,570 2/15/ , , ,335 4,930,000 8/15/ , ,435 4,930, ,770 2/15/ , , ,435 4,730,000 8/15/ , ,535 4,730, ,970 2/15/ , , ,535 4,530,000 8/15/ , ,635 4,530, ,170 2/15/ , , ,635 4,280,000 8/15/ , ,260 4,280, ,895 2/15/ , , ,260 4,030,000 8/15/ , ,885 4,030, ,145 2/15/ , , ,885 3,780,000 8/15/ , ,510 3,780, ,395 2/15/ , , ,510 3,530,000 8/15/ , ,135 3,530, ,645 2/15/ , , ,135 3,280,000 8/15/ ,760 96,760 3,280, ,895 2/15/ ,000 96, ,760 3,030,000 8/15/ ,385 89,385 3,030, ,145 2/15/ ,000 89, ,385 2,780,000 8/15/ ,010 82,010 2,780, ,395 2/15/ ,000 82, ,010 2,530,000 8/15/ ,635 74,635 2,530, ,645 2/15/ ,000 74, ,635 2,280,000 8/15/ ,260 67,260 2,280, ,895 2/15/ ,000 67, ,260 2,005,000 8/15/ ,148 59,148 2,005, ,408 2/15/ ,000 59, ,148 1,730,000
170 8/15/ ,035 51,035 1,730, ,183 2/15/ ,000 51, ,035 1,480,000 8/15/ ,660 43,660 1,480, ,695 2/15/ ,000 43, ,660 1,230,000 8/15/ ,285 36,285 1,230, ,945 2/15/ ,000 36, , ,000 8/15/ ,910 28, , ,195 2/15/ ,000 28, , ,000 8/15/ ,535 21, , ,445 2/15/ ,000 21, , ,000 8/15/ ,160 14, , ,695 2/15/ ,000 14, , ,000 8/15/2036 6,785 6, , ,945 2/15/ ,000 6, , ,785 6,930,000 6,659,625 13,589,625 13,589,625
171 Merriweather Post Pavillion Phase II Construction Assumptions: $2.955 million in principal; 30 year term; semiannual interest payments 2,955, % 30 Total CY Principal Interest Total Pd Princ Balance Debt Service 8/15/ ,173 87,173 2,955,000 87,173 2/15/ ,000 87, ,173 2,855,000 8/15/ ,223 84,223 2,855, ,395 2/15/ ,000 84, ,223 2,755,000 8/15/ ,273 81,273 2,755, ,495 2/15/ ,000 81, ,273 2,655,000 8/15/ ,323 78,323 2,655, ,595 2/15/ ,000 78, ,323 2,560,000 8/15/ ,520 75,520 2,560, ,843 2/15/ ,000 75, ,520 2,465,000 8/15/ ,718 72,718 2,465, ,238 2/15/ ,000 72, ,718 2,370,000 8/15/ ,915 69,915 2,370, ,633 2/15/ ,000 69, ,915 2,275,000 8/15/ ,113 67,113 2,275, ,028 2/15/ ,000 67, ,113 2,180,000 8/15/ ,310 64,310 2,180, ,423 2/15/ ,000 64, ,310 2,085,000 8/15/ ,508 61,508 2,085, ,818 2/15/ ,000 61, ,508 1,990,000 8/15/ ,705 58,705 1,990, ,213 2/15/ ,000 58, ,705 1,895,000 8/15/ ,903 55,903 1,895, ,608 2/15/ ,000 55, ,903 1,800,000 8/15/ ,100 53,100 1,800, ,003 2/15/ ,000 53, ,100 1,705,000 8/15/ ,298 50,298 1,705, ,398 2/15/ ,000 50, ,298 1,610,000 8/15/ ,495 47,495 1,610, ,793 2/15/ ,000 47, ,495 1,510,000 8/15/ ,545 44,545 1,510, ,040 2/15/ ,000 44, ,545 1,410,000 8/15/ ,595 41,595 1,410, ,140 2/15/ ,000 41, ,595 1,310,000 8/15/ ,645 38,645 1,310, ,240 2/15/ ,000 38, ,645 1,210,000 8/15/ ,695 35,695 1,210, ,340 2/15/ ,000 35, ,695 1,110,000 8/15/ ,745 32,745 1,110, ,440 2/15/ ,000 32, ,745 1,010,000 8/15/ ,795 29,795 1,010, ,540 2/15/ ,000 29, , ,000 8/15/ ,845 26, , ,640 2/15/ ,000 26, , ,000 8/15/ ,895 23, , ,740 2/15/ ,000 23, , ,000
172 8/15/ ,945 20, , ,840 2/15/ ,000 20, , ,000 8/15/ ,848 17, , ,793 2/15/ ,000 17, , ,000 8/15/ ,750 14, , ,598 2/15/ ,000 14, , ,000 8/15/ ,800 11, , ,550 2/15/ ,000 11, , ,000 8/15/2035 8,850 8, , ,650 2/15/ ,000 8, , ,000 8/15/2036 5,900 5, , ,750 2/15/ ,000 5, , ,000 8/15/2037 2,950 2, , ,850 2/15/ ,000 2, , ,950 2,955,000 2,728,750 5,683,750 5,683,750
173 Merriweather Post Pavillion Phase III Construction Assumptions: $3.2 million in principal; 30 year term; semiannual interest payments 3,175, % 30 Total CY Principal Interest Total Pd Princ Balance Debt Service 8/15/ ,663 93,663 3,175,000 93,663 2/15/ ,000 93, ,663 3,105,000 8/15/ ,598 91,598 3,105, ,260 2/15/ ,000 91, ,598 3,035,000 8/15/ ,533 89,533 3,035, ,130 2/15/ ,000 89, ,533 2,965,000 8/15/ ,468 87,468 2,965, ,000 2/15/ ,000 87, ,468 2,895,000 8/15/ ,403 85,403 2,895, ,870 2/15/ ,000 85, ,403 2,825,000 8/15/ ,338 83,338 2,825, ,740 2/15/ ,000 83, ,338 2,755,000 8/15/ ,273 81,273 2,755, ,610 2/15/ ,000 81, ,273 2,685,000 8/15/ ,208 79,208 2,685, ,480 2/15/ ,000 79, ,208 2,615,000 8/15/ ,143 77,143 2,615, ,350 2/15/ ,000 77, ,143 2,545,000 8/15/ ,078 75,078 2,545, ,220 2/15/ ,000 75, ,078 2,475,000 8/15/ ,013 73,013 2,475, ,090 2/15/ ,000 73, ,013 2,405,000 8/15/ ,948 70,948 2,405, ,960 2/15/ ,000 70, ,948 2,335,000 8/15/ ,883 68,883 2,335, ,830 2/15/ ,000 68, ,883 2,265,000 8/15/ ,818 66,818 2,265, ,700 2/15/ ,000 66, ,818 2,195,000 8/15/ ,753 64,753 2,195, ,570 2/15/ ,000 64, ,753 2,125,000 8/15/ ,688 62,688 2,125, ,440 2/15/ ,000 62, ,688 1,975,000 8/15/ ,263 58,263 1,975, ,950 2/15/ ,000 58, ,263 1,825,000 8/15/ ,838 53,838 1,825, ,100 2/15/ ,000 53, ,838 1,675,000 8/15/ ,413 49,413 1,675, ,250 2/15/ ,000 49, ,413 1,525,000 8/15/ ,988 44,988 1,525, ,400 2/15/ ,000 44, ,988 1,375,000 8/15/ ,563 40,563 1,375, ,550 2/15/ ,000 40, ,563 1,225,000 8/15/ ,138 36,138 1,225, ,700 2/15/ ,000 36, ,138 1,075,000
174 8/15/ ,713 31,713 1,075, ,850 2/15/ ,000 31, , ,000 8/15/ ,288 27, , ,000 2/15/ ,000 27, , ,000 8/15/ ,863 22, , ,150 2/15/ ,000 22, , ,000 8/15/ ,438 18, , ,300 2/15/ ,000 18, , ,000 8/15/ ,750 14, , ,188 2/15/ ,000 14, , ,000 8/15/ ,063 11, , ,813 2/15/ ,000 11, , ,000 8/15/2038 7,375 7, , ,438 2/15/ ,000 7, , ,000 2/16/2039 3,688 3, , ,063 2/17/ ,000 3, , ,688 3,175,000 3,342,350 6,517,350 6,517,350
175 Merriweather Post Pavillion Phase IV Construction Assumptions: $4.8 million in principal; 30 year term; semiannual interest payments 4,810, % 30 Total CY Principal Interest Total Pd Princ Balance Debt Service 8/15/ , ,895 4,810, ,895 2/15/ , , ,895 4,705,000 8/15/ , ,798 4,705, ,693 2/15/ , , ,798 4,600,000 8/15/ , ,700 4,600, ,498 2/15/ , , ,700 4,495,000 8/15/ , ,603 4,495, ,303 2/15/ , , ,603 4,390,000 8/15/ , ,505 4,390, ,108 2/15/ , , ,505 4,285,000 8/15/ , ,408 4,285, ,913 2/15/ , , ,408 4,180,000 8/15/ , ,310 4,180, ,718 2/15/ , , ,310 4,075,000 8/15/ , ,213 4,075, ,523 2/15/ , , ,213 3,970,000 8/15/ , ,115 3,970, ,328 2/15/ , , ,115 3,865,000 8/15/ , ,018 3,865, ,133 2/15/ , , ,018 3,760,000 8/15/ , ,920 3,760, ,938 2/15/ , , ,920 3,655,000 8/15/ , ,823 3,655, ,743 2/15/ , , ,823 3,550,000 8/15/ , ,725 3,550, ,548 2/15/ , , ,725 3,445,000 8/15/ , ,628 3,445, ,353 2/15/ , , ,628 3,340,000 8/15/ ,530 98,530 3,340, ,158 2/15/ ,000 98, ,530 3,235,000 8/15/ ,433 95,433 3,235, ,963 2/15/ ,000 95, ,433 3,130,000 8/15/ ,335 92,335 3,130, ,768 2/15/ ,000 92, ,335 2,970,000 8/15/ ,615 87,615 2,970, ,950 2/15/ ,000 87, ,615 2,810,000 8/15/ ,895 82,895 2,810, ,510 2/15/ ,000 82, ,895 2,650,000 8/15/ ,175 78,175 2,650, ,070 2/15/ ,000 78, ,175 2,410,000 8/15/ ,095 71,095 2,410, ,270 2/15/ ,000 71, ,095 2,170,000 8/15/ ,015 64,015 2,170, ,110 2/15/ ,000 64, ,015 1,930,000
176 8/15/ ,935 56,935 1,930, ,950 2/15/ ,000 56, ,935 1,690,000 8/15/ ,855 49,855 1,690, ,790 2/15/ ,000 49, ,855 1,450,000 8/15/ ,775 42,775 1,450, ,630 2/15/ ,000 42, ,775 1,210,000 8/15/ ,695 35,695 1,210, ,470 2/15/ ,000 35, , ,000 8/15/ ,615 28, , ,310 2/15/ ,000 28, , ,000 8/15/ ,535 21, , ,150 2/15/ ,000 21, , ,000 8/15/ ,455 14, , ,990 2/15/ ,000 14, , ,000 8/15/2040 7,228 7, , ,683 2/15/ ,000 7, , ,228 4,810,000 5,263,685 10,073,685 10,073,685
177 Merriweather Post Pavillion Phase V Construction Assumptions: $1.64 million in principal; 30 year term; semiannual interest payments 1,640, % 30 Total CY Principal Interest Total Pd Princ Balance Debt Service 8/15/ ,380 48,380 1,640,000 48,380 2/15/ ,000 48, ,380 1,585,000 8/15/ ,758 46,758 1,585, ,138 2/15/ ,000 46, ,758 1,530,000 8/15/ ,135 45,135 1,530, ,893 2/15/ ,000 45, ,135 1,475,000 8/15/ ,513 43,513 1,475, ,648 2/15/ ,000 43,513 98,513 1,420,000 8/15/ ,890 41,890 1,420, ,403 2/15/ ,000 41,890 96,890 1,365,000 8/15/ ,268 40,268 1,365, ,158 2/15/ ,000 40,268 95,268 1,310,000 8/15/ ,645 38,645 1,310, ,913 2/15/ ,000 38,645 93,645 1,255,000 8/15/ ,023 37,023 1,255, ,668 2/15/ ,000 37,023 92,023 1,200,000 8/15/ ,400 35,400 1,200, ,423 2/15/ ,000 35,400 90,400 1,145,000 8/15/ ,778 33,778 1,145, ,178 2/15/ ,000 33,778 88,778 1,090,000 8/15/ ,155 32,155 1,090, ,933 2/15/ ,000 32,155 87,155 1,035,000 8/15/ ,533 30,533 1,035, ,688 2/15/ ,000 30,533 85, ,000 8/15/ ,910 28, , ,443 2/15/ ,000 28,910 83, ,000 8/15/ ,288 27, , ,198 2/15/ ,000 27,288 82, ,000 8/15/ ,665 25, , ,953 2/15/ ,000 25,665 80, ,000 8/15/ ,043 24, , ,708 2/15/ ,000 24,043 79, ,000 8/15/ ,420 22, , ,463 2/15/ ,000 22,420 77, ,000 8/15/ ,798 20, ,000 98,218 2/15/ ,000 20,798 75, ,000 8/15/ ,175 19, ,000 94,973 2/15/ ,000 19,175 74, ,000 8/15/ ,553 17, ,000 91,728 2/15/ ,000 17,553 72, ,000 8/15/ ,930 15, ,000 88,483 2/15/ ,000 15,930 70, ,000 8/15/ ,308 14, ,000 85,238 2/15/ ,000 14,308 69, ,000 8/15/ ,685 12, ,000 81,993 2/15/ ,000 12,685 67, ,000
178 8/15/ ,063 11, ,000 78,748 2/15/ ,000 11,063 66, ,000 8/15/2035 9,440 9, ,000 75,503 2/15/ ,000 9,440 64, ,000 8/15/2036 7,818 7, ,000 72,258 2/15/ ,000 7,818 62, ,000 8/15/2037 6,195 6, ,000 69,013 2/15/ ,000 6,195 61, ,000 8/15/2038 4,573 4, ,000 65,768 2/15/ ,000 4,573 59, ,000 8/15/2039 2,950 2, ,000 62,523 2/15/ ,000 2,950 52,950 50,000 8/15/2040 1,475 1,475 50,000 54,425 2/15/ ,000 1,475 51,475-51,475 1,640,000 1,491,520 3,131,520 3,131,520
179 Summary of CY Debt Service on 25 Years Revenue Bonds Interest rate - 5.7% and all Phases delayed one year. Annual Projected Income after Debt Service CY Net Income* Debt Service 8/15/ ,713,162 ^ 1,713,162 2/15/2008 8/15/ , ,419,283 2,934,940 2/15/2009 8/15/ , ,704,916 3,917,754 2/15/2010 8/15/ , ,837,382 4,775,428 2/15/2011 8/15/2011 1,308, ,040,823 5,507,484 2/15/2012 8/15/2012 1,650, ,106,488 5,963,869 2/15/2013 8/15/2013 1,717, ,174,123 6,420,765 2/15/2014 8/15/2014 1,637, ,000 5,433,722 2/15/2015 8/15/2015 1,588, ,000 4,495,440 2/15/2016 8/15/2016 1,501, ,000 3,644,207 2/15/2017 8/15/2017 1,470, ,000 2,823,742 2/15/2018 8/15/2018 1,434, ,000 2,039,187 2/15/2019 8/15/2019 1,398, ,000 1,390,542 2/15/2020 8/15/2020 1,445, , ,230 2/15/2021 8/15/2021 1,550, , ,947 2/15/2022 8/15/2022 1,500, ,350,000 43,970 2/15/2023 8/15/2023 1,490, ,450,000 3,437 2/15/2024 8/15/2024 1,438, ,445,000 9,490 2/15/2025 8/15/2025 1,387, ,380,000 2,127 2/15/2026 8/15/2026 1,287, ,290,000 4,925 2/15/2027 8/15/2027 1,253, ,250,000 1,885 2/15/2028 8/15/2028 1,193, ,200,000 8,150 2/15/2029 8/15/2029 1,130, ,125,000 3,007 2/15/2030
180 8/15/2030 1,091, ,090,000 1,315 2/15/2031 8/15/2031 1,038, ,040,000 3,215 2/15/2032 8/15/ , ,000 2,852 2/15/2033 8/15/ , ,000 5,370 2/15/2034 8/15/ , ,000 2,217 2/15/2035 8/15/ , , /15/2036 8/15/ , , /15/ , ,000 3,742 34,612,435 34,612,435 *After rent deleted from expenses. ^CY 06+07
181 Merriweather Post Pavillion Phase I Construction Assumptions: $6.93 million in principal; 25 year term; semiannual interest payments; issued 2/15 6,930, % 25 Total CY Principal Interest Total Pd Princ Balance Debt Service 8/15/ , ,505 6,930, ,505 2/15/ , , ,505 6,680,000 8/15/ , ,380 6,680, ,885 2/15/ , , ,380 6,430,000 8/15/ , ,255 6,430, ,635 2/15/ , , ,255 6,180,000 8/15/ , ,130 6,180, ,385 2/15/ , , ,130 5,930,000 8/15/ , ,005 5,930, ,135 2/15/ , , ,005 5,680,000 8/15/ , ,880 5,680, ,885 2/15/ , , ,880 5,430,000 8/15/ , ,755 5,430, ,635 2/15/ , , ,755 5,180,000 8/15/ , ,630 5,180, ,385 2/15/ , , ,630 4,980,000 8/15/ , ,930 4,980, ,560 2/15/ , , ,930 4,780,000 8/15/ , ,230 4,780, ,160 2/15/ , , ,230 4,580,000 8/15/ , ,530 4,580, ,760 2/15/ , , ,530 4,380,000 8/15/ , ,830 4,380, ,360 2/15/ , , ,830 4,180,000 8/15/ , ,130 4,180, ,960 2/15/ , , ,130 3,830,000 8/15/ , ,155 3,830, ,285 2/15/ , , ,155 3,480,000 8/15/ ,180 99,180 3,480, ,335 2/15/ ,000 99, ,180 3,130,000 8/15/ ,205 89,205 3,130, ,385 2/15/ ,000 89, ,205 2,780,000 8/15/ ,230 79,230 2,780, ,435 2/15/ ,000 79, ,230 2,430,000 8/15/ ,255 69,255 2,430, ,485 2/15/ ,000 69, ,255 2,130,000 8/15/ ,705 60,705 2,130, ,960 2/15/ ,000 60, ,705 1,830,000 8/15/ ,155 52,155 1,830, ,860 2/15/ ,000 52, ,155 1,530,000 8/15/ ,605 43,605 1,530, ,760 2/15/ ,000 43, ,605 1,230,000 8/15/ ,055 35,055 1,230, ,660 2/15/ ,000 35, , ,000
182 8/15/ ,505 26, , ,560 2/15/ ,000 26, , ,000 8/15/ ,955 17, , ,460 2/15/ ,000 17, , ,000 8/15/2032 9,405 9, , ,360 2/15/ ,000 9, , ,405 6,930,000 5,449,200 12,379,200 12,379,200 13,860,000
183 Merriweather Post Pavillion Phase II Construction Assumptions: $2.955 million in principal; 25 year term; semiannual interest payments 2,955, % 25 Total CY Principal Interest Total Pd Princ Balance Debt Service 8/15/ ,218 84,218 2,955,000 84,218 2/15/ ,000 84, ,218 2,855,000 8/15/ ,368 81,368 2,855, ,585 2/15/ ,000 81, ,368 2,755,000 8/15/ ,518 78,518 2,755, ,885 2/15/ ,000 78, ,518 2,655,000 8/15/ ,668 75,668 2,655, ,185 2/15/ ,000 75, ,668 2,555,000 8/15/ ,818 72,818 2,555, ,485 2/15/ ,000 72, ,818 2,455,000 8/15/ ,968 69,968 2,455, ,785 2/15/ ,000 69, ,968 2,355,000 8/15/ ,118 67,118 2,355, ,085 2/15/ ,000 67, ,118 2,255,000 8/15/ ,268 64,268 2,255, ,385 2/15/ ,000 64, ,268 2,155,000 8/15/ ,418 61,418 2,155, ,685 2/15/ ,000 61, ,418 2,055,000 8/15/ ,568 58,568 2,055, ,985 2/15/ ,000 58, ,568 1,955,000 8/15/ ,718 55,718 1,955, ,285 2/15/ ,000 55, ,718 1,830,000 8/15/ ,155 52,155 1,830, ,873 2/15/ ,000 52, ,155 1,705,000 8/15/ ,593 48,593 1,705, ,748 2/15/ ,000 48, ,593 1,580,000 8/15/ ,030 45,030 1,580, ,623 2/15/ ,000 45, ,030 1,445,000 8/15/ ,183 41,183 1,445, ,213 2/15/ ,000 41, ,183 1,310,000 8/15/ ,335 37,335 1,310, ,518 2/15/ ,000 37, ,335 1,175,000 8/15/ ,488 33,488 1,175, ,823 2/15/ ,000 33, ,488 1,040,000 8/15/ ,640 29,640 1,040, ,128 2/15/ ,000 29, , ,000 8/15/ ,365 25, , ,005 2/15/ ,000 25, , ,000 8/15/ ,375 21, , ,740 2/15/ ,000 21, , ,000 8/15/ ,813 17, , ,188 2/15/ ,000 17, , ,000 8/15/ ,250 14, , ,063 2/15/ ,000 14, , ,000
184 8/15/ ,688 10, , ,938 2/15/ ,000 10, , ,000 8/15/2032 7,125 7, , ,813 2/15/ ,000 7, , ,000 8/15/2033 3,563 3, , ,688 2/15/ ,000 3, , ,563 2,955,000 2,314,485 5,269,485 5,269,485
185 Merriweather Post Pavillion Phase III Construction Assumptions: $3.2 million in principal; 25 year term; semiannual interest payments 3,175, % 25 Total CY Principal Interest Total Pd Princ Balance Debt Service 8/15/ ,488 90,488 3,175,000 90,488 2/15/ ,000 90, ,488 3,050,000 8/15/ ,925 86,925 3,050, ,413 2/15/ ,000 86, ,925 2,925,000 8/15/ ,363 83,363 2,925, ,288 2/15/ ,000 83, ,363 2,800,000 8/15/ ,800 79,800 2,800, ,163 2/15/ ,000 79, ,800 2,675,000 8/15/ ,238 76,238 2,675, ,038 2/15/ ,000 76, ,238 2,550,000 8/15/ ,675 72,675 2,550, ,913 2/15/ ,000 72, ,675 2,425,000 8/15/ ,113 69,113 2,425, ,788 2/15/ ,000 69, ,113 2,300,000 8/15/ ,550 65,550 2,300, ,663 2/15/ ,000 65, ,550 2,175,000 8/15/ ,988 61,988 2,175, ,538 2/15/ ,000 61, ,988 2,050,000 8/15/ ,425 58,425 2,050, ,413 2/15/ ,000 58, ,425 1,925,000 8/15/ ,863 54,863 1,925, ,288 2/15/ ,000 54, ,863 1,800,000 8/15/ ,300 51,300 1,800, ,163 2/15/ ,000 51, ,300 1,675,000 8/15/ ,738 47,738 1,675, ,038 2/15/ ,000 47, ,738 1,550,000 8/15/ ,175 44,175 1,550, ,913 2/15/ ,000 44, ,175 1,425,000 8/15/ ,613 40,613 1,425, ,788 2/15/ ,000 40, ,613 1,300,000 8/15/ ,050 37,050 1,300, ,663 2/15/ ,000 37, ,050 1,175,000 8/15/ ,488 33,488 1,175, ,538 2/15/ ,000 33, ,488 1,050,000 8/15/ ,925 29,925 1,050, ,413 2/15/ ,000 29, , ,000 8/15/ ,363 26, , ,288 2/15/ ,000 26, , ,000 8/15/ ,800 22, , ,163 2/15/ ,000 22, , ,000 8/15/ ,953 18, , ,753 2/15/ ,000 18, , ,000 8/15/ ,105 15, , ,058 2/15/ ,000 15, , ,000
186 8/15/ ,258 11, , ,363 2/15/ ,000 11, , ,000 8/15/2033 7,410 7, , ,668 2/15/ ,000 7, , ,000 8/15/2034 3,563 3, , ,973 2/15/ ,000 3, , ,563 3,175,000 2,378,325 5,553,325 5,553,325
187 Merriweather Post Pavillion Phase IV Construction Assumptions: $4.8 million in principal; 25 year term; semiannual interest payments 4,810, % 25 Total CY Principal Interest Total Pd Princ Balance Debt Service 8/15/ , ,085 4,810, ,085 2/15/ , , ,085 4,620,000 8/15/ , ,670 4,620, ,755 2/15/ , , ,670 4,430,000 8/15/ , ,255 4,430, ,925 2/15/ , , ,255 4,280,000 8/15/ , ,980 4,280, ,235 2/15/ , , ,980 4,140,000 8/15/ , ,990 4,140, ,970 2/15/ , , ,990 4,000,000 8/15/ , ,000 4,000, ,990 2/15/ , , ,000 3,860,000 8/15/ , ,010 3,860, ,010 2/15/ , , ,010 3,720,000 8/15/ , ,020 3,720, ,030 2/15/ , , ,020 3,580,000 8/15/ , ,030 3,580, ,050 2/15/ , , ,030 3,380,000 8/15/ ,330 96,330 3,380, ,360 2/15/ ,000 96, ,330 3,180,000 8/15/ ,630 90,630 3,180, ,960 2/15/ ,000 90, ,630 2,980,000 8/15/ ,930 84,930 2,980, ,560 2/15/ ,000 84, ,930 2,755,000 8/15/ ,518 78,518 2,755, ,448 2/15/ ,000 78, ,518 2,530,000 8/15/ ,105 72,105 2,530, ,623 2/15/ ,000 72, ,105 2,305,000 8/15/ ,693 65,693 2,305, ,798 2/15/ ,000 65, ,693 2,080,000 8/15/ ,280 59,280 2,080, ,973 2/15/ ,000 59, ,280 1,855,000 8/15/ ,868 52,868 1,855, ,148 2/15/ ,000 52, ,868 1,630,000 8/15/ ,455 46,455 1,630, ,323 2/15/ ,000 46, ,455 1,405,000 8/15/ ,043 40,043 1,405, ,498 2/15/ ,000 40, ,043 1,180,000 8/15/ ,630 33,630 1,180, ,673 2/15/ ,000 33, , ,000 8/15/ ,218 27, , ,848 2/15/ ,000 27, , ,000 8/15/ ,518 21, , ,735 2/15/ ,000 21, , ,000
188 8/15/ ,818 15, , ,335 2/15/ ,000 15, , ,000 8/15/ ,118 10, , ,935 2/15/ ,000 10, , ,000 8/15/2035 4,418 4, , ,535 2/15/ ,000 4, , ,418 4,810,000 3,733,215 8,543,215 8,543,215
189 Merriweather Post Pavillion Phase V Construction Assumptions: $1.64 million in principal; 25 year term; semiannual interest payments 1,640, % 25 Total CY Principal Interest Total Pd Princ Balance Debt Service 8/15/ ,740 46,740 1,640,000 46,740 2/15/ ,000 46, ,740 1,580,000 8/15/ ,030 45,030 1,580, ,770 2/15/ ,000 45, ,030 1,520,000 8/15/ ,320 43,320 1,520, ,350 2/15/ ,000 43, ,320 1,460,000 8/15/ ,610 41,610 1,460, ,930 2/15/ ,000 41, ,610 1,400,000 8/15/ ,900 39,900 1,400, ,510 2/15/ ,000 39, ,900 1,335,000 8/15/ ,048 38,048 1,335, ,948 2/15/ ,000 38, ,048 1,270,000 8/15/ ,195 36,195 1,270, ,243 2/15/ ,000 36, ,195 1,205,000 8/15/ ,343 34,343 1,205, ,538 2/15/ ,000 34,343 99,343 1,140,000 8/15/ ,490 32,490 1,140, ,833 2/15/ ,000 32,490 97,490 1,075,000 8/15/ ,638 30,638 1,075, ,128 2/15/ ,000 30,638 95,638 1,010,000 8/15/ ,785 28,785 1,010, ,423 2/15/ ,000 28,785 98, ,000 8/15/ ,790 26, , ,575 2/15/ ,000 26,790 96, ,000 8/15/ ,795 24, , ,585 2/15/ ,000 24,795 94, ,000 8/15/ ,800 22, , ,595 2/15/ ,000 22,800 92, ,000 8/15/ ,805 20, , ,605 2/15/ ,000 20,805 90, ,000 8/15/ ,810 18, , ,615 2/15/ ,000 18,810 88, ,000 8/15/ ,815 16, , ,625 2/15/ ,000 16,815 86, ,000 8/15/ ,820 14, , ,635 2/15/ ,000 14,820 84, ,000 8/15/ ,825 12, ,000 97,645 2/15/ ,000 12,825 77, ,000 8/15/ ,973 10, ,000 88,798 2/15/ ,000 10,973 75, ,000 8/15/2032 9,120 9, ,000 85,093 2/15/ ,000 9,120 74, ,000 8/15/2033 7,268 7, ,000 81,388 2/15/ ,000 7,268 72, ,000
190 8/15/2034 5,415 5, ,000 77,683 2/15/ ,000 5,415 70, ,000 8/15/2035 3,563 3, ,000 73,978 2/15/ ,000 3,563 68,563 60,000 8/15/2036 1,710 1,710 60,000 70,273 2/15/ ,000 1,710 61,710-61,710 1,640,000 1,227,210 2,867,210 2,867,210
191 Summary of CY Debt Service on 30 Years Revenue Bonds Annual Projected Income After Debt Service CY Net Income* Debt Service 8/15/ , ,713,162 ^ 1,526,052 2/15/2008 8/15/ , ,419,283 2,296,730 2/15/2009 8/15/ , ,704,916 3,101,031 2/15/2010 8/15/2010 1,168, ,837,382 3,770,293 2/15/2011 8/15/2011 1,424, ,040,823 4,386,661 2/15/2012 8/15/2012 1,491, ,106,488 5,001,414 2/15/2013 8/15/2013 1,463, ,174,123 5,712,152 2/15/2014 8/15/2014 1,435, ,000 4,927,117 2/15/2015 8/15/2015 1,406, ,000 4,170,432 2/15/2016 8/15/2016 1,378, ,000 3,442,097 2/15/2017 8/15/2017 1,349, ,000 2,742,112 2/15/2018 8/15/2018 1,321, ,000 2,070,477 2/15/2019 8/15/2019 1,293, ,000 1,427,192 2/15/2020 8/15/2020 1,313, , ,607 2/15/2021 8/15/2021 1,282, , ,072 2/15/2022 8/15/2022 1,251, , ,587 2/15/2023 8/15/2023 1,225, ,175,000 54,287 2/15/2024 8/15/2024 1,193, ,200,000 60,307 2/15/2025 8/15/2025 1,240, ,200,000 19,807 2/15/2026 8/15/2026 1,204, ,200,000 14,947 2/15/2027 8/15/2027 1,222, ,210,000 2,212 2/15/2028 8/15/2028 1,184, ,190,000 8,087 2/15/2029 8/15/2029 1,169, ,165,000 3,247 2/15/2030 8/15/2030 1,207, ,205,
192 2/15/2031 8/15/2031 1,139, ,140,000 1,412 2/15/2032 8/15/2032 1,101, ,105,000 5,362 2/15/2033 8/15/2033 1,057, ,055,000 2,512 2/15/2034 8/15/2034 1,009, ,010,000 2,727 2/15/2035 8/15/ , , /15/2036 8/15/ , ,000 4,247 2/15/2037 8/15/ , ,000 4,337 2/15/2038 8/15/ , ,000 3,717 2/15/2039 8/15/ , ,000 3,612 2/15/2040 8/15/ , ,000 2,947 2/15/ , ,000 1,597 37,344,580 37,344,580 * After deleting rent as an expense.
193 Merriweather Post Pavillion Phase I Construction Assumptions: $6.93 million in principal; 30 year term; semiannual interest payments 6,930, % 30 Total CY Principal Interest Total Pd Princ Balance Debt Service 8/15/ , ,110 6,930, ,110 2/15/ , , ,110 6,730,000 8/15/ , ,710 6,730, ,820 2/15/ , , ,710 6,530,000 8/15/ , ,310 6,530, ,020 2/15/ , , ,310 6,330,000 8/15/ , ,910 6,330, ,220 2/15/ , , ,910 6,130,000 8/15/ , ,510 6,130, ,420 2/15/ , , ,510 5,930,000 8/15/ , ,110 5,930, ,620 2/15/ , , ,110 5,730,000 8/15/ , ,710 5,730, ,820 2/15/ , , ,710 5,530,000 8/15/ , ,310 5,530, ,020 2/15/ , , ,310 5,330,000 8/15/ , ,910 5,330, ,220 2/15/ , , ,910 5,130,000 8/15/ , ,510 5,130, ,420 2/15/ , , ,510 4,930,000 8/15/ , ,110 4,930, ,620 2/15/ , , ,110 4,730,000 8/15/ , ,710 4,730, ,820 2/15/ , , ,710 4,530,000 8/15/ , ,310 4,530, ,020 2/15/ , , ,310 4,280,000 8/15/ , ,560 4,280, ,870 2/15/ , , ,560 4,030,000 8/15/ , ,810 4,030, ,370 2/15/ , , ,810 3,780,000 8/15/ , ,060 3,780, ,870 2/15/ , , ,060 3,530,000 8/15/ ,310 95,310 3,530, ,370 2/15/ ,000 95, ,310 3,280,000 8/15/ ,560 88,560 3,280, ,870 2/15/ ,000 88, ,560 3,030,000 8/15/ ,810 81,810 3,030, ,370 2/15/ ,000 81, ,810 2,780,000 8/15/ ,060 75,060 2,780, ,870 2/15/ ,000 75, ,060 2,530,000 8/15/ ,310 68,310 2,530, ,370 2/15/ ,000 68, ,310 2,280,000 8/15/ ,560 61,560 2,280, ,870 2/15/ ,000 61, ,560 2,005,000 8/15/ ,135 54,135 2,005, ,695 2/15/ ,000 54, ,135 1,730,000
194 8/15/ ,710 46,710 1,730, ,845 2/15/ ,000 46, ,710 1,480,000 8/15/ ,960 39,960 1,480, ,670 2/15/ ,000 39, ,960 1,230,000 8/15/ ,210 33,210 1,230, ,170 2/15/ ,000 33, , ,000 8/15/ ,460 26, , ,670 2/15/ ,000 26, , ,000 8/15/ ,710 19, , ,170 2/15/ ,000 19, , ,000 8/15/ ,960 12, , ,670 2/15/ ,000 12, , ,000 8/15/2036 6,210 6, , ,170 2/15/ ,000 6, , ,210 6,930,000 6,095,250 13,025,250 13,025,250
195 Merriweather Post Pavillion Phase II Construction Assumptions: $2.955 million in principal; 30 year term; semiannual interest payments 2,955, % 30 Total CY Principal Interest Total Pd Princ Balance Debt Service 8/15/ ,785 79,785 2,955,000 79,785 2/15/ ,000 79, ,785 2,855,000 8/15/ ,085 77,085 2,855, ,870 2/15/ ,000 77, ,085 2,755,000 8/15/ ,385 74,385 2,755, ,470 2/15/ ,000 74, ,385 2,655,000 8/15/ ,685 71,685 2,655, ,070 2/15/ ,000 71, ,685 2,560,000 8/15/ ,120 69,120 2,560, ,805 2/15/ ,000 69, ,120 2,465,000 8/15/ ,555 66,555 2,465, ,675 2/15/ ,000 66, ,555 2,370,000 8/15/ ,990 63,990 2,370, ,545 2/15/ ,000 63, ,990 2,275,000 8/15/ ,425 61,425 2,275, ,415 2/15/ ,000 61, ,425 2,180,000 8/15/ ,860 58,860 2,180, ,285 2/15/ ,000 58, ,860 2,085,000 8/15/ ,295 56,295 2,085, ,155 2/15/ ,000 56, ,295 1,990,000 8/15/ ,730 53,730 1,990, ,025 2/15/ ,000 53, ,730 1,895,000 8/15/ ,165 51,165 1,895, ,895 2/15/ ,000 51, ,165 1,800,000 8/15/ ,600 48,600 1,800, ,765 2/15/ ,000 48, ,600 1,705,000 8/15/ ,035 46,035 1,705, ,635 2/15/ ,000 46, ,035 1,610,000 8/15/ ,470 43,470 1,610, ,505 2/15/ ,000 43, ,470 1,510,000 8/15/ ,770 40,770 1,510, ,240 2/15/ ,000 40, ,770 1,410,000 8/15/ ,070 38,070 1,410, ,840 2/15/ ,000 38, ,070 1,310,000 8/15/ ,370 35,370 1,310, ,440 2/15/ ,000 35, ,370 1,210,000 8/15/ ,670 32,670 1,210, ,040 2/15/ ,000 32, ,670 1,110,000 8/15/ ,970 29,970 1,110, ,640 2/15/ ,000 29, ,970 1,010,000 8/15/ ,270 27,270 1,010, ,240 2/15/ ,000 27, , ,000 8/15/ ,570 24, , ,840 2/15/ ,000 24, , ,000 8/15/ ,870 21, , ,440 2/15/ ,000 21, , ,000
196 8/15/ ,170 19, , ,040 2/15/ ,000 19, , ,000 8/15/ ,335 16, , ,505 2/15/ ,000 16, , ,000 8/15/ ,500 13, , ,835 2/15/ ,000 13, , ,000 8/15/ ,800 10, , ,300 2/15/ ,000 10, , ,000 8/15/2035 8,100 8, , ,900 2/15/ ,000 8, , ,000 8/15/2036 5,400 5, , ,500 2/15/ ,000 5, , ,000 8/15/2037 2,700 2, , ,100 2/15/ ,000 2, , ,700 2,955,000 2,497,500 5,452,500 5,452,500
197 Merriweather Post Pavillion Phase III Construction Assumptions: $3.175 million in principal; 30 year term; semiannual interest payments 3,175, % 30 Total CY Principal Interest Total Pd Princ Balance Debt Service 8/15/ ,725 85,725 3,175,000 85,725 2/15/ ,000 85, ,725 3,105,000 8/15/ ,835 83,835 3,105, ,560 2/15/ ,000 83, ,835 3,035,000 8/15/ ,945 81,945 3,035, ,780 2/15/ ,000 81, ,945 2,965,000 8/15/ ,055 80,055 2,965, ,000 2/15/ ,000 80, ,055 2,895,000 8/15/ ,165 78,165 2,895, ,220 2/15/ ,000 78, ,165 2,825,000 8/15/ ,275 76,275 2,825, ,440 2/15/ ,000 76, ,275 2,755,000 8/15/ ,385 74,385 2,755, ,660 2/15/ ,000 74, ,385 2,685,000 8/15/ ,495 72,495 2,685, ,880 2/15/ ,000 72, ,495 2,615,000 8/15/ ,605 70,605 2,615, ,100 2/15/ ,000 70, ,605 2,545,000 8/15/ ,715 68,715 2,545, ,320 2/15/ ,000 68, ,715 2,475,000 8/15/ ,825 66,825 2,475, ,540 2/15/ ,000 66, ,825 2,405,000 8/15/ ,935 64,935 2,405, ,760 2/15/ ,000 64, ,935 2,335,000 8/15/ ,045 63,045 2,335, ,980 2/15/ ,000 63, ,045 2,265,000 8/15/ ,155 61,155 2,265, ,200 2/15/ ,000 61, ,155 2,195,000 8/15/ ,265 59,265 2,195, ,420 2/15/ ,000 59, ,265 2,125,000 8/15/ ,375 57,375 2,125, ,640 2/15/ ,000 57, ,375 1,975,000 8/15/ ,325 53,325 1,975, ,700 2/15/ ,000 53, ,325 1,825,000 8/15/ ,275 49,275 1,825, ,600 2/15/ ,000 49, ,275 1,675,000 8/15/ ,225 45,225 1,675, ,500 2/15/ ,000 45, ,225 1,525,000 8/15/ ,175 41,175 1,525, ,400 2/15/ ,000 41, ,175 1,375,000 8/15/ ,125 37,125 1,375, ,300 2/15/ ,000 37, ,125 1,225,000 8/15/ ,075 33,075 1,225, ,200 2/15/ ,000 33, ,075 1,075,000 8/15/ ,025 29,025 1,075, ,100 2/15/ ,000 29, , ,000
198 8/15/ ,975 24, , ,000 2/15/ ,000 24, , ,000 8/15/ ,925 20, , ,900 2/15/ ,000 20, , ,000 8/15/ ,875 16, , ,800 2/15/ ,000 16, , ,000 8/15/ ,500 13, , ,375 2/15/ ,000 13, , ,000 8/15/ ,125 10, , ,625 2/15/ ,000 10, , ,000 8/15/2037 6,750 6, , ,875 2/15/ ,000 6, , ,000 8/15/2038 3,375 3, , ,125 2/15/ ,000 3, , ,375 3,175,000 3,059,100 6,234,100 6,234,100
199 Merriweather Post Pavillion Phase IV Construction Assumptions: $4.81 million in principal; 30 year term; semiannual interest payments 4,810, % 30 Total CY Principal Interest Total Pd Princ Balance Debt Service 8/15/ , ,870 4,810, ,870 2/15/ , , ,870 4,705,000 8/15/ , ,035 4,705, ,905 2/15/ , , ,035 4,600,000 8/15/ , ,200 4,600, ,235 2/15/ , , ,200 4,495,000 8/15/ , ,365 4,495, ,565 2/15/ , , ,365 4,390,000 8/15/ , ,530 4,390, ,895 2/15/ , , ,530 4,285,000 8/15/ , ,695 4,285, ,225 2/15/ , , ,695 4,180,000 8/15/ , ,860 4,180, ,555 2/15/ , , ,860 4,075,000 8/15/ , ,025 4,075, ,885 2/15/ , , ,025 3,970,000 8/15/ , ,190 3,970, ,215 2/15/ , , ,190 3,865,000 8/15/ , ,355 3,865, ,545 2/15/ , , ,355 3,760,000 8/15/ , ,520 3,760, ,875 2/15/ , , ,520 3,655,000 8/15/ ,685 98,685 3,655, ,205 2/15/ ,000 98, ,685 3,550,000 8/15/ ,850 95,850 3,550, ,535 2/15/ ,000 95, ,850 3,445,000 8/15/ ,015 93,015 3,445, ,865 2/15/ ,000 93, ,015 3,340,000 8/15/ ,180 90,180 3,340, ,195 2/15/ ,000 90, ,180 3,235,000 8/15/ ,345 87,345 3,235, ,525 2/15/ ,000 87, ,345 3,130,000 8/15/ ,510 84,510 3,130, ,855 2/15/ ,000 84, ,510 2,970,000 8/15/ ,190 80,190 2,970, ,700 2/15/ ,000 80, ,190 2,810,000 8/15/ ,870 75,870 2,810, ,060 2/15/ ,000 75, ,870 2,650,000 8/15/ ,550 71,550 2,650, ,420 2/15/ ,000 71, ,550 2,410,000 8/15/ ,070 65,070 2,410, ,620 2/15/ ,000 65, ,070 2,170,000 8/15/ ,590 58,590 2,170, ,660 2/15/ ,000 58, ,590 1,930,000 8/15/ ,110 52,110 1,930, ,700 2/15/ ,000 52, ,110 1,690,000
200 8/15/ ,630 45,630 1,690, ,740 2/15/ ,000 45, ,630 1,450,000 8/15/ ,150 39,150 1,450, ,780 2/15/ ,000 39, ,150 1,210,000 8/15/ ,670 32,670 1,210, ,820 2/15/ ,000 32, , ,000 8/15/ ,190 26, , ,860 2/15/ ,000 26, , ,000 8/15/ ,710 19, , ,900 2/15/ ,000 19, , ,000 8/15/ ,230 13, , ,940 2/15/ ,000 13, , ,000 8/15/2039 6,615 6, , ,845 2/15/ ,000 6, , ,615 4,810,000 4,817,610 9,627,610 9,627,610
201 Merriweather Post Pavillion Phase V Construction Assumptions: $1.64 million in principal; 30 year term; semiannual interest payments 1,640, % 30 Total CY Principal Interest Total Pd Princ Balance Debt Service 8/15/ ,280 44,280 1,640,000 44,280 2/15/ ,000 44,280 99,280 1,585,000 8/15/ ,795 42,795 1,585, ,075 2/15/ ,000 42,795 97,795 1,530,000 8/15/ ,310 41,310 1,530, ,105 2/15/ ,000 41,310 96,310 1,475,000 8/15/ ,825 39,825 1,475, ,135 2/15/ ,000 39,825 94,825 1,420,000 8/15/ ,340 38,340 1,420, ,165 2/15/ ,000 38,340 93,340 1,365,000 8/15/ ,855 36,855 1,365, ,195 2/15/ ,000 36,855 91,855 1,310,000 8/15/ ,370 35,370 1,310, ,225 2/15/ ,000 35,370 90,370 1,255,000 8/15/ ,885 33,885 1,255, ,255 2/15/ ,000 33,885 88,885 1,200,000 8/15/ ,400 32,400 1,200, ,285 2/15/ ,000 32,400 87,400 1,145,000 8/15/ ,915 30,915 1,145, ,315 2/15/ ,000 30,915 85,915 1,090,000 8/15/ ,430 29,430 1,090, ,345 2/15/ ,000 29,430 84,430 1,035,000 8/15/ ,945 27,945 1,035, ,375 2/15/ ,000 27,945 82, ,000 8/15/ ,460 26, , ,405 2/15/ ,000 26,460 81, ,000 8/15/ ,975 24, , ,435 2/15/ ,000 24,975 79, ,000 8/15/ ,490 23, , ,465 2/15/ ,000 23,490 78, ,000 8/15/ ,005 22, , ,495 2/15/ ,000 22,005 77, ,000 8/15/ ,520 20, ,000 97,525 2/15/ ,000 20,520 75, ,000 8/15/ ,035 19, ,000 94,555 2/15/ ,000 19,035 74, ,000 8/15/ ,550 17, ,000 91,585 2/15/ ,000 17,550 72, ,000 8/15/ ,065 16, ,000 88,615 2/15/ ,000 16,065 71, ,000 8/15/ ,580 14, ,000 85,645 2/15/ ,000 14,580 69, ,000 8/15/ ,095 13, ,000 82,675 2/15/ ,000 13,095 68, ,000 8/15/ ,610 11, ,000 79,705 2/15/ ,000 11,610 66, ,000
202 8/15/ ,125 10, ,000 76,735 2/15/ ,000 10,125 65, ,000 8/15/2035 8,640 8, ,000 73,765 2/15/ ,000 8,640 63, ,000 8/15/2036 7,155 7, ,000 70,795 2/15/ ,000 7,155 62, ,000 8/15/2037 5,670 5, ,000 67,825 2/15/ ,000 5,670 60, ,000 8/15/2038 4,185 4, ,000 64,855 2/15/ ,000 4,185 59, ,000 8/15/2039 2,700 2, ,000 61,885 2/15/ ,000 2,700 52,700 50,000 8/15/2040 1,350 1,350 50,000 54,050 2/15/ ,000 1,350 51,350-51,350 1,640,000 1,365,120 3,005,120 3,005,120
203 Summary of CY Debt Service on 25 Years Revenue Bonds Annual Projected Income after Debt Service CY Net Income * Debt Service 8/15/ , ,713,162 ^ 1,532,982 2/15/2008 8/15/ , ,419,283 2,271,575 2/15/2009 8/15/ , ,704,916 3,052,021 2/15/2010 8/15/2010 1,235, ,837,382 3,653,773 2/15/2011 8/15/2011 1,563, ,040,823 4,130,906 2/15/2012 8/15/2012 1,630, ,106,488 4,607,204 2/15/2013 8/15/2013 1,553, ,174,123 5,227,797 2/15/2014 8/15/2014 1,508, ,000 4,369,627 2/15/2015 8/15/2015 1,424, ,000 3,595,257 2/15/2016 8/15/2016 1,396, ,000 2,848,517 2/15/2017 8/15/2017 1,363, ,000 2,234,537 2/15/2018 8/15/2018 1,331, ,000 1,653,317 2/15/2019 8/15/2019 1,381, ,000 1,022,067 2/15/2020 8/15/2020 1,490, , ,897 2/15/2021 8/15/2021 1,445, ,200, ,707 2/15/2022 8/15/2022 1,439, ,305,000 2,537 2/15/2023 8/15/2023 1,392, ,400,000 10,427 2/15/2024 8/15/2024 1,345, ,350,000 15,377 2/15/2025 8/15/2025 1,249, ,240,000 6,087 2/15/2026 8/15/2026 1,219, ,220,000 6,647 2/15/2027 8/15/2027 1,164, ,160,000 2,187 2/15/2028 8/15/2028 1,105, ,110,000 7,057 2/15/2029 8/15/2029 1,070, ,065,000 1,127 2/15/2030 8/15/2030 1,021, ,025,000 4,527
204 2/15/2031 8/15/ , ,000 1,477 2/15/2032 8/15/ , ,000 2,107 2/15/2033 8/15/ , ,000 3,617 2/15/2034 8/15/ , ,000 3,917 2/15/2035 8/15/ , ,000 5,077 2/15/ , ,000 3,517 33,287,660 33,287,660 * After deleting rent as an expense. ^ CY CY 2007
205 Merriweather Post Pavillion Phase I Construction Assumptions: $6.93 million in principal; 25 year term; semiannual interest payments; issued 2/15 6,930, % 25 Total CY Principal Interest Total Pd Princ Balance Debt Service 8/15/ , ,180 6,930, ,180 2/15/ , , ,180 6,680,000 8/15/ , ,680 6,680, ,860 2/15/ , , ,680 6,430,000 8/15/ , ,180 6,430, ,860 2/15/ , , ,180 6,180,000 8/15/ , ,680 6,180, ,860 2/15/ , , ,680 5,930,000 8/15/ , ,180 5,930, ,860 2/15/ , , ,180 5,680,000 8/15/ , ,680 5,680, ,860 2/15/ , , ,680 5,430,000 8/15/ , ,180 5,430, ,860 2/15/ , , ,180 5,180,000 8/15/ , ,680 5,180, ,860 2/15/ , , ,680 4,980,000 8/15/ , ,480 4,980, ,160 2/15/ , , ,480 4,780,000 8/15/ , ,280 4,780, ,760 2/15/ , , ,280 4,580,000 8/15/ , ,080 4,580, ,360 2/15/ , , ,080 4,380,000 8/15/ , ,880 4,380, ,960 2/15/ , , ,880 4,180,000 8/15/ , ,680 4,180, ,560 2/15/ , , ,680 3,830,000 8/15/ ,580 99,580 3,830, ,260 2/15/ ,000 99, ,580 3,480,000 8/15/ ,480 90,480 3,480, ,060 2/15/ ,000 90, ,480 3,130,000 8/15/ ,380 81,380 3,130, ,860 2/15/ ,000 81, ,380 2,780,000 8/15/ ,280 72,280 2,780, ,660 2/15/ ,000 72, ,280 2,430,000 8/15/ ,180 63,180 2,430, ,460 2/15/ ,000 63, ,180 2,130,000 8/15/ ,380 55,380 2,130, ,560 2/15/ ,000 55, ,380 1,830,000 8/15/ ,580 47,580 1,830, ,960 2/15/ ,000 47, ,580 1,530,000 8/15/ ,780 39,780 1,530, ,360 2/15/ ,000 39, ,780 1,230,000 8/15/ ,980 31,980 1,230, ,760 2/15/ ,000 31, , ,000 8/15/ ,180 24, , ,160 2/15/ ,000 24, , ,000
206 8/15/ ,380 16, , ,560 2/15/ ,000 16, , ,000 8/15/2031 8,580 8, , ,960 2/15/ ,000 8, , ,580 6,930,000 4,971,200 11,901,200 11,901,200 13,860,000
207 Merriweather Post Pavillion Phase II Construction Assumptions: $2.955 million in principal; 25 year term; semiannual interest payments 2,955, % 25 Total CY Principal Interest Total Pd Princ Balance Debt Service 8/15/ ,830 76,830 2,955,000 76,830 2/15/ ,000 76, ,830 2,855,000 8/15/ ,230 74,230 2,855, ,060 2/15/ ,000 74, ,230 2,755,000 8/15/ ,630 71,630 2,755, ,860 2/15/ ,000 71, ,630 2,655,000 8/15/ ,030 69,030 2,655, ,660 2/15/ ,000 69, ,030 2,555,000 8/15/ ,430 66,430 2,555, ,460 2/15/ ,000 66, ,430 2,455,000 8/15/ ,830 63,830 2,455, ,260 2/15/ ,000 63, ,830 2,355,000 8/15/ ,230 61,230 2,355, ,060 2/15/ ,000 61, ,230 2,255,000 8/15/ ,630 58,630 2,255, ,860 2/15/ ,000 58, ,630 2,155,000 8/15/ ,030 56,030 2,155, ,660 2/15/ ,000 56, ,030 2,055,000 8/15/ ,430 53,430 2,055, ,460 2/15/ ,000 53, ,430 1,955,000 8/15/ ,830 50,830 1,955, ,260 2/15/ ,000 50, ,830 1,830,000 8/15/ ,580 47,580 1,830, ,410 2/15/ ,000 47, ,580 1,705,000 8/15/ ,330 44,330 1,705, ,910 2/15/ ,000 44, ,330 1,580,000 8/15/ ,080 41,080 1,580, ,410 2/15/ ,000 41, ,080 1,445,000 8/15/ ,570 37,570 1,445, ,650 2/15/ ,000 37, ,570 1,310,000 8/15/ ,060 34,060 1,310, ,630 2/15/ ,000 34, ,060 1,175,000 8/15/ ,550 30,550 1,175, ,610 2/15/ ,000 30, ,550 1,040,000 8/15/ ,040 27,040 1,040, ,590 2/15/ ,000 27, , ,000 8/15/ ,140 23, , ,180 2/15/ ,000 23, , ,000 8/15/ ,500 19, , ,640 2/15/ ,000 19, , ,000 8/15/ ,250 16, , ,750 2/15/ ,000 16, , ,000 8/15/ ,000 13, , ,250 2/15/ ,000 13, , ,000 8/15/2030 9,750 9, , ,750 2/15/ ,000 9, , ,000
208 8/15/2031 6,500 6, , ,250 2/15/ ,000 6, , ,000 8/15/2032 3,250 3, , ,750 2/15/ ,000 3, , ,250 2,955,000 2,111,460 5,066,460 5,066,460
209 Merriweather Post Pavillion Phase III Construction Assumptions: $3.175 million in principal; 25 year term; semiannual interest payments 3,175, % 25 Total CY Principal Interest Total Pd Princ Balance Debt Service 8/15/ ,550 82,550 3,175,000 82,550 2/15/ ,000 82, ,550 3,050,000 8/15/ ,300 79,300 3,050, ,850 2/15/ ,000 79, ,300 2,925,000 8/15/ ,050 76,050 2,925, ,350 2/15/ ,000 76, ,050 2,800,000 8/15/ ,800 72,800 2,800, ,850 2/15/ ,000 72, ,800 2,675,000 8/15/ ,550 69,550 2,675, ,350 2/15/ ,000 69, ,550 2,550,000 8/15/ ,300 66,300 2,550, ,850 2/15/ ,000 66, ,300 2,425,000 8/15/ ,050 63,050 2,425, ,350 2/15/ ,000 63, ,050 2,300,000 8/15/ ,800 59,800 2,300, ,850 2/15/ ,000 59, ,800 2,175,000 8/15/ ,550 56,550 2,175, ,350 2/15/ ,000 56, ,550 2,050,000 8/15/ ,300 53,300 2,050, ,850 2/15/ ,000 53, ,300 1,925,000 8/15/ ,050 50,050 1,925, ,350 2/15/ ,000 50, ,050 1,800,000 8/15/ ,800 46,800 1,800, ,850 2/15/ ,000 46, ,800 1,675,000 8/15/ ,550 43,550 1,675, ,350 2/15/ ,000 43, ,550 1,550,000 8/15/ ,300 40,300 1,550, ,850 2/15/ ,000 40, ,300 1,425,000 8/15/ ,050 37,050 1,425, ,350 2/15/ ,000 37, ,050 1,300,000 8/15/ ,800 33,800 1,300, ,850 2/15/ ,000 33, ,800 1,175,000 8/15/ ,550 30,550 1,175, ,350 2/15/ ,000 30, ,550 1,050,000 8/15/ ,300 27,300 1,050, ,850 2/15/ ,000 27, , ,000 8/15/ ,050 24, , ,350 2/15/ ,000 24, , ,000 8/15/ ,800 20, , ,850 2/15/ ,000 20, , ,000 8/15/ ,290 17, , ,090 2/15/ ,000 17, , ,000 8/15/ ,780 13, , ,070 2/15/ ,000 13, , ,000 8/15/ ,270 10, , ,050 2/15/ ,000 10, , ,000
210 8/15/2032 6,760 6, , ,030 2/15/ ,000 6, , ,000 8/15/2033 3,250 3, , ,010 2/15/ ,000 3, , ,250 3,175,000 2,169,700 5,344,700 5,344,700
211 Merriweather Post Pavillion Phase IV Construction Assumptions: $4.81 million in principal; 25 year term; semiannual interest payments 4,810, % 25 Total CY Principal Interest Total Pd Princ Balance Debt Service 8/15/ , ,060 4,810, ,060 2/15/ , , ,060 4,620,000 8/15/ , ,120 4,620, ,180 2/15/ , , ,120 4,430,000 8/15/ , ,180 4,430, ,300 2/15/ , , ,180 4,280,000 8/15/ , ,280 4,280, ,460 2/15/ , , ,280 4,140,000 8/15/ , ,640 4,140, ,920 2/15/ , , ,640 4,000,000 8/15/ , ,000 4,000, ,640 2/15/ , , ,000 3,860,000 8/15/ , ,360 3,860, ,360 2/15/ , , ,360 3,720,000 8/15/ ,720 96,720 3,720, ,080 2/15/ ,000 96, ,720 3,580,000 8/15/ ,080 93,080 3,580, ,800 2/15/ ,000 93, ,080 3,380,000 8/15/ ,880 87,880 3,380, ,960 2/15/ ,000 87, ,880 3,180,000 8/15/ ,680 82,680 3,180, ,560 2/15/ ,000 82, ,680 2,980,000 8/15/ ,480 77,480 2,980, ,160 2/15/ ,000 77, ,480 2,755,000 8/15/ ,630 71,630 2,755, ,110 2/15/ ,000 71, ,630 2,530,000 8/15/ ,780 65,780 2,530, ,410 2/15/ ,000 65, ,780 2,305,000 8/15/ ,930 59,930 2,305, ,710 2/15/ ,000 59, ,930 2,080,000 8/15/ ,080 54,080 2,080, ,010 2/15/ ,000 54, ,080 1,855,000 8/15/ ,230 48,230 1,855, ,310 2/15/ ,000 48, ,230 1,630,000 8/15/ ,380 42,380 1,630, ,610 2/15/ ,000 42, ,380 1,405,000 8/15/ ,530 36,530 1,405, ,910 2/15/ ,000 36, ,530 1,180,000 8/15/ ,680 30,680 1,180, ,210 2/15/ ,000 30, , ,000 8/15/ ,830 24, , ,510 2/15/ ,000 24, , ,000 8/15/ ,630 19, , ,460 2/15/ ,000 19, , ,000 8/15/ ,430 14, , ,060 2/15/ ,000 14, , ,000
212 8/15/2033 9,230 9, , ,660 2/15/ ,000 9, , ,000 8/15/2034 4,030 4, , ,260 2/15/ ,000 4, , ,030 4,810,000 3,405,740 8,215,740 8,215,740
213 Merriweather Post Pavillion Phase V Construction Assumptions: $1.64 million in principal; 25 year term; semiannual interest payments 1,640, % 25 Total CY Principal Interest Total Pd Princ Balance Debt Service 8/15/ ,640 42,640 1,640,000 42,640 2/15/ ,000 42, ,640 1,580,000 8/15/ ,080 41,080 1,580, ,720 2/15/ ,000 41, ,080 1,520,000 8/15/ ,520 39,520 1,520, ,600 2/15/ ,000 39,520 99,520 1,460,000 8/15/ ,960 37,960 1,460, ,480 2/15/ ,000 37,960 97,960 1,400,000 8/15/ ,400 36,400 1,400, ,360 2/15/ ,000 36, ,400 1,335,000 8/15/ ,710 34,710 1,335, ,110 2/15/ ,000 34,710 99,710 1,270,000 8/15/ ,020 33,020 1,270, ,730 2/15/ ,000 33,020 98,020 1,205,000 8/15/ ,330 31,330 1,205, ,350 2/15/ ,000 31,330 96,330 1,140,000 8/15/ ,640 29,640 1,140, ,970 2/15/ ,000 29,640 94,640 1,075,000 8/15/ ,950 27,950 1,075, ,590 2/15/ ,000 27,950 92,950 1,010,000 8/15/ ,260 26,260 1,010, ,210 2/15/ ,000 26,260 96, ,000 8/15/ ,440 24, , ,700 2/15/ ,000 24,440 94, ,000 8/15/ ,620 22, , ,060 2/15/ ,000 22,620 92, ,000 8/15/ ,800 20, , ,420 2/15/ ,000 20,800 90, ,000 8/15/ ,980 18, , ,780 2/15/ ,000 18,980 88, ,000 8/15/ ,160 17, , ,140 2/15/ ,000 17,160 87, ,000 8/15/ ,340 15, , ,500 2/15/ ,000 15,340 85, ,000 8/15/ ,520 13, ,000 98,860 2/15/ ,000 13,520 83, ,000 8/15/ ,700 11, ,000 95,220 2/15/ ,000 11,700 76, ,000 8/15/ ,010 10, ,000 86,710 2/15/ ,000 10,010 75, ,000 8/15/2031 8,320 8, ,000 83,330 2/15/ ,000 8,320 73, ,000 8/15/2032 6,630 6, ,000 79,950 2/15/ ,000 6,630 71, ,000 8/15/2033 4,940 4, ,000 76,570 2/15/ ,000 4,940 69, ,000
214 8/15/2034 3,250 3, ,000 73,190 2/15/ ,000 3,250 68,250 60,000 8/15/2035 1,560 1,560 60,000 69,810 2/15/ ,000 1,560 61,560-61,560 1,640,000 1,119,560 2,759,560 2,759,560

215 Community Performing Arts Facilities Business Planning a business plan for new performing arts facilities Our final piece of work is a preliminary business plan for the new performing arts facilities recommended in our Needs Assessment. Now, we develop an operational concept for these facilities that is not sitespecific but is intended to guide the County in their potential development. We will consider how new facilities might be owned and operated, and how they might operate and be sustained on an ongoing basis. And, once again, we will inform this analysis with a series of comparable community-based performing arts centers. Comparable Projects Research on comparable arts centers is intended to inform recommendations on governance and operating models, the scheduling of facilities, levels of utility and cost, the impact of new facilities on the region, partnerships used to develop and sustain new facilities and key factors that lead to successful operation of facilities. The Blowing Rock Community Arts Center, Blowing Rock, NC Groundbreaking for the Blowing Rock Community Arts Center (BRCAC) is scheduled for April The design is for a 26,000 square foot facility to be built on a 3.5-acre site at a projected cost of $8 million, including an endowment. The BRCAC Foundation, Inc., a not-forprofit trust formed to promote the advancement of all the cultural arts in Blowing Rock and the North Carolina High Country, along with a capital campaign committee has garnered $7.1 million in pledges towards its $8 million goal. The facility, designed by the North Carolina architectural firm LS3P Associates, will have two theaters: a 350 seat theater with a proscenium-style stage and fly space, and a 120-seat second stage. Also included is a banquet room, conference rooms, kitchen, storage and a galley-style lobby. The Webb Management Services, Inc. 1 February 2005

216 Community Performing Arts Facilities Business Planning designated space for the banquet room, kitchen and conference rooms will be a multi use section of the structure also used for children s theater and rehearsals. The land for the BRCAC was provided through the efforts of the Blowing Rock Stage Company, who led a drive not only to purchase the land but also to complete the initial grading at the site. Management of the Center is through the BRCAC Foundation, Inc. An integral part of the Board s job has been, and will continue to be, to raise awareness and support for the development, construction, and maintenance of the new Arts Center. Once the facility is completed, the Foundation will continue to be involved in overseeing the management and well being of the facility. The BRCAC will provide a permanent home for a multitude of arts groups, including the Blowing Rock Stage Company, and a facility in which to host live theater, dance groups, a variety of musical performances, visual arts displays, and children s theater and workshops. In addition it will offer a gathering place for civic and cultural activities as well as a resource for local commercial interests. In fiscal year 2003, revenues for BRCAC were $673,116, expenses were $226,800, assets were $1,856,270, and liabilities were $1,957. Of the listed assets, fixed assets were $1,454,458. Louise Hopkins Underwood Center for the Arts, Lubbock, Texas The Louise Hopkins Underwood Center for the Arts (LHUCA), formerly the Lubbock Regional Arts Center, incorporated as a nonprofit organization in 1997 with the goal of developing a multipurpose arts center that would be affordable both in its construction and in its use by local artists, arts groups, and audiences. After extensive interviews within the community, the Center s Board commissioned a conceptual design from Texas Tech University s College of Architecture Community Design Studio (CDS) to help them determine the optimal program requirements for administrative, exhibition, and performance space. The CDS worked with the goal of helping the Center determine an appropriate program and site location that would result in an affordable and sustainable regional visual and performing arts facility equipped to serve the local community and the people of the greater South Plains area. Of the several sites under consideration, the Center chose an adaptive re-use of the existing Lubbock Fire Department Administration Building as the best means to achieve its goals. In addition to its offices, the existing 20,000 square foot facility contained a two-bay storage garage and a four-bay repair Webb Management Services, Inc. 2 February 2005

217 Community Performing Arts Facilities Business Planning shop. The large bay areas, originally designed to support the structure without evenly-spaced supporting columns, were ideal for conversion to performance and visual arts spaces. Albeit in a one story facility, the Center, as designed by Hardy, Holzman and Pfeiffer Associates, converted one of its garage wings into a 100-seat informal, experimental theater, and the other into an art gallery to support exhibitions, art classes, films and meetings, with the area in between programmed for the lobby, public restrooms, offices, and a catering kitchen. Owned and operated by Lubbock Regional Arts Center, Inc., the Center is run by 3 full-time employees: an executive director, a coordinator for operations and development, and a custodian. The Center is home to six resident nonprofits that lease subsidized office or studio space. In addition to its performance and gallery functions, The Center serves as an incubator for nonprofits, providing resources and counsel on nonprofit business practices. Renovations this year consist of turning the south garage area into a 150-seat theater. Additionally, the footprint of the building will increase with the addition of a new exhibition hall on the west side. Plans are also underway to convert the former Borden s Dairy plant into a rehearsal hall with up to three rehearsal spaces. Another renovation project is the conversion of the former Borden s truck service garage. This concrete block building will be gutted and recreated as a clay studio, complete with wheels, slab tables, glazing and mixing room, and kiln room and yard. The Courtyard Theatre, Plano, Texas The Courtyard Theatre, located in Plano, Texas, is a 325-seat theater with an adjacent shop, dressing rooms, and a lobby with gallery space. Through the support of the City of Plano and the visionary leadership of the arts community, the City Council approved the $4.6 million restoration of the Cox Gymnasium in 1999 that became the Courtyard. A 1938 Works Progress Administration project, the Cox Gymnasium has been a significant building in Plano s history, and has long exemplified the cultural and social heritage of Plano. The Courtyard Theater is located in the Haggard Park Historic District, immediately adjacent to the downtown area. To secure the use of the gymnasium and former school administration buildings for the Courtyard Theater, an agreement was reached between the City of Plano and the Plano Independent School District giving the District priority to secure 10 dates in the theater per year. The primary user of the facility, the Plano Repertory Theater (PRT), moved its mainstage series to the new space and is given priority for up to 36 weeks in the theater. Other Webb Management Services, Inc. 3 February 2005

218 Community Performing Arts Facilities Business Planning users have the ability to book the remaining open dates, with priority given to resident groups and other nonprofit arts organizations first. Governance of the Courtyard Theater is managed by the City of Plano under the Department of Parks and Recreation. The City s goals are: to make the Center as inclusive as possible; that the cost of access, for both audiences and users, is kept to a reasonable cost; and that the Center is maintained professionally, with a sustainable annual investment from the community. An advisory board, with representation from the resident arts groups, the School District, and community act as a policy-maker for access and scheduling. In fiscal year 2002, revenues for the Artscentre of Plano, Inc. were $393,982, expenses were $348,080, assets were $1,212,603 and total liabilities were $474,550. Of the listed assets, fixed assets were $1,196,432. Schaumburg Prairie Center for the Arts, Schaumburg, Illinois The Schaumburg Prairie Center for the Arts is owned and operated by the Village of Schaumburg and is located 30 miles northwest of Chicago, IL. The facility was built in 1986 for $2.5 million and funds for the construction were supplied from developer s assessments. A second building project, including video production equipment, was completed for $3 million. A lot of art venues, especially in the suburbs, aren't able to capture much profit, said Ken Fritz, village manager of Schaumburg. Government ownership provides stability and a source of funds necessary to keep the venue running. Fritz said the village earmarks about $600,000 a year for the center. The rest of the center s $2.4 million budget comes from ticket sales, grants and fund-raising. The Prairie Center serves as the hub of arts activities in the Northwest suburbs of Chicago; music, theatre, dance, film, storytelling, children s performances and the visual arts are offered year round in the Center s 442-seat theatre, 100-seat lecture hall, outdoor stage and gallery. In addition, a fully equipped video production studio provides capabilities for the development of a variety of special interest programs. The Center houses a local cable access station, rehearsal space, a lecture room, kitchen, exhibition area, and offices as well as meeting rooms. The facility is located on municipal grounds with a small outdoor stage and sculpture park. A system of shared lots allows for easy access and parking for various parts of the building. Webb Management Services, Inc. 4 February 2005


219 Community Performing Arts Facilities Business Planning In the past 19 years, the Prairie Center has started a juried fine arts festival, a Shakespeare in the Park program, an international sculpture park and a wide range of youth activities. The Center has been the home of performances by the Schaumburg Youth Orchestra, Schaumburg Summer Theatre, Schaumburg Dance Ensemble and Storytelling Festival. The Center presents jazz, dance, contemporary, international, Broadway, and entertainment programs September through May. Special holiday programs, children s events, and concerts by the Elgin Symphony Orchestra supplement the yearly calendar. More than 10,000 young people have joined in the various arts programs, and another 88,000 people have attended the performances at the Prairie Center. Arvada Performing Arts Center, Arvada, Colorado The Arvada Center for the Arts and Humanities was founded in 1976, and has grown to be the eighth largest cultural attraction in the Denver area. The Center offers a wide variety of concerts, gallery exhibitions, and more than 600 classes each year in the arts and humanities. In addition, it hosts an historical museum, a banquet hall and has a unique playground that is accessible to children with disabilities. As one of the two nonprofit, professional Equity theaters in the state of Colorado, the Arvada Center held 424 performances in 2003 for a total of 165,814 attendees. The Center has undertaken significant expansion and program upgrades since the opening of the facility in In 1992, 52,000 square feet was added to the facility, which included the banquet hall, conference rooms, and a 600-seat covered amphitheater, which accommodates an additional 600 attendees on the lawn. The ADA accessible playground was added in 1998 and the original 498-seat theater was renovated in Currently, the Center is in schematic design for an additional two phases of expansion. The first phase is anticipated to be complete by 2006 and adds 100,000 additional square feet to the facility for a cost of $45 million. Phase II is anticipated to be complete by 2018 at a cost still to be determined. It is envisioned that these phases will provide a new entry from Wadsworth Boulevard (east of the current entry), expanded parking to Webb Management Services, Inc. 5 February 2005
History of the Fox Theater:
 Donor Prospectus History of the Fox Theater: The Fox Theater was built in 1928 and designed by the well-known Los Angeles-based architects Clifford Balch and engineer Floyd E. Stanberry, who were responsible
Before the FEDERAL COMMUNICATIONS COMMISSION Washington, DC 20554
 Before the FEDERAL COMMUNICATIONS COMMISSION Washington, DC 20554 In the Matter of Wireless Microphones Proceeding Revisions to Rules Authorizing the Operation of WT Docket No. 08-166 Low Power Auxiliary
FIVE FLAGS CENTER FEASIBILITY STUDY REPORT
 FIVE FLAGS CENTER FEASIBILITY STUDY REPORT The FFCC has long-served as an important community asset for Dubuque and its residents. Its long history can be traced back to the mid-1800 with the opening of
DURHAM ARTS CENTER STUDY FINAL PRESENTATION. January 21, 2003
 DURHAM ARTS CENTER STUDY FINAL PRESENTATION January 21, 2003 DURHAM ARTS CENTER STUDY Needs Assessment Summary Needs Assessment Final Conclusions: The market for the arts is large and growing, with an
CASE for SUPPORT SETTING THE STAGE THE CAMPAIGN FOR NEWPORT S OPERA HOUSE THEATER
 CASE for SUPPORT SETTING THE STAGE THE CAMPAIGN FOR NEWPORT S OPERA HOUSE THEATER Constructed in 1867, the Opera House Theater is among the 10 oldest surviving opera houses in America and the oldest surviving
Warren County Port Authority
 Warren County Port Authority Arts & Culture Center Feasibility Study Phase 3 Findings September 8, 2008 Contents/Agenda Review Phase 2 Public Survey Model Case Studies Phase 3 Building Program Capital
Central Social Districts: more details and discussion
 Central Social Districts: more details and discussion N. David Milder 718-805-9507 www.ndavidmilder.com dmilder@gmail.co Presented to The IIRA 28th Annual Rural Community and Economic Development Conference
Musicians, Singers, and Related Workers
 http://www.bls.gov/oco/ocos095.htm Musicians, Singers, and Related Workers * Nature of the Work * Training, Other Qualifications, and Advancement * Employment * Job Outlook * Projections Data * Earnings
Libraries. Goals. The City will:
 Libraries Goals The City will: Provide adequate public facilities and services for all services which the City provides. Coordinate the location and design of all City public facilities with the goals
The Council would like to know if you think it should provide this ongoing support to the Hawera Cinema 2 Trust.
 Page 1 of 8 Introduction In March 2007 the South Taranaki District Council (the Council) purchased the Hawera Cinema 2 (the Cinema) complex for $1 million to keep the facility operating. The Council of
WESTERN PLAINS LIBRARY SYSTEM COLLECTION DEVELOPMENT POLICY
 Policy: First Adopted 1966 Revised: 10/11/1991 Revised: 03/03/2002 Revised: 04/14/2006 Revised: 09/10/2010 WESTERN PLAINS LIBRARY SYSTEM COLLECTION DEVELOPMENT POLICY I. MISSION AND STATEMENT OF PURPOSE
DIGITAL TELEVISION: MAINTENANCE OF ANALOGUE TRANSMISSION IN REMOTE AREAS PAPER E
 Office of the Minister of Broadcasting Chair Economic Development Committee DIGITAL TELEVISION: MAINTENANCE OF ANALOGUE TRANSMISSION IN REMOTE AREAS PAPER E Purpose 1. This paper is in response to a Cabinet
PRODUCTION SPECS PACKET
 PRODUCTION SPECS PACKET ADDRESS: Merriweather Post Pavilion 10475 Little Patuxent Parkway Columbia, Maryland 21044 Venue Phone: 410-415-5550 Venue Fax: 410-415-5560 Web Site: www.merriweathermusic.com
Join us for our. A Campaign to Evolve, Elevate, and Inspire
 Join us for our A Campaign to Evolve, Elevate, and Inspire 2 Evolve. Elevate. Inspire. For 166 years the Fulton Theatre has been a home for the performing arts in Lancaster, PA. Please join us as we continue
COLLECTION DEVELOPMENT
 10-16-14 POL G-1 Mission of the Library Providing trusted information and resources to connect people, ideas and community. In a democratic society that depends on the free flow of information, the Brown
Collection Management Policy
 Collection Management Policy 9/26/2017 INTRODUCTION Collection management encompasses all activities that create and maintain the material holdings that comprise the collection of Henrico County Public
INVESTING for GROWTH. The Marcus Corporation. Gabelli & Company Inaugural Movie Conference March 12, 2009
 INVESTING for GROWTH The Marcus Corporation Gabelli & Company Inaugural Movie Conference March 12, 2009 Forward-Looking Statement Certain matters discussed in this presentation are forward-looking statements
THEATRE DIRECTOR, Beck Theatre
 THEATRE DIRECTOR, Beck Theatre JOB DESCRIPTION HQ Theatres & Hospitality (HQT&H), the venue management division of the Qdos Entertainment Group, is the UK s second largest theatre operator, with a portfolio
THE HELEN HAYES AWARDS POLICIES & PROCEDURES. (revised November 2016)
") THE HELEN HAYES AWARDS POLICIES & PROCEDURES (revised November 2016) THE HELEN HAYES AWARDS The story of the Helen Hayes Awards begins in the early 1980s, when theatre producers Bonnie Nelson Schwartz
THE HELEN HAYES AWARDS POLICIES & PROCEDURES (revised November 2016) THE HELEN HAYES AWARDS The story of the Helen Hayes Awards begins in the early 1980s, when theatre producers Bonnie Nelson Schwartz
Ensure Changes to the Communications Act Protect Broadcast Viewers
 Ensure Changes to the Communications Act Protect Broadcast Viewers The Senate Commerce Committee and the House Energy and Commerce Committee have indicated an interest in updating the country s communications
DRAFT Sandown Cable Access Board Meeting Town of Sandown, NH
 1 2 3 DRAFT Sandown Cable Access Board Meeting Town of Sandown, NH 4 5 6 7 8 9 10 11 12 13 14 15 16 17 18 19 20 21 22 23 24 25 26 27 28 Meeting Date: Tuesday, September 24, 2013 Type of Meeting: Public
Scheme MOT Facility Improvements
 Scheme Houston Zoo McGovern Lake Reflection Pool 9 The Lake Plaza 0 8 Hermann Park Golf Course 0 00 00 00 Legend. MOT Facility Improvements. MOT Concession Area. VIP Suites. Expanded Theatre Seating. Parking
Maui OnStage Sponsorship Opportunities
 Maui OnStage ship Opportunities Reflecting on the Past to Create the Future on s a e S 18 0 2 7 201 With Your Support, Maui OnStage will Reflect on the Past to Create the Future with our 2017-2018 Season
(2) provide notice to the public about the availability of these features; and
 provide notice to the public about the availability of these features; and") 1 of 5 12/12/2016 2:21 PM U.S. Department of Justice Civil Rights Division Questions and Answers about the Department of Justice s Final Rule Under Title III of the ADA Requiring Movie Theaters to Provide
1 of 5 12/12/2016 2:21 PM U.S. Department of Justice Civil Rights Division Questions and Answers about the Department of Justice s Final Rule Under Title III of the ADA Requiring Movie Theaters to Provide
Abbeville Opera House Impact Study
 Abbeville Opera House Impact Study This Study has been developed in order to gauge the current Economic Impact of the Opera House on the Abbeville County, vs its potential impact. Prepared by the Abbeville
The Lerbäck theatre barn conversion of an old barn into a theatre
 This series of informative fiches aim to present, in summary, examples of practices and approaches that EU Member States and Regions have put in place in order to implement their Rural Development Programmes
Honorable Mayor and Members of the City Council. Submitted by: Scott Ferris, Acting Director, Parks, Recreation & Waterfront
 Office of the City Manager CONSENT CALENDAR November 27, 2012 To: From: Honorable Mayor and Members of the City Council Christine Daniel, City Manager Submitted by: Scott Ferris, Acting Director, Parks,
Community Meeting October 30, 2013
 Community Meeting October 30, 2013 Who We Are The mission of Falmouth Memorial Library is to enrich the community by providing resources and services that foster a love of reading and inspire imagination,
SEARCHLIGHT RECRUITMENT
 Position Specification BUSINESS NAME Calgary International Film Festival Society JOB NAME Artistic Director (NOC 0512) LOCATION 214 11 th Avenue SE COMPANY WEBSITE https://www.calgaryfilm.com/ TOURISM
Licensing & Regulation #379
 Licensing & Regulation #379 By Anita Gallucci I t is about three years before your local cable operator's franchise is to expire and your community, as the franchising authority, receives a letter from
The Sherman Theater Complex Culture and Commerce Enriching Community
 The Sherman Theater Complex Culture and Commerce Enriching Community The Sherman Theater a Community Treasure Entertainment, news, respite from daily cares and a gathering place for friends and family.
Street Theater. New Broadway Theater Anchors New Downtown District GTS Development LLC September 20, 2017
 Street Theater New Broadway Theater Anchors New Downtown District Speakers Stephen L. Swisher, AIA LEED AP Lead Principal-GTS Development, LLC Justin Belliveau Former Chief Administrative Officer- Salt
APPENDIX B. Standardized Television Disclosure Form INSTRUCTIONS FOR FCC 355 STANDARDIZED TELEVISION DISCLOSURE FORM
 APPENDIX B Standardized Television Disclosure Form Federal Communications Commission Washington, D.C. 20554 Not approved by OMB 3060-XXXX INSTRUCTIONS FOR FCC 355 STANDARDIZED TELEVISION DISCLOSURE FORM
2014 Event Sponsorship Packet
 2014 Event Sponsorship Packet Sat. September 27th Sat. December 6th Destination Downtown South Boston, Inc. 432 Main Street South Boston, VA 24592 Phone: 434-575-4209 Fax: 434-575-4275 Web: downtownsobo.com
Submit Organizational Chart : 17Admin177_SubmitOrganizationalChart_ pdf
 Report Submission - ID: 17Admin177 Author(s): Hannah Singleton Unit of Analysis ID Number: 145 Sector: Provost's Office Division : College of Visual & Performing Arts Unit for Assessment: Dennison Theatre
The Cynthia Woods Mitchell Pavilion Frequently Asked Questions
 The Cynthia Woods Mitchell Pavilion Frequently Asked Questions 1. What is The Cynthia Woods Mitchell Pavilion? The Pavilion is an outdoor amphitheater that hosts an array of performing arts and contemporary
Akron-Summit County Public Library. Collection Development Policy. Approved December 13, 2018
 Akron-Summit County Public Library Collection Development Policy Approved December 13, 2018 COLLECTION DEVELOPMENT POLICY TABLE OF CONTENTS Responsibility to the Community... 1 Responsibility for Selection...
SALES DATA REPORT
 SALES DATA REPORT 2013-16 EXECUTIVE SUMMARY AND HEADLINES PUBLISHED NOVEMBER 2017 ANALYSIS AND COMMENTARY BY Contents INTRODUCTION 3 Introduction by Fiona Allan 4 Introduction by David Brownlee 5 HEADLINES
Lincoln Theatre Company
 Lincoln Theatre Company General Information Contact Information Nonprofit Lincoln Theatre Company Address 2351 Walden View Ln. Lincoln, CA 95648 Phone (916) 409-7030 Web Site www.lincolntheatrecompany.org
PRODUCTION SPECS PACKET
 PRODUCTION SPECS PACKET ADDRESS: Merriweather Post Pavilion Venue Phone: 410-715-5550 10475 Little Patuxent Parkway Venue Fax: 410-715-5560 Columbia, Maryland 21044 Web Site: www.merriweathermusic.com
The Executive Summary of Senate Bill 2106
 Overview Thanks to the leadership provided by Senator Garrett and Representative Daniel Biss, Senate Bill 2106 is a huge boon for small businesses, local governments, the environment and residents of the
LOW-BUDGET INDEPENDENT FEATURE FILM ASSISTANCE PROGRAM GUIDELINES FOR
 LOW-BUDGET INDEPENDENT FEATURE FILM ASSISTANCE PROGRAM GUIDELINES FOR 2002-2003 These Guidelines are specific to the terms and conditions of the program for the fiscal year of 2002-2003 (which ends on
Southbank Centre Business Model Case Study
 Southbank Centre Business Model Case Study Mark Robinson, Thinking Practice Published 2016 This work is licensed under a Creative Commons Attribution-ShareAlike 2.0 UK: England & Wales License Southbank
- 1 - LICENSEE S INFORMATION: (Please complete all for processing) Licensee s Name: Licensee s Address: City, State, Zip Code:
 Licensee s Name: Licensee s Address: City, State, Zip Code:") SOLVANG FESTIVAL THEATER APPLICATION AND STANDARD LICENSE AGREEMENT FOR USE OF SOLVANG FESTIVAL THEATER FACILITIES This document, when properly executed by all parties, represents permission by Solvang
SOLVANG FESTIVAL THEATER APPLICATION AND STANDARD LICENSE AGREEMENT FOR USE OF SOLVANG FESTIVAL THEATER FACILITIES This document, when properly executed by all parties, represents permission by Solvang
Your Name/Organization: (Name of Person, Company, or Organization legally bound by the rental contract (Licensee))
)") RENTAL REQUEST FORM Your Name/Organization: (Name of Person, Company, or Organization legally bound by the rental contract (Licensee)) Name of Person, Company, or Organization appearing at event if different
RENTAL REQUEST FORM Your Name/Organization: (Name of Person, Company, or Organization legally bound by the rental contract (Licensee)) Name of Person, Company, or Organization appearing at event if different
The ABC and the changing media landscape
 The ABC and the changing media landscape 1 THE ABC AND THE MEDIA LANDSCAPE The Australian media is and always has been characterised by a mix of publicly-funded broadcasters and commercial media operators.
F I L M S T U D I O G R O U P
 Studio Group Film Studio Group Film Studio Group (FSG), a Los Angeles-based studio and services. FSG offers comprehensive studio development, management and consulting company, was formed in 2002 in response
AMPHITHEATRE APPLICATION & INFORMATION. types of performances. Concessions facilities and limited restroom facilities are provided.
 AMPHITHEATRE APPLICATION & INFORMATION The floating stage has 1,600 square feet of performance space under the retractable vinyl fabric canopy and 300 square feet of back stage, including two small dressing
Date Effected May 20, May 20, 2015
 1. Purpose of the The Niagara Falls Board (hereinafter the Board ) has approved the to support its mission to be an informational, educational, cultural and recreational resource valued by the Niagara
City of Kingston Report to Council Report Number
 City of Kingston Report to Council Report Number 18-089 To: From: Resource Staff: Date of Meeting: Subject: Executive Summary Mayor and Members of Council Lanie Hurdle, Commissioner, Community Services
OICF Grant Catalogue Proposal Actors Theater Theatrical Lighting Replacement Project
 OICF Grant Catalogue Proposal Actors Theater Theatrical Lighting Replacement Project Project Description: New Theater Lighting for Actors Theater- This project will replace the current lights with new
Request for Proposals Fiber Optic Network Backbone Upgrades
 Introduction Request for Proposals Fiber Optic Network Backbone Upgrades RFP Released on February 18, 2015 The Dexter R-11 Public School District is seeking proposals from qualified service providers to
LOCATION OWNER S GUIDE
 LOCATION OWNER S GUIDE What you need to know if a production company comes calling Millions of dollars are added to the state s economy each year by film and video production companies and commercial still
SHORT TERM THEATRE RENTAL RENTAL PACKET (For Tenant & Non-Tenant Use)
") SHORT TERM THEATRE RENTAL RENTAL PACKET (For Tenant & Non-Tenant Use) We are pleased that you are interested in using one of our spaces for Event. Please carefully read all of the information and complete
SHORT TERM THEATRE RENTAL RENTAL PACKET (For Tenant & Non-Tenant Use) We are pleased that you are interested in using one of our spaces for Event. Please carefully read all of the information and complete
Arch 464 ECS Spring 2017
 1 Arch 464 ECS Spring 017 Name Quiz #4 "MPLS by KPMB" Read and look at everything before you write! For this problem you are an acoustics critic for the Minneapolis StarTribune. Illustrations and text
Australian Broadcasting Corporation. Department of Broadband, Communications and the Digital Economy
 Australian Broadcasting Corporation submission to Department of Broadband, Communications and the Digital Economy Response to the Discussion Paper Content and access: The future of program standards and
A breathtaking venue for your signature event.
 A breathtaking venue for your signature event. We are thrilled that you are interested in hosting an event at the Georgia Museum of Art, which is among the top rental facilities in the area. We hope that
SAMPLE COLLECTION DEVELOPMENT POLICY
 This is an example of a collection development policy; as with all policies it must be reviewed by appropriate authorities. The text is taken, with minimal modifications from (Adapted from http://cityofpasadena.net/library/about_the_library/collection_developm
Next generation digital television: New pathways to grow service
 O V E RVI E W Next generation digital television: New pathways to grow service SUMMAR Y OF OUTCOMES FROM THE PUBLIC M EDIA COM P AN Y C O NFERENC E S ON AT SC 3.0 PREPARED BY Marc Hand, CEO & Co-founder,
Australian Chamber Choir Regional Performance and Relationship Model
 Australian Chamber Choir Regional Performance and Relationship Model (RPRModel) Purpose The ACC Regional Performance and Relationship Model (RPRModel) has been designed as a marketing and communications
NOW THEREFORE, in consideration of the mutual covenants and conditions herein contained, the parties hereto do hereby agree as follows:
 NOW THEREFORE, in consideration of the mutual covenants and conditions herein contained, the parties hereto do hereby agree as follows: ARTICLE 1 RECOGNITION AND GUILD SHOP 1-100 RECOGNITION AND GUILD
HOLLYWOOD FOREIGN PRESS ASSOCIATION GOLDEN GLOBE AWARD CONSIDERATION RULES
 Motion Pictures Eligibility: HOLLYWOOD FOREIGN PRESS ASSOCIATION GOLDEN GLOBE AWARD CONSIDERATION RULES 1. Feature-length motion pictures (70 minutes or longer) that have been both released and screened
Broadcasting Decision CRTC
 Broadcasting Decision CRTC 2018-307 PDF version References: 2017-365, 2017-365-1 and 2017-365-2 Ottawa, 23 August 2018 Vues & Voix Across Canada Public record for this application: 2017-0643-3 Public hearing
LICENSEE S INFORMATION: (Please complete all for processing)
") SOLVANG FESTIVAL THEATER APPLICATION AND STANDARD LICENSE AGREEMENT FOR USE OF SOLVANG FESTIVAL THEATER FACILITIES This document, when properly executed by all parties, represents permission by Solvang
SOLVANG FESTIVAL THEATER APPLICATION AND STANDARD LICENSE AGREEMENT FOR USE OF SOLVANG FESTIVAL THEATER FACILITIES This document, when properly executed by all parties, represents permission by Solvang
House of Lords Select Committee on Communications
 House of Lords Select Committee on Communications Inquiry into the Sustainability of Channel 4 Submission from Ben Roberts, Director BFI Film Fund on behalf of the British Film Institute Summary 1. In
BUFORD COMMUNITY CENTER, TOWN PARK & THEATRE THEATRE AND STAGE RENTAL AGREEMENT
 Revised December 28, 2016 BUFORD COMMUNITY CENTER, TOWN PARK & THEATRE THEATRE AND STAGE RENTAL AGREEMENT Facility Usage Usage of the theatre and stage facilities for production of a performance is subject
 Seat Sponsorship Program for Harbourfront Theatre Dear Friends, With a vision by Summerside citizens to create a state-of-the-art, multi-purpose facility in Prince County, Harbourfront Theatre opened its
Annual Review of Program Data (ARPD) Due Date: February 15, 2015
 Due Date: February 15, 2015") Annual Review of Program Data (ARPD) Due Date: February 15, 2015 Program/Area/Unit Name: Theatre Academic Services Program/Area/Unit Description: The Leeward Theatre was founded on the campus of Leeward
Annual Review of Program Data (ARPD) Due Date: February 15, 2015 Program/Area/Unit Name: Theatre Academic Services Program/Area/Unit Description: The Leeward Theatre was founded on the campus of Leeward
SHOW DIRECTOR CONTRACT
 SHOW DIRECTOR CONTRACT This agreement is made and entered, 20, by and between the BEAVER DAM AREA COMMUNITY THEATER, INC., hereinafter referred to as BDACT and, hereinafter referred to as Director. BDACT
COLLECTION DEVELOPMENT POLICY
 COLLECTION DEVELOPMENT POLICY Our Area of Service: The Hawarden Public Library serves the community of Hawarden which has a population of 2,543 according to the 2010 census. We also serve the neighboring
Planning by the Groningen Arts Centre
 Planning by the Groningen Arts Centre Another opportunity During a meeting on Tuesday, April 6, 1999, executives of the Groningen Arts Centre raised a number of points, including the following. Karin of
Broadcasting Decision CRTC
 Broadcasting Decision CRTC 2017-145 PDF version References: 2016-225, 2016-225-1, 2016-225-2, 2016-225-3 and 2016-225-4 Ottawa, 15 May 2017 Corus Entertainment Inc. Across Canada Application 2016-0022-1
Post of THEATRE DIRECTOR, Swindon Theatres
 Post of THEATRE DIRECTOR, Swindon Theatres JOB DESCRIPTION HQ Theatres & Hospitality (HQT&H), the venue management division of the Qdos Entertainment Group, is the UK s second largest theatre operator,
All members as well as the current production cast and crew may participate in all social events planned by the Masquers.
 THE OPERATING PROCEDURES OF THE MASQUERS PLAYHOUSE, INC. These operating procedures describe the activities of the Masquers Playhouse, Inc., explaining the privileges and responsibilities of membership,
Sarasota County Public Library System. Collection Development Policy April 2011
 Sarasota County Public Library System Collection Development Policy April 2011 Sarasota County Libraries Collection Development Policy I. Introduction II. Materials Selection III. Responsibility for Selection
Cable Rate Regulation Provisions
 Maine Policy Review Volume 2 Issue 3 1993 Cable Rate Regulation Provisions Lisa S. Gelb Frederick E. Ellrod III Follow this and additional works at: http://digitalcommons.library.umaine.edu/mpr Part of
Season Submission Guidelines
 2017-18 Season Submission Guidelines About CoHo Productions and the CoHo theater For 21 years, CoHo Productions has pioneered artist led co-production as a model of creating theatre. Each season, CoHo
COLLECTION DEVELOPMENT POLICY
 COLLECTION DEVELOPMENT POLICY Doherty Library This policy has been in effect since June 1987 It was reviewed without revision in September 1991 Revised October 1997 Revised September 2001 Revised April
City Screens fiscal 1998 MD&A and Financial Statements
 City Screens fiscal 1998 MD&A and Financial Statements Management's Discussion and Analysis (Note: Fiscal 1998 is for the year ending April 1, 1999) OPERATING RESULTS Revenues. Total revenues increased
The Eastern Shore Room Eastern Shore Public Library LOCAL HISTORY COLLECTION DEVELOPMENT POLICY
 The Eastern Shore Room Eastern Shore Public Library LOCAL HISTORY COLLECTION DEVELOPMENT POLICY This policy supplements the library s Collection Development Policy. BACKGROUND The Eastern Shore Room resides
AUSTRALIAN SUBSCRIPTION TELEVISION AND RADIO ASSOCIATION
 7 December 2015 Intellectual Property Arrangements Inquiry Productivity Commission GPO Box 1428 CANBERRA CITY ACT 2601 By email: intellectual.property@pc.gov.au Dear Sir/Madam The Australian Subscription
La Bohème. Cock Tavern Theatre
 La Bohème Cock Tavern Theatre 2009 La Bohème Soho Theatre 2010 The Coronation of Poppea King s Head Theatre 2011 The Elixir of Love King s Head Theatre 2013 Young Wife King s Head Theatre 2014 La Traviata
Metrotown Station and Exchange Upgrades
 Metrotown Station and Exchange Upgrades Welcome to the Metrotown Station and Exchange Upgrade Open House Purpose of the Open House: Inform neighbours, businesses and customers about: the conceptual design
The new BBC Scotland Channel: Proposed variation to Ofcom s Operating Licence for the BBC s public services. BBC Response
 The new BBC Scotland Channel: Proposed variation to Ofcom s Operating Licence for the BBC s public services BBC Response October 2018 Contents Contents... 1 Introduction... 2 Background... 2 Ofcom s consultation
COLLECTION DEVELOPMENT AND MANAGEMENT POLICY BOONE COUNTY PUBLIC LIBRARY
 COLLECTION DEVELOPMENT AND MANAGEMENT POLICY BOONE COUNTY PUBLIC LIBRARY APPROVED BY THE BOARD OF TRUSTEES, FEBRUARY 2015; NOVEMBER 2017 REVIEWED NOVEMBER 20, 2017 CONTENTS Introduction... 3 Library Mission...
The Telecommunications Act Chap. 47:31
 The Telecommunications Act Chap. 47:31 4 th September 2013 Presentation Overview Legislative Mandate Limitations of Telecommunications Act Proposed Amendments to Telecommunications Act New Technological
PALO ALTO HIGH SCHOOL Palo Alto Unified School District FACILITIES STEERING COMMITTEE MEETING. 11 May 2011, 3:30 5:00 pm
 PALO ALTO HIGH SCHOOL Palo Alto Unified School District FACILITIES STEERING COMMITTEE MEETING DATE: SUBJECT: 11 May 2011, 3:30 5:00 pm Palo Alto HS Facilities Steering Committee ATTENDEES: Sign-in sheet
INVESTOR PRESENTATION. March 2016
 INVESTOR PRESENTATION March 2016 DISCLAIMER Safe Harbor: - Some information in this report may contain forward-looking statements. We have based these forward looking statements on our current beliefs,
Lancaster Performing Arts Center RENTAL FEES and Policies
 Physical Address: Mailing Address: City of Lancaster 750 West Lancaster Blvd ATTN: LPAC Rental Office Lancaster, CA 93535-3816 44933 Fern Ave LPAC Rental Administrator (661) 723-5932 www.lpac.org PMartindale@CityofLancasterCA.org
TRANSPORTATION COMMITTEE
 Meeting 2007 October 15 COUNCIL REPORT TRANSPORTATION COMMITTEE HIS WORSHIP, THE MAYOR AND COUNCILLORS SUBJECT: METROTOWN TRANSIT VILLAGE STUDY RECOMMENDATIONS: 1. THAT Council approve in principle the
APPENDIX J Richmond High School Performing Arts Theater Usage Policy (December 2018)
") APPENDIX J Richmond High School Performing Arts Theater Usage Policy (December 2018) This usage policy agreement outlines policies and procedures for usage and rental of the Richmond High School Performing
APPENDIX J Richmond High School Performing Arts Theater Usage Policy (December 2018) This usage policy agreement outlines policies and procedures for usage and rental of the Richmond High School Performing
I thought it would be useful to append a list of our main points from Wednesday s meeting on the next page.
 Independent Producers Scotland Film City Glasgow 401 Govan Road GLASGOW G51 2QJ Friday 23 rd January 2015 Dear Members of Economy, Energy and Tourism Committee, Thank you for taking notice of the state
SAG-AFTRA COMMERCIALS INFOMERCIAL ONE PRODUCTION ONLY ( OPO ) INFOMERCIAL LETTER OF AGREEMENT 2013
 INFOMERCIAL LETTER OF AGREEMENT 2013") SAG-AFTRA COMMERCIALS INFOMERCIAL ONE PRODUCTION ONLY ( OPO ) INFOMERCIAL LETTER OF AGREEMENT 2013 This Agreement is made and entered into this day of, 2013, between SAG-AFTRA and ( Producer ) covering
SAG-AFTRA COMMERCIALS INFOMERCIAL ONE PRODUCTION ONLY ( OPO ) INFOMERCIAL LETTER OF AGREEMENT 2013 This Agreement is made and entered into this day of, 2013, between SAG-AFTRA and ( Producer ) covering
6. Institutional Planning and Budgeting Processes
 6. Institutional Planning and Budgeting Processes 1702 1703 1704 1705 1706 1707 1708 1709 1710 1711 1712 1713 1714 1715 1716 1717 1718 1719 1720 1721 1722 1723 1724 1725 1726 1727 1728 1729 1730 1731 1732
1. Introduction. 2. Part A: Executive Summary
 MTN'S RESPONSE TO ICASA'S INQUIRY INTO SUBSCRIPTION TELEVISION BROADCASTING SERVICES IN TERMS OF SECTION 4 B OF THE ICASA ACT 13 OF 2000 IN GORVENMENT GAZETTE NO. 41070 DATED 25 AUGUST 2017 1 P a g e 1.
SPONSORSHIP OPPORTUNITIES
 SPONSORSHIP OPPORTUNITIES ZILKER THEATRE PRODUCTIONS Strengthening community, enlivening the spirit, and inspiring artists of today and tomorrow. 1 LETTER OF INTENT Dear Arts Supporters, Friends, and Family:
Joyce Theater International Center for Dance Preliminary Program Requirements
 Joyce Theater International Center for Dance Preliminary Program Requirements The International Center for Dance will be a welcoming, vibrant, day and night operation with community and school programs,
Recreation and Parks Rental Facilities and Rates
 Recreation and Parks Rental Facilities and Rates Rental Facilities Any payment/s made less than 30 days prior to the facility rental date must be paid by cash, certified check, money order, Visa, MasterCard
An Economic Overview, Stocks vs. Bonds, and An Update on Three Stocks
 Excerpt: Netflix Slides An Economic Overview, Stocks vs. Bonds, and An Update on Three Stocks Whitney Tilson Value Investing Congress October 1, 2012 T2 Accredited Fund, LP Tilson Offshore Fund, Ltd. T2
Performances. Tempe Center for the Arts 700 W Rio Salado Pkwy Tempe, Arizona tempecenterforthearts.com
 Photo by Ryan and Denise Photography Performances The Tempe Center for the Arts (TCA) is one of the finest venues in Arizona for hosting a variety of production events a jewel in the crown of a city known