Notes Unit 8: Dot Plots and Histograms
|
|
|
- Darren Cross
- 5 years ago
- Views:
Transcription
1 Notes Unit : Dot Plots and Histograms I. Dot Plots A. Definition A data display in which each data item is shown as a dot above a number line In a dot plot a cluster shows where a group of data points fall. A gap is an interval where there are no data items.
2 B. Steps to Create a Dot Plot 1. Order numbers from least to greatest. 2. Draw a number line, labeling the number line with the minimum and the maximum and then all the numbers that fall between them. 3. Put a dot above each number on the number line for each data entry in your set. Don t forget a title and labels!
3 C. Examples Ex 1: A. In an airline training program, the students are given a test in which they are given a set of tasks and the time it takes them to complete the tasks is measured. The following is a list of the time (in seconds) for a group of new trainees. 61, 61, 64, 67, 70, 71, 71, 71, 72, 73, 74, 74, 75, 77, 79, 0, 1, 1, 3 Display the data in a dot plot.
4 Answer! Airline Training Program Test New Trainees = 1 person Time in Seconds
5 Are there any clusters? = 1 person Airline Training Program Test New Trainees Yes! Time in Seconds
6 Are there any gaps? Airline Training Program Test New Trainees Yes! = 1 person Time in Seconds
7 What is the average time? = 1 person Airline Training Program Test New Trainees About 73 seconds Time in Seconds
8 What is the median time? = 1 person Airline Training Program Test New Trainees 73 seconds Time in Seconds
9 What is the Range? = 1 person Airline Training Program Test New Trainees 22 seconds Time in Seconds
10 Ex 2: B. In a science class, the students weighed some samples of dirt to the nearest 1/ pound. The weights of the samples are given below. 1/ lb, 3/ lb, ¾ lb, ¼ lb, 1/ lb, ¼ lb, 7/ lb, ¼ lb, 3/ lb, ¼ lb, ½ lb, 3/ lb Make a dot plot for the data.
11 Answer! Sample Weights = 1 sample Weight in pounds
12 Are there any clusters? Sample Weights = 1 sample Yes! Weight in pounds
13 Are there any Gaps? Sample Weights = 1 sample Yes! Weight in pounds
14 What is the average weight? Sample Weights = 1 sample 3/ or lb Weight in pounds
15 What is the median? Sample Weights = 1 sample 5/16 or lb Weight in pounds
16 What is the range? Sample Weights = 1 sample 6/ or 0.75 lb Weight in pounds
17 You try: Mrs. Jones took a survey of ten 6 th grade students. She asked each student how many items they recycle in a day. Below are her results. 0, 1, 1, 1, 2, 2, 2, 3, 3, 5 Make a dot plot to display this data.
18 II. Bar Graphs and Histograms A. Bar Graphs A bar graph can be used to display and compare data The scale should include all the data values and be easily divided into equal intervals.


19 How to interpret a Bar Graph? The bar graph shows Mr. Snow s students by gender How many of Mr. Snow s students are band members? How many of Mr. Snow s students are not band members? and band membership. Snow s Students by Gender & Band Membership

20 B. Double Bar Graph Can be used to compare two related sets of data 1st Qtr 2nd Qtr 3rd Qtr 4th Qtr How to make a Double-Bar Graph? 1. Choose a scale and interval for the vertical axis. 2. Draw a pair of bars for each variable. If possible, use different colors. 3. Label the axes and give the graph a title. 4. Make a key to show what each bar represents.

21 Ex 1: The table shows the highway speed limits on interstate roads within three states. State Urban Rural Florida 65mi/h 70 mi/h Texas 70 mi/h 70 mi/h Vermont 55mi/h 65 mi/h
22 Choose a scale and interval for the vertical axis. Step 1 State Florida Texas Vermont Urban 65mi/h 70 mi/h 55mi/h Rural 70 mi/h 70 mi/h 65 mi/h

23 Draw Step a pair of 2 bars for each state s data. Use different colors to show urban and rural. State Florida Texas Vermont Urban 65mi/h 70 mi/h 55mi/h Rural 70 mi/h 70 mi/h 65 mi/h

24 Speed Limit (mi/h) Step 3 and 4 Speed Limit on Interstate Roads Label the axes and give the graph a title. Make a key to show what each bar represents Urban Rural
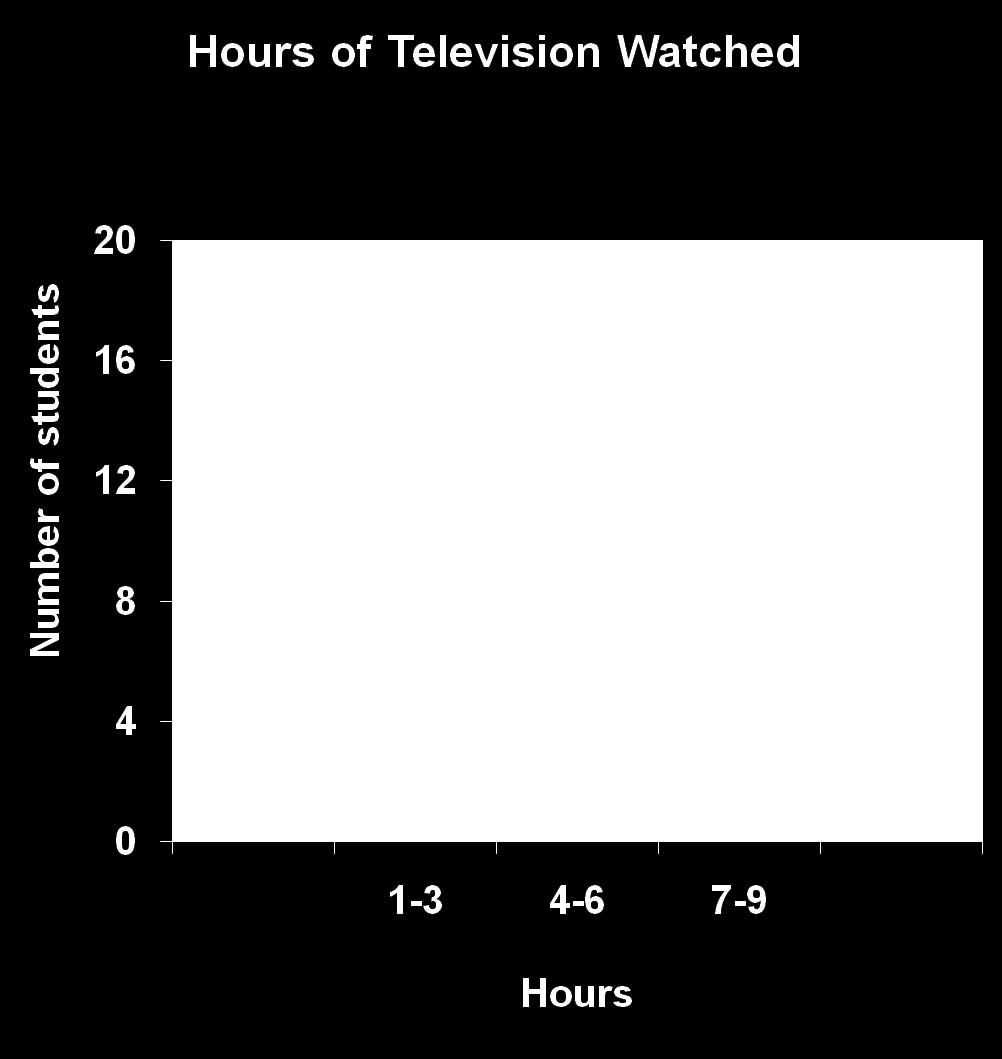
25 C. Histogram Histogram is a bar graph that shows the frequency of data within equal intervals. There is no space in between the bars.

26 a. Creating a histogram? Make a frequency table of the data. Be sure to use equal intervals Step 1 Number of hours of TV Number of hours of TV Frequency II IIII IIII - IIII IIII - I III IIII - IIII III IIII IIII - III

27 Step 2 Choose an appropriate scale and interval for the vertical axis. The greatest value on the scale should be at least as great as the greatest frequency. Number of hours of TV Frequency

28 Step 3 Draw a bar for each interval. The height of the bar is the frequency for that interval. Bars must touch but not overlap. Label the axes and give the graph title Number of hours of TV Frequency
29
30 Can you now make a bar graph, double bar Graph and a histogram?
31 You try: The list below shows the results of a typing test in words per minute. Make a histogram of the data. 62, 55, 6, 47, 50, 41, 62, 39, 54, 70, 56, 70, 56, 47, 71, 55, 60, 42
What is Statistics? 13.1 What is Statistics? Statistics
 13.1 What is Statistics? What is Statistics? The collection of all outcomes, responses, measurements, or counts that are of interest. A portion or subset of the population. Statistics Is the science of
Math 7 /Unit 07 Practice Test: Collecting, Displaying and Analyzing Data
 Math 7 /Unit 07 Practice Test: Collecting, Displaying and Analyzing Data Name: Date: Define the terms below and give an example. 1. mode 2. range 3. median 4. mean 5. Which data display would be used to
Answers. Chapter 9 A Puzzle Time MUSSELS. 9.1 Practice A. Technology Connection. 9.1 Start Thinking! 9.1 Warm Up. 9.1 Start Thinking!
 . Puzzle Time MUSSELS Technolog Connection.. 7.... in. Chapter 9 9. Start Thinking! For use before Activit 9. Number of shoes x Person 9. Warm Up For use before Activit 9.. 9. Start Thinking! For use before
Algebra I Module 2 Lessons 1 19
 Eureka Math 2015 2016 Algebra I Module 2 Lessons 1 19 Eureka Math, Published by the non-profit Great Minds. Copyright 2015 Great Minds. No part of this work may be reproduced, distributed, modified, sold,
Dot Plots and Distributions
 EXTENSION Dot Plots and Distributions A dot plot is a data representation that uses a number line and x s, dots, or other symbols to show frequency. Dot plots are sometimes called line plots. E X A M P
6 th Grade Semester 2 Review 1) It cost me $18 to make a lamp, but I m selling it for $45. What was the percent of increase in price?
 It cost me $18 to make a lamp, but I m selling it for $45. What was the percent of increase in price?") 6 th Grade Semester 2 Review 1) It cost me $18 to make a lamp, but I m selling it for $45. What was the percent of increase in price? 2) Tom's weekly salary changed from $240 to $288. What was the percent
6 th Grade Semester 2 Review 1) It cost me $18 to make a lamp, but I m selling it for $45. What was the percent of increase in price? 2) Tom's weekly salary changed from $240 to $288. What was the percent
Math 81 Graphing. Cartesian Coordinate System Plotting Ordered Pairs (x, y) (x is horizontal, y is vertical) center is (0,0) Quadrants:
 (x is horizontal, y is vertical) center is (0,0) Quadrants:") Math 81 Graphing Cartesian Coordinate System Plotting Ordered Pairs (x, y) (x is horizontal, y is vertical) center is (0,0) Ex 1. Plot and indicate which quadrant they re in. A (0,2) B (3, 5) C (-2, -4)
Math 81 Graphing Cartesian Coordinate System Plotting Ordered Pairs (x, y) (x is horizontal, y is vertical) center is (0,0) Ex 1. Plot and indicate which quadrant they re in. A (0,2) B (3, 5) C (-2, -4)
Distribution of Data and the Empirical Rule
 302360_File_B.qxd 7/7/03 7:18 AM Page 1 Distribution of Data and the Empirical Rule 1 Distribution of Data and the Empirical Rule Stem-and-Leaf Diagrams Frequency Distributions and Histograms Normal Distributions
Homework Packet Week #5 All problems with answers or work are examples.
 Lesson 8.1 Construct the graphical display for each given data set. Describe the distribution of the data. 1. Construct a box-and-whisker plot to display the number of miles from school that a number of
Version : 27 June General Certificate of Secondary Education June Foundation Unit 1. Final. Mark Scheme
 Version : 27 June 202 General Certificate of Secondary Education June 202 Mathematics Foundation Unit 4360F Final Mark Scheme Mark schemes are prepared by the Principal Examiner and considered, together
Measuring Variability for Skewed Distributions
 Measuring Variability for Skewed Distributions Skewed Data and its Measure of Center Consider the following scenario. A television game show, Fact or Fiction, was canceled after nine shows. Many people
Box Plots. So that I can: look at large amount of data in condensed form.
 LESSON 5 Box Plots LEARNING OBJECTIVES Today I am: creating box plots. So that I can: look at large amount of data in condensed form. I ll know I have it when I can: make observations about the data based
Chapter 5. Describing Distributions Numerically. Finding the Center: The Median. Spread: Home on the Range. Finding the Center: The Median (cont.
 Chapter 5 Describing Distributions Numerically Copyright 2007 Pearson Education, Inc. Publishing as Pearson Addison-Wesley Copyright 2007 Pearson Education, Inc. Publishing as Pearson Addison-Wesley Slide
Comparing Distributions of Univariate Data
 . Chapter 3 Comparing Distributions of Univariate Data Topic 9 covers comparing data and constructing multiple univariate plots. Topic 9 Multiple Univariate Plots Example: Building heights in Philadelphia,
Chapter 4. Displaying Quantitative Data. Copyright 2007 Pearson Education, Inc. Publishing as Pearson Addison-Wesley
 Chapter 4 Displaying Quantitative Data Copyright 2007 Pearson Education, Inc. Publishing as Pearson Addison-Wesley Dealing With a Lot of Numbers Summarizing the data will help us when we look at large
Histograms and Frequency Polygons are statistical graphs used to illustrate frequency distributions.
 Number of Families II. Statistical Graphs section 3.2 Histograms and Frequency Polygons are statistical graphs used to illustrate frequency distributions. Example: Construct a histogram for the frequency
(1) + 1(0.1) + 7(0.001)
 + 1(0.1) + 7(0.001)") Name: Quarterly 1 Study Guide The first quarterly test covers information from Modules 1, 2, and 3. If you complete this study guide and turn it in on Tuesday, you will receive 5 bonus points on your Quarterly
Name: Quarterly 1 Study Guide The first quarterly test covers information from Modules 1, 2, and 3. If you complete this study guide and turn it in on Tuesday, you will receive 5 bonus points on your Quarterly
Lesson 7: Measuring Variability for Skewed Distributions (Interquartile Range)
") : Measuring Variability for Skewed Distributions (Interquartile Range) Student Outcomes Students explain why a median is a better description of a typical value for a skewed distribution. Students calculate
: Measuring Variability for Skewed Distributions (Interquartile Range) Student Outcomes Students explain why a median is a better description of a typical value for a skewed distribution. Students calculate
Chapter 6. Normal Distributions
 Chapter 6 Normal Distributions Understandable Statistics Ninth Edition By Brase and Brase Prepared by Yixun Shi Bloomsburg University of Pennsylvania Edited by José Neville Díaz Caraballo University of
Statistics: A Gentle Introduction (3 rd ed.): Test Bank. 1. Perhaps the oldest presentation in history of descriptive statistics was
: Test Bank. 1. Perhaps the oldest presentation in history of descriptive statistics was") Chapter 2 Test Questions 1. Perhaps the oldest presentation in history of descriptive statistics was a. a frequency distribution b. graphs and tables c. a frequency polygon d. a pie chart 2. In her bar
Chapter 2 Test Questions 1. Perhaps the oldest presentation in history of descriptive statistics was a. a frequency distribution b. graphs and tables c. a frequency polygon d. a pie chart 2. In her bar
download instant at
 13 Introductory Statistics (IS) / Elementary Statistics (ES): Chapter 2 Form A Exam Name SHORT ANSWER. Write the word or phrase that best completes each statement or answers the question. Classify the
Lesson 7: Measuring Variability for Skewed Distributions (Interquartile Range)
") : Measuring Variability for Skewed Distributions (Interquartile Range) Exploratory Challenge 1: Skewed Data and its Measure of Center Consider the following scenario. A television game show, Fact or Fiction,
: Measuring Variability for Skewed Distributions (Interquartile Range) Exploratory Challenge 1: Skewed Data and its Measure of Center Consider the following scenario. A television game show, Fact or Fiction,
UNIVERSITY OF MASSACHUSETTS Department of Biostatistics and Epidemiology BioEpi 540W - Introduction to Biostatistics Fall 2002
 1 UNIVERSITY OF MASSACHUSETTS Department of Biostatistics and Epidemiology BioEpi 540W - Introduction to Biostatistics Fall 2002 Exercises Unit 2 Descriptive Statistics Tables and Graphs Due: Monday September
Objective: Write on the goal/objective sheet and give a before class rating. Determine the types of graphs appropriate for specific data.
 Objective: Write on the goal/objective sheet and give a before class rating. Determine the types of graphs appropriate for specific data. Khan Academy test Tuesday Sept th. NO CALCULATORS allowed. Not
EXPLORING DISTRIBUTIONS
 CHAPTER 2 EXPLORING DISTRIBUTIONS 18 16 14 12 Frequency 1 8 6 4 2 54 56 58 6 62 64 66 68 7 72 74 Female Heights What does the distribution of female heights look like? Statistics gives you the tools to
Chapter 1 Midterm Review
 Name: Class: Date: Chapter 1 Midterm Review Multiple Choice Identify the choice that best completes the statement or answers the question. 1. A survey typically records many variables of interest to the
N12/5/MATSD/SP2/ENG/TZ0/XX. mathematical STUDIES. Wednesday 7 November 2012 (morning) 1 hour 30 minutes. instructions to candidates
 1 hour 30 minutes. instructions to candidates") 88127402 mathematical STUDIES STANDARD level Paper 2 Wednesday 7 November 2012 (morning) 1 hour 30 minutes instructions to candidates Do not open this examination paper until instructed to do so. A graphic
88127402 mathematical STUDIES STANDARD level Paper 2 Wednesday 7 November 2012 (morning) 1 hour 30 minutes instructions to candidates Do not open this examination paper until instructed to do so. A graphic
Full file at
 Exam Name SHORT ANSWER. Write the word or phrase that best completes each statement or answers the question. Provide an appropriate response. 1) A parcel delivery service lowered its prices and finds that
Graphical Displays of Univariate Data
 . Chapter 1 Graphical Displays of Univariate Data Topic 2 covers sorting data and constructing Stemplots and Dotplots, Topic 3 Histograms, and Topic 4 Frequency Plots. (Note: Boxplots are a graphical display
Collecting Data Name:
 Collecting Data Name: Gary tried out for the college baseball team and had received information about his performance. In a letter mailed to his home, he found these recordings. Pitch speeds: 83, 84, 88,
MATH& 146 Lesson 11. Section 1.6 Categorical Data
 MATH& 146 Lesson 11 Section 1.6 Categorical Data 1 Frequency The first step to organizing categorical data is to count the number of data values there are in each category of interest. We can organize
Frequencies. Chapter 2. Descriptive statistics and charts
 An analyst usually does not concentrate on each individual data values but would like to have a whole picture of how the variables distributed. In this chapter, we will introduce some tools to tabulate
Relationships Between Quantitative Variables
 Chapter 5 Relationships Between Quantitative Variables Three Tools we will use Scatterplot, a two-dimensional graph of data values Correlation, a statistic that measures the strength and direction of a
Relationships. Between Quantitative Variables. Chapter 5. Copyright 2006 Brooks/Cole, a division of Thomson Learning, Inc.
 Relationships Chapter 5 Between Quantitative Variables Copyright 2006 Brooks/Cole, a division of Thomson Learning, Inc. Three Tools we will use Scatterplot, a two-dimensional graph of data values Correlation,
Getting Started. Connect green audio output of SpikerBox/SpikerShield using green cable to your headphones input on iphone/ipad.
 Getting Started First thing you should do is to connect your iphone or ipad to SpikerBox with a green smartphone cable. Green cable comes with designators on each end of the cable ( Smartphone and SpikerBox
1.1 Common Graphs and Data Plots
 1.1. Common Graphs and Data Plots www.ck12.org 1.1 Common Graphs and Data Plots Learning Objectives Identify and translate data sets to and from a bar graph and a pie graph. Identify and translate data
MATH 214 (NOTES) Math 214 Al Nosedal. Department of Mathematics Indiana University of Pennsylvania. MATH 214 (NOTES) p. 1/3
 Math 214 Al Nosedal. Department of Mathematics Indiana University of Pennsylvania. MATH 214 (NOTES) p. 1/3") MATH 214 (NOTES) Math 214 Al Nosedal Department of Mathematics Indiana University of Pennsylvania MATH 214 (NOTES) p. 1/3 CHAPTER 1 DATA AND STATISTICS MATH 214 (NOTES) p. 2/3 Definitions. Statistics is
MATH 214 (NOTES) Math 214 Al Nosedal Department of Mathematics Indiana University of Pennsylvania MATH 214 (NOTES) p. 1/3 CHAPTER 1 DATA AND STATISTICS MATH 214 (NOTES) p. 2/3 Definitions. Statistics is
What can you tell about these films from this box plot? Could you work out the genre of these films?
 FILM A FILM B FILM C Age of film viewer What can you tell about these films from this box plot? Could you work out the genre of these films? Compare the box plots and write down anything you notice FILM
11, 6, 8, 7, 7, 6, 9, 11, 9
 1. The Jackson Middle School cross country team is making a box plot of the time it takes each person on the team to run a mile, rounded to the nearest minute. The times are shown below. 11, 6, 8, 7, 7,
AskDrCallahan Calculus 1 Teacher s Guide
 AskDrCallahan Calculus 1 Teacher s Guide 3rd Edition rev 080108 Dale Callahan, Ph.D., P.E. Lea Callahan, MSEE, P.E. Copyright 2008, AskDrCallahan, LLC v3-r080108 www.askdrcallahan.com 2 Welcome to AskDrCallahan
Object selectivity of local field potentials and spikes in the macaque inferior temporal cortex
 Object selectivity of local field potentials and spikes in the macaque inferior temporal cortex Gabriel Kreiman 1,2,3,4*#, Chou P. Hung 1,2,4*, Alexander Kraskov 5, Rodrigo Quian Quiroga 6, Tomaso Poggio
Why visualize data? Advanced GDA and Software: Multivariate approaches, Interactive Graphics, Mondrian, iplots and R. German Bundestagswahl 2005
 Advanced GDA and Software: Multivariate approaches, Interactive Graphics, Mondrian, iplots and R Why visualize data? Looking for global trends overall structure Looking for local features data quality
MATH 214 (NOTES) Math 214 Al Nosedal. Department of Mathematics Indiana University of Pennsylvania. MATH 214 (NOTES) p. 1/11
 Math 214 Al Nosedal. Department of Mathematics Indiana University of Pennsylvania. MATH 214 (NOTES) p. 1/11") MATH 214 (NOTES) Math 214 Al Nosedal Department of Mathematics Indiana University of Pennsylvania MATH 214 (NOTES) p. 1/11 CHAPTER 6 CONTINUOUS PROBABILITY DISTRIBUTIONS MATH 214 (NOTES) p. 2/11 Simple
MATH 214 (NOTES) Math 214 Al Nosedal Department of Mathematics Indiana University of Pennsylvania MATH 214 (NOTES) p. 1/11 CHAPTER 6 CONTINUOUS PROBABILITY DISTRIBUTIONS MATH 214 (NOTES) p. 2/11 Simple
E X P E R I M E N T 1
 E X P E R I M E N T 1 Getting to Know Data Studio Produced by the Physics Staff at Collin College Copyright Collin College Physics Department. All Rights Reserved. University Physics, Exp 1: Getting to
Medium Weight Shock and Vibration Test Report on 3x2x6 Composite Pump for Sims Pump Valve Company, Inc. Hoboken, NJ
 Report No. 10005.1 No. of Pages 19 Medium Weight Shock and Vibration Test Report on 3x2x6 Composite Pump for Sims Pump Valve Company, Inc. Hoboken, NJ NU LABORATORIES, INC. 312 Old Allerton Road, Annandale,
Klee or Kid? The subjective experience of drawings from children and Paul Klee Pronk, T.
 UvA-DARE (Digital Academic Repository) Klee or Kid? The subjective experience of drawings from children and Paul Klee Pronk, T. Link to publication Citation for published version (APA): Pronk, T. (Author).
Version : 1.0: klm. General Certificate of Secondary Education November Higher Unit 1. Final. Mark Scheme
 Version : 1.0: 11.10 klm General Certificate of Secondary Education November 2010 Mathematics Higher Unit 1 43601H Final Mark Scheme Mark schemes are prepared by the Principal Examiner and considered,
STAT 113: Statistics and Society Ellen Gundlach, Purdue University. (Chapters refer to Moore and Notz, Statistics: Concepts and Controversies, 8e)
") STAT 113: Statistics and Society Ellen Gundlach, Purdue University (Chapters refer to Moore and Notz, Statistics: Concepts and Controversies, 8e) Learning Objectives for Exam 1: Unit 1, Part 1: Population
STAT 113: Statistics and Society Ellen Gundlach, Purdue University (Chapters refer to Moore and Notz, Statistics: Concepts and Controversies, 8e) Learning Objectives for Exam 1: Unit 1, Part 1: Population
Human Number Line. Introduction to Negative Numbers
 Human Number Line Introduction to Negative Numbers 1 WARM UP Plot each number on a number line. Then, insert a. or, symbol to make each inequality statement true. 0 1 2 3 4 5 6 7 8 9 10 1. 3 4 1 1 2 2.
THE UNIVERSITY OF QUEENSLAND
 THE UNIVERSITY OF QUEENSLAND 1999 LIBRARY CUSTOMER SURVEY THE UNIVERSITY OF QUEENSLAND LIBRARY Survey October 1999 CONTENTS 1. INTRODUCTION... 1 1.1 BACKGROUND... 1 1.2 OBJECTIVES... 2 1.3 THE SURVEY PROCESS...
PICK THE RIGHT TEAM AND MAKE A BLOCKBUSTER A SOCIAL ANALYSIS THROUGH MOVIE HISTORY
 PICK THE RIGHT TEAM AND MAKE A BLOCKBUSTER A SOCIAL ANALYSIS THROUGH MOVIE HISTORY THE CHALLENGE: TO UNDERSTAND HOW TEAMS CAN WORK BETTER SOCIAL NETWORK + MACHINE LEARNING TO THE RESCUE Previous research:
ECE438 - Laboratory 1: Discrete and Continuous-Time Signals
 Purdue University: ECE438 - Digital Signal Processing with Applications 1 ECE438 - Laboratory 1: Discrete and Continuous-Time Signals By Prof. Charles Bouman and Prof. Mireille Boutin Fall 2015 1 Introduction
EOC FINAL REVIEW Name Due Date
 1. The line has endpoints L(-8, -2) and N(4, 2) and midpoint M. What is the equation of the line perpendicular to and passing through M? A. B. Y= C. Y= D. Y= 3x + 6 2. A rectangle has vertices at (-5,3),
User s Manual. Log Scale (/LG) GX10/GX20/GP10/GP20/GM10 IM 04L51B01-06EN. 2nd Edition
 GX10/GX20/GP10/GP20/GM10 IM 04L51B01-06EN. 2nd Edition") User s Manual Model GX10/GX20/GP10/GP20/GM10 Log Scale (/LG) User s Manual 2nd Edition Introduction Notes Trademarks Thank you for purchasing the SMARTDAC+ Series GX10/GX20/GP10/GP20/GM10 (hereafter referred
User s Manual Model GX10/GX20/GP10/GP20/GM10 Log Scale (/LG) User s Manual 2nd Edition Introduction Notes Trademarks Thank you for purchasing the SMARTDAC+ Series GX10/GX20/GP10/GP20/GM10 (hereafter referred
COMP Test on Psychology 320 Check on Mastery of Prerequisites
 COMP Test on Psychology 320 Check on Mastery of Prerequisites This test is designed to provide you and your instructor with information on your mastery of the basic content of Psychology 320. The results
Medium Weight Shock and Vibration Test Report on 3 x 1 1/2 x 6 15 HP Pump for Sims Pump Valve Company Hoboken, NJ
 Report No. 10405.1 No. of Pages 16 Medium Weight Shock and Vibration Test Report on 3 x 1 1/2 x 6 15 HP Pump for Sims Pump Valve Company Hoboken, NJ NU LABORATORIES, INC. 312 Old Allerton Road, Annandale,
NENS 230 Assignment #2 Data Import, Manipulation, and Basic Plotting
 NENS 230 Assignment #2 Data Import, Manipulation, and Basic Plotting Compound Action Potential Due: Tuesday, October 6th, 2015 Goals Become comfortable reading data into Matlab from several common formats
Medium Weight Shock and Vibration Test Report on 3 x 1.5 x 8 Pump with 30 HP Motor for Sims Pump Valve Company, Inc. Hoboken, NJ
 Test Report No. 10490.1 No. of Pages 16 Medium Weight Shock and Vibration Test Report on 3 x 1.5 x 8 Pump with 30 HP Motor for Sims Pump Valve Company, Inc. Hoboken, NJ NU LABORATORIES, INC. 312 Old Allerton
3. Artemis bought a box of mini cookies in the shapes of hearts, stars, and circles. She laid out all the cookies on her plate.
 Summative Assessment 1. In which expression does g have a coefficient of 8? A. 8g B. g 8 C. 8 + g D. 2. Which number line correctly shows 7 and its opposite? A. B. C. D. 3. Artemis bought a box of mini
AP Statistics Sec 5.1: An Exercise in Sampling: The Corn Field
 AP Statistics Sec.: An Exercise in Sampling: The Corn Field Name: A farmer has planted a new field for corn. It is a rectangular plot of land with a river that runs along the right side of the field. The
The Effects of Study Condition Preference on Memory and Free Recall LIANA, MARISSA, JESSI AND BROOKE
 The Effects of Study Condition Preference on Memory and Free Recall LIANA, MARISSA, JESSI AND BROOKE Introduction -Salamè & Baddeley 1988 Presented nine digits on a computer screen for 750 milliseconds
Unit 7, Lesson 1: Exponent Review
 Unit 7, Lesson 1: Exponent Review 1. Write each expression using an exponent: a. b. c. d. The number of coins Jada will have on the eighth day, if Jada starts with one coin and the number of coins doubles
Analysis of AP/axon classes and PSP on the basis of AP amplitude
 Analysis of AP/axon classes and PSP on the basis of AP amplitude In this analysis manual, we aim to measure and analyze AP amplitudes recorded with a suction electrode and synaptic potentials recorded
Statistics for Engineers
 Statistics for Engineers ChE 4C3 and 6C3 Kevin Dunn, 2013 kevin.dunn@mcmaster.ca http://learnche.mcmaster.ca/4c3 Overall revision number: 19 (January 2013) 1 Copyright, sharing, and attribution notice
Chapter 3 Answers. Problem of the Week p a)
") Chapter 3 Answers Problem of the Week p. 3 1. a) How Much Water I Drank Number of glasses 8 b) For example, the data range would go from 3 to 1, so the broken line would move up. It would start at 3 and
Chapter 3 Answers Problem of the Week p. 3 1. a) How Much Water I Drank Number of glasses 8 b) For example, the data range would go from 3 to 1, so the broken line would move up. It would start at 3 and
Brief History of the MUTCD
 Brief History of the MUTCD 1930s 1920s 1960s Early 1950s Today Gene Hawkins Texas Transportation Institute 1940s The MUTCD There have been 9 editions of the MUTCD 1935 1942 1948 1961 19711978 1988 2000
Work Package 9. Deliverable 32. Statistical Comparison of Islamic and Byzantine chant in the Worship Spaces
 Work Package 9 Deliverable 32 Statistical Comparison of Islamic and Byzantine chant in the Worship Spaces Table Of Contents 1 INTRODUCTION... 3 1.1 SCOPE OF WORK...3 1.2 DATA AVAILABLE...3 2 PREFIX...
Supplemental Material: Color Compatibility From Large Datasets
 Supplemental Material: Color Compatibility From Large Datasets Peter O Donovan, Aseem Agarwala, and Aaron Hertzmann Project URL: www.dgp.toronto.edu/ donovan/color/ 1 Unmixing color preferences In the
1 Bias-parity errors. MEMORANDUM November 14, Description. 1.2 Input
 MIT Kavli Institute Chandra X-Ray Center MEMORANDUM November 14, 2013 To: Jonathan McDowell, SDS Group Leader From: Glenn E. Allen, SDS Subject: Bias-parity error spec Revision: 1.3 URL: http://space.mit.edu/cxc/docs/docs.html#berr
Visual Encoding Design
 CSE 442 - Data Visualization Visual Encoding Design Jeffrey Heer University of Washington A Design Space of Visual Encodings Mapping Data to Visual Variables Assign data fields (e.g., with N, O, Q types)
The Structural Characteristics of the Japanese Paperback Book Series Shinsho
 The Structural Characteristics of the Japanese Paperback Book Series Shinsho Ruri Shimura The University of Tokyo, Graduate School of Education shimshim_rr@hotmail.co.jp Shohei Yamada The University of
abc Mark Scheme Statistics 3311 General Certificate of Secondary Education Higher Tier 2007 examination - June series
 abc General Certificate of Secondary Education Statistics 3311 Higher Tier Mark Scheme 2007 examination - June series Mark schemes are prepared by the Principal Examiner and considered, together with the
DIGITAL SIGN SURVEY SURVEY REQUESTED BY CYLCE JOHNSON ON 2/26/07 - QUESTION: NAHBA SURVEY ON SIGN INTENSITY (BRIGHTNESS)
") DIGITAL SIGN SURVEY SURVEY REQUESTED BY CYLCE JOHNSON ON 2/26/07 - QUESTION: NAHBA SURVEY ON SIGN INTENSITY (BRIGHTNESS) STATE: DATE: 1. Does your state allow digital signs? yes no. 2. If yes, have you
DIGITAL SIGN SURVEY SURVEY REQUESTED BY CYLCE JOHNSON ON 2/26/07 - QUESTION: NAHBA SURVEY ON SIGN INTENSITY (BRIGHTNESS) STATE: DATE: 1. Does your state allow digital signs? yes no. 2. If yes, have you
2016 Excellence in Mathematics Contest Team Project Level I (Precalculus and above) School Name: Group Members:
 School Name: Group Members:") 016 Excellence in Mathematics Contest Team Project Level I (Precalculus and above) School Name: Group Members: Reference Sheet Formulas and Facts You may need to use some of the following formulas and
016 Excellence in Mathematics Contest Team Project Level I (Precalculus and above) School Name: Group Members: Reference Sheet Formulas and Facts You may need to use some of the following formulas and
ANALYSING DIFFERENCES BETWEEN THE INPUT IMPEDANCES OF FIVE CLARINETS OF DIFFERENT MAKES
 ANALYSING DIFFERENCES BETWEEN THE INPUT IMPEDANCES OF FIVE CLARINETS OF DIFFERENT MAKES P Kowal Acoustics Research Group, Open University D Sharp Acoustics Research Group, Open University S Taherzadeh
FAST MOBILITY PARTICLE SIZER SPECTROMETER MODEL 3091
 FAST MOBILITY PARTICLE SIZER SPECTROMETER MODEL 3091 MEASURES SIZE DISTRIBUTION AND NUMBER CONCENTRATION OF RAPIDLY CHANGING SUBMICROMETER AEROSOL PARTICLES IN REAL-TIME UNDERSTANDING, ACCELERATED IDEAL
Automatic LP Digitalization Spring Group 6: Michael Sibley, Alexander Su, Daphne Tsatsoulis {msibley, ahs1,
 Automatic LP Digitalization 18-551 Spring 2011 Group 6: Michael Sibley, Alexander Su, Daphne Tsatsoulis {msibley, ahs1, ptsatsou}@andrew.cmu.edu Introduction This project was originated from our interest
Brief History of the MUTCD
 Brief History of the MUTCD 1930s 1920s 1960s Early 1950s Today Gene Hawkins Texas Transportation Institute 1940s The MUTCD There have been 8 editions of the MUTCD 1935 1942 1948 1961 1971 1978 1988 2000
Key Maths Facts to Memorise Question and Answer
 Key Maths Facts to Memorise Question and Answer Ways of using this booklet: 1) Write the questions on cards with the answers on the back and test yourself. 2) Work with a friend to take turns reading a
To calculate the estimated number of fish killed by shrimp trawlers every year in the Gulf of Mexico I will 9,400,000 by.
 Blue - Divide by Whole Numbers and Powers of 10 Metric Conversions 1. The thickness of a book, including the covers, is 2.1 cm. The front and back cover are each 0.5 cm thick. The book has 230 pages, numbered
Logic Analyzer Auto Run / Stop Channels / trigger / Measuring Tools Axis control panel Status Display
 Logic Analyzer The graphical user interface of the Logic Analyzer fits well into the overall design of the Red Pitaya applications providing the same operating concept. The Logic Analyzer user interface
GRADE 6 WINTER REVIEW MATH PACKET
 Student Name: Date: Math Teacher: Period: GRADE 6 WINTER REVIEW MATH PACKET 2014-2015 Find the greatest common factor of each set of numbers. 1. 27, 36, 72 a. 216 b. 8 c. 9 d. 18 2. The table shows the
MIS 0855 Data Science (Section 005) Fall 2016 In-Class Exercise (Week 6) Advanced Data Visualization with Tableau
 Fall 2016 In-Class Exercise (Week 6) Advanced Data Visualization with Tableau") MIS 0855 Data Science (Section 005) Fall 2016 In-Class Exercise (Week 6) Advanced Data Visualization with Tableau Objective: Learn how to use Tableau s advanced data visualization tools Learning Outcomes:
MIS 0855 Data Science (Section 005) Fall 2016 In-Class Exercise (Week 6) Advanced Data Visualization with Tableau Objective: Learn how to use Tableau s advanced data visualization tools Learning Outcomes:
Grade 5 Mathematics Mid-Year Assessment REVIEW
 Grade 5 Mathematics Mid-Year Assessment REVIEW The learning targets (Texas Essential Knowledge and Skill statements) are listed prior to sample items. The sample items are not an exhaustive list and only
Traffic Sign Life Expectancy Investigation LAB943
 Traffic Sign Life Expectancy Investigation LAB943 Project Tap Meeting #1 02/19/2013 Project Team Matt Lebens, MnDOT PI Howard Preston Co-PI Jim McGraw, MnDOT Maureen Jensen, MnDOT Agenda Introductions
Processes for the Intersection
 7 Timing Processes for the Intersection In Chapter 6, you studied the operation of one intersection approach and determined the value of the vehicle extension time that would extend the green for as long
Estimation of inter-rater reliability
 Estimation of inter-rater reliability January 2013 Note: This report is best printed in colour so that the graphs are clear. Vikas Dhawan & Tom Bramley ARD Research Division Cambridge Assessment Ofqual/13/5260
Ragyor Readability Estimate
 Across Five Aprils By Irene Hunt (Berkley JAM edition, 2002) Ragyor Readability Estimate PURPOSE OF THE STRATEGY Devised by Alton Raygor (1977), this readability formula is designed specifically for middle/secondary
User s Manual. Log Scale (/LG) GX10/GX20/GP10/GP20/GM10 IM 04L51B01-06EN. 3rd Edition
 GX10/GX20/GP10/GP20/GM10 IM 04L51B01-06EN. 3rd Edition") User s Manual Model GX10/GX20/GP10/GP20/GM10 Log Scale (/LG) 3rd Edition Introduction Thank you for purchasing the SMARTDAC+ Series GX10/GX20/GP10/GP20/GM10 (hereafter referred to as the recorder, GX,
User s Manual Model GX10/GX20/GP10/GP20/GM10 Log Scale (/LG) 3rd Edition Introduction Thank you for purchasing the SMARTDAC+ Series GX10/GX20/GP10/GP20/GM10 (hereafter referred to as the recorder, GX,
The One Penny Whiteboard
 The One Penny Whiteboard Ongoing, in the moment assessments may be the most powerful tool teachers have for improving student performance. For students to get better at anything, they need lots of quick
Sandwich. Reuben BLT. Egg salad. Roast beef
 3.2 Writing Expressions represents an unknown quantity? How can you write an expression that 1 ACTIVITY: Ordering Lunch Work with a partner. You use a $20 bill to buy lunch at a café. You order a sandwich
COMPOSITE VIDEO LUMINANCE METER MODEL VLM-40 LUMINANCE MODEL VLM-40 NTSC TECHNICAL INSTRUCTION MANUAL
 COMPOSITE VIDEO METER MODEL VLM- COMPOSITE VIDEO METER MODEL VLM- NTSC TECHNICAL INSTRUCTION MANUAL VLM- NTSC TECHNICAL INSTRUCTION MANUAL INTRODUCTION EASY-TO-USE VIDEO LEVEL METER... SIMULTANEOUS DISPLAY...
Trainee Registration:
 Trainee Registration: On opening the url http://kaushalkar.com, the fourth menu item in the menu bar at the top is Trainee Registration menu item. Clicking this displays the following screen: The Select
MA 15910, Lesson 5, Algebra part of text, Sections 2.3, 2.4, and 7.5 Solving Applied Problems
 MA 15910, Lesson 5, Algebra part of text, Sections 2.3, 2.4, and 7.5 Solving Applied Problems Steps for solving an applied problem 1. Read the problem; carefully noting the information given and the questions
Chapter 2 Notes.notebook. June 21, : Random Samples
 2.1: Random Samples Random Sample sample that is representative of the entire population. Each member of the population has an equal chance of being included in the sample. Each sample of the same size
Copyright 2013 Pearson Education, Inc.
 Chapter 2 Test A Multiple Choice Section 2.1 (Visualizing Variation in Numerical Data) 1. [Objective: Interpret visual displays of numerical data] Each day for twenty days a record store owner counts the
THE DIGITAL DELAY ADVANTAGE A guide to using Digital Delays. Synchronize loudspeakers Eliminate comb filter distortion Align acoustic image.
 THE DIGITAL DELAY ADVANTAGE A guide to using Digital Delays Synchronize loudspeakers Eliminate comb filter distortion Align acoustic image Contents THE DIGITAL DELAY ADVANTAGE...1 - Why Digital Delays?...
PYROPTIX TM IMAGE PROCESSING SOFTWARE
 Innovative Technologies for Maximum Efficiency PYROPTIX TM IMAGE PROCESSING SOFTWARE V1.0 SOFTWARE GUIDE 2017 Enertechnix Inc. PyrOptix Image Processing Software v1.0 Section Index 1. Software Overview...
x) Graph the function
 Graph the function") 1) If and, find and 2) If, find 3) Use the definition of logarithms to rewrite this equation in exponential form: 4) Expand 5) a) Evaluate and show how you got the answer without a calculator. b) Evaluate
1) If and, find and 2) If, find 3) Use the definition of logarithms to rewrite this equation in exponential form: 4) Expand 5) a) Evaluate and show how you got the answer without a calculator. b) Evaluate
Applications of Mathematics
 Write your name here Surname Other names Pearson Edexcel GCSE Centre Number Candidate Number Applications of Mathematics Unit 1: Applications 1 For Approved Pilot Centres ONLY Higher Tier Wednesday 6 November