Acoustic Camera 2018
|
|
|
- Gwendolyn Morrison
- 5 years ago
- Views:
Transcription


1 Acoustic Camera 2018


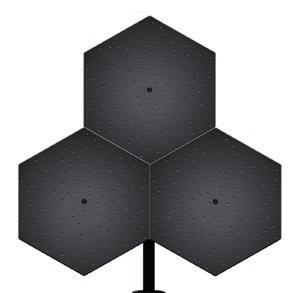
2 Product presentation A new modular design concept for acoustic arrays Acoustic beamforming arrays, commonly known as acoustic cameras, enable the user to visualise different sound sources at different frequencies and source strengths. The resolution and ability to resolve sound sources spaced closely apart, and at lower frequencies, is mainly decided by overall size and number of microphones of the equipment being used. Although image manipulation and deconvolution techniques on the beamformed results might give added resolution, in practise the properties of the array still influence the results. This size versus resolution criteria is the crux of the acoustic camera market. Users want something that is small, light weight, and portable, while at the same time having excellent resolution, and the ability to go low in frequency. This has been an impossible demand for a single system - until now. Hextile Lightweight and portable The Norsonic Hextile is a module based approach to acoustic camera that gives the user both portability and great resolution for a wide range of measurement situations. The array dish is based on a hexagon shape, given it both its name, and the ability to combine several tiles into larger systems. With a single Hextile, the user has a small, portable and lightweight acoustic camera that can be used for a wide range of measurement situations. The Hextile is a USB based acoustic camera, with a single USB cable for both power and data transfer - no extra battery cable needed. The array is made from robust and lightweight aluminium, has 128 MEMS microphones, and is less than 3 kg in weight while having a maximum diameter of 46 cm. The low frequency limit for the Hextile is 410 Hz. For users that require better resolution both in lower frequencies and overall, three single Hextiles can be combined to a larger Multitile system, consisting of 384 microphones with a maximum diameter of 96 cm. The low frequency limit for the Multitile is 220 Hz. For special low frequency applications below 1 khz, it is also possible to utilise the Multitile in the low frequency configuration as the Multitile-LF. By placing the individual Hextiles further away, the maximum diameter of the complete array system is increased to 1.46 m, making it ideal for low frequency measurements. The Multitile-LF is for low frequency measurements below 1 khz, with a lowest frequency limit of 120 Hz db db 500 Hz 1 khz 1.5 khz 3 khz -10 db 60-3 db 90 Array geometry and beampattern for Hextile 2

3 Product presentation Multitile Great resolution Multitile-LF Low frequency measurements Hz 1 khz 1.5 khz 3 khz Hz 500 Hz 700 Hz 1 khz db -20 db -10 db -3 db db -20 db -10 db -3 db 90 Array geometry and beampattern for Multitile Array geometry and beampattern for Multitile-LF 3
4 Product presentation Array specifications Audio and video Connection Microphones Max sound level Min sound level (system) SNR per microphone SNR array (system) Audio sampling rate Camera resolution Opening angle Frame rate Operating temperature range Frequency response Per microphone (flat) Per microphone Spatial sensitivity Hextile Spatial sensititivy Multitile Spatial sensititivy Multitile-LF Physical Dimension Hextile Dimension Multitile Dimension Multitile-LF Weight Hextile Weight Multitile Material Power consumption USB 128 MEMS microphones 120 db 9 dba 65 dba 82 dba 44.1 khz 2592 x FPS -40 to Hz - 20 khz -26 khz 94 db 410 Hz - 20 khz 220 Hz - 20 khz 120 Hz - 1 khz 41 cm x 48 cm, Ø 48 cm 83 cm x 84 cm, Ø 96 cm 126 cm x 121 cm, Ø 146 cm < 3 kg < 10 kg Aluminium < 2 W Max side lobe level, and mean side lobe energy Side lobe level [db] Side lobe level [db] Hextile Max side lobe level Mean side lobe energy k 2k 3k 5k 8k 15k 20k Log Frequency [Hz] Multitile Max side lobe level Mean side lobe energy k 2k 3k 5k 8k 15k 20k Half power beamwidth (HPBW) 180 Hextile Multitile Multitile-LF 0-5 Multitile-LF Max side lobe level Mean side lobe energy Opening angle [deg] Side lobe level [db] k 2k 3k 5k 8k 15k Log Frequency [Hz] k Log Frequency [Hz] 4


5 Product presentation Low frequency performance at 500 Hz The biggest improvement when going from a single Hextile to the two different Multitile configurations is best demonstrated on a low frequency source. Seen below are the results from recordings on a single omnidirectional noise source emitting pink noise, with the colour plotting being done when the input signals are filtered at 500 Hz. This should give a direct comparison of the low frequency capability of the different arrays. At the top are the different array configurations used for the recordings, with a 128 element Hextile, a 384 element Multitile, and a 384 element Multitile-LF. The diameters of the array configurations are 46 cm, 96 cm, and 1.46 m respectively. The second rows show the beampattern for the different array configurations at 500 Hz and 3 db dynamic range. As can be seen the beampattern gets more narrow, thus giving better resolution, as the overall array size increases. Lastly the plotting results from the three different array configurations recorded on a real noise source are shown with 3 db dynamic. The improvement in terms of resolution and pin-pointing the source is clearly visible when using bigger equipment. 126 cm 83 cm 41 cm 121 cm 84 cm 48 cm Hz Hz Hz db -20 db -10 db -3 db db -20 db -10 db -3 db db -20 db -10 db -3 db 90 Array geometry, beampattern at 500 Hz, and plotting results of pink noise source filtered at 500 Hz for Hextile, Multitile and Multitile-LF 5


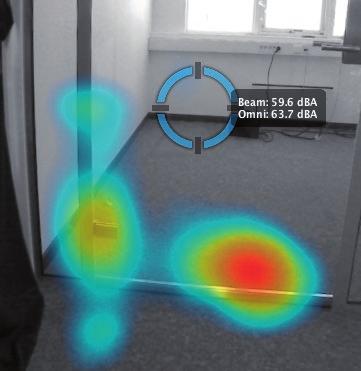
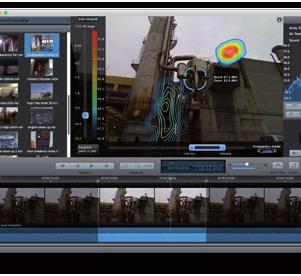
6 Software Intuitive software design The software design strategy has always had user friendliness and ease of use in mind. We want the user to be able to get results quickly, and start analysing recordings easily, thus spending time on the analysis, rather than the measurement set up or configuration of parameters. Live view of measurements combined with an intuitive software interface enables users without prior experience to make measurements within the first five minutes after powering the device. Virtual microphone The one feature that really sets the software apart is the virtual microphone. The virtual microphone enables the capability to only get audio signels from the chosen listening point, and listen to sounds coming from specific directions of the video image, while suppressing noise and sounds emitting from other positions than what is selected. With this tool the user has the power of super hearing, and may gain more insight in addition to regular colour plotting of sources. Such super hearing may be especially useful in noisy and complex sound environments, where for instance different noise sources greatly impair the ability to distinguish which machinery is producing a faulty noise. by the stronger source. Seen in the image below is a situation where two equally strong sources are positioned close to one another, and the resulting colour plot will display a single large source. In such situations the acoustic eraser feature may prove valuable. This function will add a red circle to the screen that can be dragged to any point, and remove the source from that point. This is highly effective when several noise sources are present. As seen on the pictures the acoustic eraser completely removes the source where the suppress point button is positioned. The virtual microphone can further be positioned on the source of interest. Advanced post-processing audio analysis In addition to live plotting and directive listening, it is also possible to record measurements and do the analysis at a later time. The raw signal from all microphones are then saved, and all parameters such as frequency selection, time selection and so on can be changed in post-processing. This means that a recording can be done without selecting the optimal parameters during the measurement, since these can be changed when analysing the recording. This also means that anybody can do the actual recordings themselves since it is then basically a matter of pointing the array roughly towards the area of interest and pressing record. All analysis and changes of parameters can be done in post-processing such as directive listening, graphical overlay of sources, spectrogram, FFT analysis and so on. Acoustic eraser Sometimes sources may be closely spaced apart, or a strong noise source in the area of interest is interfering with the recording and impairing the image quality. Often this will be seen as either a single large source, or the source of interest will be completely shadowed 6


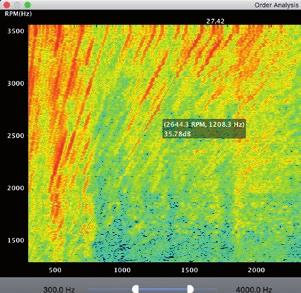
7 Software Order analysis Especially in automotive applications RPM measurements may give vital information. The acoustic camera software has the possibility to display frequency content as a function of RPM by using the order analysis function. In the spectrogram window, frequency as a function of RPM is plotted. It is further possible to select a square in the spectrogram window to isolate interesting events. By pressing the apply button on the selection, the RPM and frequency limits in the main view window automatically change to the limits set by the selection in the spectrogram. The user may then find and interesting sound event in the spectrogram, and automatically get the corresponding colour plotting of the event chosen. RPM and frequency selection is automatically changed to the corresponding limits 7

8 Software Virtual microphone position selected by the cursor. Used for analysis and listening Thumbnail of recordings Select the colour range Enable the acoustic eraser Playback control Time axis Video frames for quick navigation within recording 8

9 Software Set the focal distance Display spectrogram Display the spectrum as FFT, 1/3 or 1/1 octave A, C or flat frequency weighting selection RPM and order tracking Set the frequency range Listen to broadband or selected frequency band Sound level history 9


10 Applications Automotive Case study: Identifying Short Time High Pitch Squeak Noise from Electric Window in Car Door A well known car manufacturer in Korea are testing an automatic car door window intended for one of their new car models. The window is driven by an electric engine positioned in the middle of the car door that drives the window up and down. When the window was driven up by the electric motor, a short timed high pitch squeak noise could be heard. The squeak noise was obviously connected to the window and the car door, but the localisation of the source of the problem proved difficult. The acoustic camera was positioned at a distance of 2.0 m from the car door, with the front-end of the camera pointed straight at the door. The recording consisted of an event of the car window going up whilst being driven by the electric engine. In addition to the high pitch squeak noise, sound from the electric engine could also be heard which was around 670 Hz. Since this sound was present during the entire recording, it could be easy to misinterpret the results and pinpoint the source of the high pitch noise to the wrong location without doing proper analysis. As seen in the image below, the location of the electric engine was in the middle of the door. pane of the acoustic camera software, it was then possible to analyse events happening only within the time frame of the extent of the scene. The scene is made by simply dragging the cursor over the region of interest in the software. Now by calculating the average spectral density over that part of the recording, it was easy to see that in addition to the noise from the electric motor around 670 Hz, a high pitch tonal noise with a fundamental frequency around 1890 Hz could also be seen in the frequency spectrum. In addition harmonics of the fundamental frequency up to the 7th harmonic was visible in the spectrum. Now by filtering the frequency content of interest around the fundamental frequency, it was possible to get a clearer indication of the position of the source of the high pitch squeak noise as seen below. Due to the tonal nature of the noise it was possible to switch from the ordinary, robust wideband algorithm, to the adaptive algorithm for narrowband applications. This further helped in pinpointing the exact location of the problem. Higher resolution could also be achieved by zooming further in the image. As opposed to the stationary sound from the electric engine, the high pitch squeak noise was only happening for a brief period of time, around 300 ms. By defining a scene in the sound level indicator 10


11 Applications Industry Case study: Identifying Low-Frequency Tonal Noise in Windy and Noisy Conditions A large LNG gas facility (approximately 300 m x 150 m) producing tons of LNG annually is situated in a terminal area with the nearest populated area at a distance of around 1 km. Within the gas production facility, a low-frequency tonal noise at around 500 Hz is generated causing complaints from nearby neighbors. The tone imposes a more stringent noise requirement on the facility, forcing noise reducing actions being made on the source. In addition to the tonal noise, the entire LNG gas facility is rich in noise emitting sources, including lossing and loading of maritime vessels, which further complicates the source location of the single tonal noise source. Also the location of the facility at the coastal regions of the western part of Norway, ensures that windy conditions are frequent, with wind noise further impeding the quality of acoustic recordings. By positioning the center of the array towards the pipe and adjusting the frequency to display only coloring within the 500 Hz 1/3-band, the noise source was located within seconds, and the source producing the tonal part from the pipe was detected. Measurements from different measurement positions also confirmed the source location. Based on measurements with hand held sound level meters, the problem area was narrowed down to be a large pipe in the midst of the facility. However it could not be determined if the emitted tonal noise was from the entire pipe itself, or if it originated at a specific part of the pipe. There was also uncertainty whether there existed multiple sources within the pipe, for instance at both the base and top layer. In the worst case the noise insulation would have to be performed over the entire pipe length, which could have been a very expensive solution. By placing the virtual microphone on the localised source and using the spectrogram function, it was easy to verify the position of the source emitting a tone at 460 Hz. Although the measurement location had quite windy conditions, the wind noise did not affect the measurement results at all. Wind noise can be viewed as spatially white, which means that wind noise sampled at different places in space, is not correlated from position to position. When many different signals from many microphones are added in the beamforming algorithm, the wind noise will be added out of phase and attenuated proportional with the number of microphones being used. With the acoustic camera it was possible to detect the tonal sound of the most crucial parts of the turbine. This meant that the facility could focus on and implement noise reduction actions in the right places. After pin pointing the location of the noise source, further analysis could be made with measurements performed closer to the source of interest in order to further determine the position and cause of the generated tonal noise. 11


12 Applications Sound source identification Case study: Pinpointing Low Level Sanitary Noise in Apartment Building A newly built apartment building consists of several floors with multiple apartments on each floor. One of the ground floor apartments is disturbed by sanitary noise from the apartment above, which is heard whenever the toilets in the top apartment are being flushed. The sanitary noise is heard in several rooms, and the level was measured to be around 30 to 35 db, which is above the noise criteria set in the regulations. The culprit was thought to be embedded pipelines in one of the corners of the living room, and several measures were made on this area. Although increased insulation improved the noise dampening capabilities of the embedded pipelines, the noise was still heard. Also the improvements could not explain the fact that the noise was also heard in two bedrooms, one of which was not adjacent to the living room. This was a very strong indication that the origin of the noise was in fact located somewhere else, and the camera was directed accordingly for the subsequent measurements. When pointing the camera towards the ceiling it became apparent that the source was at this position. No other spots, either from the embedded pipes in the corner of the living room, or from the hallway, had any visible colouring, and could be excluded as the likely position of the origin of the source. By using the virtual microphone, which enables the user to listen to a specific position in both real time and in a recording, one could clearly hear the sanitary noise from the recorded position at the roof. Also by enabling the bandpass filter one could further be able to filter out background noise and very clearly hear the sanitary noise from the piping. Based on these measurements one could deduct that the water pipes in were in fact not positioned as previously thought. Given that the measured sound pressure levels were so low, it was very difficult to detect any real change in sound pressure level from different measurement positions. Also trying to locate the origin by hearing in different positions proved to be futile when trying to determine source position. In addition to hearing the noise in several rooms, it was also heard in the hallway and it was uncertainty whether there existed a single source location or several. When filming at the location of the encased pipes in the corner of the living room, the acoustic camera did not pick up any energy at that position, but rather the colouring was upwards towards the roof and outside the field of view of the camera at that measurement position. In addition to measurements in the living room subsequent measurements were also made in the two bedrooms. These measurements displayed the same result, the energy of the noise did not come from the walls, but were confined to the roof. All in all this was a very strong indication that the problem was piping located in separating floors between apartments. 12


13 Applications Sound leakage Case study: Filming Breakout Noise from Café and Concert Venue By focusing on the door only it was further possible to locate the exact position of, and zoom in on, those weaknesses as seen in the images below. A combined bar, bistro and concert venue in the city center has been renovated with a great emphasis on acoustic noise dampening. Nevertheless, the venue is still getting complaints from neighbors close by due to breakout noise from the location, especially during late night concerts. The establishment consists of a bar and bistro on the ground floor, with the concert venue on the floor above. The concert venue has several windows facing the outside street and neighborhood buildings, and it was desirable to pin point any acoustic weaknesses in these windows. Also it was of interest to see if the wall itself needed additional measures, or if the main source contribution came from the windows alone. For the recordings the acoustic camera was placed outside pointing at the facade of interest, with the audio system inside of the music venue playing white noise at volumes up to 100 dba. The room inside would then act as a sending room, and the outside as the receiving room. The wall between the café leading to the patio consists of both a door and several windows. The first step consisted in seeing what made the biggest noise contribution. As seen in the image below, where the dynamic range is set to 10 db, the door had a noise contribution that was approximately 10 db higher than the nearest window. 13


14 Applications Environmental noise Case study: Measuring Impact of Traffic Noise in Apartment Living Room An apartment on the ground floor of a two story house in the city lies close to a busy road. The living room in the apartment is facing the road, and the inhabitants are bothered by traffic noise, especially in the morning and the afternoon, when the traffic is the heaviest. Traffic noise could be clearly heard when standing in the living room. The facade facing the city street consists of a large window and a porch door. It was thought that the main contribution of noise came from these two parts, but it was difficult to verify if those assumptions were true, or exactly where any weaknesses in the structure might be located. For the recordings the acoustic camera was placed inside the living room pointing at the facade facing the street. The living room would hence act as the receiving room, and the outside as the sending room, much in the same sense as the procedure for sound insulation measurements. Weaknesses in the facade would then be possible to be seen as small noise sources in the structure. It was possible to use regular traffic as sound source, regardless whether the traffic was steady, or just a single vehicle from time to time. In addition to using traffic as noise source, measurements were made by placing a omnidirectional loudspeaker emitting white noise on the outside of the facade. This created a more stationary sound field on the outside of the structure, and made detection of small cracks and gaps in the structure even easier. Initial recordings when using traffic as noise source displayed a single strongest facade weakness at the top left of the living room wall. This strongest source position was also confirmed when using the omnidirectional loudspeaker as noise source. At this position a ventilation valve was installed, and most of the traffic noise came from this location. Having determined that the intake valve was the main noise contributor, this spot was covered up with a pillow to remove it from the overall noise field, and try to locate secondary sources. By filtering on a relatively high frequency band around 3-4 khz, it was possible to filter out only the noise being emitted by small gaps and cracks. This produced two new possible weaknesses, one on the porch door, and another on the air valve above the window. 14

15 Applications Building acoustics Case study: Finding Acoustical Weak Points in Room Dividing Modular Walls A conference hotel is using modular walls to divide large halls into several smaller conference rooms. The rooms are divided by modular walls that provide several different opportunities for subdivision and multipurpose use of the large area spaces. When measuring the sound insulation between adjacent rooms through the modular walls, the resulting value was found to be too low, and noise from one conference room could possibly disturb listeners at adjacent rooms. The dividing modular walls cover large areas, and are as high as 7 meters from bottom to top, which makes intensity measurements with hand held sound level meters difficult. The room dividers could have several weak points, which were not easily identifiable. It was thought that identifying and fixing the weak points in the individual modular walls would help increase the overall sound insulation capabilities of the entire wall element. The acoustic camera was plugged into an external battery pack for easy transportation and mobility. The measurement procedure consisted of choosing two adjacent rooms divided by a modular wall of interest. One of the rooms was chosen to act as receiving room, where the acoustic camera was positioned. A noise source and omnidirectional loudspeaker generating white noise at high volume was positioned in the source room. The speaker was placed in one of the corners of the room furthest away from the dividing wall, in order to achieve as diffuse source noise field as possible. Due to the large size of the modular walls, the camera was pointed to different areas of the walls, and several measurements were made. The individual measurements could then be examined further in post-processing analysis. Due to the source being used at high volume in the sending room, cracks and gaps in the modular walls would appear as small noise sources at specific location on the walls when recording with the acoustic camera in the receiving room. The acoustic camera was able to locate several weak spots on the walls, even though the range where differences could be discovered were for certain areas below 0.05 db. The measurement system s virtual microphone feature was also very helpful during live measurements. With this function you can scan and listen to the desired spots in the image, and also filter the listening function to desired frequency range. This made it possible to scan along edges and hear differences in frequency from different points. A change in frequency may indicate a sound leakage. Also by using the spectrogram function to get a visual representation of the spectrum of frequencies as they varied with time, one could further indicate a leakage at various parts of the walls. 15
16 P.O. Box 24, N-3421 Lierskogen, Norway Tel.: Fax Innovative sound instrumentation Product Catalogue v0418-1
HEAD. HEAD VISOR (Code 7500ff) Overview. Features. System for online localization of sound sources in real time
 Overview. Features. System for online localization of sound sources in real time") HEAD Ebertstraße 30a 52134 Herzogenrath Tel.: +49 2407 577-0 Fax: +49 2407 577-99 email: info@head-acoustics.de Web: www.head-acoustics.de Data Datenblatt Sheet HEAD VISOR (Code 7500ff) System for online
HEAD Ebertstraße 30a 52134 Herzogenrath Tel.: +49 2407 577-0 Fax: +49 2407 577-99 email: info@head-acoustics.de Web: www.head-acoustics.de Data Datenblatt Sheet HEAD VISOR (Code 7500ff) System for online
DESIGNING OPTIMIZED MICROPHONE BEAMFORMERS
 3235 Kifer Rd. Suite 100 Santa Clara, CA 95051 www.dspconcepts.com DESIGNING OPTIMIZED MICROPHONE BEAMFORMERS Our previous paper, Fundamentals of Voice UI, explained the algorithms and processes required
Video VBOX Pro RLVD10P2P/RLVD10P2PV/RLVD10P4PV/RLVD20P2PV/RLVD20P4PV. Features
 Video VBOX Pro combines a powerful GPS data logger with a high quality multi-camera video recorder and real-time graphics engine. Multi Camera Recording Taking up to four waterproof cameras and combining
Signal Stability Analyser
 Signal Stability Analyser o Real Time Phase or Frequency Display o Real Time Data, Allan Variance and Phase Noise Plots o 1MHz to 65MHz medium resolution (12.5ps) o 5MHz and 10MHz high resolution (50fs)
Advanced Techniques for Spurious Measurements with R&S FSW-K50 White Paper
 Advanced Techniques for Spurious Measurements with R&S FSW-K50 White Paper Products: ı ı R&S FSW R&S FSW-K50 Spurious emission search with spectrum analyzers is one of the most demanding measurements in
Using the new psychoacoustic tonality analyses Tonality (Hearing Model) 1
 1") 02/18 Using the new psychoacoustic tonality analyses 1 As of ArtemiS SUITE 9.2, a very important new fully psychoacoustic approach to the measurement of tonalities is now available., based on the Hearing
02/18 Using the new psychoacoustic tonality analyses 1 As of ArtemiS SUITE 9.2, a very important new fully psychoacoustic approach to the measurement of tonalities is now available., based on the Hearing
Using the BHM binaural head microphone
 11/17 Using the binaural head microphone Introduction 1 Recording with a binaural head microphone 2 Equalization of a recording 2 Individual equalization curves 5 Using the equalization curves 5 Post-processing
Getting Started with the LabVIEW Sound and Vibration Toolkit
 1 Getting Started with the LabVIEW Sound and Vibration Toolkit This tutorial is designed to introduce you to some of the sound and vibration analysis capabilities in the industry-leading software tool
Video VBOX Waterproof
 () Video VBOX Waterproof combines a powerful GPS data logger with a high quality multi-camera video recorder and real-time graphics engine, allowing you to carry out detailed driver training and vehicle
Software Package WW 9038 for the Sound Intensity Analysing System Type 3360 or the Digital Frequency Analyzer Type 2131
 Software Package WW 9038 for the Sound Intensity Analysing System Type 3360 or the Digital Frequency Analyzer Type 2131 BO 0065-11 Software Package WW 9038 for the Sound Intensity Analysing System Type
SHARP Plasma inverter cutting range
 SHARP Plasma inverter cutting range Sword edge cutting www.cemont.com The plasma expert advanced powerful all metals performance portable solutions plasma gouging maintenance high quality The plasma process
PRESTOJET Plasma inverter cutting range
 PRESTOJET Plasma inverter cutting range Sword edge cutting www.saf-fro.com The plasma expert advanced powerful all metals performance portable solutions inverter plasma gouging maintenance high quality
Video VBOX Lite RLVBVD10LT2. Powerful VBOX data logging and video technology in a user-friendly, affordable product. What can Video VBOX Lite do?
 Powerful VBOX data logging and video technology in a user-friendly, affordable product Video VBOX Lite is a one box solution, incorporating a solid state video recorder, a VBOX 10 Hz GPS data logger and
CITOCUT Plasma inverter cutting range
 CITOCUT Plasma inverter cutting range Sword edge cutting www.oerlikon-welding.com The plasma expert advanced plasma cutting powerful all metals performance portable solutions inverter plasma gouging maintenance
Mr. Chris Cocallas University Architect and Director Capital Planning and Construction Colorado School of Mines th St. Golden, Colorado 80401
 Mr. Chris Cocallas University Architect and Director Capital Planning and Construction Colorado School of Mines 1801 19th St. Golden, Colorado 80401 Re: GRL and GRLA Building Noise Study Wave #1434 Dear
CITOCUT Plasma inverter cutting range
 CITOCUT Plasma inverter cutting range Sword edge cutting www.oerlikon-welding.com The plasma expert advanced powerful all metals performance portable solutions inverter plasma gouging maintenance high
Model 7330 Signal Source Analyzer Dedicated Phase Noise Test System V1.02
 Model 7330 Signal Source Analyzer Dedicated Phase Noise Test System V1.02 A fully integrated high-performance cross-correlation signal source analyzer from 5 MHz to 33+ GHz Key Features Complete broadband
Signal to noise the key to increased marine seismic bandwidth
 Signal to noise the key to increased marine seismic bandwidth R. Gareth Williams 1* and Jon Pollatos 1 question the conventional wisdom on seismic acquisition suggesting that wider bandwidth can be achieved
Savant. Savant. SignalCalc. Power in Numbers input channels. Networked chassis with 1 Gigabit Ethernet to host
 Power in Numbers Savant SignalCalc 40-1024 input channels Networked chassis with 1 Gigabit Ethernet to host 49 khz analysis bandwidth, all channels with simultaneous storage to disk SignalCalc Dynamic
inter.noise 2000 The 29th International Congress and Exhibition on Noise Control Engineering August 2000, Nice, FRANCE
 Copyright SFA - InterNoise 2000 1 inter.noise 2000 The 29th International Congress and Exhibition on Noise Control Engineering 27-30 August 2000, Nice, FRANCE I-INCE Classification: 0.0 OPTIMUM ARRAY MICROPHONE
FLOW INDUCED NOISE REDUCTION TECHNIQUES FOR MICROPHONES IN LOW SPEED WIND TUNNELS
 SENSORS FOR RESEARCH & DEVELOPMENT WHITE PAPER #42 FLOW INDUCED NOISE REDUCTION TECHNIQUES FOR MICROPHONES IN LOW SPEED WIND TUNNELS Written By Dr. Andrew R. Barnard, INCE Bd. Cert., Assistant Professor
R&S EFL110/EFL210 Cable TV Analyzer and Leakage Detector Detecting interference in cable TV and LTE networks
 R&S EFL110/EFL210 Cable TV Analyzer and Leakage Detector Detecting interference in cable TV and LTE networks Broadcasting Product Brochure 02.00 R&S EFL110/ R&S EFL210 Cable TV Analyzer and Leakage Detector
StepArray+ Self-powered digitally steerable column loudspeakers
 StepArray+ Self-powered digitally steerable column loudspeakers Acoustics and Audio When I started designing the StepArray range in 2006, I wanted to create a product that would bring a real added value
Analysis of the effects of signal distance on spectrograms
 2014 Analysis of the effects of signal distance on spectrograms SGHA 8/19/2014 Contents Introduction... 3 Scope... 3 Data Comparisons... 5 Results... 10 Recommendations... 10 References... 11 Introduction
VTX V25-II Preset Guide
 VTX V25-II Preset Guide General Information: VTX V25-II Preset Guide Version: 1.1 Distribution Date: 10 / 11 / 2016 Copyright 2016 by Harman International; all rights reserved. JBL Professional 8500 Balboa
Coopers Gap Wind Farm AGL Energy Ltd 23-Aug-2016 Doc No AC-RP-02- Facade Sound Insulation Test Report
 Wind Farm AGL Energy Ltd 23-Aug-2016 Doc No. 60489152-AC-RP-02- Facade Sound Insulation Test Report Facade Sound Insulation Assessment Report Wind Farm Facade Sound Insulation Assessment Report Client:
DH400. Digital Phone Hybrid. The most advanced Digital Hybrid with DSP echo canceller and VQR technology.
 Digital Phone Hybrid DH400 The most advanced Digital Hybrid with DSP echo canceller and VQR technology. The culmination of 40 years of experience in manufacturing at Solidyne, broadcasting phone hybrids,
A Real Word Case Study E- Trap by Bag End Ovasen Studios, New York City
 21 March 2007 070315 - dk v5 - Ovasen Case Study Written by David Kotch Edited by John Storyk A Real Word Case Study E- Trap by Bag End Ovasen Studios, New York City 1. Overview - Description of Problem
A Real Word Case Study E- Trap by Bag End Ovasen Studios, New York City
 21 March 2007 070315 - dk v5 - Ovasen Case Study Written by David Kotch Edited by John Storyk A Real Word Case Study E- Trap by Bag End Ovasen Studios, New York City 1. Overview - Description of Problem
14 GHz, 2.2 kw KLYSTRON GENERATOR GKP 22KP 14GHz WR62 3x400V
 14 GHz, 2.2 kw KLYSTRON GENERATOR GKP 22KP 14GHz WR62 3x400V With its characteristics of power stability independent of the load, very fast response time when pulsed (via external modulated signal), low
MTS/T-BERD Platforms WDMPMD Module
 ACTERNA TEST & MEASUREMENT SOLUTIONS MTS/T-BERD Platforms WDMPMD Module Key Features A unique solution combining OSA, PMD, and SA test functions in one plug-in module The most compact PMD/WDM/SA test solution
ex 800 Series ematrix System
 Protecting Your Human Assets During Emergency ex 800 Series ematrix System The ex 800 Series ematrix System is a fully integrated and versatile public address system which is designed distinctively to
18 GHz, 2.2 kw KLYSTRON GENERATOR GKP 24KP 18GHz WR62 3x400V
 18 GHz, 2.2 kw KLYSTRON GENERATOR GKP 24KP 18GHz WR62 3x400V With its characteristics of power stability whatever the load, very fast response time when pulsed (via external modulated signal), low ripple,
7000 Series Signal Source Analyzer & Dedicated Phase Noise Test System
 7000 Series Signal Source Analyzer & Dedicated Phase Noise Test System A fully integrated high-performance cross-correlation signal source analyzer with platforms from 5MHz to 7GHz, 26GHz, and 40GHz Key
Psychoacoustic Evaluation of Fan Noise
 Psychoacoustic Evaluation of Fan Noise Dr. Marc Schneider Team Leader R&D - Acoustics ebm-papst Mulfingen GmbH & Co.KG Carolin Feldmann, University Siegen Outline Motivation Psychoacoustic Parameters Psychoacoustic
Choosing an Oscilloscope
 Choosing an Oscilloscope By Alan Lowne CEO Saelig Company (www.saelig.com) Post comments on this article at www.nutsvolts.com/ magazine/article/october2016_choosing-oscilloscopes. All sorts of questions
DETECTING ENVIRONMENTAL NOISE WITH BASIC TOOLS
 DETECTING ENVIRONMENTAL NOISE WITH BASIC TOOLS By Henrik, September 2018, Version 2 Measuring low-frequency components of environmental noise close to the hearing threshold with high accuracy requires
Versatile EMS and EMI measurements for the automobile sector
 EMC/FIELD STRENGTH EMC Measurement Software R&S EMC32-A Versatile EMS and EMI measurements for the automobile sector EMC Measurement Software R&S EMC32-A (automotive) from Rohde & Schwarz is a powerful
Simple Harmonic Motion: What is a Sound Spectrum?
 Simple Harmonic Motion: What is a Sound Spectrum? A sound spectrum displays the different frequencies present in a sound. Most sounds are made up of a complicated mixture of vibrations. (There is an introduction
Linatron - M9 & M9A. Modular high-energy X-ray source. 2.0 Performance
 The Linatron -M is a modular system. The control console, modulator, and RF unit are common to all model configurations. Only the X-ray head changes to match the application. The Linatron - M is designed
Spectrum Analyser Basics
 Hands-On Learning Spectrum Analyser Basics Peter D. Hiscocks Syscomp Electronic Design Limited Email: phiscock@ee.ryerson.ca June 28, 2014 Introduction Figure 1: GUI Startup Screen In a previous exercise,
Performing a Sound Level Measurement
 APPENDIX 9 Performing a Sound Level Measurement Due to the many features of the System 824 and the variety of measurements it is capable of performing, there is a great deal of instructive material in
THE NEW LASER FAMILY FOR FINE WELDING FROM FIBER LASERS TO PULSED YAG LASERS
 FOCUS ON FINE SOLUTIONS THE NEW LASER FAMILY FOR FINE WELDING FROM FIBER LASERS TO PULSED YAG LASERS Welding lasers from ROFIN ROFIN s laser sources for welding satisfy all criteria for the optimized laser
Multiband Noise Reduction Component for PurePath Studio Portable Audio Devices
 Multiband Noise Reduction Component for PurePath Studio Portable Audio Devices Audio Converters ABSTRACT This application note describes the features, operating procedures and control capabilities of a
DP1 DYNAMIC PROCESSOR MODULE OPERATING INSTRUCTIONS
 DP1 DYNAMIC PROCESSOR MODULE OPERATING INSTRUCTIONS and trouble-shooting guide LECTROSONICS, INC. Rio Rancho, NM INTRODUCTION The DP1 Dynamic Processor Module provides complete dynamic control of signals
MachineryMate 800 operating guide Handheld vibration meter
 MachineryMate 800 operating guide Handheld vibration meter Wilcoxon Sensing Technologies 20511 Seneca Meadows Parkway, Germantown MD 20876, USA Amphenol (Maryland), Inc d/b/a Wilcoxon Sensing Technologies
Design and Realization of the Guitar Tuner Using MyRIO
 Journal of Automation and Control, 2017, Vol. 5, No. 2, 41-45 Available online at http://pubs.sciepub.com/automation/5/2/2 Science and Education Publishing DOI:10.12691/automation-5-2-2 Design and Realization
Generating the Noise Field for Ambient Noise Rejection Tests Application Note
 Generating the Noise Field for Ambient Noise Rejection Tests Application Note Products: R&S UPV R&S UPV-K9 R&S UPV-K91 This document describes how to generate the noise field for ambient noise rejection
Sound Insulation Reporter
 Sound Insulation Reporter for XL2 Sound Level Meter V1.28.00 www.nti-audio.com Jul 18, Page 1 / 58 Index 1. Introduction...3 2. Standards...4 3. My First Steps...5 Software Installation... 5 Additional
Loudness and Sharpness Calculation
 10/16 Loudness and Sharpness Calculation Psychoacoustics is the science of the relationship between physical quantities of sound and subjective hearing impressions. To examine these relationships, physical
JD725A Cable and Antenna Analyzer - Dual Port
 COMMUNICATIONS TEST & MEASUREMENT SOLUTIONS JD725A Cable and Antenna Analyzer - Dual Port Key Features Portable and lightweight handheld instrument Built-in wireless frequency bands as well as the most
Laboratory 5: DSP - Digital Signal Processing
 Laboratory 5: DSP - Digital Signal Processing OBJECTIVES - Familiarize the students with Digital Signal Processing using software tools on the treatment of audio signals. - To study the time domain and
Transporting NV Standardized Testing from the Lab to the Production Environment
 2009-01-2158 Transporting NV Standardized Testing from the Lab to the Production Environment G. Pietila and P. Goodes Sound Answers Copyright 2009 SAE International ABSTRACT NVH labs at Tier 1 and Tier
Instrumentation Grade RF & Microwave Subsystems
 Instrumentation Grade RF & Microwave Subsystems PRECISION FREQUENCY TRANSLATION SignalCore s frequency translation products are designed to meet today s demanding wireless applications. Offered in small
EMI/EMC diagnostic and debugging
 EMI/EMC diagnostic and debugging 1 Introduction to EMI The impact of Electromagnetism Even on a simple PCB circuit, Magnetic & Electric Field are generated as long as current passes through the conducting
UB22z Specifications. 2-WAY COMPACT FULL-RANGE See NOTES TABULAR DATA for details CONFIGURATION Subsystem DESCRIPTION
 DESCRIPTION Ultra-compact 2-way system Wide projection pattern LF on angled baffles to maintain a wide upper/midrange beamwidth High output, high definition sound DESCRIPTION The UB22z is engineered for
SOUND LABORATORY LING123: SOUND AND COMMUNICATION
 SOUND LABORATORY LING123: SOUND AND COMMUNICATION In this assignment you will be using the Praat program to analyze two recordings: (1) the advertisement call of the North American bullfrog; and (2) the
R&S ETH Handheld TV Analyzer Portable DVB-T/H signal analysis up to 3.6/8 GHz
 R&S ETH Handheld TV Analyzer Portable DVB-T/H signal analysis up to 3.6/8 GHz Broadcast Product Brochure 02.00 R&S ETH Handheld TV Analyzer At a glance The R&S ETH handheld TV analyzer was specially designed
PulseCounter Neutron & Gamma Spectrometry Software Manual
 PulseCounter Neutron & Gamma Spectrometry Software Manual MAXIMUS ENERGY CORPORATION Written by Dr. Max I. Fomitchev-Zamilov Web: maximus.energy TABLE OF CONTENTS 0. GENERAL INFORMATION 1. DEFAULT SCREEN
Product Data Sheet 4656 ZW
 The engineer's choice 4656 ZW INDEX 1 General... 3 2 Mechanics... 3 2.1 GENERAL... 3 2.2 CONNECTIONS... 4 3 Operating Data... 5 3.1 ELECTRICAL OPERATING DATA... 5 3.2 OPERATING DATA - ELECTRICAL INTERFACE
Custom-Engineered Drivers
 2 way loudspeaker for portable PA and installation applications Watts continuous, 1,2 Watts peak power High excursion 12" low frequency driver with low mass voice coil for improved transient response 1"
RF Explorer RackPRO. User Manual. Introduction. Greetings fellow traveler on the RF spectrum.
 RF Explorer RackPRO User Manual Introduction Greetings fellow traveler on the RF spectrum. The RF Explorer RackPRO (referred to in this document in shorthand as RackPRO ) has been designed to be intuitive
MAutoPitch. Presets button. Left arrow button. Right arrow button. Randomize button. Save button. Panic button. Settings button
 MAutoPitch Presets button Presets button shows a window with all available presets. A preset can be loaded from the preset window by double-clicking on it, using the arrow buttons or by using a combination
EngineDiag. The Reciprocating Machines Diagnostics Module. Introduction DATASHEET
 EngineDiag DATASHEET The Reciprocating Machines Diagnostics Module Introduction Reciprocating machines are complex installations and generate specific vibration signatures. Dedicated tools associating
Full Disclosure Monitoring
 Full Disclosure Monitoring Power Quality Application Note Full Disclosure monitoring is the ability to measure all aspects of power quality, on every voltage cycle, and record them in appropriate detail
Application Note AN-708 Vibration Measurements with the Vibration Synchronization Module
 Application Note AN-708 Vibration Measurements with the Vibration Synchronization Module Introduction The vibration module allows complete analysis of cyclical events using low-speed cameras. This is accomplished
THE DIGITAL DELAY ADVANTAGE A guide to using Digital Delays. Synchronize loudspeakers Eliminate comb filter distortion Align acoustic image.
 THE DIGITAL DELAY ADVANTAGE A guide to using Digital Delays Synchronize loudspeakers Eliminate comb filter distortion Align acoustic image Contents THE DIGITAL DELAY ADVANTAGE...1 - Why Digital Delays?...
G4500. Portable Power Quality Analyser. Energy Efficiency through power quality
 G4500 Portable Power Quality Analyser Energy Efficiency through power quality The BlackBox portable series power quality analyser takes power quality monitoring to a whole new level by using the revolutionary
EngineDiag. The Reciprocating Machines Diagnostics Module. Introduction DATASHEET
 EngineDiag DATASHEET The Reciprocating Machines Diagnostics Module Introduction Industries Fig1: Diesel engine cylinder blocks Machines Reciprocating machines are complex installations and generate specific
Measurement of overtone frequencies of a toy piano and perception of its pitch
 Measurement of overtone frequencies of a toy piano and perception of its pitch PACS: 43.75.Mn ABSTRACT Akira Nishimura Department of Media and Cultural Studies, Tokyo University of Information Sciences,
Torsional vibration analysis in ArtemiS SUITE 1
 02/18 in ArtemiS SUITE 1 Introduction 1 Revolution speed information as a separate analog channel 1 Revolution speed information as a digital pulse channel 2 Proceeding and general notes 3 Application
EDL8 Race Dash Manual Engine Management Systems
 Engine Management Systems EDL8 Race Dash Manual Engine Management Systems Page 1 EDL8 Race Dash Page 2 EMS Computers Pty Ltd Unit 9 / 171 Power St Glendenning NSW, 2761 Australia Phone.: +612 9675 1414
VivoSense. User Manual Galvanic Skin Response (GSR) Analysis Module. VivoSense, Inc. Newport Beach, CA, USA Tel. (858) , Fax.
 Analysis Module. VivoSense, Inc. Newport Beach, CA, USA Tel. (858) , Fax.") VivoSense User Manual Galvanic Skin Response (GSR) Analysis VivoSense Version 3.1 VivoSense, Inc. Newport Beach, CA, USA Tel. (858) 876-8486, Fax. (248) 692-0980 Email: info@vivosense.com; Web: www.vivosense.com
VivoSense User Manual Galvanic Skin Response (GSR) Analysis VivoSense Version 3.1 VivoSense, Inc. Newport Beach, CA, USA Tel. (858) 876-8486, Fax. (248) 692-0980 Email: info@vivosense.com; Web: www.vivosense.com
Application Note AN-LD09 Rev. B Troubleshooting Low Noise Systems. April, 2015 Page 1 NOISE MEASUREMENT SYSTEM BASELINES INTRODUCTION
 Troubleshooting Low Noise Systems April, 2015 Page 1 INTRODUCTION The exceedingly low level of electronic noise produced by the QCL family of drivers makes narrower linewidths and stable center wavelengths
There are many ham radio related activities
 Build a Homebrew Radio Telescope Explore the basics of radio astronomy with this easy to construct telescope. Mark Spencer, WA8SME There are many ham radio related activities that provide a rich opportunity
Digital SWIR Scanning Laser Doppler Vibrometer
 Digital SWIR Scanning Laser Doppler Vibrometer Scan-Series OptoMET Scanning SWIR Laser Doppler Vibrometer (SLDV) is used for non-contact measurement, visualization and analysis of structural vibrations.
Interface Practices Subcommittee SCTE STANDARD SCTE Measurement Procedure for Noise Power Ratio
 Interface Practices Subcommittee SCTE STANDARD SCTE 119 2018 Measurement Procedure for Noise Power Ratio NOTICE The Society of Cable Telecommunications Engineers (SCTE) / International Society of Broadband
Digital SWIR Scanning Laser Doppler Vibrometer
 Digital SWIR Scanning Laser Doppler Vibrometer Scan-Series OptoMET Scanning SWIR Laser Doppler Vibrometer (SLDV) is used for non-contact measurement, visualization and analysis of structural vibrations.
Digital Effects Pedal Description Ross Jongeward 10 December 2014
 Digital Effects Pedal Description Ross Jongeward 10 December 2014 1 Contents Section Number Title Page 1.1 Introduction..3 2.1 Project Electrical Specifications..3 2.1.1 Project Specifications...3 2.2.1
White Paper JBL s LSR Principle, RMC (Room Mode Correction) and the Monitoring Environment by John Eargle. Introduction and Background:
 and the Monitoring Environment by John Eargle. Introduction and Background:") White Paper JBL s LSR Principle, RMC (Room Mode Correction) and the Monitoring Environment by John Eargle Introduction and Background: Although a loudspeaker may measure flat on-axis under anechoic conditions,
White Paper JBL s LSR Principle, RMC (Room Mode Correction) and the Monitoring Environment by John Eargle Introduction and Background: Although a loudspeaker may measure flat on-axis under anechoic conditions,
DUBLIN TCX102 ## ## Custom-Engineered Drivers
 Product Information Document 2 way loudspeaker for portable PA and installation applications 25 Watts continuous, 1, Watts peak power High excursion 1" low frequency driver with low mass voice coil for
A few white papers on various. Digital Signal Processing algorithms. used in the DAC501 / DAC502 units
 A few white papers on various Digital Signal Processing algorithms used in the DAC501 / DAC502 units Contents: 1) Parametric Equalizer, page 2 2) Room Equalizer, page 5 3) Crosstalk Cancellation (XTC),
BeamformX Reference Manual
 BeamformX Reference Manual Version 3 May 6, 2017 Robert Dougherty OptiNav, Inc. Copyright 2016-7, OptiNav, Inc. Contents Introduction... 4 Requirements... 4 Quick Start Guide... 4 Reference... 5 Operating
All the functions you need in your hand
 All the functions you need in your hand Rely on H30FLEX for installation and troubleshooting. Robust, light-weight and extremely easy to use. Carry out installation, maintenance and troubleshooting tasks
How to Obtain a Good Stereo Sound Stage in Cars
 Page 1 How to Obtain a Good Stereo Sound Stage in Cars Author: Lars-Johan Brännmark, Chief Scientist, Dirac Research First Published: November 2017 Latest Update: November 2017 Designing a sound system
CLASSROOM ACOUSTICS OF MCNEESE STATE UNIVER- SITY
 CLASSROOM ACOUSTICS OF MCNEESE STATE UNIVER- SITY Aash Chaudhary and Zhuang Li McNeese State University, Department of Chemical, Civil, and Mechanical Engineering, Lake Charles, LA, USA email: zli@mcneese.edu
ROOM LOW-FREQUENCY RESPONSE ESTIMATION USING MICROPHONE AVERAGING
 ROOM LOW-FREQUENCY RESPONSE ESTIMATION USING MICROPHONE AVERAGING Julius Newell, Newell Acoustic Engineering, Lisbon, Portugal Philip Newell, Acoustics consultant, Moaña, Spain Keith Holland, ISVR, University
Put your sound where it belongs: Numerical optimization of sound systems. Stefan Feistel, Bruce C. Olson, Ana M. Jaramillo AFMG Technologies GmbH
 Put your sound where it belongs: Stefan Feistel, Bruce C. Olson, Ana M. Jaramillo Technologies GmbH 166th ASA, San Francisco, 2013 Sound System Design Typical Goals: Complete Coverage High Level and Signal/Noise-Ratio
NDT Supply.com 7952 Nieman Road Lenexa, KS USA
 ETher ETherCheck Combined Eddy Current & Bond Testing Flaw Detector The ETherCheck is a combined Eddy Current and Bond Testing Flaw Detector which comes with a rich range of features offered by a best
FAST MOBILITY PARTICLE SIZER SPECTROMETER MODEL 3091
 FAST MOBILITY PARTICLE SIZER SPECTROMETER MODEL 3091 MEASURES SIZE DISTRIBUTION AND NUMBER CONCENTRATION OF RAPIDLY CHANGING SUBMICROMETER AEROSOL PARTICLES IN REAL-TIME UNDERSTANDING, ACCELERATED IDEAL
Comparison of Low Frequency Sound Insulation Field Measurement Methods
 of Low Frequency Sound Insulation Field Measurement Methods Sandy Marshall, Doheon Lee and Densil Cabrera Faculty of Architecture, University of Sydney, NSW 2006, Australia A paper previously presented
The Future of EMC Test Laboratory Capabilities. White Paper
 The Future of EMC Test Laboratory Capabilities White Paper The complexity of modern day electronics is increasing the EMI compliance failure rate. The result is a need for better EMI diagnostic capabilities
Laser Beam Analyser Laser Diagnos c System. If you can measure it, you can control it!
 Laser Beam Analyser Laser Diagnos c System If you can measure it, you can control it! Introduc on to Laser Beam Analysis In industrial -, medical - and laboratory applications using CO 2 and YAG lasers,
Advanced HDTV System Analyzers
 H45 FIRST HANDHELD System Analyzer WITH DIGITAL PROCESSING Advance SERIES Advanced HDTV System Analyzers HDTV testing made simple - One single tool covers every testing need MPEG-4 FULL HD 1080P CABLE
REPORT issued by an Accredited Testing Laboratory
 issued by an Accredited Testing Laboratory Contact person Fredrik Öberg 2017-04-25 7P02435 1 (7) Building Technology +46 10 516 56 06 fredrik.oberg@ri.se Essve Produkter AB Fredrik Sivertsson Box 7091
OpticalProducts. Illuminating Your Network. Testing the World s Networks
 OpticalProducts Illuminating Your Network Testing the World s Networks Fibre Optic Testers Ease of use and cost-effectiveness Trend s Family of Optical Products Has Increased The new products include Optical
Standard Operating Procedure of nanoir2-s
 Standard Operating Procedure of nanoir2-s The Anasys nanoir2 system is the AFM-based nanoscale infrared (IR) spectrometer, which has a patented technique based on photothermal induced resonance (PTIR),
Panaray 802 Series III TECHNICAL DATA SHEET. loudspeaker. Key Features. Product Overview. Technical Specifications
 Panaray 82 Series III Key Features Articulated Array design provides 12 x 1 coverage to deliver wide-range reproduction over a broad dispersion area Eight Bose 4.5" (114 mm) full-range drivers for unsurpassed
PiMPro Portable Analyzer PiMPro Classic 1821
 DATA SHEET Highly accurate portable PIM Analyzer provides two 40 watt carriers (40W x 2), with -125 dbm sensitivity all in a less than 36 pound carry-on size case Instantaneous Measurement Modes for PIM
OBJECTIVE EVALUATION OF A MELODY EXTRACTOR FOR NORTH INDIAN CLASSICAL VOCAL PERFORMANCES
 OBJECTIVE EVALUATION OF A MELODY EXTRACTOR FOR NORTH INDIAN CLASSICAL VOCAL PERFORMANCES Vishweshwara Rao and Preeti Rao Digital Audio Processing Lab, Electrical Engineering Department, IIT-Bombay, Powai,