institution in its native country, but a major export to other nations as well. Academic articles on
|
|
|
- Darlene Henderson
- 6 years ago
- Views:
Transcription
1 Introduction The American movie industry has been much studied, as befits what is not only a cultural institution in its native country, but a major export to other nations as well. Academic articles on film have frequently been critical or historical studies focused on one or a few films (Bordwell & Caroll 2012). At the same time, film studios and distributors, and the consultants they hire, have compiled detailed sales and marketing analyses of movie performance - but these studies remain proprietary and do not appear in the open literature. We submit that there is a clear need for studies of American movies as a whole, looking for trends in both the film industry and popular culture, and including as many movies as possible. Quantitative methods are ideal for such a study, because they make relatively few theoretical assumptions and easily scale up to incorporate many data sources. The key to such studies is to identify measurable quantities of interest (variables) that provide insight into research questions, and to use as large and complete a dataset as possible. The main research question we seek to answer in this paper is: What, if anything, are the relationships between a movie s perceived artistic merit as ranked by critics, a movie s quality as ranked by viewers, a movie s gross box office take, and its release date? The relationship between these four categories is an important one. As much as one may decry the ties between art and commerce, they always exist, and perhaps nowhere more so than in film. Even as the word film itself becomes increasingly obsolete with the rising prominence of digital video, movies remain fantastically expensive, with professional product well beyond the reach of almost any one person to fund. All arts become expensive when skilled professionals need to be paid and when professional grade equipment is purchased, but none more so than the movies. Paint, canvas, sculpting materials, and musical instruments can all cost a great deal of
2 money, and recording studio time operates at hundreds of dollars an hour. But nowhere in music, writing, or the visual arts has a budget of five million dollars ever been considered fantastically cheap, as it is for movies. Even independent features with volunteer casts and crews cost sums into five and six figures. Because movies are so expensive, they frequently require corporate backing to be funded, or at least to be distributed. Because movies are backed by corporations, the amount of money that they make is very important not only to whether more work is given to the primary artists involved (director, screenwriter, actors), but also to the whether more movies of that type are made at all. Furthermore, financial considerations are the primary driver of studio decisions about which movies to release and when to release them - decisions which can become selffulfilling prophecies when, for example, a movie predicted to do poorly at the box office is narrowly released and poorly marketed at a time when theater attendance is low, leading to poor box office performance. Cultural theorists have been particularly interested in the phenomenon of dump months, when studios supposedly release low-quality movies (Burr 2013). 1 These financial considerations have an obvious impact not only on the film industry, but also on the cultural products the industry produces. Cultural critics have often decried the phenomenon that movies derided by film critics and audiences frequently perform very well at the box office (Kuchera 2014), as well as what they see as a divergence between the judgments of perceived experts - professional movie critics - and consumers (Emerson 2014). These perceptions have become the conventional wisdom in cultural discussions of film - but like all conventional wisdom, these ideas need to be tested against the available evidence. 1 As we will discuss in the Future Work section, it might be more useful to discuss movie release periods in terms of weeks rather than months, as other authors have done (e.g. Cartier & Liarte 2012). However, the concept of dump months is prevalent enough in the discourse that we use it to frame our analysis.
3 The genesis of this paper was a Slate article (Kirk & Thompson 2014), reported and discussed in the Onion AV Club (O Neal 2014), claiming that movies released in February were measurably of lower quality than those released in other months. Discussing these articles, and particularly some of the comments in the AV Club article, inspired a collaboration between the two co-authors, a librarian and cultural studies researcher (Berg) and a data scientist (Raddick). The research expanded when the authors realized that the claims could not be tested from the aggregate data presented in the Slate article, so a new dataset would need to be constructed. That dataset, containing financial data and ratings from both viewers and critics from 6,820 films released between 2000 and 2013, is a major outcome from this research. The dataset is described in more detail in the Data and Methods section below. We hope that it will be useful to researchers in many fields for answering a wide variety of research questions. Literature Review While we found no previous research that comprehensively charted the monetary success of a film in terms of its connection to release dates, critical reception, and viewer evaluation with a quantitative data set, elements of this topic have been addressed by researchers in several different fields. Basuroy, Chatterjee, & Ravid (2003) studied the relationships between critics reviews of films and those films box office performance, seeking to investigate whether critical reviews exert influence over audience demand, or merely predict what audience demand will be. Reinstein & Snyder (2005) examined how the timing of movie reviews published by the famous critics Gene Siskel and Roger Ebert correlates with those movies box office performance. Plucker, Kaufman, Temple, & Qian (2009) compare ratings of the same films among critics,
4 online movie fans, and college freshmen. Like us, they use IMDb as their source for viewer data and Metacritic as their source for critic data. The phenomenon of dump months in particular has been a popular topic of study in the academic literature around film. McClintock (2013) chronicles the increasingly crowded summer release schedule that is arguably a logical consequence of studios trying to put most films out during a prime season. She offers no real judgments and was unable to draw any conclusions, since she reported on an upcoming schedule rather its results. However, she does quote Dreamworks chief Jeffrey Katzenberg on the idea that unlimited free time for students over the summer allows sufficient room for all films released then (2). Sochay (1994) offers a valuable predecessor to our research. He also looked into both the release date and critical reception s relation to economic success, and also found a paucity of prior research (2). Unlike our study, Sochay s primary research tools were the length of time a movie played in theaters and rental data (1); nonetheless, his conclusions and synthesis of previous studies also show that Christmas and summer are the prime moviegoing seasons, with the two together accounting for 51% of all ticket sales as of 1989 (8). Additionally, he cites Litman and Kohl (1989), who found a trend that the Christmas season was decreasing in financial importance while summer increased (4). Rottenberg (2003) suggests that the importance of the Christmas season lies in the fact that every day is open for moviegoing (1). He also brings in the Oscar factor, discussing Christmas as a prime release date for Oscar hopefuls (2). The importance of Oscar release strategies to the ebb and flow of both critical reception and box office take is considerable. Bart (2007) agrees, considering even September to be early for releasing an Oscar contender (4).
5 Cartier and Liarte (2012) point to summer as a high income season: Nearly 50% of the biggest box office successes are released during the summer. Sustained demand can be seen between week 20 and week 29 [between mid-may and mid-july] (21). They also studied the effects of concentrating release dates in the summer on box office take for the movie industry as a whole. Their conclusions suggest an ouroboros effect, with movies performing better during summer, but also that so many movies being released at the same time contributes to that superior performance. Similarly, while almost half of all box office successes are released in the summer (21), the amount of films out at once makes it necessary to outspend competitors in advertising to rise above the pack (21,25). Cartier & Liarte also raise the intriguing possibility that a well-reviewed film increases all movie attendance, but that this effect caps at a certain number of simultaneous releases (19). Einav (2010) expands on the issue of oversaturation with a call for releases to be spread out throughout the year. Darling (2014) raises the possibility that year-round major releases are already an emerging trend, although there is insufficient evidence to chart the long-term, or even short-term, success of such a plan as of writing. Burr (2013) argues that the modern release schedule with its ups and downs, was engineered, whether on purpose or not, by the modern movie business as opposed to being a naturally occurring ebb and flow. Nearly all authors agree that the most desirable periods for new theatrical releases are during the summer and the Christmas season. Most discussion of release timing effects in the literature have taken the opposite approach, looking for the periods that studios find least desirable for new releases. These periods have been termed dump months. The name comes from studios dumping movies that they do not expect to make money into an established set of months where they are left to founder with little in the way of
6 promotion; primarily January but also, to a lesser extent, February, August, and September. Though we were unable to find many scholarly articles on the subject, dump months are well known to film writers; Bernstein (2007), Burr (2013), Darling (2014), Dietz (2010), LaMarche (2013), Legel (2013), Meslow (2012), Raymond (2013), Salisbury (2013), and Singer (2013) all corroborate January s long-held position as the premiere dump month. Maslin (1989) catches January-as-dump-month as an emerging phenomenon. There are several theories for why January became a dump month. The most popular, as advanced by Burr, Dietz, Legel, and Meslow, is that January is ceded to Oscar contenders that see wide release in January following a limited release in December for purposes of eligibility. Dietz also lists winter weather as a limiting factor in people s desire to go out to the movies in January, which Burr alludes to without specifically naming the month. Legel (2013) and Salisbury (2013) emphasize the youth audience by citing the return to school in January as an issue. This tradition of January as a dump month goes at least as far back as the 1930s: In fact, there s a long-established studio history of holding a prestige release until the very end of the calendar, with premieres in New York and L.A. in the final weeks of December to qualify for the Oscars, then rolling it out to the rest of the country in the new year. MGM did it with the Greta Garbo classic Queen Christina in 1933, and again with Gone With the Wind in 1939 (Burr n.p.). While January has traditionally been identified as the most important dump month, authors have identified several other months as dump months as well. Darling (2014) and Kirk & Thompson (2014) finger February as a dump month, and LaMarche alludes to it by saying the first months of the year (n.p.) are dump months. Using the concept of The August Movie, Burr, Darling, and Singer all confirm August as a dump month, and Darling includes September as well. Rottenberg (2003) refers to spring as historically something of a dumping ground (4).
7 Darling cites the return to school as the reason August is a dump month as well; however trends over the last eight years show August moving away from dump month status as documented by Darling and The August Movie. Financial and, even more rarely, critical success does occasionally occur in the dump months. Salisbury (2013) and Singer (2013) both point out that the low expectations for a film s performance can lead to interesting and different films getting a chance for theatrical release. August Movies, Bernstein, Burr, and Salisbury all discuss dump month movies that unexpectedly made money. Finally, it is important to remember that the changing nature of the American film industry can quickly render some study methods out of date. Sochay (1994) used rental data as an important measure of a movie s financial success; but today, multiple online streaming and cable on-demand options have rendered it, at best, a vastly incomplete and likely biased picture of a film s consumption. Cartier and Liarte (2012), though only three years old, also suffer from the impact of changing technology. They wrote, To study the launch strategies of films in other distribution channels, we focused on DVD sales, as other distribution channels are negligible (20). This as well is no longer the case. Perhaps future scholars reading this paper will note that our methods are charmingly outdated and inapplicable to understanding the current state of the film industry. Implications for the Future: Seasonal Release Schedules As is demonstrated by both our literature review and our own data, there is a definite seasonal pattern to the financial success of movies, with summer and late fall (November and December) faring the best. Given that fact, it is interesting to look at some of the consequences of, and prognostications for, this trend. In McClintock (2013), DreamWorks CEO Jeffrey
8 Katzenberg opines that these prime seasons can accommodate as many movies as the studios care to release (2), with moviegoing theoretically as plentiful during the week as it is on weekends at these times. If Katzenberg is wrong, then the potential issue McClintock outlines would bolster Einav (2010) s argument that films should be released on a more evenly-spaced schedule year-round. While Einav s argument follows from the mathematical discipline of game theory, we think that he has failed to account for other factors that make such a plan unworkable. While theoretically, an evenly-spaced, year-round release schedule would give all movies room to breathe, this idea ignores the aforementioned noticeable rises and falls in box office take, year after year. If Katzenberg is correct, then summer and Christmas are as elastic than they appear in their viewer capacity. However, Burr (2013) mentions an intriguing bit of history. After [the 1940s], [good movies released in January] not so much. With the breakdown of the studio system in the 1950s, release patterns began to clump more formally around big weekends, warmer weather and national holidays (n.p.). We do not yet have the data to test Burr s conclusions, but the empirical results of Cartier and Liarte (2012) do support his observation that demand during peak seasons is artificially created by movie studios. It is also possible that changes in the film industry are causing monthly release schedules to change. If, as Burr points out, a schedule in which such an established trait as the January dump month has not always existed, then the current trend likely has been artificially created and may change again. As discussed above, several authors have noted a change in attitude toward August releases. Darling (2014) quotes several people who think that even more of the year may come into play as prime release time, and says that the upcoming Batman V. Superman release will be a test for this idea:
9 A few shock waves rippled through Hollywood when Warner Bros. announced recently that the heavily anticipated Batman V. Superman: Dawn of Justice will be hitting theaters in March 2016, not in the May sweet spot as originally planned. The move was made to get the jump on the next Captain America sequel from Marvel. The reality now is there really isn t a bad week to open a movie, Dan Fellman, president of domestic distribution at Warner Bros., told Entertainment Weekly. We ll be the first one up [in 2016], which is very important, and we ll have six weeks before Captain America comes in (n.p.). Though the release of such a high-profile potential blockbuster shows that studios are taking the idea of a larger spectrum of release dates seriously, it is impossible to know right now how this new strategy will pan out, or even if enough movies will be released at unusual times for it to take hold as a full strategy at all. While the summer season may be expanding, Oscar/prestige film season shows no signs of moving. In a statement echoed by other film writers, as listed in the literature review, Levy (2002) explains the clustering of prestige films in late fall:...their [sic] are eight months between May and January, and members [of the Academy] tend to forget good movies. It s conventional wisdom in Hollywood that movies that open early in the year get overlooked at Oscar time (311). Rottenberg (2003) agrees that Christmas is the traditional climax of Hollywood's year-end prestige season (2), but also notes the industry s continuous financial success, giving the example of The Exorcist, a Christmas release that was neither a Christmas movie nor an Oscar hopeful (1). Hypotheses and Methodology Both our intuition and our literature review led us to develop expectations about what we would find. These expectations can be formalized into hypotheses, or specific predictions to be
10 tested using empirical data. Clearly stating research hypotheses is a critically important step in quantitative research; otherwise, it is all too easy to for the researcher to see only what s/he wants to see (a situation known as confirmation bias ), leading to conclusions that have the appearance of scientific support but are merely self-delusions. 2 Once hypotheses are clearly stated, they usually suggest what data collection methods and statistical tools are needed to test them. Stated in conceptual terms, our hypotheses were as follows: 1. We would find no relationship between viewers and critics ratings of the same movies. 2. We would find no relationship between either type of rating and the financial success of a movie. 3. We would find that movies released during the peak periods of summer and year-end perform better financially than those released during so-called dump months. 4. We would find that movies released during peak periods would be rated more highly by both viewers and critics than those released during dump months. These hypotheses suggest certain methods for testing. The first two questions look for relationships between variables, suggesting correlation and regression analysis. The last two questions look for differences in average values among different groups, suggesting a statistical hypothesis test such as a t-test. These methods are explained in introductory statistics courses and textbooks. A recommendation for practical advice for working researchers - now out of print but available in many university libraries - is Reasoning with Statistics by Frederick Williams and Peter R. Monge (Williams & Monge 2000). Most quantitative social science researchers are 2 Not all quantitative research papers have a separate Hypotheses section or use the term hypothesis, but clearly stating what predictions are to be tested is a critical component of good quantitative research.
11 happy to work with researchers in other departments to build collaborations, so they can provide an important resource as well. Having identified appropriate methods, the final piece required to test our hypotheses is to choose an operational definition for dump month - an unambiguous, measurable statement of what that term means in the context the current study. We experimented with several operational definitions, and chose to use the period most commonly quoted in the literature: January, February, August, and September. We also defined the related to concept of peak month - the months in which it is most profitable to release new titles - as May, June, July, November, and December. With these pieces in place, we are ready to state specific, testable hypotheses: 1. We would find no meaningful correlation between viewers and critics ratings of the same movies We would find no meaningful correlation between either of the following and gross box office receipts: a. Viewer rating b. Critic rating 3. We would find that the average box office receipts of films released in peak months are significantly 4 higher than those released in dump months. 4. We would find that the average values of each of these two ratings are significantly higher in peak months than in dump months: a. Viewer rating 3 To more clearly specify what we mean by meaningful correlation in the first two questions: we would find that the Pearson correlation between these variables would be less than 0.5 (r < 0.5). 4 Significant has a specific techncial meaning in statistics, explained in the Results section below. We mean significantly in this technical sense.
12 b. Critic rating With our research questions now translated into clear statistical hypotheses, we are ready to describe our dataset, which we hope will be as useful to others as it has been to us. Data and Methods Our research questions focus on the interaction between four variables: release date, gross box office receipts, critical opinion, and public opinion. It was therefore important to find sources of quantitative data to measure each of these constructs. Gross box office receipts and release dates are easily quantified and unambiguous, so assembling a dataset is simply a matter of finding sources. Opinions of film quality are more subjective; but fortunately, film critics and audiences have a long tradition of expressing their opinions in easily-quantifiable forms, such as a scale of 1 to 5 stars, or a thumbs-up / thumbs-down classification. The fact that these ratings systems are a well-established part of the discourse around Hollywood movies makes film particularly amenable to quantitative study as a cultural product. It is important to construct a dataset that is as large and complete as possible in our study period - that is, containing as close as possible to 100% of the movies released to U.S. theaters in that period. Our dataset is only as complete as the underlying data sources it comprises, but spotchecking our dataset with release information from the Movie Insider website (unrelated to the sites from which we collected our data) shows that, at least for major studio releases, our data do appear complete throughout our study period. We used three online sources to construct our dataset. Box office receipts and release dates come from Box Office Mojo, 5 a website owned by the Internet Movie Database (IMDb) 5
13 focused on financial data and news about the movie industry. We obtained data by copying rows from their Movies A-Z section. Viewer ratings come from the Internet Movie Database (IMDb), 6 the largest movie website on the Internet, with more than 200 million unique web visitors per month. The site includes user ratings for each movie in its massive database (n=304,984), rated on a 1-10 scale. Only registered users may vote, and each user may only vote once ( IMDB Votes ) 7, so by analyzing vote distributions, we can draw conclusions about individual users opinions, by the thousands or even millions. Our final dataset includes more than 268 million votes, an average of 39,400 per movie. The site calculates a summary rating from these individual votes using proprietary methods. We downloaded the site s complete movie ratings data from a textfile available on the site. 8 IMDb also provides distributions of individual user votes for each movie, but we save that data source for future analysis. Critic ratings come from from Metacritic ( a popular aggregator site for movie ratings. We considered Rotten Tomatoes, another popular aggregator and the data source for the original Slate article (Kirk and Thompson 2014), but chose Metacritic because it provides more finely detailed ratings. Metacritic assigns a percentage rating to individual critical reviews (e.g. a two-star review might count as 40%), then calculates a Metascore - a weighted average of critic scores calculated using proprietary methods. 9 As with Box Office Mojo, we obtained our data by copying rows from the site s Browse A-Z list and pasting them into Microsoft Excel The site s ratings methodology is explained at 8 This file is available for download from several sources at 9 The Metacritic ratings are described in the site s Frequently Asked Questions at
14 Our desire to study a dataset as complete as possible was the primary determinant of our study period. Both the Metacritic and Box Office Mojo datasets become much less complete for films released before 2000; balancing these completeness-related factors with our desire to use as many titles as possible led us to consider movies released between 2000 and 2014, inclusive. In addition, we removed from the dataset all re-releases, focusing only on first theatrical runs. Because our research questions deal with the relationships among movie financial data, public opinion, and critical opinion, it is important to look at titles that have at least some data available in all three sources. However, this task was made more complicated by the fact that movies could have different titles and/or release years in different datasets. This was a particular problem for foreign films, since Box Office Mojo used U.S. titles and release dates, while IMDb used international ones; for example, the 2006 martial arts film starring Jet Li that is listed in Metacritic as Fearless and in Box Office Mojo as Jet Li s Fearless was listed in IMDb under its original Chinese title, Huo Yianjia. Our task was therefore to cross-match films, making sure that we matched up the same film in all datasets. This required some Internet research, and was the most time-consuming part of this project. Cross-matching required creating a unique identifier for every film in our dataset; after much experimentation, we used an alphanumeric key consisting of the first 7 letters of the film s title, the two-digit year, and the last 4 letters. Cross-matching was done using SPSS s MATCH FILES command 10, and keys where updated in Microsoft Excel 11. We iterated our cross-match three times, after which we were confident that either all titles were cross-matched, or else we understood why the cross-match was unsuccessful. 10 Using SPSS v22 for Mac 11 Excel 2008 for Mac
15 After finishing the cross-match, we were left with a dataset containing release dates, IMDb user ratings, and Metacritic critic ratings for 6,820 movies; of these, 6,673 movies also had gross box office receipts. A last step was to create a new variable containing box office receipts corrected for inflation, calculated by multiplying each film s receipts by a month- and year-dependent factor from the Consumer Price Index (CPI) 12 of the U.S. Bureau of Labor Statistics. All analyses were done using IBM SPSS statistical software, version 22 for Mac. SPSS is a powerful statistical analysis program used by many social scientists that is relatively easy to learn. Another key advantage of SPSS is that all commands come with a Paste button that automatically preserves a reproducible history of commands in a text file. The main disadvantage is cost, but academic licenses are available, 13 and many campuses have existing site licenses. Equally-powerful free alternatives are available, such as R and Python, albeit with much steeper learning curves. Another alternative is that all analyses described here can be done, in a more roundabout way, using Microsoft Excel, which comes standard on many computers. Our complete dataset is available by contacting the primary author (Berg). RESULTS Financial data: release times and box office receipts Table 1 shows the number of movies in our dataset by year of release. Most new films are released into theaters on Fridays (n = 5,970; 88%), with the only other day with an appreciable number of releases being Wednesday (n=725; 11%)
16 TABLE 1: Number of films released per year in our dataset Year Movies Table 2 shows the number of movies released by month over our entire study period. The number of theatrical releases per month is roughly the same throughout the year, as is required to keep a fresh supply of movies available in theaters year-round. Slightly fewer movies are released in January, and slightly more are released in the fall. TABLE 2: Number of films released per month Month Movies Percent of all releases January
17 February March April May June July August September October November December Total The Box Office Mojo dataset is missing some values for gross box office receipts; the number of films with receipts listed is 6,673, which is 98% of all movies in the dataset. A quick review of the few titles that are missing shows, as expected, they are all small releases whose data would be highly unlikely to change any of our conclusions. After correcting for inflation to express all values in December 2014 dollars, the movies in our dataset combined for gross box office receipts of more than $160 billion, underscoring once again the enormous importance of the American film industry. What companies are producing these films? Table 3 shows the top twelve studios represented in our dataset, in terms of total adjusted gross for all movies released. TABLE 3: Number of films released per studio in our entire dataset Studio Movies Top-grossing title Total adjusted gross (billion Dec 2014 $)
18 Warner Brothers 296 The Dark Knight $23.3 Buena Vista 226 The Avengers $ th Century Fox 236 Avatar $18.7 Universal 231 Despicable Me 2 $17.4 Sony 200 Spider-Man $15.2 Paramount 167 Iron Man $13.3 New Line 88 The Lord of the Rings: The Return of the King $5.3 Paramount / DreamWorks Lionsgate Entertainment 39 Transformers: Revenge of the Fallen 122 The Hunger Games: Catching Fire $5.1 $4.3 DreamWorks 46 Shrek 2 $4.1 Miramax 142 Chicago $3.0 Screen Gems 65 The Vow $2.6 These twelve studios together are responsible for more than 83% of all gross box office receipts during our study period. The limitations of our dataset preclude making comparisons between studios; for example, Screen Gems is a division of Sony Pictures, but they are listed as separate rows in Table 3. However, Table 3 does lend support to the common observation that only a few studios contribute most of the industry s financial returns. This observation shows that, like many economic and social phenomena, film box office receipts are extremely top-heavy, with a few titles responsible for most receipts, and a large number of titles generating much smaller receipts. This fact means that the analysis of movie receipts data is clearer if receipts are sorted into bins of unequal size. Table 4 shows the number of movies in each of four bins (again, figures are in inflation-adjusted December 2014 dollars): 1. Box office receipts less than $100,000
19 2. Greater than (or equal to) $100,000 but less than $10 million 3. Greater than (or equal to) $10 million but less than $100 million 4. $100 million or more TABLE 4: Number of films in our dataset whose gross box office receipts reach four different levels (bins) Bin Movies Percent of all movies Less than $100,000 2, $100,000 to $10 million 2, $ million 1, More than $100 million Total 6, Missing Another way to show such top-heavy data is to plot a histogram of the logarithm (base 10) of both observed values and frequency counts. Figure 1 shows this plot for box office receipts in our dataset. A histogram is a graph showing a range of data values along the bottom (the x-axis). The range is divided into smaller groupings called bins ; above each bin is a bar whose height shows how many times the values in that bin occur in the dataset. In most histograms, all the bins have equal widths, but this histogram is somewhat different. Each tick mark on both the horizontal and vertical axes shows values a factor of ten larger than the previous tick. Thus, each bin along the along the x-axis actually contains ten times the range of data values of the previous bin, and each bar that reaches an additional tick mark on the y-axis contains ten times as many films as the lower bar.
20 The bar to the far left shows the one film with receipts less than $100: Storage 24, a 2013 British sci-fi horror film that brought in $73 in the US. The bar on the far right is Avatar, which brought in more than $800 million (inflation-adjusted). Keeping in mind the caveat that logarithmic scales introduce distortions in plots, we note the fascinating bimodal (double-peaked) distribution of receipts, with one peak of around $200,000 and another of around $30,000,000. We suspect this is due to the distribution gap between wide release and limited release movies, with the $200,000 peak representing the average for a film that only screened in a few places and the $30,000,000 peak representing the average for wide release movies, but more careful research is needed to draw conclusions. [INSERT FIGURE 1] Critical judgment data: user and critic ratings Financial returns are the data most important to studio decisions, but are only one part of the story of how our culture understands the film industry. The other important consideration is the perceived artistic merit of the films. We do not make any artistic judgments ourselves; rather, we consider the opinions of two groups: viewers - specifically, registered users of the Internet Movie Database (IMDb) - and professional film critics. Data sources for each are explained in the Data and Methods section. As described in the Data section, IMDb provides user ratings only for those movies that have received more than five user votes - but many movies have received many more votes, all the way up to The Dark Knight, which has more than one million votes. Our dataset of user ratings contains 268,713,871 individual votes. As described in the Data and Methods section, we
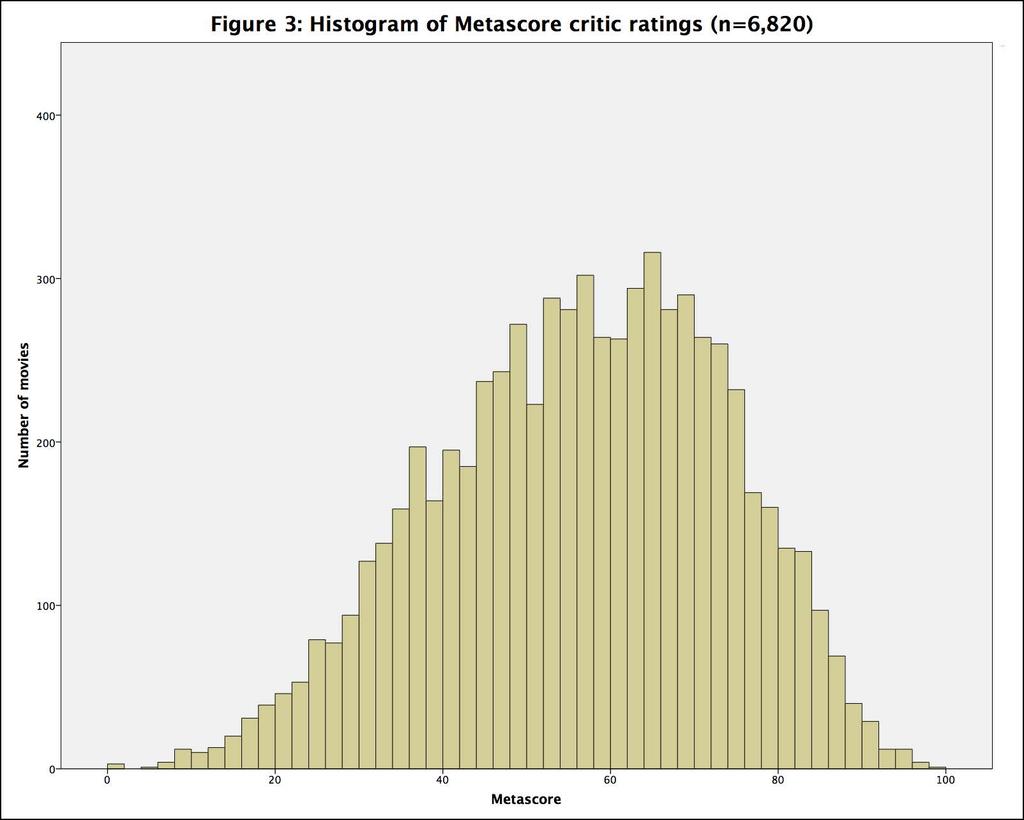
21 know that within an individual title, each user can vote only once; but of course users may vote on more than one movie, so we have no way of knowing how many people contributed these 268,713,871 votes. But it is safe to say that our dataset of user ratings is one of the largest ever used in a study of this type. Figure 2 shows the histogram of user scores. User scores from 1 to 10 are shown along the bottom of the graph (on the x-axis). The number of movies with that score are shown along the left side (on the y-axis). The leftmost bar shows the three movies with the minimum user score of 1.6. The rightmost bar shows the two movies with the maximum user score of In spite of the uneven distribution of the number of votes per title (from five to more than one million votes contributing to the ratings), the user ratings show the expected pattern of a bell curve, more precisely described as a normal distribution. The mean of the distribution - in other words, the average user rating for a movie on IMDb - is 6.49 out of 10. The standard deviation of the distribution of user ratings - a common measure of how much the distribution clusters around the mean value - is The definition of standard deviation means that about two-thirds of ratings lie within one standard deviation of the mean; that is, between 5.49 and [INSERT FIGURE 2] What about the ratings given by professional film critics? Figure 3 shows the distribution of metascores from the Metacritic website for films in our dataset (n=6,820). The histogram is shown in the same way as in Figure 2, but note that the x-axis (Metascore) now runs from 1 to 14 The three movies to score 1.6 are: Justin Bieber s Never Say Never, Justin Bieber s Believe, and Kirk Cameron s Saving Christmas. The two to score 9.0 are Stray Dogs and The Dark Knight.
22 100 instead of 1 to 10. Three films have Metascores of 1 and two have Metascores of The mean Metascore is 56, and the distribution has a standard deviation of 17, meaning that about two-thirds of films have Metascores between 39 and 73. [INSERT FIGURE 3] Comparing the distributions of ratings given by viewers and critics (Figures 3 and 4) reveals some fascinating trends. The mean film rating given by critics (56/100) is lower than the mean rating given by viewers (6.49/10). 16 Furthermore, the spread of ratings assigned by critics (standard deviation of 17/100) is wider than the spread of ratings assigned by viewers (1.00/10). These observations mean that, on average, critics assign lower scores than viewers, and that they are more likely to give scores that are higher or lower than their average for all movies. There could be a number of possible explanations for these observations. Perhaps critics have higher artistic standards for film, and are better able to distinguish small differences in quality. Perhaps critics have learned, consciously or unconsciously, that controversy sells copy, and are therefore more likely to assign scores closer to the extremes. Perhaps the process of becoming a professional film critic selects for people with more extreme opinions. Perhaps the effect is due to some inherent difference in the way in which IMDb and/or Metacritic calculates summary scores, since the specific methods the sites use are not publicly available. Quantitative methods are not ideal for answering such questions of underlying causation, and certainly our study cannot distinguish between these possibilities. We encourage other researchers to continue 15 Metascore 1: InAPPropriate Comedy, 10 Rules for Sleeping Around, Not Cool; Metascore 100: Best Kept Secret, Boyhood. 16 This observation is supported by statistical tests; the concepts behind such tests will be explained in the next section. Specifically, we tested for differences in mean and standard deviation between Metascore and userscore rescaled by multiplying by 10, using a t-test and Levene s test respectively. Both tests were statistically significant at the p <.001 level.
23 studying possible reasons for the observed differences in the means and standard deviations of viewers and critics. How do critical and public opinions of movies correlate? Having assembled our dataset and understood its basic statistical properties, we now consider our research questions and hypotheses. Our first research question compares critical and viewer opinions to one another; our second compares both types of opinions to box office receipts. The ideal methods for answering such questions - those that ask how data values change in relation to one another - are the methods of correlation and regression. A first step in any such study is to graph the variables of interest against one another to look for trends. Figure 4 shows such a graph a scatterplot with IMDb user scores along the bottom (x-axis) and Metascores along the left side (y-axis). Each point on the graph represents a single movie, showing both types of scores. For orientation, points in the top right corner represent movies that scored highly with both web users and critics; films in the middle left scored moderately well with critics and poorly with users. The graph shows, at a glance, the relationship between user and critic scores for our entire big dataset at once. [INSERT FIGURE 4] The clearest trend in Figure 4 is the broad cloud of points in the middle, trending roughly diagonally from lower left to upper right. That cloud shows that, while the relationship is by no means perfect, ratings by users and critics do tend to go together.
24 We hypothesized that user and critic scores would not agree, based on the financial success of such critically-reviled movies as Michael Bay s Transformers series. However, Figure 4 shows that this is clearly not the case. Can we say anything more quantitative about the relationship between user and critic scores? Yes, using the methods of correlation analysis, which are essentially a formalized way of measuring the strength of the linear trend shown graphically in Figure 4. The correlation is a number ranging from -1 to 1 giving the relationship between two variables. A correlation of 1 indicates that the two variables go together perfectly when one increases in value, the other always increases at a predictable rate. A correlation of -1 means that the two variables go together in a perfectly opposite way when one increases, the other decreases at a predictable rate. A correlation of 0 means that the values are completely unrelated. There are no hard-andfast rules for interpreting correlation values, but a common guideline is that a correlation greater than 0.5 (or less than -0.5) is considered a strong correlation (Cohen 1988). 17 The correlation between Metacritic critic scores and IMDb user scores in our dataset (n=6,820 movies) is.684. That value is by no means a perfect correlation, but it is large enough that we can make a clear case that critics and the public tend to give the same movies similar scores. This fact is all the more intriguing given that the results of our next research question showed variables that do not correlate: neither the user score nor the critic score correlates to any appreciable degree with gross box office receipts, whether considered as raw amounts or adjusted for inflation. Table 5 shows the correlation matrix (the correlation between every 17 These guidelines apply to the simplest mathematical form of correlation, the Pearson product-moment correlation coefficient, which is the one we use in this paper.
25 variable and every other variable) for user score, critic score, and both types of box office receipts. TABLE 5: Correlations among user score, Metascore, and gross box office receipts for films in our dataset Gross box office receipts Variable IMDb user score Metascore Raw Inflation-adjusted IMDb user score Metascore Thus, while the statistical evidence in our dataset proved our first hypothesis incorrect, our second hypothesis was supported. 18 Despite the fact that viewers tend to agree with critics, poor critical reception is not associated with poor box office performance. Since viewers agree with critics a far greater amount of the time than they fail to see a movie at all because of what the critics say (since to rate a film, viewers must have seen it first), we can infer that there is virtually no relationship between what the critics think of a movie and whether or not it makes money at the box office, although we cannot draw conclusions about why. Cartier and Liarte say that, just by being out, a highly rated movie gets people to go to the movies more (19). However, rather than contradict our findings, this underscores the idea that there is no connection between critical appraisal and the decision to watch a particular movie. Despite Cartier & Liarte s observation that the viewing public shows some interest in seeing 18 We consciously choose the asymmetric language of proved incorrect vs. supported to indicate a desire to proceed cautiously hypotheses should be easier to falsify than to prove. This falsification-based approach is practiced by most quantitative researchers, although details differ. Entire journals are devoted to these questions, both in statistics and in philosophy of science.
26 critically acclaimed movies, the fact that that interest boosts attendance for all films still demonstrates the lack of importance given to the critical appraisal of any one movie. The significance of release times to box office take, on average - aka Dump Months We next look at how the timing of a film s release is associated with both its box office performance and its artistic merit as measured by users and critics ratings. Table 6 shows the data we use in our analysis throughout this section, giving the number of movies included and the means of each variable. TABLE 6: Films in our dataset by month of U.S. theatrical release Month of release Titles included Gross box office (millions of Dec-2014 dollars) IMDb user score Metascore January 348 $ February 462 $ March 606 $ April 627 $ May 548 $ June 528 $ July 513 $ August 623 $ September 690 $ October 674 $ November 543 $ December 511 $
27 Overall 6,673 $ Figure 5, which plots the mean box office receipts for films released in each month (error bars are 95% confidence limits of the mean), clearly shows the different levels of audience demand in different months. Error bars show 95% confidence intervals for the mean gross box office receipts for all films in our dataset that were released during a given month. Note that not only are mean receipts lower in some months than others, but the difference is so big that the error bars do not overlap. The clear difference in receipts shown in Figure 5 certainly provides strong evidence for the idea that different months have very different levels of audience demand. [INSERT FIGURE 5] Does the difference in box office receipts translate into to a difference in perceived artistic quality? There is indeed a relationship between release month and ratings, but not in a straightforward way. The pattern of monthly variation of scores is very similar in the user and critic scores, but both are different from pattern of box office receipts. Neither of these observations is surprising given our observation, described in the previous section, of a fairly high correlation between user and critic scores, and of the lack of correlation between either type score and gross box office receipts. [INSERT FIGURES 6A AND 6B]
28 Finding these differences among movies by month of release are important, but our research questions are somewhat more specific. We investigate the phenomenon of dump months. As noted in the introduction, studios face the challenge of releasing their stable of films such that some movies are available to play at U.S. theaters throughout the year, even though they know that underlying audience demand varies widely over the course of the year (Cartier & Liarte 17). Conventional wisdom in cultural studies says that they solve this problem by dumping certain movies - releasing those expected to do poorly at the box office - during months that are less profitable for the introduction of new titles. The so-called dump months have been identified as different months by different authors. January is the most notorious of all of them, as evidenced by the amount of articles in the literature that stress January as the dump month (e.g. Dietz 2010). 19 The Slate article that inspired this research identified February as a key dump month (Kirk & Thompson 2014), and other authors have identified April (e.g. Rottenberg 2003) and September (e.g. Darling 2014). Authors have disagreed about whether March, August, and/or October should be included as well. 20 Regardless, conventional wisdom and scholarship readily agree about which months are NOT dump months: the summer (May/June/July) and the end of the year (November/December). We experimented with a few definitions of dump months and found the clearest signal came from the latter definition: operationalizing dump months as the seven months not in the summer or year-end seasons: January through April and August through October. With that definition in hand, we are ready to perform statistical tests on our hypotheses related to the timing of film releases. Our hypotheses, restated from the hypothesis section are: 19 In January, a large concern is the attention placed on Oscar hopefuls from December entering wide release; see the literature review for corroborating sources. 20 Though August is beginning to claim ground as a legitimate release month, as per Darling and The August Movie.
29 3. The mean adjusted gross box office receipts will be lower during dump months (January through April and August through October) than during peak months (May through July and November through December). 4a. The mean IMDb user score will be lower during dump months than during peak months 4b. The mean critic score on Metacritic will be lower during dump months than during peak months Hypothesis (3) means that films released during dump months bring in less money (at least in terms of gross receipts) than films released during peak months - although our tests cannot make any claims about why this would be the case (e.g. due to decreased audience demand, lower-quality films, reduced studio marketing, or any other factors). Hypothesis (4a) means that films released during dump months are perceived to be of lower quality by IMDb users; again, our tests cannot give any evidence about why this should be the case. Hypothesis (4b) means that the films released during dump months are perceived to be of lower quality by critics (again with the same interpretive caveats). The way to test these hypotheses is to compare the means of each variable in each of the two groups (dump month or peak month), then use statistical procedures explained below to evaluate the significance of those differences. Table 7 shows the observed means of each variable in both groups, as well as their observed standard deviations. TABLE 7: Data for movies released during either dump months and peak months. Group Number of movies included Box office receipts (millions of 2014 dollars) IMDb user score Metascore Peak month 2,643 $ Standard deviation in group: $
30 Dump month 4,030 $ Standard deviation in group: $ All months combined Standard deviation in group: 6,673 $ $ p-value <.001 <.001 <.001 Given the observed differences in means between the two groups for each of the three variables, what conclusions can we draw? Statistical hypothesis testing allows us to draw tentative conclusions about the likelihood that the results we observe are due to chance. The concept behind the approach is as follows: if we assume for a moment that the underlying mean receipts and scores between the two groups are actually the same (this is referred to as the null hypothesis ), then what is the probability that we would have observed a difference at least as large as the one we actually observed? Importantly, note that this is NOT the same as the probability that the assumption of underlying equal means is true; rather, it means that either we have witnessed an unlikely event under that assumption, OR that our assumed null hypothesis was incorrect and the underlying means actually are different. Traditionally, researchers identify a threshold probability at which they will assume that the observed differences are just too unlikely to be due to chance, and they will choose the second possibility - that the assumed null hypothesis of equal means was incorrect. This is referred to as rejecting the null hypothesis. When researchers reject the null hypothesis, they often state the probability under the null hypothesis of observing at least the differences they observed; this probability is known as a p-value. Running a two-tailed t-test on our observed
31 data in SPSS allows us to reject the null hypothesis of equal group means at the p <.001 level for all three variables we tested. We therefore consider all our hypotheses to be supported. Statistical significance testing is a fundamental consideration in quantitative research, but it does not provide the entire story. First, statistical significance will always improve with additional data (quantitatively, the p-value will always decrease as sample size increases); with 6,820 movies in our dataset, our impressive-looking p-values could simply be an artifact of large sample size. Second, statistically significant is not at all the same as scientifically significant or important or interesting. Those ideas are less easily quantified, must be evaluated using multiple lines of evidence. But our results are certainly strong enough to clearly indicate that dump months are a real phenomenon, and that the month of a film s release is associated with real differences in its financial performance and artistic quality. What can we say about the American film industry from these results? Although the literature on dump months tends to emphasize January, our research shows that January, or at least its financial fortunes, is not exceptional. Instead, there is a pattern of dump periods alternating with more successful movie release periods. Not only do films released during dump periods tend to bring in less money at the box office, they also tend to be rated lower by both critics and users. The Slate article that inspired this paper claimed that, statistically, February was the worst month critically; our research gives that dubious honor to January instead. February is not the worst commercial month either; there is no clear evidence that the mean domestic box office gross receipts in February are unusually low. In fact, Table 6 shows that the mean domestic box office in February ($21 million) is higher than in January ($17M), April ($15M), September ($12M), or October ($15M).
32 While Table 6 shows that all of the dump months take a critical drubbing, January comes out the worst in all of our assessments. Although we cannot perform a direct comparison between our results and Slate s, 21 we do have multiple results that do not agree with Slate s. IMDb user ratings by release month (Figure 6a) show some interesting variability. The mean user ratings are highest in December (6.8) and lowest in January (6.2). Metacritic critic ratings by month (Figure 6b) show similar patterns to IMDb user ratings by month. Again, the highest month is December (mean 59/100) and the lowest is January (mean 51/100). This observation is again not surprising, since we know there is a strong correlation between user scores and critic scores (see above), and it provides us with both critical and viewer assessments of January as home to worse movies than February. If we are correct, then January has matching abysmal critical and commercial performances, while by both measures films improve somewhat in February. There is also an increase in both box office take and critical assessment in September and October. This positive correlation for films in September and October is especially interesting because, as we have previously noted, there is an overall lack of correlation between critical assessment and commercial success. Though we cannot say for certain why critical assessment and box office take both increase in those months, there are several possibilities to consider. One is that the movies dumped in those months are of such poor quality that they do not appeal to the general public, whether or not the critics like them. This would serve as evidence that studio executives can indeed spot a movie unlikely to make money, as Burr says (n.p.). However, it is important to note that because those movies are pre-emptively deemed failures, they receive minimal advertising and promotion, possibly resulting in a self-fulfilling prophecy. Cartier & 21 We are unable to perform this comparison because of the previously discussed difference in granularity between Metacritic, which we used, and Rotten Tomatoes, which they used.
33 Liarte note the importance of advertising: [advertising] budgets [sic], therefore, even more than the number of films, is the variable used by the studios to capture demand (21), but these are the films no studios believe in or care about--the stuff that doesn't get screened for critics, the stuff that barely gets promoted beyond blurbs from obscure websites and suspicious raves from local TV chefs and weathermen (Bernstein n.p.). The water is further muddied by August, which does not feature this joint increase. It is possible that the ascendant trend of viewing August as a legitimate release period starting in 2007 as described in our Literature Review has skewed the box office take during the back half of our sample period; that is to say that the data does not behave as it does in other dump months because August not a dump month over half of our study period. Other changes in monthly performance over our study period are possible; we will explore this question more in the future. Given the nature of dump month films, it is worthwhile to ask why they are released in theaters at all. Meslow explains that some films have a contractural obligation for theatrical release (n.p.). However, the stronger motivation seems to be the unexpected financial success of some dump month movies, January movies in particular. You Got Served, Hostel (Bernstein n.p.), Paul Blart: Mall Cop, Taken (Burr n.p.), and Chronicle (Goss and Cargil qtd. in Salisbury n.p.) are all relatively recent movies dumped in January that unexpectedly made a lot of money. Results/Interpretation/Conclusions Our research has provided quantitative data on a number of trends regarding movies and their theatrical release dates, financial performance, and critical and viewer reception. First, we have identified a correlation between critical opinion and viewer opinion. This was a surprising result, as the continued presence of movies that receive poor critical reception argues in favor a
34 model in which poor reviews do not impact economic success. We had extrapolated from that idea that critics and viewers judged movies differently. However, this turned out not to be the case, which gave tremendous importance to a second relationship we quantified, the lack of correlation between the critical reception and financial success of a movie. As previously stated, we had been anticipating this, but the why of the matter became a mystery when we also found that user ratings do not correlate with box office receipts. Thus, we cannot explain the lack of correlation between critic ratings and box office receipts by reasoning that viewers think differently from movie critics. The data gathered by our study do not permit us to know why this is. However, it does seem clear that, while critical assessment would serve a majority of the moviegoing public well as a barometer for whether or not they will enjoy a film, they either ignore or do not consult it. We have also added quantitative proof to the anecdotal evidence given by film researchers and critics that January is a critical and commercial dead zone, the worst of the dump months. Our data places January s box office take and mean critical rating as the worst of the year. However, we have also charted other months that habitually feature poor performance, both financially and critically. Some of these months were expected, such as September, which (though not as infamous as January) arose in the literature review. However, April is rarely spoken of in such dire terms, and yet we found that year after year, box office receipts dropped precipitously in that month. April is certainly a lull in between winter and summer releases, but the critical ratings are not nearly as bad as they are for January or September. Whyever that may be, April certainly deserves a place of study alongside January, February, and September when considering lulls in the annual release strategies of movie studios. There is some evidence that studios consider this as well: Rottenberg says that American
35 Pie s release was moved from spring to summer when it did unexpectedly well in test screenings (4). Acknowledged possible issues with/limitations of our data Though we have done our best to account for disparities and imbalances, there are some factors affecting financial performance that we did not take into account in our data. One is the matter of how many screens a movie is released on. Arthouse films, which traditionally have a high critical rating but low box office take, are released on significantly fewer screens than mainstream pictures. This is something of a self-fulfilling prophecy, with studios assuming the film will not make much money, so they do not give it a mass release, which helps guarantee that it will not make much money. We have since obtained data on the number of screens on which movies were shown, but we save that analysis for a future paper. For this work, though, focusing on gross receipts without considering screens unavoidably leaves some movies on an unlevel playing field. Another potential issue is the nature of IMDB ratings. IMDb ratings are limited to the people who make the effort to register for the website, which not necessarily an unbiased sample of U.S. moviegoers. There is a perceived wisdom that people who bother to comment on websites are the happiest and most unhappy about things--if so, we are unavoidably missing the in-between viewer opinion. Titles are an issue as well; movies are sometimes retitled for different markets. While we made the best possible effort to collate the disparate names (as described in the Data section), there may be foreign movies released in the U.S. under different titles that slipped through our information gathering net, thereby introducing small unknown biases into our data and analysis.
36 Directions for future research Though we were able to reach a number of interesting conclusions through our research, many intriguing questions came up that we were unable to answer--as is the case in all good quantitative research. The following are some directions for future research drawn from the results of this paper. 1. In line with most traditional discussions of Hollywood release schedules, we have considered releases by month, exploring the phenomenon of dump months. But, as Cartier & Liarte (2012) point out, weeks might be a better unit of analysis for film releases. This might particularly be the case for holiday releases; for example, we may learn more about the impact of release schedules by analyzing Memorial Day releases as their own week rather than grouping them with the rest of May. 2. A sociological look at why the viewing public apparently does not consult critics in deciding what to watch--a question that is all the more worth asking now that we know their opinions tend to converge. Panned movies make money, but viewers end up agreeing with critics. Why is this the case? 3. The increasing prevalence of simultaneous release dates for theater and on-demand will surely alter the way in which box office take is counted, and possibly how the financial success of a movie is evaluated altogether. It will be worth reevaluating our research in light of this model once these changes become more apparent. 4. Burr asserts that there used to be artistically successful 22 January releases during the studio system, up through the 1940s; and that therefore the current release schedule, with 22 Defined here using critical consensus.
37 its dump months, big seasons, and lulls, was manufactured by the studios and is not a natural pattern. It would be interesting to run a variation of this study for the studio system days to see if he is correct; and if so, just how much of a variation there is between patterns then and today. Data for these older films should be available online, although building a complete dataset may prove much more difficult. 5. Darling says that the annual release structure is changing, specifically citing August, but also some other months. Such changes could potentially throw off the pattern of dump months and good months we observed. Tracking whether these changes pan out, and in what fashion, over the next several years could be very interesting. 6. Sochay cites Litman solo and Litman and Kohl as saying that each additional star [rating] had a significant positive impact on rentals (8). These datasets do have issues-- Sochay does not explain Litman and Kohl s methodologies (most pressingly, where do the star ratings come from, and how can they prove they increased rentals?), and the studies date back to 1983 and 1989, with Sochay s assesment of them going back to Also, the rental structure has changed drastically in the intervening years, in ways previously discussed. Nonetheless, the idea that critical assessment plays a greater role in movie selection post-theatrical release is a very intriguing one that is worth looking into.
38 Works Cited The August Movie: A Theory of Awfulness. Vulture. New York Media LLC, 31 July Web. 8 July Bart, Peter. Fall Film Flurry Stirs Arty Anxieties. Variety Sept. 2007: 4, 106. Web. 4 Apr Basuroy, Suman, Subimal Chatterjee, and S. Abraham Ravid. How Critical Are Critical Reviews? The Box Office Effects of Film Critics, Star Power, and Budgets. Journal of Marketing (2003): Web. 10 July Bernstein, Jonathan. Why January Is a Good Month to Bury Bad Movies. The Guardian. 8 January 2007: n.pag. Web. 8 July Bordwell, David, and Noël Carroll, eds. Post-Theory: Reconstructing Film Studies. Madison, Wisconsin: University of Wisconsin Press, Print. Burr, Ty. January Is Hollywood s Very Own Leper Colony. New York Times Magazine. 20 Jan. 2013: n. pag. Web. 8 July Cartier, Manuel and Sebastien Liarte. Impact of Underlying Demand and Agglomeration of Supply on Seasonality: The Case of the Hollywood Film Industry. International Journal of Arts Management (2012): Web. Darling, Cary. August: Now a Hot Month For Blockbusters. dfw.com. n.d., 13 Aug Web. 8 July Dietz, Jason. The Nightmare After Christmas: Are January Movies Really That Bad? Metacritic. 5 Jan. 2010: n. pag. Web. 11 July Einav, Liran. Not All Rivals Look Alike: Estimating an Equilibrium Model of the Release Date Timing Game. Economic Inquiry (2010): Web. Emerson, Jim. Why Don t Critics, Oscars & Audience Agree? Scanners: With Jim Emerson. Roger Ebert.com, 10 Feb Web. 11 July Feinberg, Scott. The Perils of Being an Early Oscar Frontrunner. Hollywood Reporter. 20 Dec. 2013: 46. Web. IMDb Votes/Ratings Top Frequently Asked Questions. Internet Movie Database. IMDb.com, Inc., Web. 8 July Kirk, Chris and Kim Thompson. Confirmed: February Movies Suck. Slate. The Slate Group, 6 Feb Web. 11 July 2015.
39 _statistical_proof_of_it.html Kuchera, Ben. How Does a 'Terrible' Movie Make $300 Million in Three Days? Polygon. Vox Media Inc., 30 June Web. LaMarche, Una. A Cinematic Dumpster Dive. Vegas Seven. n.p., 3 Jan Web. 11 July Legel, Laremie. Why is January a Cinematic Dumping Ground? Film.com. MTV Networks, 9 Jan Web. 11 July Levy, Emanuel. Oscar Fever: The History and Politics of the Academy Awards. New York, London: Continuum, Print. Maslin, Janet. Is January the Cruelist Month? New York Times. 5 Feb. 1989: n. pag. Web. 26 May Masters, Kim. Why Shifting Release Dates Is No Longer So Scary. Hollywood Reporter. 21 June 2013: 48. Web. McClintock, Pamela. Summer's Brutal Animation War. Hollywood Reporter. 21 June 2013: Web. Meslow, Scott. January: Dumping Ground for Terrible Movies Like 'Contraband.' The Atlantic. 13 Jan. 2012: n. pag. Web. 26 May O Neal, Sean. February Statistically Proven to Have the Shittiest Movies. The A.V. Club. Onion Inc., 6 Feb Web. 11 July Plucker, Jonathan, and James C. Kaufman, Jason S. Temple, and Meihua Qian. Do Experts and Novices Evaluate Movies the Same Way? Psychology and Marketing (2009): Web. Raymond, Adam K. The Cruelest Month: Just How Bad of a Movie Month Is January? Vulture. New York Media LLC, 7 Jan Web. 11 July Reinstein, David A. and Christopher M. Snyder. The Influence of Expert Reviews on Consumer Demand for Experience Goods: a Case Study of Movie Critics. The Journal of Industrial Economics (2005): Web. Rottenberg, Josh. The Imperfect Science of Release Dates. New York Times Magazine. 9 Nov. 2003: 64. Web. 15 Apr Salisbury, Brian. Why Oscar Season Is Hollywood s Bad Movie Dumping Ground. Hollywood.com. n.p., 23 Feb Web. 11 July 2013.
40 / Singer, Matt. Why I Love Going to the Movies In January. Criticwire. Indiewire.com, 23 Jan Web. 26 May Sochay, Scott. Predicting the Performance of Motion Pictures. The Journal of Media Economics. 7.4 (1994): Web. Williams, Frederick and Peter R. Monge. Reasoning With Statistics: How To Read Quantitative Research, Second Edition. [city]: Wadsworth Publishing, Print.
41 First You Get the Money, Then You Get the Reviews, Then You Get the Internet Comments: A Quantitative Examination of the Relationship Between Critics, Viewers, and Box Office Success Jeremy Berg (primary contact) University of North Texas 941 Precision Drive Denton, TX jeremy.berg@unt.edu Jordan Raddick Institute for Data-Intensive Engineering and Science Department of Physics and Astronomy Johns Hopkins University 3701 San Martin Dr. Baltimore, MD raddick@jhu.edu

42
43
44
Analysis of Film Revenues: Saturated and Limited Films Megan Gold
 Analysis of Film Revenues: Saturated and Limited Films Megan Gold University of Nevada, Las Vegas. Department of. DOI: http://dx.doi.org/10.15629/6.7.8.7.5_3-1_s-2017-3 Abstract: This paper analyzes film
U.S. Theatrical Market: 2005 Statistics. MPA Worldwide Market Research & Analysis
 U.S. Theatrical Market: 2005 Statistics 1 1 2005 Motion Picture Industry The following document provides context and empirical data with respect to box office in 2005, a topic which provoked much dialogue
STAT 113: Statistics and Society Ellen Gundlach, Purdue University. (Chapters refer to Moore and Notz, Statistics: Concepts and Controversies, 8e)
") STAT 113: Statistics and Society Ellen Gundlach, Purdue University (Chapters refer to Moore and Notz, Statistics: Concepts and Controversies, 8e) Learning Objectives for Exam 1: Unit 1, Part 1: Population
STAT 113: Statistics and Society Ellen Gundlach, Purdue University (Chapters refer to Moore and Notz, Statistics: Concepts and Controversies, 8e) Learning Objectives for Exam 1: Unit 1, Part 1: Population
2006 U.S. Theatrical Market Statistics. Worldwide Market Research & Analysis
 2006 U.S. Theatrical Market Statistics Worldwide Market Research & Analysis 2006 Motion Picture Industry Highlights The following document provides context and empirical data with respect to box office
WEB APPENDIX. Managing Innovation Sequences Over Iterated Offerings: Developing and Testing a Relative Innovation, Comfort, and Stimulation
 WEB APPENDIX Managing Innovation Sequences Over Iterated Offerings: Developing and Testing a Relative Innovation, Comfort, and Stimulation Framework of Consumer Responses Timothy B. Heath Subimal Chatterjee
DISTRIBUTION B F I R E S E A R C H A N D S T A T I S T I C S
 BFI RESEARCH AND STATISTICS PUBLISHED J U LY 2017 The UK theatrical marketplace is dominated by a few very large companies. In 2016, the top 10 distributors generated over 1.2 billion in box office revenues,
Description of Variables
 To Review or Not to Review? Limited Strategic Thinking at the Movie Box Office Alexander L. Brown, Colin F. Camerer and Dan Lovallo Web Appendix A Description of Variables To determine if a movie was cold
Seen on Screens: Viewing Canadian Feature Films on Multiple Platforms 2007 to April 2015
 Seen on Screens: Viewing Canadian Feature Films on Multiple Platforms 2007 to 2013 April 2015 This publication is available upon request in alternative formats. This publication is available in PDF on
Dick Rolfe, Chairman
 Greetings! In the summer of 1990, a group of fathers approached me and asked if I would join them in a search for ways to accumulate enough knowledge so we could talk to our kids about which movies were
Domestic Box Office Admissions per Capita ( ) Admissions per cap Home entertainment advancements Cinematic experience advancements
 Admissions per cap Home entertainment advancements Cinematic experience advancements") Video Killed The Radio Star: But It Hasn t Killed Movie-Going With new innovations and choices in home entertainment over the past years, you might guess that moviegoing is waning. However, despite the
Video Killed The Radio Star: But It Hasn t Killed Movie-Going With new innovations and choices in home entertainment over the past years, you might guess that moviegoing is waning. However, despite the
NETFLIX MOVIE RATING ANALYSIS
 NETFLIX MOVIE RATING ANALYSIS Danny Dean EXECUTIVE SUMMARY Perhaps only a few us have wondered whether or not the number words in a movie s title could be linked to its success. You may question the relevance
Lesson 7: Measuring Variability for Skewed Distributions (Interquartile Range)
") : Measuring Variability for Skewed Distributions (Interquartile Range) Student Outcomes Students explain why a median is a better description of a typical value for a skewed distribution. Students calculate
: Measuring Variability for Skewed Distributions (Interquartile Range) Student Outcomes Students explain why a median is a better description of a typical value for a skewed distribution. Students calculate
Algebra I Module 2 Lessons 1 19
 Eureka Math 2015 2016 Algebra I Module 2 Lessons 1 19 Eureka Math, Published by the non-profit Great Minds. Copyright 2015 Great Minds. No part of this work may be reproduced, distributed, modified, sold,
"To infinity and beyond!" A genre-specific film analysis of movie success mechanisms. Daniel Kaimann
 "To infinity and beyond!" A genre-specific film analysis of movie success mechanisms Daniel Kaimann University of Paderborn Department of Business Administration and Economics Warburger Str. 100, D - 33098
Bootstrap Methods in Regression Questions Have you had a chance to try any of this? Any of the review questions?
 ICPSR Blalock Lectures, 2003 Bootstrap Resampling Robert Stine Lecture 3 Bootstrap Methods in Regression Questions Have you had a chance to try any of this? Any of the review questions? Getting class notes
Keeping the Score. The impact of recapturing North American film and television sound recording work. Executive Summary
 The impact of recapturing North American film and television sound recording work Executive Summary December 2014 [This page is intentionally left blank.] Executive Summary Governments across the U.S.
Devising a Practical Model for Predicting Theatrical Movie Success: Focusing on the Experience Good Property
 JOURNAL OF MEDIA ECONOMICS, 18(4), 247 269 Copyright 2005, Lawrence Erlbaum Associates, Inc. Devising a Practical Model for Predicting Theatrical Movie Success: Focusing on the Experience Good Property
Motion Picture, Video and Television Program Production, Post-Production and Distribution Activities
 The 31 th Voorburg Group Meeting Zagreb Croatia 19-23 September 2016 Mini-Presentation SPPI for ISIC4 Group 591 Motion Picture, Video and Television Program Production, Post-Production and Distribution
BBC Television Services Review
 BBC Television Services Review Quantitative audience research assessing BBC One, BBC Two and BBC Four s delivery of the BBC s Public Purposes Prepared for: November 2010 Prepared by: Trevor Vagg and Sara
arxiv: v1 [cs.dl] 8 Oct 2014
![arxiv: v1 [cs.dl] 8 Oct 2014](/thumbs/80/81228387.jpg "arxiv: v1 [cs.dl] 8 Oct 2014") Rise of the Rest: The Growing Impact of Non-Elite Journals Anurag Acharya, Alex Verstak, Helder Suzuki, Sean Henderson, Mikhail Iakhiaev, Cliff Chiung Yu Lin, Namit Shetty arxiv:141217v1 [cs.dl] 8 Oct
Rise of the Rest: The Growing Impact of Non-Elite Journals Anurag Acharya, Alex Verstak, Helder Suzuki, Sean Henderson, Mikhail Iakhiaev, Cliff Chiung Yu Lin, Namit Shetty arxiv:141217v1 [cs.dl] 8 Oct
Distribution of Data and the Empirical Rule
 302360_File_B.qxd 7/7/03 7:18 AM Page 1 Distribution of Data and the Empirical Rule 1 Distribution of Data and the Empirical Rule Stem-and-Leaf Diagrams Frequency Distributions and Histograms Normal Distributions
Chapter 2 Describing Data: Frequency Tables, Frequency Distributions, and
 Frequency Chapter 2 - Describing Data: Frequency Tables, Frequency Distributions, and Graphic Presentation Chapter 2 Describing Data: Frequency Tables, Frequency Distributions, and 1. Pepsi-Cola has a
Discussing some basic critique on Journal Impact Factors: revision of earlier comments
 Scientometrics (2012) 92:443 455 DOI 107/s11192-012-0677-x Discussing some basic critique on Journal Impact Factors: revision of earlier comments Thed van Leeuwen Received: 1 February 2012 / Published
Looking Ahead: Viewing Canadian Feature Films on Multiple Platforms. July 2013
 Looking Ahead: Viewing Canadian Feature Films on Multiple Platforms July 2013 Looking Ahead: Viewing Canadian Feature Films on Multiple Platforms Her Majesty the Queen in Right of Canada (2013) Catalogue
This is a licensed product of AM Mindpower Solutions and should not be copied
 1 TABLE OF CONTENTS 1. The US Theater Industry Introduction 2. The US Theater Industry Size, 2006-2011 2.1. By Box Office Revenue, 2006-2011 2.2. By Number of Theatres and Screens, 2006-2011 2.3. By Number
Sundance Institute: Artist Demographics in Submissions & Acceptances. Dr. Stacy L. Smith, Marc Choueiti, Hannah Clark & Dr.
 Sundance Institute: Artist Demographics in Submissions & Acceptances Dr. Stacy L. Smith, Marc Choueiti, Hannah Clark & Dr. Katherine Pieper January 2019 SUNDANCE INSTITUTE: ARTIST DEMOGRAPHICS IN SUBMISSIONS
Appendix X: Release Sequencing
 Appendix X: Release Sequencing Theatrical Release Timing Peak audiences (X-mas; Thanksgiving, Summer etc.) Peak attention (uncrowded d period) summer movie season is mainly a US phenomenon Release Timing
Rating the impact and success of films beyond the box office
 FILM IMPACT RATING Rating the impact and success of films beyond the box office The Film Impact Rating is a first step in the reconsideration of how we might understand the effectiveness of Australian
Frequencies. Chapter 2. Descriptive statistics and charts
 An analyst usually does not concentrate on each individual data values but would like to have a whole picture of how the variables distributed. In this chapter, we will introduce some tools to tabulate
Chapter 27. Inferences for Regression. Remembering Regression. An Example: Body Fat and Waist Size. Remembering Regression (cont.)
") Chapter 27 Inferences for Regression Copyright 2007 Pearson Education, Inc. Publishing as Pearson Addison-Wesley Slide 27-1 Copyright 2007 Pearson Education, Inc. Publishing as Pearson Addison-Wesley An
Chapter 27 Inferences for Regression Copyright 2007 Pearson Education, Inc. Publishing as Pearson Addison-Wesley Slide 27-1 Copyright 2007 Pearson Education, Inc. Publishing as Pearson Addison-Wesley An
Centre for Economic Policy Research
 The Australian National University Centre for Economic Policy Research DISCUSSION PAPER The Reliability of Matches in the 2002-2004 Vietnam Household Living Standards Survey Panel Brian McCaig DISCUSSION
hprints , version 1-1 Oct 2008
 Author manuscript, published in "Scientometrics 74, 3 (2008) 439-451" 1 On the ratio of citable versus non-citable items in economics journals Tove Faber Frandsen 1 tff@db.dk Royal School of Library and
1.1 What is CiteScore? Why don t you include articles-in-press in CiteScore? Why don t you include abstracts in CiteScore?
 June 2018 FAQs Contents 1. About CiteScore and its derivative metrics 4 1.1 What is CiteScore? 5 1.2 Why don t you include articles-in-press in CiteScore? 5 1.3 Why don t you include abstracts in CiteScore?
Netflix: Amazing Growth But At A High Price
 Netflix: Amazing Growth But At A High Price Mar. 17, 2018 5:27 AM ET8 comments by: Jonathan Cooper Summary Amazing user growth, projected to accelerate into Q1'18. Contribution profit per subscriber continues
What is Statistics? 13.1 What is Statistics? Statistics
 13.1 What is Statistics? What is Statistics? The collection of all outcomes, responses, measurements, or counts that are of interest. A portion or subset of the population. Statistics Is the science of
Neural Network Predicating Movie Box Office Performance
 Neural Network Predicating Movie Box Office Performance Alex Larson ECE 539 Fall 2013 Abstract The movie industry is a large part of modern day culture. With the rise of websites like Netflix, where people
DOES MOVIE SOUNDTRACK MATTER? THE ROLE OF SOUNDTRACK IN PREDICTING MOVIE REVENUE
 DOES MOVIE SOUNDTRACK MATTER? THE ROLE OF SOUNDTRACK IN PREDICTING MOVIE REVENUE Haifeng Xu, Department of Information Systems, National University of Singapore, Singapore, xu-haif@comp.nus.edu.sg Nadee
Blueline, Linefree, Accuracy Ratio, & Moving Absolute Mean Ratio Charts
 INTRODUCTION This instruction manual describes for users of the Excel Standard Celeration Template(s) the features of each page or worksheet in the template, allowing the user to set up and generate charts
Additional media information United States & United Kingdom
 Additional media information United States & United Kingdom Company information MovieGlu is a cinema search engine that enables fans to quickly and easily find the best combination of movie, cinema and
Patron-Driven Acquisition: What Do We Know about Our Patrons?
 Purdue University Purdue e-pubs Charleston Library Conference Patron-Driven Acquisition: What Do We Know about Our Patrons? Monique A. Teubner Utrecht University, m.teubner@uu.nl Henk G. J. Zonneveld Utrecht
A Correlation Analysis of Normalized Indicators of Citation
 1 2 3 4 5 6 7 8 9 10 11 12 13 14 15 16 17 18 19 20 21 22 23 24 25 26 27 28 29 30 31 32 33 34 35 36 37 38 39 40 41 42 43 44 45 Article A Correlation Analysis of Normalized Indicators of Citation Dmitry
AUSTRALIAN MULTI-SCREEN REPORT QUARTER
 AUSTRALIAN MULTI-SCREEN REPORT QUARTER 02 Australian viewing trends across multiple screens Since its introduction in Q4 2011, The Australian Multi- Screen Report has tracked the impact of digital technologies,
Jazz Bandleader Composer
 Jazz Bandleader Composer The following is the breakdown of 2006-2011 income for a Jazz Bandleader-Composer, who writes, records and performs his own works and leads and participates in multiple ensembles
IMDB Movie Review Analysis
 IMDB Movie Review Analysis IST565-Data Mining Professor Jonathan Fox By Daniel Hanks Jr Executive Summary The movie industry is an extremely competitive industry in a variety of ways. Not only are movie
Community Choirs in Australia
 Introduction The Music in Communities Network s research agenda includes filling some statistical gaps in our understanding of the community music sector. We know that there are an enormous number of community-based
The Interrelation of Box Office Results How does one weekend s movie attendance affect the next?
 Syracuse University SURFACE Syracuse University Honors Program Capstone Projects Syracuse University Honors Program Capstone Projects Spring 5-1-2010 The Interrelation of Box Office Results How does one
THE USE OF THOMSON REUTERS RESEARCH ANALYTIC RESOURCES IN ACADEMIC PERFORMANCE EVALUATION DR. EVANGELIA A.E.C. LIPITAKIS SEPTEMBER 2014
 THE USE OF THOMSON REUTERS RESEARCH ANALYTIC RESOURCES IN ACADEMIC PERFORMANCE EVALUATION DR. EVANGELIA A.E.C. LIPITAKIS SEPTEMBER 2014 Agenda Academic Research Performance Evaluation & Bibliometric Analysis
1. Structure of the paper: 2. Title
 A Special Guide for Authors Periodica Polytechnica Electrical Engineering and Computer Science VINMES Special Issue - Novel trends in electronics technology This special guide for authors has been developed
Research & Development. White Paper WHP 228. Musical Moods: A Mass Participation Experiment for the Affective Classification of Music
 Research & Development White Paper WHP 228 May 2012 Musical Moods: A Mass Participation Experiment for the Affective Classification of Music Sam Davies (BBC) Penelope Allen (BBC) Mark Mann (BBC) Trevor
Why t? TEACHER NOTES MATH NSPIRED. Math Objectives. Vocabulary. About the Lesson
 Math Objectives Students will recognize that when the population standard deviation is unknown, it must be estimated from the sample in order to calculate a standardized test statistic. Students will recognize
PICK THE RIGHT TEAM AND MAKE A BLOCKBUSTER A SOCIAL ANALYSIS THROUGH MOVIE HISTORY
 PICK THE RIGHT TEAM AND MAKE A BLOCKBUSTER A SOCIAL ANALYSIS THROUGH MOVIE HISTORY THE CHALLENGE: TO UNDERSTAND HOW TEAMS CAN WORK BETTER SOCIAL NETWORK + MACHINE LEARNING TO THE RESCUE Previous research:
Show-Stopping Numbers: What Makes or Breaks a Broadway Run. Jack Stucky. Advisor: Scott Ogawa. Northwestern University. MMSS Senior Thesis
 Show-Stopping Numbers: What Makes or Breaks a Broadway Run Jack Stucky Advisor: Scott Ogawa Northwestern University MMSS Senior Thesis June 15, 2018 Acknowledgements I would like to thank my advisor, Professor
It is a pleasure to have been invited here today to speak to you. [Introductory words]
![It is a pleasure to have been invited here today to speak to you. [Introductory words]](/thumbs/91/106632272.jpg "It is a pleasure to have been invited here today to speak to you. [Introductory words]") Audiovisual Industry Seminar WTO, Geneva, Wednesday 4 July 2001 Speech on "The economics of the sector - the UK example" Michael Flint, Deputy Chairman, BSAC [Slide 1] It is a pleasure to have been invited
Audiovisual Industry Seminar WTO, Geneva, Wednesday 4 July 2001 Speech on "The economics of the sector - the UK example" Michael Flint, Deputy Chairman, BSAC [Slide 1] It is a pleasure to have been invited
MUSICAL MOODS: A MASS PARTICIPATION EXPERIMENT FOR AFFECTIVE CLASSIFICATION OF MUSIC
 12th International Society for Music Information Retrieval Conference (ISMIR 2011) MUSICAL MOODS: A MASS PARTICIPATION EXPERIMENT FOR AFFECTIVE CLASSIFICATION OF MUSIC Sam Davies, Penelope Allen, Mark
d. Could you represent the profit for n copies in other different ways?
 Special Topics: U3. L3. Inv 1 Name: Homework: Math XL Unit 3 HW 9/28-10/2 (Due Friday, 10/2, by 11:59 pm) Lesson Target: Write multiple expressions to represent a variable quantity from a real world situation.
The Role of Film Audiences as Innovators and Risk Takers
 The Role of Film Audiences as Innovators and Risk Takers Michael Pokorny, University of Westminster, London, United Kingdom John Sedgwick University of Portsmouth Portsmouth, United Kingdom Abstract: Central
BBC Trust Review of the BBC s Speech Radio Services
 BBC Trust Review of the BBC s Speech Radio Services Research Report February 2015 March 2015 A report by ICM on behalf of the BBC Trust Creston House, 10 Great Pulteney Street, London W1F 9NB enquiries@icmunlimited.com
Using Bibliometric Analyses for Evaluating Leading Journals and Top Researchers in SoTL
 Georgia Southern University Digital Commons@Georgia Southern SoTL Commons Conference SoTL Commons Conference Mar 26th, 2:00 PM - 2:45 PM Using Bibliometric Analyses for Evaluating Leading Journals and
The Blockbuster Era and High Concept
 The Blockbuster Era and High Concept Spielberg s Jaws (1975) Jaws often credited as one of the 1st to use trad. B-movie elements (horror & mild gore) in big-budget film People were genuinely terrified
WHAT MAKES FOR A HIT POP SONG? WHAT MAKES FOR A POP SONG?
 WHAT MAKES FOR A HIT POP SONG? WHAT MAKES FOR A POP SONG? NICHOLAS BORG AND GEORGE HOKKANEN Abstract. The possibility of a hit song prediction algorithm is both academically interesting and industry motivated.
Toronto Alliance for the Performing Arts
 79195 Covers 1/22/08 3:04 PM Page 1 A Presentation to the Toronto Alliance for the Performing Arts Members Survey December 2007 79195 InsidePages 1/22/08 7:21 PM Page 1 Table of Contents Introduction and
BIBLIOMETRIC REPORT. Bibliometric analysis of Mälardalen University. Final Report - updated. April 28 th, 2014
 BIBLIOMETRIC REPORT Bibliometric analysis of Mälardalen University Final Report - updated April 28 th, 2014 Bibliometric analysis of Mälardalen University Report for Mälardalen University Per Nyström PhD,
Visual Encoding Design
 CSE 442 - Data Visualization Visual Encoding Design Jeffrey Heer University of Washington A Design Space of Visual Encodings Mapping Data to Visual Variables Assign data fields (e.g., with N, O, Q types)
Chapter 1 Midterm Review
 Name: Class: Date: Chapter 1 Midterm Review Multiple Choice Identify the choice that best completes the statement or answers the question. 1. A survey typically records many variables of interest to the
Human Hair Studies: II Scale Counts
 Journal of Criminal Law and Criminology Volume 31 Issue 5 January-February Article 11 Winter 1941 Human Hair Studies: II Scale Counts Lucy H. Gamble Paul L. Kirk Follow this and additional works at: https://scholarlycommons.law.northwestern.edu/jclc
Introduction. The report is broken down into four main sections:
 Introduction This survey was carried out as part of OAPEN-UK, a Jisc and AHRC-funded project looking at open access monograph publishing. Over five years, OAPEN-UK is exploring how monographs are currently
Contents. Introduction. Skyworks Solutions (SWKS) Cypress Semiconductor (CY) Sierra Wireless (SWIR) Silicon Labs (SLAB) Rockwell Automation (ROK)
 Cypress Semiconductor (CY) Sierra Wireless (SWIR) Silicon Labs (SLAB) Rockwell Automation (ROK)") Contents Introduction Skyworks Solutions (SWKS) Cypress Semiconductor (CY) Sierra Wireless (SWIR) Silicon Labs (SLAB) Rockwell Automation (ROK) Global X Internet of Things Thematic ETF (SNSR) Bottom Line
Contents Introduction Skyworks Solutions (SWKS) Cypress Semiconductor (CY) Sierra Wireless (SWIR) Silicon Labs (SLAB) Rockwell Automation (ROK) Global X Internet of Things Thematic ETF (SNSR) Bottom Line
Suggested Publication Categories for a Research Publications Database. Introduction
 Suggested Publication Categories for a Research Publications Database Introduction A: Book B: Book Chapter C: Journal Article D: Entry E: Review F: Conference Publication G: Creative Work H: Audio/Video
CS229 Project Report Polyphonic Piano Transcription
 CS229 Project Report Polyphonic Piano Transcription Mohammad Sadegh Ebrahimi Stanford University Jean-Baptiste Boin Stanford University sadegh@stanford.edu jbboin@stanford.edu 1. Introduction In this project
GROWING VOICE COMPETITION SPOTLIGHTS URGENCY OF IP TRANSITION By Patrick Brogan, Vice President of Industry Analysis
 RESEARCH BRIEF NOVEMBER 22, 2013 GROWING VOICE COMPETITION SPOTLIGHTS URGENCY OF IP TRANSITION By Patrick Brogan, Vice President of Industry Analysis An updated USTelecom analysis of residential voice
NEWSLETTER. i xãxüá. Watching Habit Grows 25% while Fasting. Data Highlight. NEWSLETTER p.1. This Edition: Data Highlight.
 NEWSLETTER 14th Edition, October 2007 This Edition: Data Highlight Watching Habit Grows 25% while Fasting Looking at 5-year trend: As TV Population Grows, Total Rating Goes Down, Number of Spot Goes Up
EVALUATING THE IMPACT FACTOR: A CITATION STUDY FOR INFORMATION TECHNOLOGY JOURNALS
 EVALUATING THE IMPACT FACTOR: A CITATION STUDY FOR INFORMATION TECHNOLOGY JOURNALS Ms. Kara J. Gust, Michigan State University, gustk@msu.edu ABSTRACT Throughout the course of scholarly communication,
BBC Red Button: Service Review
 BBC Red Button: Service Review Quantitative audience research assessing the BBC Red Button service s delivery of the BBC s Public Purposes Prepared for: October 2010 Prepared by: Trevor Vagg, Kantar Media
MATH 214 (NOTES) Math 214 Al Nosedal. Department of Mathematics Indiana University of Pennsylvania. MATH 214 (NOTES) p. 1/3
 Math 214 Al Nosedal. Department of Mathematics Indiana University of Pennsylvania. MATH 214 (NOTES) p. 1/3") MATH 214 (NOTES) Math 214 Al Nosedal Department of Mathematics Indiana University of Pennsylvania MATH 214 (NOTES) p. 1/3 CHAPTER 1 DATA AND STATISTICS MATH 214 (NOTES) p. 2/3 Definitions. Statistics is
MATH 214 (NOTES) Math 214 Al Nosedal Department of Mathematics Indiana University of Pennsylvania MATH 214 (NOTES) p. 1/3 CHAPTER 1 DATA AND STATISTICS MATH 214 (NOTES) p. 2/3 Definitions. Statistics is
Math 81 Graphing. Cartesian Coordinate System Plotting Ordered Pairs (x, y) (x is horizontal, y is vertical) center is (0,0) Quadrants:
 (x is horizontal, y is vertical) center is (0,0) Quadrants:") Math 81 Graphing Cartesian Coordinate System Plotting Ordered Pairs (x, y) (x is horizontal, y is vertical) center is (0,0) Ex 1. Plot and indicate which quadrant they re in. A (0,2) B (3, 5) C (-2, -4)
Math 81 Graphing Cartesian Coordinate System Plotting Ordered Pairs (x, y) (x is horizontal, y is vertical) center is (0,0) Ex 1. Plot and indicate which quadrant they re in. A (0,2) B (3, 5) C (-2, -4)
The Most Important Findings of the 2015 Music Industry Report
 The Most Important Findings of the 2015 Music Industry Report Commissioning Organizations and Objectives of the Study The study contained in the present Music Industry Report was commissioned by a group
SALES DATA REPORT
 SALES DATA REPORT 2013-16 EXECUTIVE SUMMARY AND HEADLINES PUBLISHED NOVEMBER 2017 ANALYSIS AND COMMENTARY BY Contents INTRODUCTION 3 Introduction by Fiona Allan 4 Introduction by David Brownlee 5 HEADLINES
in the Howard County Public School System and Rocketship Education
 Technical Appendix May 2016 DREAMBOX LEARNING ACHIEVEMENT GROWTH in the Howard County Public School System and Rocketship Education Abstract In this technical appendix, we present analyses of the relationship
Communication Studies Publication details, including instructions for authors and subscription information:
 This article was downloaded by: [University Of Maryland] On: 31 August 2012, At: 13:11 Publisher: Routledge Informa Ltd Registered in England and Wales Registered Number: 1072954 Registered office: Mortimer
More About Regression
 Regression Line for the Sample Chapter 14 More About Regression is spoken as y-hat, and it is also referred to either as predicted y or estimated y. b 0 is the intercept of the straight line. The intercept
Conway Public Library
 Conway Public Library Materials Selection/Collection Development Policy CONTENTS: Scope Responsibility for Selection Selection Criteria Material Classifications Educational Materials Nonprint Formats Multiple
NAA ENHANCING THE QUALITY OF MARKING PROJECT: THE EFFECT OF SAMPLE SIZE ON INCREASED PRECISION IN DETECTING ERRANT MARKING
 NAA ENHANCING THE QUALITY OF MARKING PROJECT: THE EFFECT OF SAMPLE SIZE ON INCREASED PRECISION IN DETECTING ERRANT MARKING Mudhaffar Al-Bayatti and Ben Jones February 00 This report was commissioned by
THE SVOD REPORT CHARTING THE GROWTH IN SVOD SERVICES ACROSS THE UK 1 TOTAL TV: AVERAGE DAILY MINUTES
 1 THE SVOD REPORT CHARTING THE GROWTH IN SVOD SERVICES ACROSS THE UK January 219 A lot can change in a year. In 218, England had a football team that the public actually enjoyed watching and the Beast
Understanding the True Cost of Cable Cuts
 Understanding the True Cost of Cable Cuts This paper examines the various direct and indirect costs incurred by cable manufacturers and distributors when a length of Outside Plant cable is cut at the request
The Chorus Impact Study
 How Children, Adults, and Communities Benefit from Choruses The Chorus Impact Study Executive Summary and Key Findings With funding support from n The Morris and Gwendolyn Cafritz Foundation n The James
SINS OF FILMMAKING FOR PROFIT
 US $6.00 THE SEVEN DEADLY SINS OF FILMMAKING FOR PROFIT By Ted Chalmers for www.movieplan.net 2002 Chalmers Entertainment Corporation THE SEVEN DEADLY SINS OF FILMMAKING FOR PROFIT By Ted Chalmers for
Introduction to Citation Metrics
 Introduction to Citation Metrics Library Tutorial for PC5198 Geok Kee slbtgk@nus.edu.sg 6 March 2014 1 Outline Searching in databases Introduction to citation metrics Journal metrics Author impact metrics
CONQUERING CONTENT EXCERPT OF FINDINGS
 CONQUERING CONTENT N O V E M B E R 2 0 1 5! EXCERPT OF FINDINGS 1 The proliferation of TV shows: a boon for TV viewers, a challenge for the industry More new shows: # of scripted original series (by year):
Study on the audiovisual content viewing habits of Canadians in June 2014
 Study on the audiovisual content viewing habits of Canadians in 2014 June 2014 Table of contents Context, objectives and methodology 3 Summary of results 9 Detailed results 14 Audiovisual content viewing
Evaluation of Serial Periodic, Multi-Variable Data Visualizations
 Evaluation of Serial Periodic, Multi-Variable Data Visualizations Alexander Mosolov 13705 Valley Oak Circle Rockville, MD 20850 (301) 340-0613 AVMosolov@aol.com Benjamin B. Bederson i Computer Science
Professor Birger Hjørland and associate professor Jeppe Nicolaisen hereby endorse the proposal by
 Project outline 1. Dissertation advisors endorsing the proposal Professor Birger Hjørland and associate professor Jeppe Nicolaisen hereby endorse the proposal by Tove Faber Frandsen. The present research
Methods, Topics, and Trends in Recent Business History Scholarship
 Jari Eloranta, Heli Valtonen, Jari Ojala Methods, Topics, and Trends in Recent Business History Scholarship This article is an overview of our larger project featuring analyses of the recent business history
The process of animating a storyboard into a moving sequence. Aperture A measure of the width of the opening allowing light to enter the camera.
 EXPLORE FILMMAKING NATIONAL FILM AND TELEVISION SCHOOL Glossary 180 Degree Rule One of the key features of the continuity system to which most mainstream film and television has tended to adhere. A screen
How to Write a Paper for a Forensic Damages Journal
 Draft, March 5, 2001 How to Write a Paper for a Forensic Damages Journal Thomas R. Ireland Department of Economics University of Missouri at St. Louis 8001 Natural Bridge Road St. Louis, MO 63121 Tel:
The Historian and Archival Finding Aids
 Georgia Archive Volume 5 Number 1 Article 7 January 1977 The Historian and Archival Finding Aids Michael E. Stevens University of Wisconsin Madison Follow this and additional works at: https://digitalcommons.kennesaw.edu/georgia_archive
Trufan: Role Of Fandom As An Influence On Attitude
 Trufan: Role Of Fandom As An Influence On Attitude Dr Stephen Dann, Echo Base, Hoth Advertising Marketing and Public Relations, Queensland University Technology, Brisbane, Australia Abstract Stars Wars
Comparing gifts to purchased materials: a usage study
 Library Collections, Acquisitions, & Technical Services 24 (2000) 351 359 Comparing gifts to purchased materials: a usage study Rob Kairis* Kent State University, Stark Campus, 6000 Frank Ave. NW, Canton,
The Play Selection Committee will use the following criteria when choosing a slate of shows:
 Somerset Valley Players (SVP) is issuing a call for Directors and Play Submissions for our upcoming 2015 season. In order to achieve the high quality theatre we aspire to, we are looking for creative,
F1000 recommendations as a new data source for research evaluation: A comparison with citations
 F1000 recommendations as a new data source for research evaluation: A comparison with citations Ludo Waltman and Rodrigo Costas Paper number CWTS Working Paper Series CWTS-WP-2013-003 Publication date