Visual Encoding Design
|
|
|
- Arabella Daniels
- 5 years ago
- Views:
Transcription


1 CSE Data Visualization Visual Encoding Design Jeffrey Heer University of Washington
2 A Design Space of Visual Encodings
3 Mapping Data to Visual Variables Assign data fields (e.g., with N, O, Q types) to visual channels (x, y, color, shape, size, ) for a chosen graphical mark type (point, bar, line, ). Additional concerns include choosing appropriate encoding parameters (log scale, sorting, ) and data transformations (bin, group, aggregate, ). These options define a large combinatorial space, containing both useful and questionable charts!
4 1D: Nominal
5 1D: Nominal
6 1D: Nominal
7 1D: Nominal
8 1D: Nominal
9 1D: Nominal
10 1D: Nominal Raw
11 1D: Nominal Raw Aggregate (Count)
12 1D: Nominal Raw Aggregate (Count)
13 1D: Nominal Raw Aggregate (Count)
14 1D: Nominal Raw Aggregate (Count)
15 1D: Nominal Raw Aggregate (Count)
16 1D: Nominal Raw Aggregate (Count)


17 1D: Nominal Raw Aggregate (Count)
18 1D: Nominal Raw Aggregate (Count)
19 Expressive? Raw Aggregate (Count)
20 1D: Quantitative
21 1D: Quantitative Raw
22 1D: Quantitative Raw
23 1D: Quantitative Raw
24 1D: Quantitative Raw
25 1D: Quantitative Raw
26 1D: Quantitative Raw
27 1D: Quantitative Raw
28 1D: Quantitative Raw Aggregate (Count)
29 1D: Quantitative Raw Aggregate (Count)
30 1D: Quantitative Raw Aggregate (Count)
31 1D: Quantitative Raw Aggregate (Count)

32 Expressive? Raw Aggregate (Count)
33
34 Raw (with Layout Algorithm)
35 Raw (with Layout Algorithm) Treemap
36 Raw (with Layout Algorithm) Treemap Bubble Chart
37 Raw (with Layout Algorithm) Treemap Bubble Chart Aggregate (Distributions)
38 Raw (with Layout Algorithm) Treemap Bubble Chart Aggregate (Distributions) Box Plot
39 Raw (with Layout Algorithm) Treemap Bubble Chart Aggregate (Distributions) median Box Plot
40 Raw (with Layout Algorithm) Treemap Bubble Chart Aggregate (Distributions) middle 50% (inter-quartile range) median Box Plot
41 Raw (with Layout Algorithm) Treemap Bubble Chart Aggregate (Distributions) low middle 50% (inter-quartile range) median Box Plot
42 Raw (with Layout Algorithm) Treemap Bubble Chart Aggregate (Distributions) low middle 50% (inter-quartile range) median high Box Plot


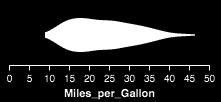
43 Raw (with Layout Algorithm) Treemap Bubble Chart Aggregate (Distributions) low middle 50% (inter-quartile range) median high Box Plot Violin Plot
44 2D: Nominal x Nominal
45 2D: Nominal x Nominal Raw
46 2D: Nominal x Nominal Raw
47 2D: Nominal x Nominal Raw
48 2D: Nominal x Nominal Raw
49 2D: Nominal x Nominal Raw Aggregate (Count)
50 2D: Nominal x Nominal Raw Aggregate (Count)
51 2D: Nominal x Nominal Raw Aggregate (Count)


")
52 2D: Nominal x Nominal Raw Aggregate (Count)
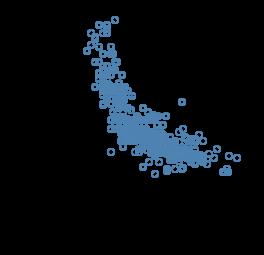
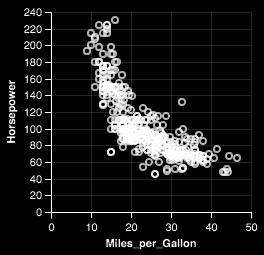
53 2D: Quantitative x Quantitative
54 2D: Quantitative x Quantitative Raw
55 2D: Quantitative x Quantitative Raw
56 2D: Quantitative x Quantitative Raw
57 2D: Quantitative x Quantitative Raw
58 2D: Quantitative x Quantitative Raw Aggregate (Count)

59 2D: Quantitative x Quantitative Raw Aggregate (Count)
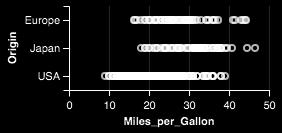
60 2D: Nominal x Quantitative
61 2D: Nominal x Quantitative Raw
62 2D: Nominal x Quantitative Raw
63 2D: Nominal x Quantitative Raw
64 2D: Nominal x Quantitative Raw
65 2D: Nominal x Quantitative Raw
66 2D: Nominal x Quantitative Raw Aggregate (Mean)
67 2D: Nominal x Quantitative Raw Aggregate (Mean)

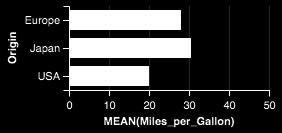
68 2D: Nominal x Quantitative Raw Aggregate (Mean)
69
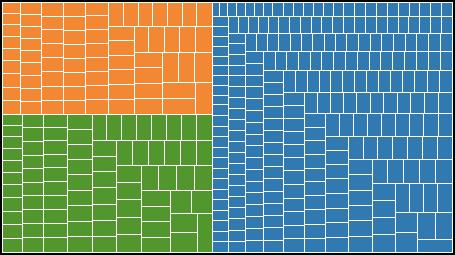
70 Raw (with Layout Algorithm)
71 Raw (with Layout Algorithm) Treemap
72 Raw (with Layout Algorithm) Treemap Bubble Chart


73 Raw (with Layout Algorithm) Treemap Bubble Chart Beeswarm Plot
74 3D and Higher Two variables [x,y] Can map to 2D points. Scatterplots, maps, Third variable [z] Often use one of size, color, opacity, shape, etc. Or, one can further partition space. What about 3D rendering? [Bertin]

75 Other Visual Encoding Channels?
76 Encoding Effectiveness
77 Effectiveness Rankings [Mackinlay 86] QUANTITATIVE ORDINAL NOMINAL Position Position Position Length Density (Value) Color Hue Angle Color Sat Texture Slope Color Hue Connection Area (Size) Texture Containment Volume Connection Density (Value) Density (Value) Containment Color Sat Color Sat Length Shape Color Hue Angle Length Texture Slope Angle Connection Area (Size) Slope Containment Volume Area Shape Shape Volume
78 Effectiveness Rankings [Mackinlay 86] QUANTITATIVE ORDINAL NOMINAL Position Position Position Length Density (Value) Color Hue Angle Color Sat Texture Slope Color Hue Connection Area (Size) Texture Containment Volume Connection Density (Value) Density (Value) Containment Color Sat Color Sat Length Shape Color Hue Angle Length Texture Slope Angle Connection Area (Size) Slope Containment Volume Area Shape Shape Volume
79 Effectiveness Rankings [Mackinlay 86] QUANTITATIVE ORDINAL NOMINAL Position Position Position Length Density (Value) Color Hue Angle Color Sat Texture Slope Color Hue Connection Area (Size) Texture Containment Volume Connection Density (Value) Density (Value) Containment Color Sat Color Sat Length Shape Color Hue Angle Length Texture Slope Angle Connection Area (Size) Slope Containment Volume Area Shape Shape Volume

80 Color Encoding

81 Area Encoding
82 Effectiveness Rankings QUANTITATIVE ORDINAL NOMINAL Position Position Position Length Density (Value) Color Hue Angle Color Sat Texture Slope Color Hue Connection Area (Size) Texture Containment Volume Connection Density (Value) Density (Value) Containment Color Sat Color Sat Length Shape Color Hue Angle Length Texture Slope Angle Connection Area (Size) Slope Containment Volume Area Shape Shape Volume
83 Gene Expression Time-Series [Meyer et al 11]
84 Gene Expression Time-Series [Meyer et al 11] Color Encoding

![et al 11] Color](/docs-images/95/123612368/images/85-2.jpg "Encoding Position")
85 Gene Expression Time-Series [Meyer et al 11] Color Encoding Position Encoding
86 Effectiveness Rankings QUANTITATIVE ORDINAL NOMINAL Position Position Position Length Density (Value) Color Hue Angle Color Sat Texture Slope Color Hue Connection Area (Size) Texture Containment Volume Connection Density (Value) Density (Value) Containment Color Sat Color Sat Length Shape Color Hue Angle Length Texture Slope Angle Connection Area (Size) Slope Containment Volume Area Shape Shape Volume
87 Artery Visualization [Borkin et al 11] Rainbow Palette Diverging Palette 2D 3D
88 Artery Visualization [Borkin et al 11] Rainbow Palette Diverging Palette 62% 92% 2D 39% 71% 3D
89 Effectiveness Rankings QUANTITATIVE ORDINAL NOMINAL Position Position Position Length Density (Value) Color Hue Angle Color Sat Texture Slope Color Hue Connection Area (Size) Texture Containment Volume Connection Density (Value) Density (Value) Containment Color Sat Color Sat Length Shape Color Hue Angle Length Texture Slope Angle Connection Area (Size) Slope Containment Volume Area Shape Shape Volume
90 Scales & Axes

91 Include Zero in Axis Scale? Government payrolls in 1937 [How To Lie With Statistics. Huff]
92 Include Zero in Axis Scale? Yearly CO 2 concentrations [Cleveland 85]
93 Include Zero in Axis Scale?
94 Include Zero in Axis Scale? Violates Expressiveness Principle!
95 Include Zero in Axis Scale? Compare Proportions (Q-Ratio) Violates Expressiveness Principle!
")

96 Include Zero in Axis Scale? Compare Proportions (Q-Ratio) Violates Expressiveness Principle! Compare Relative Position (Q-Interval)
97 Axis Tick Mark Selection What are some properties of good tick marks?
98 Axis Tick Mark Selection Simplicity - numbers are multiples of 10, 5, 2 Coverage - ticks near the ends of the data Density - not too many, nor too few Legibility - whitespace, horizontal text, size
99 How to Scale the Axis?
100 One Option: Clip Outliers
101 Clearly Mark Scale Breaks Poor scale break [Cleveland 85] Well-marked scale break [Cleveland 85]
102 Clearly Mark Scale Breaks Violates Expressiveness Principle! Poor scale break [Cleveland 85] Well-marked scale break [Cleveland 85]
103 Scale Break vs. Log Scale Scale Break Log Scale [Cleveland 85]
104 Scale Break vs. Log Scale Both increase visual resolution Scale break: difficult to compare (cognitive not perceptual work) Log scale: direct comparison of all data
105 Linear Scale vs. Log Scale Linear Scale MSFT Log Scale MSFT
106 Linear Scale vs. Log Scale Linear Scale Absolute change MSFT Log Scale Small fluctuations Percent change d(10,20) = d(30,60) MSFT
107 When To Apply a Log Scale? Address data skew (e.g., long tails, outliers) Enables comparison within and across multiple orders of magnitude. Focus on multiplicative factors (not additive) Recall that the logarithm transforms to +! Percentage change, not absolute value. Constraint: positive, non-zero values Constraint: audience familiarity?
108 Regression Lines
109 [The Elements of Graphing Data. Cleveland 94]
110 [The Elements of Graphing Data. Cleveland 94]
111 [The Elements of Graphing Data. Cleveland 94]
112 [The Elements of Graphing Data. Cleveland 94]
113 [The Elements of Graphing Data. Cleveland 94]
114 Transforming Data How well does the curve fit the data? [Cleveland 85]
115 Plot the Residuals Plot vertical distance from best fit curve Residual graph shows accuracy of fit [Cleveland 85]
116 Multiple Plotting Options Plot model in data space Plot data in model space [Cleveland 85]
117 Administrivia
 Include titles and captions for each view Due by 11:59pm Tuesday, Oct")
118 A2: Exploratory Data Analysis Use visualization software to form & answer questions First steps: Step 1: Pick domain & data Step 2: Pose questions Step 3: Profile the data Iterate as needed Create visualizations Interact with data Refine your questions Author a report Screenshots of most insightful views (10+) Include titles and captions for each view Due by 11:59pm Tuesday, Oct 16
119 Multidimensional Data

120 Visual Encoding Variables Position (X) Position (Y) Size Value Texture Color Orientation Shape ~8 dimensions?
121 Example: Coffee Sales Sales figures for a fictional coffee chain Sales Profit Marketing Product Type Market Q-Ratio Q-Ratio Q-Ratio N {Coffee, Espresso, Herbal Tea, Tea} N {Central, East, South, West}
122 Encode Sales (Q) and Profit (Q) using Position
123 Encode Product Type (N) using Hue
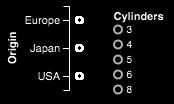
124 Encode Market (N) using Shape
")
125 Encode Marketing (Q) using Size

126 Trellis Plots A trellis plot subdivides space to enable comparison across multiple plots. Typically nominal or ordinal variables are used as dimensions for subdivision.
127 Small Multiples [MacEachren 95, Figure 2.11, p. 38]
128 Small Multiples [MacEachren 95, Figure 2.11, p. 38]
129 Scatterplot Matrix (SPLOM) Scatter plots for pairwise comparison of each data dimension.
130 Multiple Coordinated Views
131 Multiple Coordinated Views select high salaries
132 Multiple Coordinated Views how long in majors select high salaries
133 Multiple Coordinated Views how long in majors select high salaries avg assists vs avg putouts (fielding ability)
134 Multiple Coordinated Views how long in majors select high salaries avg assists vs avg putouts (fielding ability) avg career HRs vs avg career hits (batting ability)
 avg career HRs vs avg career hits (batting ability) distribution of positions")
135 Multiple Coordinated Views how long in majors select high salaries avg assists vs avg putouts (fielding ability) avg career HRs vs avg career hits (batting ability) distribution of positions played
136 Parallel Coordinates

137 Parallel Coordinates [Inselberg]
138 Parallel Coordinates [Inselberg] Visualize up to ~two dozen dimensions at once 1. Draw parallel axes for each variable 2. For each tuple, connect points on each axis Between adjacent axes: line crossings imply neg. correlation, shared slopes imply pos. correlation. Full plot can be cluttered. Interactive selection can be used to assess multivariate relationships. Highly sensitive to axis scale and ordering. Expertise required to use effectively!
139 Radar Plot / Star Graph Parallel dimensions in polar coordinate space Best if same units apply to each axis
140 Dimensionality Reduction

141 Dimensionality Reduction
142 Principal Components Analysis 1. Mean-center the data. 2. Find basis vectors that maximize the data variance. 3. Plot the data using the top vectors.
143 PCA of Genomes [Demiralp et al. 13]
144 Many Reduction Techniques! General Strategies: Matrix Factorization Nearest Neighbor (Topological) Methods Popular Techniques: Principal Components Analysis (PCA) t-dist. Stochastic Neighbor Embedding (t-sne) Uniform Manifold Approx. & Projection (UMAP)
145 distill.pub
146 Visualizing t-sne [Wattenberg et al. 16]
147 Time Curves [Bach et al. 16]
148 Time Curves [Bach et al. 16] Wikipedia Chocolate Article

149 Time Curves [Bach et al. 16] Wikipedia Chocolate Article U.S. Precipitation over 1 Year
150 Visual Encoding Design Use expressive and effective encodings Avoid over-encoding Reduce the problem space Use space and small multiples intelligently Use interaction to generate relevant views Rarely does a single visualization answer all questions. Instead, the ability to generate appropriate visualizations quickly is critical!
Principles of Data Visualization. Jeffrey University of Washington
 Principles of Data Visualization Jeffrey Heer @jeffrey_heer University of Washington Data Analysis & Statistics, Tukey & Wilk 1966 Four major influences act on data analysis today: 1. The formal theories
Graphical Perception. Graphical Perception. Graphical Perception. Which best encodes quantities? Jeffrey Heer Stanford University
 CS448B :: 7 Oct 2010 Graphical Perception Graphical Perception Jeffrey Heer Stanford University Graphical Perception The ability of viewers to interpret visual (graphical) encodings of information and
Graphical Perception. Graphical Perception. Which best encodes quantities?
 CS448B :: 11 Oct 2012 Graphical Perception Graphical Perception The ability of viewers to interpret visual (graphical) encodings of information and thereby decode information in graphs. Jeffrey Heer Stanford
CSE Data Visualization. Graphical Perception. Jeffrey Heer University of Washington
 CSE 512 - Data Visualization Graphical Perception Jeffrey Heer University of Washington Design Principles [Mackinlay 86] Expressiveness A set of facts is expressible in a visual language if the sentences
STAT 113: Statistics and Society Ellen Gundlach, Purdue University. (Chapters refer to Moore and Notz, Statistics: Concepts and Controversies, 8e)
") STAT 113: Statistics and Society Ellen Gundlach, Purdue University (Chapters refer to Moore and Notz, Statistics: Concepts and Controversies, 8e) Learning Objectives for Exam 1: Unit 1, Part 1: Population
STAT 113: Statistics and Society Ellen Gundlach, Purdue University (Chapters refer to Moore and Notz, Statistics: Concepts and Controversies, 8e) Learning Objectives for Exam 1: Unit 1, Part 1: Population
Statistics for Engineers
 Statistics for Engineers ChE 4C3 and 6C3 Kevin Dunn, 2013 kevin.dunn@mcmaster.ca http://learnche.mcmaster.ca/4c3 Overall revision number: 19 (January 2013) 1 Copyright, sharing, and attribution notice
6 ~ata-ink Maximization and Graphical Design
 6 ~ata-ink Maximization and Graphical Design So far the principles of maximizing data-ink and erasing have helped to generate a series of choices in the process of graphical revision. This is an important
Chapter 27. Inferences for Regression. Remembering Regression. An Example: Body Fat and Waist Size. Remembering Regression (cont.)
") Chapter 27 Inferences for Regression Copyright 2007 Pearson Education, Inc. Publishing as Pearson Addison-Wesley Slide 27-1 Copyright 2007 Pearson Education, Inc. Publishing as Pearson Addison-Wesley An
Chapter 27 Inferences for Regression Copyright 2007 Pearson Education, Inc. Publishing as Pearson Addison-Wesley Slide 27-1 Copyright 2007 Pearson Education, Inc. Publishing as Pearson Addison-Wesley An
CSE Data Visualization. Color. Jeffrey Heer University of Washington
 CSE 512 - Data Visualization Color Jeffrey Heer University of Washington Color in Visualization Identify, Group, Layer, Highlight Colin Ware Purpose of Color To label To measure To represent and imitate
Bootstrap Methods in Regression Questions Have you had a chance to try any of this? Any of the review questions?
 ICPSR Blalock Lectures, 2003 Bootstrap Resampling Robert Stine Lecture 3 Bootstrap Methods in Regression Questions Have you had a chance to try any of this? Any of the review questions? Getting class notes
Chapter 5. Describing Distributions Numerically. Finding the Center: The Median. Spread: Home on the Range. Finding the Center: The Median (cont.
 Chapter 5 Describing Distributions Numerically Copyright 2007 Pearson Education, Inc. Publishing as Pearson Addison-Wesley Copyright 2007 Pearson Education, Inc. Publishing as Pearson Addison-Wesley Slide
More About Regression
 Regression Line for the Sample Chapter 14 More About Regression is spoken as y-hat, and it is also referred to either as predicted y or estimated y. b 0 is the intercept of the straight line. The intercept
Relationships Between Quantitative Variables
 Chapter 5 Relationships Between Quantitative Variables Three Tools we will use Scatterplot, a two-dimensional graph of data values Correlation, a statistic that measures the strength and direction of a
CS229 Project Report Polyphonic Piano Transcription
 CS229 Project Report Polyphonic Piano Transcription Mohammad Sadegh Ebrahimi Stanford University Jean-Baptiste Boin Stanford University sadegh@stanford.edu jbboin@stanford.edu 1. Introduction In this project
Relationships. Between Quantitative Variables. Chapter 5. Copyright 2006 Brooks/Cole, a division of Thomson Learning, Inc.
 Relationships Chapter 5 Between Quantitative Variables Copyright 2006 Brooks/Cole, a division of Thomson Learning, Inc. Three Tools we will use Scatterplot, a two-dimensional graph of data values Correlation,
Scoregram: Displaying Gross Timbre Information from a Score
 Scoregram: Displaying Gross Timbre Information from a Score Rodrigo Segnini and Craig Sapp Center for Computer Research in Music and Acoustics (CCRMA), Center for Computer Assisted Research in the Humanities
Lesson 7: Measuring Variability for Skewed Distributions (Interquartile Range)
") : Measuring Variability for Skewed Distributions (Interquartile Range) Exploratory Challenge 1: Skewed Data and its Measure of Center Consider the following scenario. A television game show, Fact or Fiction,
: Measuring Variability for Skewed Distributions (Interquartile Range) Exploratory Challenge 1: Skewed Data and its Measure of Center Consider the following scenario. A television game show, Fact or Fiction,
Frequencies. Chapter 2. Descriptive statistics and charts
 An analyst usually does not concentrate on each individual data values but would like to have a whole picture of how the variables distributed. In this chapter, we will introduce some tools to tabulate
Multiple-point simulation of multiple categories Part 1. Testing against multiple truncation of a Gaussian field
 Multiple-point simulation of multiple categories Part 1. Testing against multiple truncation of a Gaussian field Tuanfeng Zhang November, 2001 Abstract Multiple-point simulation of multiple categories
NAA ENHANCING THE QUALITY OF MARKING PROJECT: THE EFFECT OF SAMPLE SIZE ON INCREASED PRECISION IN DETECTING ERRANT MARKING
 NAA ENHANCING THE QUALITY OF MARKING PROJECT: THE EFFECT OF SAMPLE SIZE ON INCREASED PRECISION IN DETECTING ERRANT MARKING Mudhaffar Al-Bayatti and Ben Jones February 00 This report was commissioned by
Automatic Music Genre Classification
 Automatic Music Genre Classification Nathan YongHoon Kwon, SUNY Binghamton Ingrid Tchakoua, Jackson State University Matthew Pietrosanu, University of Alberta Freya Fu, Colorado State University Yue Wang,
Algebra I Module 2 Lessons 1 19
 Eureka Math 2015 2016 Algebra I Module 2 Lessons 1 19 Eureka Math, Published by the non-profit Great Minds. Copyright 2015 Great Minds. No part of this work may be reproduced, distributed, modified, sold,
WHAT MAKES FOR A HIT POP SONG? WHAT MAKES FOR A POP SONG?
 WHAT MAKES FOR A HIT POP SONG? WHAT MAKES FOR A POP SONG? NICHOLAS BORG AND GEORGE HOKKANEN Abstract. The possibility of a hit song prediction algorithm is both academically interesting and industry motivated.
Reproducibility Assessment of Independent Component Analysis of Expression Ratios from DNA microarrays.
 Reproducibility Assessment of Independent Component Analysis of Expression Ratios from DNA microarrays. David Philip Kreil David J. C. MacKay Technical Report Revision 1., compiled 16th October 22 Department
What is Statistics? 13.1 What is Statistics? Statistics
 13.1 What is Statistics? What is Statistics? The collection of all outcomes, responses, measurements, or counts that are of interest. A portion or subset of the population. Statistics Is the science of
Math 81 Graphing. Cartesian Coordinate System Plotting Ordered Pairs (x, y) (x is horizontal, y is vertical) center is (0,0) Quadrants:
 (x is horizontal, y is vertical) center is (0,0) Quadrants:") Math 81 Graphing Cartesian Coordinate System Plotting Ordered Pairs (x, y) (x is horizontal, y is vertical) center is (0,0) Ex 1. Plot and indicate which quadrant they re in. A (0,2) B (3, 5) C (-2, -4)
Math 81 Graphing Cartesian Coordinate System Plotting Ordered Pairs (x, y) (x is horizontal, y is vertical) center is (0,0) Ex 1. Plot and indicate which quadrant they re in. A (0,2) B (3, 5) C (-2, -4)
Why visualize data? Advanced GDA and Software: Multivariate approaches, Interactive Graphics, Mondrian, iplots and R. German Bundestagswahl 2005
 Advanced GDA and Software: Multivariate approaches, Interactive Graphics, Mondrian, iplots and R Why visualize data? Looking for global trends overall structure Looking for local features data quality
Chapter 3. Averages and Variation
 Chapter 3 Averages and Variation Understandable Statistics Ninth Edition By Brase and Brase Prepared by Yixun Shi Bloomsburg University of Pennsylvania Measures of Central Tendency We use the term average
Data Visualization (CIS 468)
") Data Visualization (CIS 468) Marks & Channels Dr. David Koop Visual Encoding How should we visualize this data? Name Region Population Life Expectancy Income China East Asia & Pacific 1335029250 73.28
Data Visualization (CIS 468) Marks & Channels Dr. David Koop Visual Encoding How should we visualize this data? Name Region Population Life Expectancy Income China East Asia & Pacific 1335029250 73.28
Lecture 2 Video Formation and Representation
 2013 Spring Term 1 Lecture 2 Video Formation and Representation Wen-Hsiao Peng ( 彭文孝 ) Multimedia Architecture and Processing Lab (MAPL) Department of Computer Science National Chiao Tung University 1
Congratulations to the Bureau of Labor Statistics for Creating an Excellent Graph By Jeffrey A. Shaffer 12/16/2011
 Congratulations to the Bureau of Labor Statistics for Creating an Excellent Graph By Jeffrey A. Shaffer 12/16/2011 The Bureau of Labor Statistics (BLS) has published some really bad graphs and maps over
Colour Reproduction Performance of JPEG and JPEG2000 Codecs
 Colour Reproduction Performance of JPEG and JPEG000 Codecs A. Punchihewa, D. G. Bailey, and R. M. Hodgson Institute of Information Sciences & Technology, Massey University, Palmerston North, New Zealand
Modeling memory for melodies
 Modeling memory for melodies Daniel Müllensiefen 1 and Christian Hennig 2 1 Musikwissenschaftliches Institut, Universität Hamburg, 20354 Hamburg, Germany 2 Department of Statistical Science, University
Escaping RGBland: Selecting Colors for Statistical Graphics
 Escaping RGBland: Selecting Colors for Statistical Graphics Achim Zeileis Kurt Hornik Paul Murrell http://statmath.wu-wien.ac.at/~zeileis/ Overview Motivation Statistical graphics and color Color vision
E X P E R I M E N T 1
 E X P E R I M E N T 1 Getting to Know Data Studio Produced by the Physics Staff at Collin College Copyright Collin College Physics Department. All Rights Reserved. University Physics, Exp 1: Getting to
MATH 214 (NOTES) Math 214 Al Nosedal. Department of Mathematics Indiana University of Pennsylvania. MATH 214 (NOTES) p. 1/3
 Math 214 Al Nosedal. Department of Mathematics Indiana University of Pennsylvania. MATH 214 (NOTES) p. 1/3") MATH 214 (NOTES) Math 214 Al Nosedal Department of Mathematics Indiana University of Pennsylvania MATH 214 (NOTES) p. 1/3 CHAPTER 1 DATA AND STATISTICS MATH 214 (NOTES) p. 2/3 Definitions. Statistics is
MATH 214 (NOTES) Math 214 Al Nosedal Department of Mathematics Indiana University of Pennsylvania MATH 214 (NOTES) p. 1/3 CHAPTER 1 DATA AND STATISTICS MATH 214 (NOTES) p. 2/3 Definitions. Statistics is
The Measurement Tools and What They Do
 2 The Measurement Tools The Measurement Tools and What They Do JITTERWIZARD The JitterWizard is a unique capability of the JitterPro package that performs the requisite scope setup chores while simplifying
University of Bristol - Explore Bristol Research. Peer reviewed version. Link to published version (if available): /ICIP.2016.
: /ICIP.2016.") Mercer Moss, F., Zhang, F., Baddeley, R. J., & Bull, D. R. (2017). What's on TV: A large scale quantitative characterisation of modern broadcast video content. In 2016 IEEE International Conference on
Mercer Moss, F., Zhang, F., Baddeley, R. J., & Bull, D. R. (2017). What's on TV: A large scale quantitative characterisation of modern broadcast video content. In 2016 IEEE International Conference on
MODE FIELD DIAMETER AND EFFECTIVE AREA MEASUREMENT OF DISPERSION COMPENSATION OPTICAL DEVICES
 MODE FIELD DIAMETER AND EFFECTIVE AREA MEASUREMENT OF DISPERSION COMPENSATION OPTICAL DEVICES Hale R. Farley, Jeffrey L. Guttman, Razvan Chirita and Carmen D. Pâlsan Photon inc. 6860 Santa Teresa Blvd
Murdoch redux. Colorimetry as Linear Algebra. Math of additive mixing. Approaching color mathematically. RGB colors add as vectors
 Murdoch redux Colorimetry as Linear Algebra CS 465 Lecture 23 RGB colors add as vectors so do primary spectra in additive display (CRT, LCD, etc.) Chromaticity: color ratios (r = R/(R+G+B), etc.) color
Paired plot designs experience and recommendations for in field product evaluation at Syngenta
 Paired plot designs experience and recommendations for in field product evaluation at Syngenta 1. What are paired plot designs? 2. Analysis and reporting of paired plot designs 3. Case study 1 : analysis
Measuring Variability for Skewed Distributions
 Measuring Variability for Skewed Distributions Skewed Data and its Measure of Center Consider the following scenario. A television game show, Fact or Fiction, was canceled after nine shows. Many people
Chapter 1 Midterm Review
 Name: Class: Date: Chapter 1 Midterm Review Multiple Choice Identify the choice that best completes the statement or answers the question. 1. A survey typically records many variables of interest to the
Improvised Duet Interaction: Learning Improvisation Techniques for Automatic Accompaniment
 Improvised Duet Interaction: Learning Improvisation Techniques for Automatic Accompaniment Gus G. Xia Dartmouth College Neukom Institute Hanover, NH, USA gxia@dartmouth.edu Roger B. Dannenberg Carnegie
(Week 13) A05. Data Analysis Methods for CRM. Electronic Commerce Marketing
 A05. Data Analysis Methods for CRM. Electronic Commerce Marketing") (Week 13) A05. Data Analysis Methods for CRM Electronic Commerce Marketing Course Code: 166186-01 Course Name: Electronic Commerce Marketing Period: Autumn 2015 Lecturer: Prof. Dr. Sync Sangwon Lee Department:
(Week 13) A05. Data Analysis Methods for CRM Electronic Commerce Marketing Course Code: 166186-01 Course Name: Electronic Commerce Marketing Period: Autumn 2015 Lecturer: Prof. Dr. Sync Sangwon Lee Department:
LCD and Plasma display technologies are promising solutions for large-format
 Chapter 4 4. LCD and Plasma Display Characterization 4. Overview LCD and Plasma display technologies are promising solutions for large-format color displays. As these devices become more popular, display
Visualizing Social Networks
 Visualizing Social Networks How to Create Meaningful and Compelling Network Drawings Jürgen Pfeffer jpfeffer@cs.cmu.edu @JurgenPfeffer Sunbelt 2014 St. Pete Beach, Florida Jürgen Pfeffer Assistant Research
Estimation of inter-rater reliability
 Estimation of inter-rater reliability January 2013 Note: This report is best printed in colour so that the graphs are clear. Vikas Dhawan & Tom Bramley ARD Research Division Cambridge Assessment Ofqual/13/5260
Blueline, Linefree, Accuracy Ratio, & Moving Absolute Mean Ratio Charts
 INTRODUCTION This instruction manual describes for users of the Excel Standard Celeration Template(s) the features of each page or worksheet in the template, allowing the user to set up and generate charts
Sociology 7704: Regression Models for Categorical Data Instructor: Natasha Sarkisian
 OLS Regression Assumptions Sociology 7704: Regression Models for Categorical Data Instructor: Natasha Sarkisian A1. All independent variables are quantitative or dichotomous, and the dependent variable
Object selectivity of local field potentials and spikes in the macaque inferior temporal cortex
 Object selectivity of local field potentials and spikes in the macaque inferior temporal cortex Gabriel Kreiman 1,2,3,4*#, Chou P. Hung 1,2,4*, Alexander Kraskov 5, Rodrigo Quian Quiroga 6, Tomaso Poggio
A Novel Approach towards Video Compression for Mobile Internet using Transform Domain Technique
 A Novel Approach towards Video Compression for Mobile Internet using Transform Domain Technique Dhaval R. Bhojani Research Scholar, Shri JJT University, Jhunjunu, Rajasthan, India Ved Vyas Dwivedi, PhD.
Video coding standards
 Video coding standards Video signals represent sequences of images or frames which can be transmitted with a rate from 5 to 60 frames per second (fps), that provides the illusion of motion in the displayed
DELTA MODULATION AND DPCM CODING OF COLOR SIGNALS
 DELTA MODULATION AND DPCM CODING OF COLOR SIGNALS Item Type text; Proceedings Authors Habibi, A. Publisher International Foundation for Telemetering Journal International Telemetering Conference Proceedings
Chapter 2 Describing Data: Frequency Tables, Frequency Distributions, and
 Frequency Chapter 2 - Describing Data: Frequency Tables, Frequency Distributions, and Graphic Presentation Chapter 2 Describing Data: Frequency Tables, Frequency Distributions, and 1. Pepsi-Cola has a
Analysis of WFS Measurements from first half of 2004
 Analysis of WFS Measurements from first half of 24 (Report4) Graham Cox August 19, 24 1 Abstract Described in this report is the results of wavefront sensor measurements taken during the first seven months
COMP Test on Psychology 320 Check on Mastery of Prerequisites
 COMP Test on Psychology 320 Check on Mastery of Prerequisites This test is designed to provide you and your instructor with information on your mastery of the basic content of Psychology 320. The results
Release Year Prediction for Songs
 Release Year Prediction for Songs [CSE 258 Assignment 2] Ruyu Tan University of California San Diego PID: A53099216 rut003@ucsd.edu Jiaying Liu University of California San Diego PID: A53107720 jil672@ucsd.edu
THE OPERATION OF A CATHODE RAY TUBE
 THE OPERATION OF A CATHODE RAY TUBE OBJECT: To acquaint the student with the operation of a cathode ray tube, and to study the effect of varying potential differences on accelerated electrons. THEORY:
Lesson 7: Measuring Variability for Skewed Distributions (Interquartile Range)
") : Measuring Variability for Skewed Distributions (Interquartile Range) Student Outcomes Students explain why a median is a better description of a typical value for a skewed distribution. Students calculate
: Measuring Variability for Skewed Distributions (Interquartile Range) Student Outcomes Students explain why a median is a better description of a typical value for a skewed distribution. Students calculate
ATSC Standard: Video Watermark Emission (A/335)
") ATSC Standard: Video Watermark Emission (A/335) Doc. A/335:2016 20 September 2016 Advanced Television Systems Committee 1776 K Street, N.W. Washington, D.C. 20006 202-872-9160 i The Advanced Television
ATSC Standard: Video Watermark Emission (A/335) Doc. A/335:2016 20 September 2016 Advanced Television Systems Committee 1776 K Street, N.W. Washington, D.C. 20006 202-872-9160 i The Advanced Television
Research Article. ISSN (Print) *Corresponding author Shireen Fathima
 *Corresponding author Shireen Fathima") Scholars Journal of Engineering and Technology (SJET) Sch. J. Eng. Tech., 2014; 2(4C):613-620 Scholars Academic and Scientific Publisher (An International Publisher for Academic and Scientific Resources)
Scholars Journal of Engineering and Technology (SJET) Sch. J. Eng. Tech., 2014; 2(4C):613-620 Scholars Academic and Scientific Publisher (An International Publisher for Academic and Scientific Resources)
Box Plots. So that I can: look at large amount of data in condensed form.
 LESSON 5 Box Plots LEARNING OBJECTIVES Today I am: creating box plots. So that I can: look at large amount of data in condensed form. I ll know I have it when I can: make observations about the data based
Figures in Scientific Open Access Publications
 Figures in Scientific Open Access Publications Lucia Sohmen 2[0000 0002 2593 8754], Jean Charbonnier 1[0000 0001 6489 7687], Ina Blümel 1,2[0000 0002 3075 7640], Christian Wartena 1[0000 0001 5483 1529],
Music Genre Classification
 Music Genre Classification chunya25 Fall 2017 1 Introduction A genre is defined as a category of artistic composition, characterized by similarities in form, style, or subject matter. [1] Some researchers
ATSC Candidate Standard: Video Watermark Emission (A/335)
") ATSC Candidate Standard: Video Watermark Emission (A/335) Doc. S33-156r1 30 November 2015 Advanced Television Systems Committee 1776 K Street, N.W. Washington, D.C. 20006 202-872-9160 i The Advanced Television
ATSC Candidate Standard: Video Watermark Emission (A/335) Doc. S33-156r1 30 November 2015 Advanced Television Systems Committee 1776 K Street, N.W. Washington, D.C. 20006 202-872-9160 i The Advanced Television
Processes for the Intersection
 7 Timing Processes for the Intersection In Chapter 6, you studied the operation of one intersection approach and determined the value of the vehicle extension time that would extend the green for as long
Distribution of Data and the Empirical Rule
 302360_File_B.qxd 7/7/03 7:18 AM Page 1 Distribution of Data and the Empirical Rule 1 Distribution of Data and the Empirical Rule Stem-and-Leaf Diagrams Frequency Distributions and Histograms Normal Distributions
Experiments to Assess the Cost-Benefits of Test- Suite Reduction
 University of Nebraska - Lincoln DigitalCommons@University of Nebraska - Lincoln CSE Technical reports Computer Science and Engineering, Department of 12-1-1999 Experiments to Assess the Cost-Benefits
Predicting the Importance of Current Papers
 Predicting the Importance of Current Papers Kevin W. Boyack * and Richard Klavans ** kboyack@sandia.gov * Sandia National Laboratories, P.O. Box 5800, MS-0310, Albuquerque, NM 87185, USA rklavans@mapofscience.com
WHAT'S HOT: LINEAR POPULARITY PREDICTION FROM TV AND SOCIAL USAGE DATA Jan Neumann, Xiaodong Yu, and Mohamad Ali Torkamani Comcast Labs
 WHAT'S HOT: LINEAR POPULARITY PREDICTION FROM TV AND SOCIAL USAGE DATA Jan Neumann, Xiaodong Yu, and Mohamad Ali Torkamani Comcast Labs Abstract Large numbers of TV channels are available to TV consumers
For the SIA. Applications of Propagation Delay & Skew tool. Introduction. Theory of Operation. Propagation Delay & Skew Tool
 For the SIA Applications of Propagation Delay & Skew tool Determine signal propagation delay time Detect skewing between channels on rising or falling edges Create histograms of different edge relationships
Normalization Methods for Two-Color Microarray Data
 Normalization Methods for Two-Color Microarray Data 1/13/2009 Copyright 2009 Dan Nettleton What is Normalization? Normalization describes the process of removing (or minimizing) non-biological variation
Time Domain Simulations
 Accuracy of the Computational Experiments Called Mike Steinberger Lead Architect Serial Channel Products SiSoft Time Domain Simulations Evaluation vs. Experimentation We re used to thinking of results
THE OPERATION OF A CATHODE RAY TUBE
 THE OPERATION OF A CATHODE RAY TUBE OBJECT: To acquaint the student with the operation of a cathode ray tube, and to study the effect of varying potential differences on accelerated electrons. THEORY:
Chapter 4. Displaying Quantitative Data. Copyright 2007 Pearson Education, Inc. Publishing as Pearson Addison-Wesley
 Chapter 4 Displaying Quantitative Data Copyright 2007 Pearson Education, Inc. Publishing as Pearson Addison-Wesley Dealing With a Lot of Numbers Summarizing the data will help us when we look at large
Getting Started. Connect green audio output of SpikerBox/SpikerShield using green cable to your headphones input on iphone/ipad.
 Getting Started First thing you should do is to connect your iphone or ipad to SpikerBox with a green smartphone cable. Green cable comes with designators on each end of the cable ( Smartphone and SpikerBox
The theory of data visualisation
 The theory of data visualisation V2017-10 Simon Andrews, Phil Ewels simon.andrews@babraham.ac.uk phil.ewels@scilifelab.se Data Visualisation A scientific discipline involving the creation and study of
PS User Guide Series Seismic-Data Display
 PS User Guide Series 2015 Seismic-Data Display Prepared By Choon B. Park, Ph.D. January 2015 Table of Contents Page 1. File 2 2. Data 2 2.1 Resample 3 3. Edit 4 3.1 Export Data 4 3.2 Cut/Append Records
LSTM Neural Style Transfer in Music Using Computational Musicology
 LSTM Neural Style Transfer in Music Using Computational Musicology Jett Oristaglio Dartmouth College, June 4 2017 1. Introduction In the 2016 paper A Neural Algorithm of Artistic Style, Gatys et al. discovered
Math 7 /Unit 07 Practice Test: Collecting, Displaying and Analyzing Data
 Math 7 /Unit 07 Practice Test: Collecting, Displaying and Analyzing Data Name: Date: Define the terms below and give an example. 1. mode 2. range 3. median 4. mean 5. Which data display would be used to
Connection for filtered air
 BeamWatch Non-contact, Focus Spot Size and Position monitor for high power YAG, Diode and Fiber lasers Instantly measure focus spot size Dynamically measure focal plane location during start-up From 1kW
A combination of approaches to solve Task How Many Ratings? of the KDD CUP 2007
 A combination of approaches to solve Tas How Many Ratings? of the KDD CUP 2007 Jorge Sueiras C/ Arequipa +34 9 382 45 54 orge.sueiras@neo-metrics.com Daniel Vélez C/ Arequipa +34 9 382 45 54 José Luis
Creating a Feature Vector to Identify Similarity between MIDI Files
 Creating a Feature Vector to Identify Similarity between MIDI Files Joseph Stroud 2017 Honors Thesis Advised by Sergio Alvarez Computer Science Department, Boston College 1 Abstract Today there are many
Revised Curriculum Guide 2013
 Big Ideas: Sequencing ELA Reading Standards for Literature: Poetry/Biographies Math Geometry: Shapes, Coordinate Graphs and Angles Science Forces and Motion Social Studies Economics and Financial Literacy:
PGDBA 2017 INSTRUCTIONS FOR WRITTEN TEST
 INSTRUCTIONS FOR WRITTEN TEST 1. The duration of the test is 3 hours. The test will have a total of 50 questions carrying 150 marks. Each of these questions will be Multiple-Choice Question (MCQ). A question
Supplemental Material: Color Compatibility From Large Datasets
 Supplemental Material: Color Compatibility From Large Datasets Peter O Donovan, Aseem Agarwala, and Aaron Hertzmann Project URL: www.dgp.toronto.edu/ donovan/color/ 1 Unmixing color preferences In the
MPEG-7 AUDIO SPECTRUM BASIS AS A SIGNATURE OF VIOLIN SOUND
 MPEG-7 AUDIO SPECTRUM BASIS AS A SIGNATURE OF VIOLIN SOUND Aleksander Kaminiarz, Ewa Łukasik Institute of Computing Science, Poznań University of Technology. Piotrowo 2, 60-965 Poznań, Poland e-mail: Ewa.Lukasik@cs.put.poznan.pl
Contents. xv xxi xxiii xxiv. 1 Introduction 1 References 4
 Contents List of figures List of tables Preface Acknowledgements xv xxi xxiii xxiv 1 Introduction 1 References 4 2 Digital video 5 2.1 Introduction 5 2.2 Analogue television 5 2.3 Interlace 7 2.4 Picture
CPU Bach: An Automatic Chorale Harmonization System
 CPU Bach: An Automatic Chorale Harmonization System Matt Hanlon mhanlon@fas Tim Ledlie ledlie@fas January 15, 2002 Abstract We present an automated system for the harmonization of fourpart chorales in
Composer Style Attribution
 Composer Style Attribution Jacqueline Speiser, Vishesh Gupta Introduction Josquin des Prez (1450 1521) is one of the most famous composers of the Renaissance. Despite his fame, there exists a significant
Bioconductor s marray package: Plotting component
 Bioconductor s marray package: Plotting component Yee Hwa Yang and Sandrine Dudoit June, 08. Department of Medicine, University of California, San Francisco, jean@biostat.berkeley.edu. Division of Biostatistics,
Objective: Write on the goal/objective sheet and give a before class rating. Determine the types of graphs appropriate for specific data.
 Objective: Write on the goal/objective sheet and give a before class rating. Determine the types of graphs appropriate for specific data. Khan Academy test Tuesday Sept th. NO CALCULATORS allowed. Not
PHY221 Lab 1 Discovering Motion: Introduction to Logger Pro and the Motion Detector; Motion with Constant Velocity
 PHY221 Lab 1 Discovering Motion: Introduction to Logger Pro and the Motion Detector; Motion with Constant Velocity Print Your Name Print Your Partners' Names Instructions August 31, 2016 Before lab, read
HIGH DYNAMIC RANGE SUBJECTIVE TESTING
 HIGH DYNAMIC RANGE SUBJECTIVE TESTING M. E. Nilsson and B. Allan British Telecommunications plc, UK ABSTRACT This paper describes of a set of subjective tests that the authors have carried out to assess
EE373B Project Report Can we predict general public s response by studying published sales data? A Statistical and adaptive approach
 EE373B Project Report Can we predict general public s response by studying published sales data? A Statistical and adaptive approach Song Hui Chon Stanford University Everyone has different musical taste,
Visualizing Euclidean Rhythms Using Tangle Theory
 POLYMATH: AN INTERDISCIPLINARY ARTS & SCIENCES JOURNAL Visualizing Euclidean Rhythms Using Tangle Theory Jonathon Kirk, North Central College Neil Nicholson, North Central College Abstract Recently there
On the Characterization of Distributed Virtual Environment Systems
 On the Characterization of Distributed Virtual Environment Systems P. Morillo, J. M. Orduña, M. Fernández and J. Duato Departamento de Informática. Universidad de Valencia. SPAIN DISCA. Universidad Politécnica
homework solutions for: Homework #4: Signal-to-Noise Ratio Estimation submitted to: Dr. Joseph Picone ECE 8993 Fundamentals of Speech Recognition
 INSTITUTE FOR SIGNAL AND INFORMATION PROCESSING homework solutions for: Homework #4: Signal-to-Noise Ratio Estimation submitted to: Dr. Joseph Picone ECE 8993 Fundamentals of Speech Recognition May 3,
About Giovanni De Poli. What is Model. Introduction. di Poli: Methodologies for Expressive Modeling of/for Music Performance
 Methodologies for Expressiveness Modeling of and for Music Performance by Giovanni De Poli Center of Computational Sonology, Department of Information Engineering, University of Padova, Padova, Italy About