A Comparison of Relative Gain Estimation Methods for High Radiometric Resolution Pushbroom Sensors
|
|
|
- Dana McKenzie
- 5 years ago
- Views:
Transcription


1 A Comparison of Relative Gain Estimation Methods for High Radiometric Resolution Pushbroom Sensors Dennis Helder, Calvin Kielas-Jensen, Nathan Reynhout, Cody Anderson, Drake Jeno August 24, 2017 Calcon 2017, USU, Logan, Utah 1
2 Outline Introduction Methodology Results Conclusions 2
3 INTRODUCTION 3
4 What are Relative Gains? When two detectors sense the same radiance, they should generate the same digital number (DN): DDDD = gg ii LL λ + bb Due to real world constraints, the DN will not be the same because gg ii gg jj This causes visible striping in an image A relative gain (RG), RRRR = gg ii, is applied to each gg detector so that the resulting DNs are the same when the detectors sense identical values Detector g 1 To ADC Detector g 2 To ADC 4
 bit dynamic range Relative gains are calculated using an onboard solar")

5 MOVTIVATION Landsat 8 (L8) uses a pushbroom style sensor array with nearly 70,000 detectors Difficulty increases with 12 (actually 14) bit dynamic range Relative gains are calculated using an onboard solar diffuser. Do data-driven alternative relative gain estimation methods, lifetime statistics and side-slither, provide equivalent or better accuracy? Raw Image L1R Image with LS RGs Landsat 8 Example: LC LGN01, B3, FPM1 5
6 METHODOLOGY 6

 2.")

7 How are Relative Gains Calculated? Three methods are currently being used to calculate Landsat 8 RGs: 1. Solar Diffuser (DIFF) 2. Side Slither (SS) Flight Path 3. Lifetime Statistics (LS)
")
8 Solar Diffuser Diffuser collects are processed the same way standard OLI images are processed in order to correct any bias and linearize the response The following equation is then used to derive the RGs for each detector RRGG ii = DDNN ii DDDD Where: RRGG ii = RG for the i th detector DDNN ii = Average DN for the i th detector DDNN = Average DN for all detectors within a focal plane module (FPM) Sample Solar Diffuser Collect
9 Basic idea: Lifetime Statistics Each detector statistically sees about the same value (means and standard deviations) when given a long enough period of time These means can then be used to derive relative gains 9

10 Scene Filter Rel Gains calculated on 16 day intervals Scenes within the 16 day interval are filtered by scene mean and by scene standard deviation Scene Mean Scene StDev RRRR ii = DDDD ii DDDD & = 10
11 Side Slither Over a radiometrically flat and uniform area, the satellite is rotated 90 o on its yaw axis As the sensor passes over its target, each detector theoretically measures the same radiance 11
12 Pushbroom Scan Scan Motion Image Formed Pushbroom Array A B C D E F G H I J K L M N O P A B C D E F G H I J K L M N O P Scan Direction 12
13 Side-Slither Scan Scan Motion Yaw array 90 degrees Pushbroom Array Image Formed A B C D E F G H I J K L M N O P B F B J F B N J F B N J F N J N Scan Direction 13


14 Frame Variance Bad SS data Good SS data
15 Test Scenes Six different regions of interest (ROIs) were chosen, 10 scenes/roi, spanning the lifetime of Landsat 8: Amazon Rainforest Pacific Ocean Antarctica Greenland Sahara Desert Saudi Arabia Dark Scenes Bright at Short Wavelengths Bright at Long Wavelengths 15

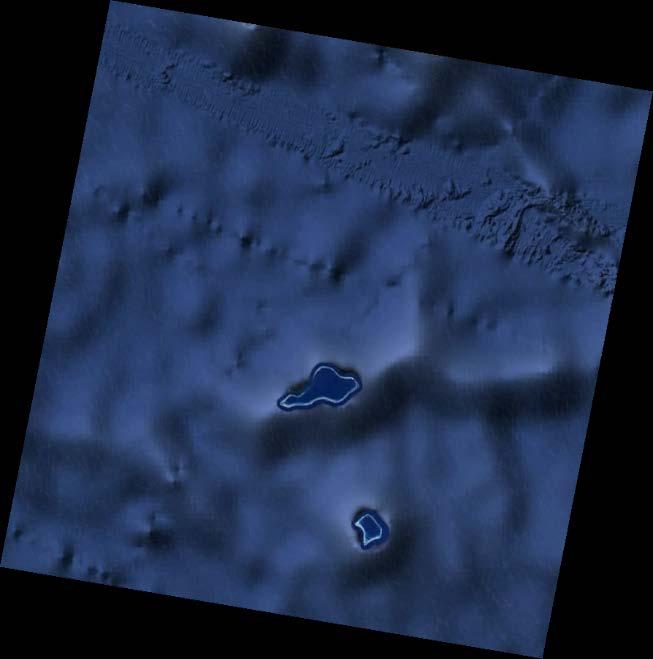
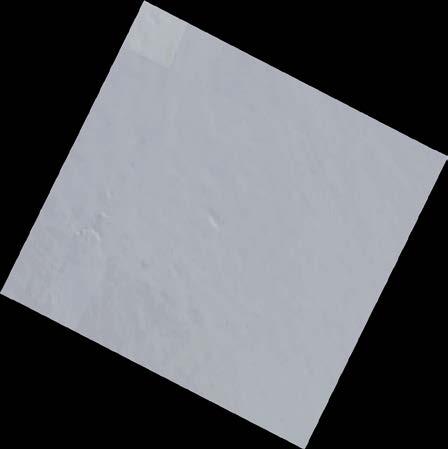


16 Test Scenes
17 Quantitative Assessment: A Striping For all detectors in an FPM (except for the two edge detectors), a detector and its two neighboring detectors are compared to determine the level of striping. SS ii = LL ll 1 2 LL ll 1+LL ll+1 LL ll Metric SS ii = striping metric LL ll = mean of a detector column The overall striping metric is the cube root of the product of the mean, maximum peak, and mean of the top 15 peaks: 3 mmmmmmmm mmmmmm mmmmmmmm oooo tttttt ffffffffffffff 17
18 Differences on Average: Pairwise Difference Test Determines if two methods are statistically different from each other for a given band. tt = xx ii yy ii ss/ nn, where tt = test statistic xx ii yy ii = sample mean of the difference between two methods ii = same detector in the scene ss = standard deviation of xx yy nn = sample size 18
19 Extreme Stripes: Counting Spike Data A Hampel filter was used to identify significant outliers, or spikes, in an FPM for each of the three methods. Moving window median filter For a given data sequence, Spike if: xx ii 3MMMMMM xx ii ll,, xx ii+ll The data point at the center of the window is considered a spike if it is more than three times the median absolute deviation of the data points in the window. The peak spike was recorded, along with the median of spikes and number of spikes. 19
20 RESULTS 20
21 Visible Spikes (DIFF & SS) 21
22 Visible Spikes (DIFF & SS) 22
23 Antarctica Band 1 FPM 6 DIFF 23

24 Antarctica Band 1 FPM 6 LS 24
25 Antarctica Band 1 FPM 6 SS 25
26 Visible Spikes (LS) 26

27 Pacific Ocean Band 3 FPM 1 LS

28 Lowest Striping Metrics 28

29 Greenland Band 7 FPM 12 DIFF 29
30 Side Slither Anomaly 30
31 Summary: Pairwise Difference Tests Band Amazon Pacific Antarctica Greenland Sahara Saudi Totals DIFF 0 DIFF 0 DIFF 0 DIFF 0 DIFF 0 DIFF 0 DIFF 0 LS 7 LS 9 LS 10 LS 10 LS 9 LS 9 LS 54 SS 2 SS 0 SS 0 SS 0 SS 0 SS 0 SS 2 DIFF 0 DIFF 0 DIFF 0 DIFF 0 DIFF 0 DIFF 0 DIFF 0 LS 9 LS 10 LS 10 LS 9 LS 9 LS 8 LS 55 SS 1 SS 0 SS 0 SS 1 SS 1 SS 0 SS 3 DIFF 0 DIFF 1 DIFF 0 DIFF 0 DIFF 0 DIFF 0 DIFF 1 LS 7 LS 7 LS 10 LS 10 LS 8 LS 8 LS 50 SS 1 SS 0 SS 0 SS 0 SS 1 SS 0 SS 2 DIFF 1 DIFF 1 DIFF 0 DIFF 0 DIFF 0 DIFF 0 DIFF 2 LS 0 LS 0 LS 10 LS 10 LS 10 LS 10 LS 40 SS 0 SS 0 SS 0 SS 0 SS 0 SS 0 SS 0 DIFF 2 DIFF 2 DIFF 0 DIFF 0 DIFF 0 DIFF 0 DIFF 4 LS 0 LS 0 LS 4 LS 10 LS 8 LS 6 LS 28 SS 0 SS 0 SS 0 SS 0 SS 0 SS 0 SS 0 DIFF 0 DIFF 1 DIFF 0 DIFF 0 DIFF 0 DIFF 0 DIFF 1 LS 2 LS 1 LS 7 LS 7 LS 10 LS 10 LS 37 SS 0 SS 0 SS 2 SS 2 SS 0 SS 0 SS 4 DIFF 0 DIFF 0 DIFF 0 DIFF 0 DIFF 0 DIFF 0 DIFF 0 LS 0 LS 1 LS 9 LS 8 LS 8 LS 8 LS 34 SS 0 SS 1 SS 0 SS 1 SS 0 SS 0 SS 2 DIFF 1 DIFF 0 DIFF 2 DIFF 2 DIFF 0 DIFF 0 DIFF 5 LS 0 LS 2 LS 1 LS 1 LS 0 LS 0 LS 4 SS 5 SS 6 SS 3 SS 5 SS 0 SS 2 SS 21 DIFF 13 Totals LS 302 SS 34
32 Summary: Spike Results Band Amazon Pacific Antarctica Greenland Sahara Saudi Totals DIFF 10 DIFF 9 DIFF 10 DIFF 10 DIFF 9 DIFF 10 DIFF 58 LS 0 LS 1 LS 0 LS 0 LS 0 LS 0 LS 1 SS 0 SS 0 SS 0 SS 0 SS 0 SS 0 SS 0 DIFF 10 DIFF 10 DIFF 10 DIFF 10 DIFF 8 DIFF 10 DIFF 58 LS 0 LS 0 LS 0 LS 0 LS 1 LS 0 LS 1 SS 0 SS 0 SS 0 SS 0 SS 0 SS 0 SS 0 DIFF 3 DIFF 4 DIFF 9 DIFF 9 DIFF 3 DIFF 7 DIFF 35 LS 2 LS 3 LS 0 LS 0 LS 3 LS 1 LS 9 SS 1 SS 2 SS 0 SS 1 SS 3 SS 2 SS 9 DIFF 0 DIFF 0 DIFF 1 DIFF 4 DIFF 1 DIFF 2 DIFF 8 LS 3 LS 8 LS 0 LS 1 LS 5 LS 1 LS 18 SS 2 SS 2 SS 4 SS 5 SS 3 SS 5 SS 21 DIFF 2 DIFF 2 DIFF 1 DIFF 0 DIFF 0 DIFF 2 DIFF 7 LS 1 LS 3 LS 2 LS 0 LS 3 LS 3 LS 12 SS 1 SS 1 SS 1 SS 7 SS 5 SS 2 SS 17 DIFF 0 DIFF 0 DIFF 3 DIFF 4 DIFF 3 DIFF 0 DIFF 10 LS 4 LS 1 LS 3 LS 0 LS 0 LS 2 LS 10 SS 4 SS 2 SS 1 SS 5 SS 5 SS 7 SS 24 DIFF 1 DIFF 2 DIFF 2 DIFF 3 DIFF 2 DIFF 1 DIFF 11 LS 5 LS 1 LS 3 LS 0 LS 3 LS 2 LS 14 SS 2 SS 2 SS 2 SS 4 SS 5 SS 7 SS 22 DIFF 1 DIFF 1 DIFF 3 DIFF 4 DIFF 0 DIFF 0 DIFF 9 LS 0 LS 0 LS 2 LS 3 LS 0 LS 0 LS 5 SS 4 SS 4 SS 2 SS 2 SS 5 SS 7 SS 24 DIFF 196 Totals LS 70 SS 117
33 Conclusions All three methods work well Diffuser, Lifetime Statistics, and Side Slither Statistically significant differences exist between the mean striping levels of the three methods Significant differences are extremely small due to the large number of detectors Lifetime Statistics generally has the smallest values, although this is somewhat wavelength dependent Large striping metric spikes, which generally indicate visual stripes, are present for all three methods Spikes in Diffuser method most prevalent at short wavelengths Side Slither striping spikes exist, however many appear to be induced by processing error Lifetime Statistics approach generates substantially fewer spikes Both data driven methods, Lifetime Statistics and Side Slither, produce results equivalent to or better than Diffuser method Suggests that these methods can readily be a backup to onboard methods However, each has a significant requirement: Lifetime statistics method requires developing a database of information Side Slither requires a maneuver that may not be possible for some systems and impacts operational imaging Lifetime Statistics appears to outperform Side Slither; however, additional investigation needed 33 to resolve this comparison
Algebra I Module 2 Lessons 1 19
 Eureka Math 2015 2016 Algebra I Module 2 Lessons 1 19 Eureka Math, Published by the non-profit Great Minds. Copyright 2015 Great Minds. No part of this work may be reproduced, distributed, modified, sold,
PACS. Dark Current of Ge:Ga detectors from FM-ILT. J. Schreiber 1, U. Klaas 1, H. Dannerbauer 1, M. Nielbock 1, J. Bouwman 1.
 PACS Test Analysis Report FM-ILT Page 1 Dark Current of Ge:Ga detectors from FM-ILT J. Schreiber 1, U. Klaas 1, H. Dannerbauer 1, M. Nielbock 1, J. Bouwman 1 1 Max-Planck-Institut für Astronomie, Königstuhl
Normalization Methods for Two-Color Microarray Data
 Normalization Methods for Two-Color Microarray Data 1/13/2009 Copyright 2009 Dan Nettleton What is Normalization? Normalization describes the process of removing (or minimizing) non-biological variation
Results of the June 2000 NICMOS+NCS EMI Test
 Results of the June 2 NICMOS+NCS EMI Test S. T. Holfeltz & Torsten Böker September 28, 2 ABSTRACT We summarize the findings of the NICMOS+NCS EMI Tests conducted at Goddard Space Flight Center in June
Restoration of Hyperspectral Push-Broom Scanner Data
 Restoration of Hyperspectral Push-Broom Scanner Data Rasmus Larsen, Allan Aasbjerg Nielsen & Knut Conradsen Department of Mathematical Modelling, Technical University of Denmark ABSTRACT: Several effects
FPA (Focal Plane Array) Characterization set up (CamIRa) Standard Operating Procedure
 Characterization set up (CamIRa) Standard Operating Procedure") FPA (Focal Plane Array) Characterization set up (CamIRa) Standard Operating Procedure FACULTY IN-CHARGE Prof. Subhananda Chakrabarti (IITB) SYSTEM OWNER Hemant Ghadi (ghadihemant16@gmail.com) 05 July 2013
FPA (Focal Plane Array) Characterization set up (CamIRa) Standard Operating Procedure FACULTY IN-CHARGE Prof. Subhananda Chakrabarti (IITB) SYSTEM OWNER Hemant Ghadi (ghadihemant16@gmail.com) 05 July 2013
Results of Vibration Study for LCLS-II Construction in FEE, Hutch 3 LODCM and M3H 1
 LCLS-TN-12-4 Results of Vibration Study for LCLS-II Construction in FEE, Hutch 3 LODCM and M3H 1 Georg Gassner SLAC August 30, 2012 Abstract To study the influence of LCLS-II construction on the stability
EDDY CURRENT IMAGE PROCESSING FOR CRACK SIZE CHARACTERIZATION
 EDDY CURRENT MAGE PROCESSNG FOR CRACK SZE CHARACTERZATON R.O. McCary General Electric Co., Corporate Research and Development P. 0. Box 8 Schenectady, N. Y. 12309 NTRODUCTON Estimation of crack length
Sodern recent development in the design and verification of the passive polarization scramblers for space applications
 Sodern recent development in the design and verification of the passive polarization scramblers for space applications M. Richert, G. Dubroca, D. Genestier, K. Ravel, M. Forget, J. Caron and J.L. Bézy
Signal Stability Analyser
 Signal Stability Analyser o Real Time Phase or Frequency Display o Real Time Data, Allan Variance and Phase Noise Plots o 1MHz to 65MHz medium resolution (12.5ps) o 5MHz and 10MHz high resolution (50fs)
Nearest-neighbor and Bilinear Resampling Factor Estimation to Detect Blockiness or Blurriness of an Image*
 Nearest-neighbor and Bilinear Resampling Factor Estimation to Detect Blockiness or Blurriness of an Image* Ariawan Suwendi Prof. Jan P. Allebach Purdue University - West Lafayette, IN *Research supported
Chapter 5. Describing Distributions Numerically. Finding the Center: The Median. Spread: Home on the Range. Finding the Center: The Median (cont.
 Chapter 5 Describing Distributions Numerically Copyright 2007 Pearson Education, Inc. Publishing as Pearson Addison-Wesley Copyright 2007 Pearson Education, Inc. Publishing as Pearson Addison-Wesley Slide
Cycle-7 MAMA Pulse height distribution stability: Fold Analysis Measurement
 STIS Instrument Science Report, STIS 98-02R Cycle-7 MAMA Pulse height distribution stability: Fold Analysis Measurement Harry Ferguson, Mark Clampin and Vic Argabright October 26, 1998 ABSTRACT We describe
Sample Analysis Design. Element2 - Basic Software Concepts (cont d)
") Sample Analysis Design Element2 - Basic Software Concepts (cont d) Samples per Peak In order to establish a minimum level of precision, the ion signal (peak) must be measured several times during the scan
Sample Analysis Design Element2 - Basic Software Concepts (cont d) Samples per Peak In order to establish a minimum level of precision, the ion signal (peak) must be measured several times during the scan
Laser Beam Analyser Laser Diagnos c System. If you can measure it, you can control it!
 Laser Beam Analyser Laser Diagnos c System If you can measure it, you can control it! Introduc on to Laser Beam Analysis In industrial -, medical - and laboratory applications using CO 2 and YAG lasers,
Python Quick-Look Utilities for Ground WFC3 Images
 Instrument Science Report WFC3 2008-002 Python Quick-Look Utilities for Ground WFC3 Images A.R. Martel January 25, 2008 ABSTRACT A Python module to process and manipulate ground WFC3 UVIS and IR images
CONTENTS 1. LOGOTYPE 2. BRAND IDENTITY FINAL COMMENTS Concept 1.2. Structure & proportions Using the logotype
 www.syno-int.com BRAND GUIDELINES CONTENTS 1. LOGOTYPE 4 1.1. Concept 4 1.2. Structure & proportions 6 1.3. Using the logotype 8 1.4. Versions 10 1.5. Usability on different backgrounds 12 1.6. Usability
LCD and Plasma display technologies are promising solutions for large-format
 Chapter 4 4. LCD and Plasma Display Characterization 4. Overview LCD and Plasma display technologies are promising solutions for large-format color displays. As these devices become more popular, display
Reconstruction of Ca 2+ dynamics from low frame rate Ca 2+ imaging data CS229 final project. Submitted by: Limor Bursztyn
 Reconstruction of Ca 2+ dynamics from low frame rate Ca 2+ imaging data CS229 final project. Submitted by: Limor Bursztyn Introduction Active neurons communicate by action potential firing (spikes), accompanied
DRAFT. Proposal to modify International Standard IEC
 Imaging & Color Science Research & Product Development 2528 Waunona Way, Madison, WI 53713 (608) 222-0378 www.lumita.com Proposal to modify International Standard IEC 61947-1 Electronic projection Measurement
Supplemental Material: Color Compatibility From Large Datasets
 Supplemental Material: Color Compatibility From Large Datasets Peter O Donovan, Aseem Agarwala, and Aaron Hertzmann Project URL: www.dgp.toronto.edu/ donovan/color/ 1 Unmixing color preferences In the
ON THE INTERPOLATION OF ULTRASONIC GUIDED WAVE SIGNALS
 ON THE INTERPOLATION OF ULTRASONIC GUIDED WAVE SIGNALS Jennifer E. Michaels 1, Ren-Jean Liou 2, Jason P. Zutty 1, and Thomas E. Michaels 1 1 School of Electrical & Computer Engineering, Georgia Institute
Volume Trigger Proposal for the 2011 Season for horizontal low Energy events
 October 22, 2010 IceCube Filter Proposal Document Name: M. Danninger Email: danning@fysik.su.se Physics WG: WIMPs Physics WG Leader: Carlos de los Heroscph@fysast.uu.se Summary Volume Trigger Proposal
Connection for filtered air
 BeamWatch Non-contact, Focus Spot Size and Position monitor for high power YAG, Diode and Fiber lasers Instantly measure focus spot size Dynamically measure focal plane location during start-up From 1kW
Readout techniques for drift and low frequency noise rejection in infrared arrays
 Readout techniques for drift and low frequency noise rejection in infrared arrays European Southern Observatory Finger, G., Dorn, R.J, Hoffman, A.W., Mehrgan, H., Meyer, M., Moorwood, A.F.M., Stegmeier,
Brand Style Guide January 2018
 Brand Style Guide January 2018 Introduction Keeping a well-rounded and consistent brand is crucial in an industry filled with many logos and brands with similar graphics and colors. The brand elements
Beam test of the QMB6 calibration board and HBU0 prototype
 Beam test of the QMB6 calibration board and HBU0 prototype J. Cvach 1, J. Kvasnička 1,2, I. Polák 1, J. Zálešák 1 May 23, 2011 Abstract We report about the performance of the HBU0 board and the optical
User Manual OVP Raman
 Version 6 User Manual OVP Raman 2006 BRUKER OPTIK GmbH, Rudolf-Plank-Straße 27, D-76275 Ettlingen, www.brukeroptics.com All rights reserved. No part of this manual may be reproduced or transmitted in any
ST10XME Power Extension Cable Test
 ST10XME Power Extension Cable Test Gert Gottschalk May 2005 1. Mechanical Very stable cable. The connection to the Camera and to the power supply cable is very snug. There is no indication that slight
STAT 113: Statistics and Society Ellen Gundlach, Purdue University. (Chapters refer to Moore and Notz, Statistics: Concepts and Controversies, 8e)
") STAT 113: Statistics and Society Ellen Gundlach, Purdue University (Chapters refer to Moore and Notz, Statistics: Concepts and Controversies, 8e) Learning Objectives for Exam 1: Unit 1, Part 1: Population
STAT 113: Statistics and Society Ellen Gundlach, Purdue University (Chapters refer to Moore and Notz, Statistics: Concepts and Controversies, 8e) Learning Objectives for Exam 1: Unit 1, Part 1: Population
Video Signals and Circuits Part 2
 Video Signals and Circuits Part 2 Bill Sheets K2MQJ Rudy Graf KA2CWL In the first part of this article the basic signal structure of a TV signal was discussed, and how a color video signal is structured.
The Choice of Sampling Frequency and Product Acceptance Criteria to Assure Content Uniformity for Continuous Manufacturing Processes
 The Choice of Sampling Frequency and Product Acceptance Criteria to Assure Content Uniformity for Continuous Manufacturing Processes Authors Tim Kramer Sal Garcia Jeff Hofer Xiaoyu Zhang Ian Leavesley
The Lecture Contains: Frequency Response of the Human Visual System: Temporal Vision: Consequences of persistence of vision: Objectives_template
 The Lecture Contains: Frequency Response of the Human Visual System: Temporal Vision: Consequences of persistence of vision: file:///d /...se%20(ganesh%20rana)/my%20course_ganesh%20rana/prof.%20sumana%20gupta/final%20dvsp/lecture8/8_1.htm[12/31/2015
The Inframetrics 760 airborne thermal infrared data
 The Inframetrics 76 airborne thermal infrared data on the ReSeDA experiment Quality assessment and first recalibration of brightness temperature maps Table of Contents 7 Quality assessment and first recalibration
Detecting Medicaid Data Anomalies Using Data Mining Techniques Shenjun Zhu, Qiling Shi, Aran Canes, AdvanceMed Corporation, Nashville, TN
 Paper SDA-04 Detecting Medicaid Data Anomalies Using Data Mining Techniques Shenjun Zhu, Qiling Shi, Aran Canes, AdvanceMed Corporation, Nashville, TN ABSTRACT The purpose of this study is to use statistical
NAA ENHANCING THE QUALITY OF MARKING PROJECT: THE EFFECT OF SAMPLE SIZE ON INCREASED PRECISION IN DETECTING ERRANT MARKING
 NAA ENHANCING THE QUALITY OF MARKING PROJECT: THE EFFECT OF SAMPLE SIZE ON INCREASED PRECISION IN DETECTING ERRANT MARKING Mudhaffar Al-Bayatti and Ben Jones February 00 This report was commissioned by
ANALYSING DIFFERENCES BETWEEN THE INPUT IMPEDANCES OF FIVE CLARINETS OF DIFFERENT MAKES
 ANALYSING DIFFERENCES BETWEEN THE INPUT IMPEDANCES OF FIVE CLARINETS OF DIFFERENT MAKES P Kowal Acoustics Research Group, Open University D Sharp Acoustics Research Group, Open University S Taherzadeh
Visual Encoding Design
 CSE 442 - Data Visualization Visual Encoding Design Jeffrey Heer University of Washington A Design Space of Visual Encodings Mapping Data to Visual Variables Assign data fields (e.g., with N, O, Q types)
Phantom Test Guidance for Use of the Small MRI Phantom for the MRI Accreditation Program
 Phantom Test Guidance for Use of the Small MRI Phantom for the MRI Accreditation Program 1 Contents 0.0 INTRODUCTION 4 0.1 Overview and Purpose 4 0.2 The Phantom 4 0.3 The Required Images 5 0.4 The Image
ISOMET. Compensation look-up-table (LUT) and How to Generate. Isomet: Contents:
 and How to Generate. Isomet: Contents:") Compensation look-up-table (LUT) and How to Generate Contents: Description Background theory Basic LUT pg 2 Creating a LUT pg 3 Using the LUT pg 7 Comment pg 9 The compensation look-up-table (LUT) contains
Compensation look-up-table (LUT) and How to Generate Contents: Description Background theory Basic LUT pg 2 Creating a LUT pg 3 Using the LUT pg 7 Comment pg 9 The compensation look-up-table (LUT) contains
Objective Video Quality Assessment of Direct Recording and Datavideo HDR-40 Recording System
 JAICT, Journal of Applied Information and Communication Technologies Vol., No., 206 Objective Video Quality Assessment of Direct Recording and Datavideo HDR-40 Recording System Nofia Andreana, Arif Nursyahid
LVM LASER VALVE MOTION measurement system LASER-BASED TECHNOLOGY. SIMULTANEOUS, REAL-TIME DISPLACEMENT, VELOCITY and ACCELERATION ANOLOG OUTPUTS
 LVM-4000 LASER VALVE MOTION measurement system OH-1000 LASER VIBROMETER HEAD LASER-BASED TECHNOLOGY SIMULTANEOUS, REAL-TIME DISPLACEMENT, VELOCITY and ACCELERATION ANOLOG OUTPUTS ENGINE HEAD VIBRATION
Murdoch redux. Colorimetry as Linear Algebra. Math of additive mixing. Approaching color mathematically. RGB colors add as vectors
 Murdoch redux Colorimetry as Linear Algebra CS 465 Lecture 23 RGB colors add as vectors so do primary spectra in additive display (CRT, LCD, etc.) Chromaticity: color ratios (r = R/(R+G+B), etc.) color
Evaluating Oscilloscope Mask Testing for Six Sigma Quality Standards
 Evaluating Oscilloscope Mask Testing for Six Sigma Quality Standards Application Note Introduction Engineers use oscilloscopes to measure and evaluate a variety of signals from a range of sources. Oscilloscopes
Tech Paper. HMI Display Readability During Sinusoidal Vibration
 Tech Paper HMI Display Readability During Sinusoidal Vibration HMI Display Readability During Sinusoidal Vibration Abhilash Marthi Somashankar, Paul Weindorf Visteon Corporation, Michigan, USA James Krier,
1 Introduction Steganography and Steganalysis as Empirical Sciences Objective and Approach Outline... 4
 Contents 1 Introduction... 1 1.1 Steganography and Steganalysis as Empirical Sciences... 1 1.2 Objective and Approach... 2 1.3 Outline... 4 Part I Background and Advances in Theory 2 Principles of Modern
3/2/2016. Medical Display Performance and Evaluation. Objectives. Outline
 Medical Display Performance and Evaluation Mike Silosky, MS University of Colorado, School of Medicine Dept. of Radiology 1 Objectives Review display function, QA metrics, procedures, and guidance provided
Introduction. Edge Enhancement (SEE( Advantages of Scalable SEE) Lijun Yin. Scalable Enhancement and Optimization. Case Study:
 Lijun Yin. Scalable Enhancement and Optimization. Case Study:") Case Study: Scalable Edge Enhancement Introduction Edge enhancement is a post processing for displaying radiologic images on the monitor to achieve as good visual quality as the film printing does. Edges
Case Study: Scalable Edge Enhancement Introduction Edge enhancement is a post processing for displaying radiologic images on the monitor to achieve as good visual quality as the film printing does. Edges
MODE FIELD DIAMETER AND EFFECTIVE AREA MEASUREMENT OF DISPERSION COMPENSATION OPTICAL DEVICES
 MODE FIELD DIAMETER AND EFFECTIVE AREA MEASUREMENT OF DISPERSION COMPENSATION OPTICAL DEVICES Hale R. Farley, Jeffrey L. Guttman, Razvan Chirita and Carmen D. Pâlsan Photon inc. 6860 Santa Teresa Blvd
Release Year Prediction for Songs
 Release Year Prediction for Songs [CSE 258 Assignment 2] Ruyu Tan University of California San Diego PID: A53099216 rut003@ucsd.edu Jiaying Liu University of California San Diego PID: A53107720 jil672@ucsd.edu
BEAMAGE 3.0 KEY FEATURES BEAM DIAGNOSTICS PRELIMINARY AVAILABLE MODEL MAIN FUNCTIONS. CMOS Beam Profiling Camera
 PRELIMINARY POWER DETECTORS ENERGY DETECTORS MONITORS SPECIAL PRODUCTS OEM DETECTORS THZ DETECTORS PHOTO DETECTORS HIGH POWER DETECTORS CMOS Beam Profiling Camera AVAILABLE MODEL Beamage 3.0 (⅔ in CMOS
Achieving More Efficient Data Review with OpenLAB CDS
 Achieving More Efficient Data Review with OpenLAB CDS Technical Note Introduction Separations have enjoyed major advances that have significantly reduced chromatographic run times. Ultra high performance
Chapter 3. Averages and Variation
 Chapter 3 Averages and Variation Understandable Statistics Ninth Edition By Brase and Brase Prepared by Yixun Shi Bloomsburg University of Pennsylvania Measures of Central Tendency We use the term average
Large photocathode 20-inch PMT testing methods for the JUNO experiment
 Large photocathode 20-inch PMT testing methods for the JUNO experiment N. Anfimov a on behalf of the JUNO collaboration. a Joint Institute for Nuclear Research, 141980, 6 Joliot-Curie, Dubna, Russian Federation
DLP Discovery Reliability Application Note
 Data Sheet TI DN 2510330 Rev A March 2009 DLP Discovery Reliability Application Note May not be reproduced without permission from Texas Instruments Incorporated IMPORTANT NOTICE BEFORE USING TECHNICAL
Color measurement and calibration of professional display devices
 White Paper Color measurement and calibration of professional display devices Abstract: With the advance of display technologies using LED light sources, the problems of color consistency, accuracy and
RFI Mitigation and Burst Detection with a Digital Receiver RFI2004
 RFI Mitigation and Burst Detection with a Digital Receiver RFI2004 July 16-18, 2004 Cedric Dumez-Viou1,4, Andrée Coffre4,Pierre Colom2, Laurent Denis4, Alain Lecacheux2, Jean-Michel Martin3, Philippe Ravier1,
GMOS CCD Upgrade Options S. Kleinman, J. Jensen 26Sep08
 GMOS CCD Upgrade Options S. Kleinman, J. Jensen 26Sep08 Background We are planning to upgrade the scientific capability of GMOS-N by upgrading its roughly 10 year old E2V CCDs to newer CCDs with enhanced
Atlas Pixel Replacement/Upgrade. Measurements on 3D sensors
 Atlas Pixel Replacement/Upgrade and Measurements on 3D sensors Forskerskole 2007 by E. Bolle erlend.bolle@fys.uio.no Outline Sensors for Atlas pixel b-layer replacement/upgrade UiO activities CERN 3D test
A STATISTICAL VIEW ON THE EXPRESSIVE TIMING OF PIANO ROLLED CHORDS
 A STATISTICAL VIEW ON THE EXPRESSIVE TIMING OF PIANO ROLLED CHORDS Mutian Fu 1 Guangyu Xia 2 Roger Dannenberg 2 Larry Wasserman 2 1 School of Music, Carnegie Mellon University, USA 2 School of Computer
Concept of Operations (CONOPS)
") PRODUCT 0-6873-P1 TxDOT PROJECT NUMBER 0-6873 Concept of Operations (CONOPS) Jorge A. Prozzi Christian Claudel Andre Smit Praveen Pasupathy Hao Liu Ambika Verma June 2016; Published March 2017 http://library.ctr.utexas.edu/ctr-publications/0-6873-p1.pdf
PRODUCT 0-6873-P1 TxDOT PROJECT NUMBER 0-6873 Concept of Operations (CONOPS) Jorge A. Prozzi Christian Claudel Andre Smit Praveen Pasupathy Hao Liu Ambika Verma June 2016; Published March 2017 http://library.ctr.utexas.edu/ctr-publications/0-6873-p1.pdf
Create Your SAMPLE. Penmanship Pages! Featuring: Abeka Manuscript Font. By Sheri Graham
 Create Your Own Penmanship Pages! SAMPLE Featuring: Abeka Manuscript Font By Sheri Graham Create Your Own Penmanship Pages! Featuring: Abeka Manuscript Font By: Sheri Graham Published in the United States
Blueline, Linefree, Accuracy Ratio, & Moving Absolute Mean Ratio Charts
 INTRODUCTION This instruction manual describes for users of the Excel Standard Celeration Template(s) the features of each page or worksheet in the template, allowing the user to set up and generate charts
However, in studies of expressive timing, the aim is to investigate production rather than perception of timing, that is, independently of the listene
 Beat Extraction from Expressive Musical Performances Simon Dixon, Werner Goebl and Emilios Cambouropoulos Austrian Research Institute for Artificial Intelligence, Schottengasse 3, A-1010 Vienna, Austria.
Evaluation of ALICE electromagnetic calorimeter jet event trigger performance for LHC-Run2 by simulation
 Evaluation of ALICE electromagnetic calorimeter jet event trigger performance for LHC-Run2 by simulation Pure and Applied Sciences University of Tsukuba Ritsuya Hosokawa,Tatsuya Chujo,Hiroki Yokoyama for
Other funding sources. Amount requested/awarded: $200,000 This is matching funding per the CASC SCRI project
 FINAL PROJECT REPORT Project Title: Robotic scout for tree fruit PI: Tony Koselka Organization: Vision Robotics Corp Telephone: (858) 523-0857, ext 1# Email: tkoselka@visionrobotics.com Address: 11722
Common assumptions in color characterization of projectors
 Common assumptions in color characterization of projectors Arne Magnus Bakke 1, Jean-Baptiste Thomas 12, and Jérémie Gerhardt 3 1 Gjøvik university College, The Norwegian color research laboratory, Gjøvik,
Measuring Variability for Skewed Distributions
 Measuring Variability for Skewed Distributions Skewed Data and its Measure of Center Consider the following scenario. A television game show, Fact or Fiction, was canceled after nine shows. Many people
B I O E N / Biological Signals & Data Acquisition
 B I O E N 4 6 8 / 5 6 8 Lectures 1-2 Analog to Conversion Binary numbers Biological Signals & Data Acquisition In order to extract the information that may be crucial to understand a particular biological
The Relationship Between Movie Theatre Attendance and Streaming Behavior. Survey insights. April 24, 2018
 The Relationship Between Movie Theatre Attendance and Streaming Behavior Survey insights April 24, 2018 Overview I. About this study II. III. IV. Movie theatre attendance and streaming consumption Quadrant
University of Bristol - Explore Bristol Research. Peer reviewed version. Link to published version (if available): /ICIP.2016.
: /ICIP.2016.") Mercer Moss, F., Zhang, F., Baddeley, R. J., & Bull, D. R. (2017). What's on TV: A large scale quantitative characterisation of modern broadcast video content. In 2016 IEEE International Conference on
Mercer Moss, F., Zhang, F., Baddeley, R. J., & Bull, D. R. (2017). What's on TV: A large scale quantitative characterisation of modern broadcast video content. In 2016 IEEE International Conference on
A Real Time Infrared Imaging System Based on DSP & FPGA
 A Real Time Infrared Imaging ystem Based on DP & FPGA Babak Zamanlooy, Vahid Hamiati Vaghef, attar Mirzakuchaki, Ali hojaee Bakhtiari, and Reza Ebrahimi Atani Department of Electrical Engineering Iran
Spectroscopy on Thick HgI 2 Detectors: A Comparison Between Planar and Pixelated Electrodes
 1220 IEEE TRANSACTIONS ON NUCLEAR SCIENCE, OL. 50, NO. 4, AUGUST 2003 Spectroscopy on Thick HgI 2 Detectors: A Comparison Between Planar and Pixelated Electrodes James E. Baciak, Student Member, IEEE,
Electrospray-MS Charge Deconvolutions without Compromise an Enhanced Data Reconstruction Algorithm utilising Variable Peak Modelling
 Electrospray-MS Charge Deconvolutions without Compromise an Enhanced Data Reconstruction Algorithm utilising Variable Peak Modelling Overview A.Ferrige1, S.Ray1, R.Alecio1, S.Ye2 and K.Waddell2 1 PPL,
Bootstrap Methods in Regression Questions Have you had a chance to try any of this? Any of the review questions?
 ICPSR Blalock Lectures, 2003 Bootstrap Resampling Robert Stine Lecture 3 Bootstrap Methods in Regression Questions Have you had a chance to try any of this? Any of the review questions? Getting class notes
MTS/T-BERD 8000 Platform Optical Spectrum Analyzer Modules
 COMMUNICATIONS TEST & MEASUREMENT SOLUTIONS MTS/T-BERD 8000 Platform Optical Spectrum Analyzer Modules MTS/T-BERD platform Applications Provisioning and maintenance of ROADM networks Commissioning of DWDM
PICK THE RIGHT TEAM AND MAKE A BLOCKBUSTER A SOCIAL ANALYSIS THROUGH MOVIE HISTORY
 PICK THE RIGHT TEAM AND MAKE A BLOCKBUSTER A SOCIAL ANALYSIS THROUGH MOVIE HISTORY THE CHALLENGE: TO UNDERSTAND HOW TEAMS CAN WORK BETTER SOCIAL NETWORK + MACHINE LEARNING TO THE RESCUE Previous research:
Varying Degrees of Difficulty in Melodic Dictation Examples According to Intervallic Content
 University of Tennessee, Knoxville Trace: Tennessee Research and Creative Exchange Masters Theses Graduate School 8-2012 Varying Degrees of Difficulty in Melodic Dictation Examples According to Intervallic
Marc I. Johnson, Texture Technologies Corp. 6 Patton Drive, Hamilton, MA Tel
 Abstract Novel Automated Method for Analyzing Peel Adhesion Ben Senning, Territory Manager, Texture Technologies Corp, Hamilton, MA Marc Johnson, President, Texture Technologies Corp, Hamilton, MA Most
DELTA MODULATION AND DPCM CODING OF COLOR SIGNALS
 DELTA MODULATION AND DPCM CODING OF COLOR SIGNALS Item Type text; Proceedings Authors Habibi, A. Publisher International Foundation for Telemetering Journal International Telemetering Conference Proceedings
Lecture 2 Video Formation and Representation
 2013 Spring Term 1 Lecture 2 Video Formation and Representation Wen-Hsiao Peng ( 彭文孝 ) Multimedia Architecture and Processing Lab (MAPL) Department of Computer Science National Chiao Tung University 1
Modulation transfer function of a liquid crystal spatial light modulator
 1 November 1999 Ž. Optics Communications 170 1999 221 227 www.elsevier.comrlocateroptcom Modulation transfer function of a liquid crystal spatial light modulator Mei-Li Hsieh a, Ken Y. Hsu a,), Eung-Gi
DISTRIBUTION STATEMENT A 7001Ö
 Serial Number 09/678.881 Filing Date 4 October 2000 Inventor Robert C. Higgins NOTICE The above identified patent application is available for licensing. Requests for information should be addressed to:
Removing the Pattern Noise from all STIS Side-2 CCD data
 The 2010 STScI Calibration Workshop Space Telescope Science Institute, 2010 Susana Deustua and Cristina Oliveira, eds. Removing the Pattern Noise from all STIS Side-2 CCD data Rolf A. Jansen, Rogier Windhorst,
Paired plot designs experience and recommendations for in field product evaluation at Syngenta
 Paired plot designs experience and recommendations for in field product evaluation at Syngenta 1. What are paired plot designs? 2. Analysis and reporting of paired plot designs 3. Case study 1 : analysis
Chapter 27. Inferences for Regression. Remembering Regression. An Example: Body Fat and Waist Size. Remembering Regression (cont.)
") Chapter 27 Inferences for Regression Copyright 2007 Pearson Education, Inc. Publishing as Pearson Addison-Wesley Slide 27-1 Copyright 2007 Pearson Education, Inc. Publishing as Pearson Addison-Wesley An
Chapter 27 Inferences for Regression Copyright 2007 Pearson Education, Inc. Publishing as Pearson Addison-Wesley Slide 27-1 Copyright 2007 Pearson Education, Inc. Publishing as Pearson Addison-Wesley An
AP Statistics Sampling. Sampling Exercise (adapted from a document from the NCSSM Leadership Institute, July 2000).
.") AP Statistics Sampling Name Sampling Exercise (adapted from a document from the NCSSM Leadership Institute, July 2000). Problem: A farmer has just cleared a field for corn that can be divided into 100
AP Statistics Sampling Name Sampling Exercise (adapted from a document from the NCSSM Leadership Institute, July 2000). Problem: A farmer has just cleared a field for corn that can be divided into 100
Tutorial on Technical and Performance Benefits of AD719x Family
 The World Leader in High Performance Signal Processing Solutions Tutorial on Technical and Performance Benefits of AD719x Family AD7190, AD7191, AD7192, AD7193, AD7194, AD7195 This slide set focuses on
DCI Requirements Image - Dynamics
 DCI Requirements Image - Dynamics Matt Cowan Entertainment Technology Consultants www.etconsult.com Gamma 2.6 12 bit Luminance Coding Black level coding Post Production Implications Measurement Processes
Objective video quality measurement techniques for broadcasting applications using HDTV in the presence of a reduced reference signal
 Recommendation ITU-R BT.1908 (01/2012) Objective video quality measurement techniques for broadcasting applications using HDTV in the presence of a reduced reference signal BT Series Broadcasting service
Does the number of users rating the movie accurately predict the average user rating?
 STAT 503 Assignment 1: Movie Ratings SOLUTION NOTES These are my suggestions on how to analyze this data and organize the results. I ve given more questions below than I can address in my analysis, so
RF Safety Surveys At Broadcast Sites: A Basic Guide
 ENGINEERING EXTRA REPRINTED FROM FEB. 22, 2012 The News Source for Radio Managers and Engineers RF Safety Surveys At Broadcast Sites: A Basic Guide The Process of Measuring RF Safety Compliance Often Is
Semi-automated extraction of expressive performance information from acoustic recordings of piano music. Andrew Earis
 Semi-automated extraction of expressive performance information from acoustic recordings of piano music Andrew Earis Outline Parameters of expressive piano performance Scientific techniques: Fourier transform
Jeffrey L. Furman Boston University. Scott Stern Northwestern University and NBER. March 2004
 A PENNY FOR YOUR QUOTES? THE IMPACT OF BIOLOGICAL RESOURCE CENTERS ON LIFE SCIENCES RESEARCH Jeffrey L. Furman Boston University Scott Stern Northwestern University and NBER March 2004 Chapter 4 in Biological
BitWise (V2.1 and later) includes features for determining AP240 settings and measuring the Single Ion Area.
 includes features for determining AP240 settings and measuring the Single Ion Area.") BitWise. Instructions for New Features in ToF-AMS DAQ V2.1 Prepared by Joel Kimmel University of Colorado at Boulder & Aerodyne Research Inc. Last Revised 15-Jun-07 BitWise (V2.1 and later) includes features
BitWise. Instructions for New Features in ToF-AMS DAQ V2.1 Prepared by Joel Kimmel University of Colorado at Boulder & Aerodyne Research Inc. Last Revised 15-Jun-07 BitWise (V2.1 and later) includes features
The Relationship Between Movie theater Attendance and Streaming Behavior. Survey Findings. December 2018
 The Relationship Between Movie theater Attendance and Streaming Behavior Survey Findings Overview I. About this study II. III. IV. Movie theater attendance and streaming consumption Quadrant Analysis:
The Effect of Time-Domain Interpolation on Response Spectral Calculations. David M. Boore
 The Effect of Time-Domain Interpolation on Response Spectral Calculations David M. Boore This note confirms Norm Abrahamson s finding that the straight line interpolation between sampled points used in
ISOMET. Compensation look-up-table (LUT) and Scan Uniformity
 and Scan Uniformity") Compensation look-up-table (LUT) and Scan Uniformity The compensation look-up-table (LUT) contains both phase and amplitude data. This is automatically applied to the Image data to maximize diffraction
Compensation look-up-table (LUT) and Scan Uniformity The compensation look-up-table (LUT) contains both phase and amplitude data. This is automatically applied to the Image data to maximize diffraction
Automatic Analysis of Musical Lyrics
 Merrimack College Merrimack ScholarWorks Honors Senior Capstone Projects Honors Program Spring 2018 Automatic Analysis of Musical Lyrics Joanna Gormley Merrimack College, gormleyjo@merrimack.edu Follow
A 5 Hz limit for the detection of temporal synchrony in vision
 A 5 Hz limit for the detection of temporal synchrony in vision Michael Morgan 1 (Applied Vision Research Centre, The City University, London) Eric Castet 2 ( CRNC, CNRS, Marseille) 1 Corresponding Author