Temperature Management Plan and Credit Trading Activities Annual Report
|
|
|
- Job Gibson
- 5 years ago
- Views:
Transcription


1 Temperature Management Plan and Credit Trading Activities 2015 Annual Report
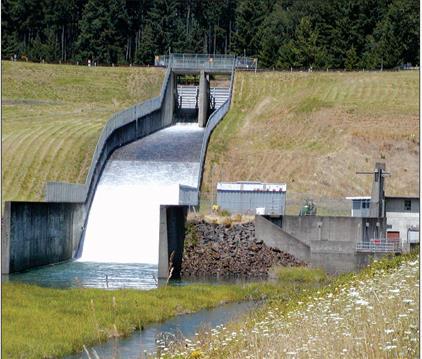
2 1.0 Background Clean Water Services (District) is a special service district that serves the urban portion of Washington County. The District has 12 member cities and owns and operates four wastewater treatment plants in the Tualatin River basin. The wastewater treatment plants and the municipal separate storm sewer system (MS4) are permitted by the Oregon Department of Environmental Quality (DEQ) under the District s watershed-based National Pollutant Discharge Elimination System (NPDES) permit, which was initially issued on February 26, 2004, and reissued on July 27, The District continues to operate under the terms and conditions of the 2005 watershed-based NPDES permit pending DEQ action on its permit renewal application, which was submitted in The watershed-based NPDES permit included stringent thermal load limits for the District s Rock Creek and Durham Advanced Wastewater Treatment Facilities (AWTFs) from the 2001 Temperature Total Maximum Daily Load (TMDL) for the Tualatin River. The District explored several alternatives to meet the thermal load allocations for the two facilities. The District concluded that a technology-based approach, which would require mechanical cooling, was resource intensive and cost prohibitive, and would not improve watershed health. Instead, the District adopted a strategy to improve watershed health by offsetting the thermal load from the Rock Creek and Durham AWTFs with flow augmentation and riparian planting. The District s watershed-based NPDES permit included provisions to develop and implement a Temperature Management Plan (TMP) that would document the District s approach and programs for offsetting the thermal load from the Rock Creek and Durham AWTFs. The Thermal Load Credit Trading Plan, which is included in the District s TMP, specified the methodology for calculating the thermal credits associated with the riparian plantings and flow augmentation. The District s watershed-based NPDES permit allows water quality credit trading for temperature as well as oxygen demanding parameters, such as ammonia and CBOD. Water quality trading for temperature is conducted in accordance with the District s DEQ-approved TMP. The conditions for trading for oxygen demanding parameters are specified in Schedule A.1.a.4 of the watershed-based NPDES permit. Schedule B.3 of the watershed-based NPDES permit requires the District to submit annual reports of its TMP activities and credit trading activities by March 1. This report fulfills the requirements for submitting an annual report for the District s TMP activities and an annual report for the District s credit trading activities TMP Activities The temperature related activities presented in this report are for the period from February 1, 2015, to January 31, This section contains a discussion of the District s flow augmentation and riparian planting activities for the above-referenced period. This section also includes a summary of temperature management measures at the wastewater treatment facilities, recycled water use, and source control activities that impact the thermal load discharged to the river. 2.1 Flow Augmentation Annually the District has 12,618 acre-feet of available stored water in Hagg Lake (Scoggins Reservoir) and 1,654 acre-feet in Barney Reservoir. The District releases stored water during the summer and fall to enhance water quality in the Tualatin River. Stored water releases in July and August form the basis of the flow augmentation credit in the Thermal Load Credit Trading Plan. In 2015, much of the Pacific Northwest experienced an unusually dry spring and warm summer. Notably, precipitation levels for May and June were 27 and 44 percent of normal, respectively. Figure 1 compares the 2015 data and average monthly precipitation data for 1948 through 2014 for the Portland metropolitan area. Figure 2 compares stream flows in the Tualatin River for 2015 to the average stream flow for 2005 to Annual Report 1
3 *KHIO Weather Station, wunderground.com Figure 1. Comparison of 2015 and Average Monthly Preciptation for * for the Portland Metropolitan Area *Oregon Water Resources Department Figure 2. Comparison of 2015 and Average Mean Daily Flow* in the Tualatin River at Farmington The dry spring and summer in 2015 resulted in greatly reduced stream flows in the Tualatin River watershed and impacted the timing of the District s stored water use. The District initiated stored water releases from Scoggins Reservoir on June 9, almost a month earlier than in previous years. The District initiated stored 2015 Annual Report 2
4 water releases from Barney Reservoir on July 15, also several weeks earlier than in previous years. The District also used more of its stored water to maintain minimum flows in the Tualatin River. The District released an average of 51.2 cubic feet per second (cfs) during July and August in 2015 compared to an average of 35.8 cfs released during July and August from 2004 to Riparian Activities The following sections summarize riparian planting activities, riparian maintenance activities, and shade monitoring activities during the reporting period Riparian Planting Activities In 2015, a total of 4.06 stream miles in the Tualatin Basin were planted and enrolled for credit by the District. Table 1 presents the riparian planting projects and the stream length associated with each project. Summary Total Stream Miles: Project 4.06 mi Stream Length (ft) SWCD SWCD SWCD SWCD Tualatin River Farm Bronson Creek Greenway Cedar Creek - Stella Olsen Table 1: 2015 Riparian Planting Projects Project Summaries Appendix A contains a Project Summary for each project credited in Project summaries contain general site information (site location, number of acres, location description, stream length and average width, plant communities, partners, project activities, etc.), a site assessment report, and a summary of thermal credits. Capital Program Riparian planting projects implemented under the District s Capital Program mostly occur on public lands where large scale restoration opportunities are available and multiple water quality and ecological benefits can be achieved. Project activities under this program include securing easements or stewardship agreements with property owners, site preparation activities, invasive species management, re-vegetation, monitoring and maintenance. Additional enhancement activities such as channel reconfiguration, large wood placement, gravel-boulder placement, off-channel habitat creation, and in-stream pond removal are performed on a site-specific basis to improve a broader range of site functions. In 2015, three riparian enhancement projects were undertaken under the District s Capital Program Bronson Creek Greenway- 2135, Cedar Creek, Stella Olsen-1767, and Tualatin River Farm-2168 resulting in 1.78 miles of riparian planting. Landowner Incentive Program The District contracts with the Tualatin Soil and Water Conservation District (SWCD) to provide incentives for enrolling landowners in an enhanced version of the U.S. Department of Agriculture s Conservation Reserve Enhancement Program (ECREP) and Vegetated Buffer Areas for Conservation (VEGBAC) program. The ECREP has provided an opportunity to leverage local and federal programs. This collaboration has greatly increased the acceptance and implementation of restoration programs at the local 2015 Annual Report 3
5 level. Riparian planting projects in the rural areas primarily consist of site preparation, re-vegetation and invasive species management. Four projects were undertaken and a total of 2.28 miles of riparian corridor were planted under the District s Landowner Incentive Program in Riparian Maintenance Activities Site monitoring and maintenance play a critical role in ensuring the success of the riparian planting projects because re-vegetated sites need protection from a variety of threats including invasive species, herbivores, and dry weather. As a result, the District implements a robust maintenance and monitoring program that includes qualitative and quantitative monitoring that are captured in site assessment reports. Qualitative and Quantitative Monitoring The District conducts qualitative and quantitative monitoring at riparian planting projects that are enrolled for thermal credit. Typically, monitoring is conducted during early fall prior to leaf drop. Site assessment reports document site conditions and include site specific management actions. Qualitative monitoring is conducted on an annual basis and is used to assess overall project health and project phase. The District implements a functional component-based assessment process to determine if a riparian planting project is in a transitional, established, or stewardship phase. This assessment approach assists in determining the necessary level of ongoing maintenance needed for riparian planting projects (e.g., inter-planting, seeding, weed control, herbivore protections) and project phase. This assessment methodology is designed to mimic the dynamic nature of riparian planting projects as they mature from initial plantings to stable riparian ecosystems. Quantitative monitoring is conducted biennially and includes information regarding native tree and shrub counts, species composition, density, and riparian structure. Stem densities, one of the parameters monitored, vary within and between projects due to a number of factors. Activity from native and nonnative animals, soil conditions, seasonal inundation, and dynamic stream morphology affect project areas differently. Additionally, variation in stem density reporting is inherent in the random plot monitoring protocol that is utilized. To achieve target stem densities, a number of factors are considered for management and plant mortality is factored into the number of stems that are inter-planted. Data collected during qualitative and quantitative monitoring is used in conjunction with function-based success criteria to gauge the success of a project. Function-based success criteria are developed from appropriate reference site monitoring and data analysis. Success criteria were developed for the following components: species composition (both woody and herbaceous, native and non-native), density (trees and shrubs), structure (overstory, understory, and groundcover), and riparian shade. In order to adequately collect the necessary data, a combination of monitoring methodologies is utilized. Existing monitoring methodologies were reviewed to develop success criteria, including Protocols for Monitoring Habitat Restoration Projects in the Lower Columbia River and Estuary (Roegner et al., 2008), Stream Visual Assessment (U.S. Department of Agriculture s Natural Resources Conservation Service), Habitat Assessment Field Data Sheet (Environmental Protection Agency), and Proper Functioning Condition (U.S. Department of Interior Bureau of Land Management). Site Assessment Reports The District prepares a site assessment report for each site and uses the report to document site conditions, identify management actions taken, and identify proposed actions for the following year. Each site assessment report contains project specific information including project acreage, the initial planting year, the year when thermal credit was taken, and the stream length associated with the project. Site assessment reports also contain information regarding each plant community (e.g., riparian forest, forested wetland, upland forest, scrub-shrub) within a project. This information contains a list of categorized plant species, stem densities, and the phase of each plant community. Site assessment reports for projects credited in 2015 are included in the project summaries in Appendix A. Appendix B contains site assessment reports for earlier projects (i.e., ) for which the District has taken thermal 2015 Annual Report 4

6 credit. With the exceptions noted below, site specific management actions completed in 2015 and recommended for 2016 are also presented in the site assessment reports. In 2015, the District renewed landowner contracts for the SWCD-Brooks and SWCD-McBride projects. For these sites, the site assessment reports in Appendix B reflect monitoring conducted in The landowner contract at the SWCD-Beardsley site is in the process of being renewed and monitoring was conducted at this site in The landowner contract for the SWCD-Garrison project and the SWCD- Lichtner project were not renewed in 2015, and as a result, these projects and the associated 1.51 million kcal/day and 0.32 million kcal/day of thermal credit, respectively, were removed from the District s credit portfolio Shade Monitoring As noted in the previous section, the District conducts annual monitoring to assess plant survival, overall project health, and project phase. In addition, the District collects data to assess shade at riparian projects every five years. The shade monitoring protocol calls for establishing one monitoring point for each 500- foot stream segment of a project with a minimum of three monitoring points per project. At each monitoring point, a combination of photographs and densiometer readings are taken. Photographic monitoring includes both upstream and downstream views. Shade is estimated as densiometer readings of canopy cover mid-channel and/or at each stream bank as determined by specific protocols for stream wadeability, bank incision and accessibility. In 2015, field monitoring of streamside shade was conducted at five project sites. In addition, streamside canopy cover was measured at fourteen project sites using remotely sensed datasets, including aerial photography and LiDAR. Figure 3 presents the field monitoring results at the five sites that were monitored for streamside shade in Figure 3: 2015 Shade Monitoring Results 2015 Annual Report 5

7 All five of the projects that were monitored in 2015 showed good streamside canopy cover. The two projects credited in Rock Creek-Noble Woods and 130-Tualatin River-Eagle Woods at Fern Hill showed a robust streamside canopy cover of 98 and 94%, respectively. Of the five sites that were monitored in 2015, three were previously monitored in Figure 4 presents the results of the field monitoring for streamside canopy in 2010 and 2015 (sites credited in 2005). Figure 4: Shade Monitoring Results for 2005 Projects The field shade monitoring results for the three projects that were credited in 2005 show that all three projects had streamside canopy of 78% or greater. The 124-Willow Creek-Bronson Rd project continued to show a canopy cover near 100% in both 2010 and Two projects the 25-Dawson Creek- Evergreen Blvd project and the 36-Beaverton Creek-Transit Center have shown a significant increase in percent canopy cover between 2010/2011 and These two sites had underperformed for several years and the District s actions to improve canopy cover at these sites have proven effective, demonstrating the importance and effectiveness of the District s monitoring and maintenance program. Site assessment reports for all five projects show that they are functioning well. The site assessment reports, which include site conditions and management actions, can be found in Appendix B. As previously mentioned, in 2015 streamside canopy cover was measured at fourteen project sites using remotely sensed datasets, including aerial photography and LiDAR. The streamside canopy cover was measured within a 10-ft width of the stream channel. Results for 2007 and 2014 LiDAR measurements of streamside canopy cover at the fourteen projects are shown in Figure Annual Report 6
8 Figure 5: Comparison of 2007 and 2014 LiDAR Percent Streamside Canopy Cover In Figure 5, the four projects shown at the top of the plot 2052-SWCD, 116-SWCD, 1906-SWCD, and 2051-SWCD were initially planted and credited in As a result, the 2014 LiDAR data is the only data point available after project implementation. There appears to be be good streamside canopy cover at three of the four project sites. The SWCD-2051 project has not resulted in measureable streamside canopy cover within a 10-ft width of the stream channel as yet. When initially planted in 2010, there was no existing vegetation at the site, and as a result, significant canopy cover was not expected in the first few years. Future shade measurements are expected to yield a higher percentage of canopy cover; additional management actions as noted in the site assessment reports are planned at the site to improve performance and ensure plant establishment. LiDAR measurements at eight of the other ten project sites show a meaningful increase in canopy cover from 2007 to The 1421-Hedges Creek-Upper Marsh project and the 10-Council Creek-Beal Pond project show minimal canopy cover within a 10-ft width of the stream channel. Both of these sites have large ponds and wetland complexes that cover a majority of the site; additionally, these sites have been planted with wetland plant species that do not provide the same level of shade as riparian forest plant species. A project-scale analysis using LiDAR measurements of percent canopy cover show that canopy cover is increasing over the entire site. Appendix B contains site assessment reports for all fourteen projects which include project-specific information about site conditions and management actions. Shade monitoring conducted from identified only six out of 56 projects that did not provide the anticipated shade. The District has taken a number of follow-up actions at these sites since the initial 2015 Annual Report 7
9 planting to improve performance. Appendix C describes the challenges encountered at these sites and the additional management actions that have been taken at each site. As shown in Figure 4, the 36-Beaverton Creek-Transit Center and the 25-Dawson Creek-Evergreen Blvd projects now have good streamside canopy and will be removed from Appendix C in next year s annual report. 2.3 Activities The TMP specifies reuse, treatment facility improvements, and source control activities as methods that could be used to reduce the thermal load discharged by the AWTFs. The following is a summary of the actions taken in each of these areas. The District produces Class A recycled water at both the Rock Creek and Durham AWTFs. Recycled water from the Durham AWTF is used at three golf courses, athletic fields at two public schools, and for on-site irrigation. The District delivered million gallons of recycled water to off-site users during An additional million gallons of recycled water was used on-site at the District s Wastewater Treatment Facilities (WWTFs). Of the million gallons, 75.6 million gallons was directed to the Fernhill Natural Treatment System in Forest Grove to establish and sustain the wetland plants (refer to the 2015 Recycled Water Use Annual Report for additional information). These volumes represent a direct reduction in the thermal load discharged by the District s AWTFs. The District is pursuing treatment facility improvements to reduce the thermal load discharged by the AWTFs. In 2015, the District continued work on the 95-acre Fernhill Natural Treatment System at Forest Grove to treat wastewater from the Forest Grove and Hillsboro WWTFs. Currently, the Forest Grove and Hillsboro WWTFs transfer wastewater through twin 24-inch pipelines to the Rock Creek AWTF for treatment and discharge during the dry season. The District is proposing to provide advanced secondary treatment at the Forest Grove WWTF during the dry season, and then direct the treated wastewater from the Forest Grove and Hillsboro WWTFs through the Fernhill Natural Treatment System for further treatment prior to discharge to the Tualatin River. Temperature modeling predicts substantial cooling across the natural treatment system. Thus, the thermal loads from the Fernhill Natural Treatment System will be substantially lower than current conditions where the Hillsboro and Forest Grove WWTF service area flows are directed to the Rock Creek AWTF for treatment and discharge. Approximately 5 mgd would be treated through the natural treatment system upon start-up and flows are projected to increase to 6.3 mgd for year 2025 conditions. Implementating this project should substantially reduce the overall thermal load being discharged to the Tualatin River. The District is also pursuing capital improvements to further reduce thermal loads discharged from the AWTFs. For example, the District completed a cogeneration project at the Durham AWTF that dissipates excess heat to the atmosphere rather than discharging it to the treatment facility. In the 2014 Temperature Management Plan annual report, the District incorrectly noted that the cogeneration facility at the Rock Creek AWTF was being replaced. Instead, the District modified the operations at the existing cogeneration facility at the Rock Creek AWTF. The District lowered the heating loop temperature set point in the facility s heating system which significantly reduced the amount of heat the engines discharge to the treatment facility. Additional adjustments were made to the heat exchangers and heating loop for the facility s chemical building. Implementing these alternatives has reduced the thermal load to the treatment facilities. The District regulates all significant industrial user discharges into the sanitary sewer system as part of its DEQ-approved industrial pretreatment program. In 2015, there were no significant changes in permitted industrial sources that would have resulted in substantive changes in the thermal loads to the Durham AWTF. The District noted increases in the thermal load at the Rock Creek AWTF and believes that it is due in part to increased flow from existing industrial sources. The District is evaluating thermal loads from significant industrial users to the Rock Creek AWTF this year. Follow up actions will be determined upon completion of this analysis Annual Report 8

10 Annual Report for Credit Trading Activities Schedule D.7.b of the District s watershed-based NPDES permit authorizes water quality credit trading plans for temperature and oxygen demanding parameters. The following sections describe the credit trading activities for oxygen demanding parameters and for temperature. 3.1 Oxygen Demanding Parameters Credit Trading Activities The District s watershed-based NPDES permit authorizes credit trading activities for oxygen demanding parameters, including ammonia and CBOD, between the Rock Creek and Durham AWTFs. The District did not conduct trading for oxygen demanding parameters as allowed by the permit during this reporting period. Figure 6 shows the actual and the allowable discharge loads for oxygen demanding parameters from the Rock Creek and Durham AWTFs. Dry season limits and the trading provisions apply after July 1 or when the flow in the Tualatin River (as measured at Farmington Bridge RM 33.3) is below 250 cfs. In 2015, the allowable and actual oxygen loads were calculated from May onward, when the trading provisions became effective. The allowable and actual oxygen loads are presented until mid-november when the wet season limits became effective. The increase in the allowable oxygen load during August occurred as a result of an increase in the dissolved oxygen in the river which allowed the facilities to operate under Tier 1 conditions. Figure 6: Comparison of Actual vs. Allowable Loads for Oxygen Demanding Parameters 3.2 Temperature Credit Trading Activities A summary of credit trading activities for temperature for the previous year is required by Schedule D.7.b of the watershed-based NPDES permit and includes the following elements: (a) Identification of Trading Baselines; (b) Summary of Actual Loads Discharged; 2015 Annual Report 9
11 (c) Summary of Credit Trades, including credits used to meet baselines, as well as credits generated, purchased, or held but not applied to baseline compliance; (d) Environmental Benefits Summary, describing how the credit trades supported watershed management objectives; and (e) Efficiency Summary, describing how the credit trades supported cost-effective and timely watershed management. The following sections discuss each of these elements Identification of Trading Baselines The trading baseline data for flow augmentation that is used to calculate the allowable thermal loads, thermal loads discharged, and flow augmentation credit is summarized in Appendix D. It includes the following: the daily average effluent flow from the Rock Creek and Durham AWTFs for the period July 1 August 31; the daily average effluent temperature from the Rock Creek and Durham AWTFs for the period July 1 August 31; the daily average Tualatin River flow at the Farmington Bridge (River Mile 33) for the period July 1 August 31; and the daily average flow augmentation rate from Scoggins Reservoir (Hagg Lake) and Barney Reservoir for the period July 1 August 31. The following information is used to determine baseline conditions for calculating riparian shade credits: elevation, stream aspect, wetted width, near stream disturbance zone, and incision; the District also accounts for the existing vegetation and the shade provided by the vegetation. The Shade-a-Lator model is used to determine baseline shade conditions Summary of Actual Loads Discharged The thermal loads for the Rock Creek and Durham AWTFs are based on average daily effluent temperature and effluent flow conditions from July 1 to August 31. This time period is identified as the temperature credit trading period in the watershed-based NPDES permit and corresponds to the time of year when river temperatures are most likely to exceed the temperature criterion. The average effluent flow, average effluent temperature and the excess thermal load discharged from the Rock Creek and Durham AWTFs for 2015 are presented in Table 2. In 2015, the July/August average excess thermal load discharged from the Rock Creek AWTF was 1,113 million kcal/day and the average excess thermal load discharged from the Durham AWTF was 257 million kcal/day. Advanced Wastewater Treatment Facility Data YEAR: 2015 Rock Creek AWTF Durham AWTF Mean RC AWTF flow: 49.0 cfs Mean DM AWTF flow: 24.2 cfs Mean RC effluent temperature: 24.2 C Mean DM effluent temperature: 22.8 C Median river flow u/s RC AWTF: cfs Median river flow u/s DM AWTF: cfs Excess Thermal Load Discharged from RC: 1113 million kcal/d Excess Thermal Load Discharged from DM: 257 million kcal/d Table 2: Excess Thermal Load Discharged from Rock Creek (RC) and Durham (DM) AWTFs (July 1 August 31, 2015) Summary of Credit Generated This section presents the thermal credits generated from flow augmentation and riparian planting Annual Report 10
12 Flow Augmentation Credits Table 3 presents the thermal credits for flow augmentation at the Rock Creek and Durham AWTFs. The average flow augmentation rate from July 1 August 31, 2015 was 51.2 cfs, which resulted in thermal credits from flow augmentation of 780 million kcal/day at the Rock Creek AWTF and thermal credits from flow augmentation of 484 million kcal/day at the Durham AWTF. Flow Augmentation YEAR: 2015 Median Farmington flow: cfs Average thermal Credit for flow aug at RC: 780 million kcal/d Mean flow augmentation: 54.6 cfs Average thermal Credit for flow aug at DM: 484 million kcal/d Table 3: Thermal Credits for Flow Augmentation at the Rock Creek (RC) and Durham (DM) AWTFs in 2015 Riparian Planting Credits Table 4 presents shade credits from riparian plantings. This table presents the stream miles planted, the thermal load blocked by existing vegetation conditions (baseline), the future enhanced vegetation conditions (modeled using a 20-year shade establishment period), the overall thermal load reduction, and the thermal credit for each project. The Shade-a-Lator component of the Heat Source temperature model was used to calculate effective shade and thermal load blocked with baseline riparian vegetation conditions, and effective shade and thermal load blocked for the future enhanced vegetation conditions. The difference between the thermal load blocked with the enhanced conditions and the thermal load blocked with baseline conditions represents the reduction in thermal load (i.e., environmental benefit) associated with the riparian planting project. The District s TMP specifies a 2:1 trading ratio for calculating credit for shade (i.e., the thermal credit for shade is equal to 50% of the environmental benefit). For 2015, the thermal credit from the riparian planting projects was 12 million kcal/day. THERMAL CREDIT FOR SHADE YEAR: 2015 Summary Total Stream Miles: Thermal Credit Received This Year: 4.06 mi 1.2E+07 kcal/d Restoration/Protection Record Project Stream Length (ft) Thermal Load Blocked (Baseline Conditions) (kcal/d) Thermal Load Blocked (Enhanced Conditions) (kcal/d) Thermal Load Reduction (Environmental Benefits) (kcal/d) Thermal Credit Received (kcal/d) Credit per Length (kcal/d/ft) SWCD E E E E SWCD E E E E SWCD E E E E SWCD E E E E Tualatin River Farm E E E E Bronson Creek Greenway E E E E Cedar Creek - Stella Olsen E E E E Table 4: 2015 Riparian Planting Projects and Associated Thermal Credit 4.0 TMP Activities ( ) The following section summarizes the District s TMP activities from the inception of the thermal load trading program in 2004 to the present. Table 5 presents the average flow augmentation rates for July and August, resulting thermal credits from flow augmentation at the Rock Creek and Durham AWTFs, stream miles planted each year, and thermal credits from riparian shade plantings from 2004 to Annual Report 11
13 Permit Mean Flow Augmentation Flow Augmentation Flow Augmentation Stream Miles Riparian Shade Year Rate Credit (Rock Creek) Credit (Durham) Planted Credit Year 1 (2004) million kcal/d 282 million kcal/d million kcal/d Year 2 (2005) million kcal/d 407 million kcal/d million kcal/d Year 3 (2006) million kcal/d 325 million kcal/d million kcal/d Year 4 (2007) million kcal/d 329 million kcal/d million kcal/d Year 5 (2008) million kcal/d 394 million kcal/d million kcal/d Year 6 (2009) million kcal/d 337 million kcal/d million kcal/d Year 7 (2010) million kcal/d 357 million kcal/d million kcal/d Year 8 (2011) million kcal/d 416 million kcal/d million kcal/d Year 9 (2012) million kcal/d 537 million kcal/d million kcal/d Year 10 (2013) million kcal/d 454 million kcal/d million kcal/d Year 11 (2014) million kcal/d 477 million kcal/d million kcal/d Year 12 (2015) million kcal/d 484 million kcal/d million kcal/d Table 5: Thermal Credit Summary ( ) Table 6 presents the actual, allowable, and excess thermal loads from the Rock Creek and Durham AWTFs, the thermal credits generated with flow augmentation in 2015, the thermal credits generated with riparian plantings for and 2015, and the net thermal load for Credits associated with the SWCD- Garrison and SWCD-Lichtner projects were removed from the District s credit portfolio. The 2015 thermal budget continues to show that the District is able to completely offset the excess thermal loads from the Rock Creek and Durham AWTFs. At the Durham AWTF, flow augmentation completely offsets the facility s excess thermal load. At the Rock Creek AWTF, credits from both riparian plantings and flow augmentation were used to offset the excess thermal load. Facility Actual Thermal Load Allowable Thermal Load Thermal Loads and Thermal Credits (2015) Excess Thermal Load Thermal Credits from Flow Augmentation Thermal Credits from Riparian Shade ( ) Thermal Credits from Riparian Shade (2015) Thermal Credits (total) Net Thermal Load Rock Creek AWTF Durham AWTF N/A N/A Units: million kcal/day Table 6: 2015 Thermal Budget 5.0 Environmental Benefits and Efficiency Summary This section contains a summary of the environmental benefits describing how the credit trades support watershed management objectives. It also includes an efficiency summary describing how the credit trades support cost-effective and timely watershed management. 5.1 Environmental Benefits Summary The environmental benefits of implementing a water quality trading program in supporting watershed management objectives are numerous. The ability to enhance riparian areas both within and outside the District s service area promotes a watershed-based approach to improving and enhancing the overall health of the Tualatin River watershed. The activities, which are covered by the District s numerous programs and initiatives, work to form the basis of a collaborative and cost-effective watershed-based management strategy. The District s trading program supports numerous ecosystem benefits beyond temperature benefits. The ecosystem benefits of riparian shading activities include improved stream functions (e.g., floodplain roughness, bank stabilization, peak flow attenuation, habitat creation), increased diversity of aquatic and terrestrial plant and animal species, filtering of stormwater runoff, and improved water quality. The increased complexity of structure and diversity of restored riparian forests and scrub-shrub wetlands support many important ecosystem functions for the aquatic environment. One example of this is 2015 Annual Report 12
14 colonization of some stream reaches by beavers, a keystone species for stream function in the basin. By raising the water table, beavers promote floodplain wetlands with enhanced plant, animal, and geomorphic diversity in comparison to the original simplified stream channel. These features and the resultant geomorphic complexity enhance fish habitat quality and may also provide cold water refuges. Furthermore, the enhancement of riparian areas within and outside the District s service area improves the overall health of the Tualatin River watershed and creates partnerships with positive outcomes for water quality. The District s release of stored water also provides multiple ecosystem benefits. The water used for enhancement provides cooling effects, buffers against temperature changes, and results in higher dissolved oxygen levels and improved overall water quality to support aquatic life. The release of stored water, along with the release of highly treated discharges from the District s Rock Creek and Durham AWTFs, provides a sustainable base flow to the mainstem Tualatin River during the dry season. 5.2 Efficiency Summary The activities that constitute the District s thermal load credit trading program support a cost-effective and timely approach to improving and restoring the overall health of the Tualatin River watershed. The program focuses resources on addressing a systematic approach to integrated watershed management. By evaluating and considering the multiple objective nature of the District s water quality trading program, the benefits to the entire watershed are substantial and widespread. Additionally, the shade generation activities support and generate numerous opportunities for collaboration of various organizations, as well as serving as a great mechanism to reconnect the citizens of Washington County to their watershed. All these benefits indicate that the District s thermal load credit trading program has resulted in a cost-effective and collaborative approach to watershed management. 6.0 Appendices Appendix A: Project Summaries for Riparian Planting Projects Credited in 2015 Appendix B: Site Assessment Reports for Riparian Planting Projects ( ) Appendix C: Additional Appendix D: Identification of Trading Baselines for Flow Augmentation 2015 Annual Report 13
15 Appendix A Project Summaries for Riparian Planting Projects Credited in Annual Report 14
16 SWCD Project Summary Site ID Acres Location Private property on Gales Creek in the Gales Creek subbasin, in rural Washington County Lat/Long Number of Plants Installed , ,000 (total from 2015) Stream Length Average Stream Width 2,257 ft. 25 ft. Initial Planting Year/Credit Year Thermal Benefits/Credits 2015/ / 2.63 (million kcal/day) Plant Communities Riparian Forest (refer to the Site Assessment Report for additional information) Partners Tualatin Soil and Water Conservation District and USDA Farm Service Agency Riparian Planting Activities Site preparation, targeted invasive species treatment, herbivore control, and riparian plantings Stream Enhancement Activities None Site Assessment Summary Plant Community: Riparian Forest Phase: Transitional Stems Per Acre: 1700 cascara native cherry black twinberry tall Oregon grape common horsetail spike bentgrass tufted hairgrass Interplant Interplant Seeding Seeding Herbivore Control Herbivore Control Canada thistle 2015 Annual Report 15
17 Thermal Credit for Shade Enhancement Stream Length (ft) Thermal Load Blocked (Baseline Conditions) (kcal/d) Thermal Load Blocked (Enhanced Conditions) (kcal/d) Thermal Load Reduction (Environmental Benefits) (kcal/d) Thermal Credit Received (kcal/d) Credit per Length (kcal/d/ft) E E E E Shade-a-Lator Input and Output Spreadsheets Table 1. SWCD-2137 Input and Output Data for Baseline Shade Conditions SHADE DETAILS All columns under STREAM INFORMATION and under RIPARIAN CODES are input to the Shade-O-Later from the Heat Source model; codes are included only for riparian zones that were restored or protected The 'Effective Shade' column is output from the Shade-O-Later from the Heat Source model The "Thermal Load Blocked" column is calculated from the stream width and length, the effective shade, and an assumption of solar insolation of 480 kcal/d PROJECT SHADE & HEAT STREAM INFORMATION RIPARIAN CODES -- LEFT BANK-- code only vegetation that CWS is responsible for RIPARIAN CODES -- RIGHT BANK-- code only vegetation that CWS is responsible for Thermal Segment Wetted NSDZ Channel Load Orientation LB LB LB LB LB LB LB LB LB RB RB RB RB RB RB RB RB Length Width Width Incision Blocked (0 deg=n) 0-15 ft ft 30-45ft ft ft ft ft ft ft 0-15 ft ft 30-45ft ft ft ft ft ft (ft) (ft) (ft) (ft) (kcal/d) Effective Shade (%) SWCD % 6.4E SWCD % 1.8E SWCD % 2.7E SWCD % 5.3E SWCD % 9.7E SWCD % 1.1E SWCD % 0.0E SWCD % 0.0E SWCD % 0.0E SWCD % 0.0E SWCD % 3.0E SWCD % 7.0E SWCD % 3.2E SWCD % 1.5E SWCD % 8.5E SWCD % 1.1E SWCD % 1.6E SWCD % 7.1E SWCD % 0.0E SWCD % 0.0E SWCD % 0.0E SWCD % 0.0E SWCD % 1.1E RB ft 2015 Annual Report 16
18 Table 2. SWCD-2137 Input and Output Data for Enhanced Shade Conditions SHADE DETAILS All columns under STREAM INFORMATION and under RIPARIAN CODES are input to the Shade-O-Later from the Heat Source model; codes are included only for riparian zones that were restored or protected The 'Effective Shade' column is output from the Shade-O-Later from the Heat Source model The "Thermal Load Blocked" column is calculated from the stream width and length, the effective shade, and an assumption of solar insolation of 480 kcal/d SHADE & HEAT STREAM INFORMATION RIPARIAN CODES -- LEFT BANK-- code only vegetation that CWS is responsible for RIPARIAN CODES -- RIGHT BANK-- code only vegetation that CWS is responsible for PROJECT Effective Shade (% ) Thermal Load Blocked (kcal/d) Segment Length (ft) Orientation (0 deg=n) Wetted Width (ft) NSDZ Width (ft) Channel Incision (ft) LB 0-15 ft LB ft LB 30-45ft LB ft LB ft LB ft LB ft LB ft LB ft RB 0-15 ft RB ft RB 30-45ft RB ft RB ft RB ft RB ft RB ft RB ft SWCD % 6.6E SWCD % 2.9E SWCD % 3.9E SWCD % 6.0E SWCD % 2.7E SWCD % 1.1E SWCD % 8.8E SWCD % 2.4E SWCD % 6.3E SWCD % 2.8E SWCD % 7.6E SWCD % 7.0E SWCD % 7.7E SWCD % 2.9E SWCD % 1.7E SWCD % 1.6E SWCD % 1.7E SWCD % 1.1E SWCD % 2.1E SWCD % 5.9E SWCD % 6.9E SWCD % 7.2E SWCD % 1.6E Table 3. Riparian Codes for Shade-a-Lator Inputs Height Density OH Code Source Description (m) (%) (m) 1000 CWS Not in project 0.0 0% CWS Forest fully vegetated % CWS Forest partially vegetated % CWS Forest partially vegetated % CWS No existing forest vegetation 0.0 0% CWS Wetland fully vegetated % CWS Wetland partially vegetated % CWS Wetland partially vegetated % CWS No existing wetland vegetation 0.0 0% Annual Report 17
19 SWCD Project Summary Site ID Acres Location Private property on Little Beaver Creek, in the Gales Creek subbasin, in rural Washington County Lat/Long Number of Plants Installed , ,900 (total from 2015) Stream Length Average Stream Width 572 ft. 8 ft. Initial Planting Year/Credit Year Thermal Benefits/Credits 2015/ / 0.71 (million kcal/day) Plant Communities Riparian Forest (refer to the Site Assessment Report for additional information) Partners Tualatin Soil and Water Conservation District and USDA Farm Service Agency Riparian Planting Activities Site preparation, targeted invasive species treatment, herbivore control, and riparian plantings Stream Enhancement Activities None Site Assessment Summary Plant Community: Riparian Forest Phase: Transitional Stems Per Acre: 2700 cascara clustered wild rose salal buttercup common yarrow giant horsetail slender hairgrass spike bentgrass western pearly everlasting western yellow cress Interplant Interplant Seeding Seeding Herbivore Control Herbivore Control bull thistle Canada thistle 2015 Annual Report 18
20 Thermal Credit for Shade Enhancement Stream Length (ft) Thermal Load Blocked (Baseline Conditions) (kcal/d) Thermal Load Blocked (Enhanced Conditions) (kcal/d) Thermal Load Reduction (Environmental Benefits) (kcal/d) Thermal Credit Received (kcal/d) Credit per Length (kcal/d/ft) E E E E Shade-a-Lator Input and Output Spreadsheets Table 1. SWCD-2138 Input and Output Data for Baseline Shade Conditions SHADE DETAILS All columns under STREAM INFORMATION and under RIPARIAN CODES are input to the Shade-O-Later from the Heat Source model; codes are included only for riparian zones that were restored or protected The 'Effective Shade' column is output from the Shade-O-Later from the Heat Source model The "Thermal Load Blocked" column is calculated from the stream width and length, the effective shade, and an assumption of solar insolation of 480 kcal/d PROJECT SHADE & HEAT STREAM INFORMATION RIPARIAN CODES -- LEFT BANK-- code only vegetation that CWS is responsible for RIPARIAN CODES -- RIGHT BANK-- code only vegetation that CWS is responsible for Thermal Segment Wetted NSDZ Channel Load Orientation LB LB LB LB LB LB LB LB LB RB RB RB RB RB RB RB RB Length Width Width Incision Blocked (0 deg=n) 0-15 ft ft 30-45ft ft ft ft ft ft ft 0-15 ft ft 30-45ft ft ft ft ft ft (ft) (ft) (ft) (ft) (kcal/d) Effective Shade (%) SWCD % 8.3E SWCD % 4.1E SWCD % 0.0E SWCD % 0.0E SWCD % 1.5E SWCD % 1.9E RB ft Table 2. SWCD-2138 Input and Output Data for Enhanced Shade Conditions SHADE DETAILS All columns under STREAM INFORMATION and under RIPARIAN CODES are input to the Shade-O-Later from the Heat Source model; codes are included only for riparian zones that were restored or protected The 'Effective Shade' column is output from the Shade-O-Later from the Heat Source model The "Thermal Load Blocked" column is calculated from the stream width and length, the effective shade, and an assumption of solar insolation of 480 kcal/d SHADE & HEAT STREAM INFORMATION RIPARIAN CODES -- LEFT BANK-- code only vegetation that CWS is responsible for RIPARIAN CODES -- RIGHT BANK-- code only vegetation that CWS is responsible for PROJECT Effective Shade (% ) Thermal Load Blocked (kcal/d) Segment Length (ft) Orientation (0 deg=n) Wetted Width (ft) NSDZ Width (ft) Channel Incision (ft) LB 0-15 ft LB ft LB 30-45ft LB ft LB ft LB ft LB ft LB ft LB ft RB 0-15 ft RB ft RB 30-45ft RB ft RB ft RB ft RB ft RB ft RB ft SWCD % 2.3E SWCD % 1.5E SWCD % 3.2E SWCD % 3.2E SWCD % 3.1E SWCD % 2.4E Annual Report 19
21 Table 3. Riparian Codes for Shade-a-Lator Inputs Height Density OH Code Source Description (m) (%) (m) 1000 CWS Not in project 0.0 0% CWS Forest fully vegetated % CWS Forest partially vegetated % CWS Forest partially vegetated % CWS No existing forest vegetation 0.0 0% CWS Wetland fully vegetated % CWS Wetland partially vegetated % CWS Wetland partially vegetated % CWS No existing wetland vegetation 0.0 0% Annual Report 20
22 SWCD Project Summary Site ID Acres Location Private property on Carpenter Creek, in the Carpenter Creek subbasin, in rural Washington County Lat/Long Number of Plants Installed , ,500 (total from 2015) Stream Length Average Stream Width 4,023 ft 6 ft. Initial Planting Year/Credit Year Thermal Benefits/Credits 2015/ / 1.74 (million kcal/day) Plant Communities Riparian Forest (refer to the Site Assessment Report for additional information) Partners Tualatin Soil and Water Conservation District and USDA Farm Service Agency Riparian Planting Activities Site preparation, targeted invasive species treatment, herbivore control, and riparian plantings Stream Enhancement Activities None Site Assessment Summary Plant Community: Riparian Forest Stems Per Acre: 620 cascara black twinberry evening-primsrose spike bentgrass tall annual Interplant Interplant Seeding Seeding Phase: Herbivore Control Herbivore Control Canada thistle common teasel morning-glory Transitional 2015 Annual Report 21
23 Thermal Credit for Shade Enhancement Stream Length (ft) Thermal Load Blocked (Baseline Conditions) (kcal/d) Thermal Load Blocked (Enhanced Conditions) (kcal/d) Thermal Load Reduction (Environmental Benefits) (kcal/d) Thermal Credit Received (kcal/d) Credit per Length (kcal/d/ft) E E E E Shade-a-Lator Input and Output Spreadsheets Table 1. SWCD-2139 Input and Output Data for Baseline Shade Conditions SHADE DETAILS All columns under STREAM INFORMATION and under RIPARIAN CODES are input to the Shade-O-Later from the Heat Source model; codes are included only for riparian zones that were restored or protected The 'Effective Shade' column is output from the Shade-O-Later from the Heat Source model The "Thermal Load Blocked" column is calculated from the stream width and length, the effective shade, and an assumption of solar insolation of 480 kcal/d PROJECT SHADE & HEAT STREAM INFORMATION RIPARIAN CODES -- LEFT BANK-- code only vegetation that CWS is responsible for RIPARIAN CODES -- RIGHT BANK-- code only vegetation that CWS is responsible for Thermal Segment Wetted NSDZ Channel Load Orientation LB LB LB LB LB LB LB LB LB RB RB RB RB RB RB RB RB Length Width Width Incision Blocked (0 deg=n) 0-15 ft ft 30-45ft ft ft ft ft ft ft 0-15 ft ft 30-45ft ft ft ft ft ft (ft) (ft) (ft) (ft) (kcal/d) Effective Shade (%) SWCD % 0.0E SWCD % 2.5E SWCD % 0.0E SWCD % 0.0E SWCD % 0.0E SWCD % 0.0E SWCD % 0.0E SWCD % 0.0E SWCD % 0.0E SWCD % 0.0E SWCD % 0.0E SWCD % 0.0E SWCD % 0.0E SWCD % 0.0E SWCD % 0.0E SWCD % 0.0E SWCD % 0.0E SWCD % 1.5E SWCD % 1.2E SWCD % 0.0E SWCD % -2.6E SWCD % 0.0E SWCD % 0.0E SWCD % 3.4E SWCD % 0.0E SWCD % 0.0E SWCD % 0.0E SWCD % 1.5E SWCD % 6.6E SWCD % 5.6E SWCD % 0.0E SWCD % 5.9E SWCD % 1.2E SWCD % 7.3E SWCD % 1.1E SWCD % 1.8E SWCD % 1.5E SWCD % 6.9E SWCD % 0.0E SWCD % 0.0E SWCD % 0.0E Annual Report 22 RB ft
24 Table 2. SWCD-2139 Input and Output Data for Enhanced Shade Conditions SHADE DETAILS All columns under STREAM INFORMATION and under RIPARIAN CODES are input to the Shade-O-Later from the Heat Source model; codes are included only for riparian zones that were restored or protected The 'Effective Shade' column is output from the Shade-O-Later from the Heat Source model The "Thermal Load Blocked" column is calculated from the stream width and length, the effective shade, and an assumption of solar insolation of 480 kcal/d SHADE & HEAT STREAM INFORMATION RIPARIAN CODES -- LEFT BANK-- code only vegetation that CWS is responsible for RIPARIAN CODES -- RIGHT BANK-- code only vegetation that CWS is responsible for PROJECT Effective Shade (% ) Thermal Load Blocked (kcal/d) Segment Length (ft) Orientation (0 deg=n) Wetted Width (ft) NSDZ Width (ft) Channel Incision (ft) LB 0-15 ft LB ft LB 30-45ft LB ft LB ft LB ft LB ft LB ft LB ft RB 0-15 ft RB ft RB 30-45ft RB ft RB ft RB ft RB ft RB ft RB ft SWCD % 5.3E SWCD % 4.8E SWCD % 4.7E SWCD % 5.3E SWCD % 5.0E SWCD % 4.9E SWCD % 5.0E SWCD % 5.1E SWCD % 5.6E SWCD % 2.7E SWCD % 2.8E SWCD % 2.3E SWCD % 2.3E SWCD % 2.7E SWCD % 2.9E SWCD % 3.0E SWCD % 2.8E SWCD % 2.7E SWCD % 1.7E SWCD % 2.6E SWCD % 1.7E SWCD % 6.0E SWCD % 5.7E SWCD % 9.6E SWCD % 4.9E SWCD % 6.0E SWCD % 9.5E SWCD % 2.3E SWCD % 2.1E SWCD % 2.6E SWCD % 2.5E SWCD % 2.6E SWCD % 2.3E SWCD % 2.6E SWCD % 2.5E SWCD % 2.5E SWCD % 1.6E SWCD % 2.5E SWCD % 2.0E SWCD % 2.0E SWCD % 2.4E Annual Report 23
25 Table 3. Riparian Codes for Shade-a-Lator Inputs Height Density OH Code Source Description (m) (%) (m) 1000 CWS Not in project 0.0 0% CWS Forest fully vegetated % CWS Forest partially vegetated % CWS Forest partially vegetated % CWS No existing forest vegetation 0.0 0% CWS Wetland fully vegetated % CWS Wetland partially vegetated % CWS Wetland partially vegetated % CWS No existing wetland vegetation 0.0 0% Annual Report 24
26 SWCD Project Summary Site ID Acres Location Private property on Little Beaver Creek, in the Gales Creek subbasin, in rural Washington County Lat/Long Number of Plants Installed , ,600 (total from 2015) Stream Length Average Stream Width 5,161 ft 10 ft. Initial Planting Year/Credit Year Thermal Benefits/Credits 2015/ / 3.3 (million kcal/day) Plant Communities Riparian Forest (refer to the Site Assessment Report for additional information) Partners Tualatin Soil and Water Conservation District and USDA Farm Service Agency Riparian Planting Activities Site preparation, targeted invasive species treatment, herbivore control, and riparian plantings Stream Enhancement Activities None Site Assessment Summary Plant Community: Riparian Forest Stems Per Acre: 1650 cascara Douglas-fir Oregon oak red alder W. v. ponderosa pine black twinberry clustered wild rose elderberry Sitka Willow tall Oregon grape thimbleberry cleavers common horsetail Cooley's hedge-nettle fringecup giant horsetail moss rice cutgrass small-fruited bulrush soft rush spike bentgrass western pearly everlasting Phase: Transitional bittersweet nightshade bull thistle Canada thistle English holly garlic mustard hedge false bindweed Continued on Next Page 2015 Annual Report 25
27 Interplant Interplant Seeding Seeding Herbivore Control Herbivore Control Thermal Credit for Shade Enhancement Stream Length (ft) Thermal Load Blocked (Baseline Conditions) (kcal/d) Thermal Load Blocked (Enhanced Conditions) (kcal/d) Thermal Load Reduction (Environmental Benefits) (kcal/d) Thermal Credit Received (kcal/d) Credit per Length (kcal/d/ft) E E E E Annual Report 26
28 Shade-a-Lator Input and Output Spreadsheets Table 1. SWCD-2142 Input and Output Data for Baseline Shade Conditions SHADE DETAILS All columns under STREAM INFORMATION and under RIPARIAN CODES are input to the Shade-O-Later from the Heat Source model; codes are included only for riparian zones that were restored or protected The 'Effective Shade' column is output from the Shade-O-Later from the Heat Source model The "Thermal Load Blocked" column is calculated from the stream width and length, the effective shade, and an assumption of solar insolation of 480 kcal/d PROJECT SHADE & HEAT STREAM INFORMATION RIPARIAN CODES -- LEFT BANK-- code only vegetation that CWS is responsible for RIPARIAN CODES -- RIGHT BANK-- code only vegetation that CWS is responsible for Thermal Segment Wetted NSDZ Channel Load Orientation LB LB LB LB LB LB LB LB LB RB RB RB RB RB RB RB RB Length Width Width Incision Blocked (0 deg=n) 0-15 ft ft 30-45ft ft ft ft ft ft ft 0-15 ft ft 30-45ft ft ft ft ft ft (ft) (ft) (ft) (ft) (kcal/d) Effective Shade (%) SWCD % 2.6E SWCD % 2.5E SWCD % 2.5E SWCD % 2.4E SWCD % 2.1E SWCD % 2.5E SWCD % 1.4E SWCD % 1.3E SWCD % 1.8E SWCD % 2.3E SWCD % 1.6E SWCD % 1.1E SWCD % 2.4E SWCD % 1.7E SWCD % 2.5E SWCD % 2.1E SWCD % 0.0E SWCD % 0.0E SWCD % 0.0E SWCD % 1.0E SWCD % 1.2E SWCD % 2.2E SWCD % 3.0E SWCD % 0.0E SWCD % 0.0E SWCD % 0.0E SWCD % 0.0E SWCD % 0.0E SWCD % 0.0E SWCD % 2.0E SWCD % 5.5E SWCD % 2.6E SWCD % 5.5E SWCD % 2.1E SWCD % 0.0E SWCD % 0.0E SWCD % 0.0E SWCD % 0.0E SWCD % 0.0E SWCD % 3.9E SWCD % 2.8E SWCD % 3.1E SWCD % 2.6E SWCD % 2.8E SWCD % 2.1E SWCD % 4.0E SWCD % 4.3E SWCD % 5.2E SWCD % 6.7E SWCD % 1.2E SWCD % 9.7E SWCD % 1.6E Annual Report 27 RB ft
29 Table 2. SWCD-2142 Input and Output Data for Enhanced Shade Conditions SHADE DETAILS All columns under STREAM INFORMATION and under RIPARIAN CODES are input to the Shade-O-Later from the Heat Source model; codes are included only for riparian zones that were restored or protected The 'Effective Shade' column is output from the Shade-O-Later from the Heat Source model The "Thermal Load Blocked" column is calculated from the stream width and length, the effective shade, and an assumption of solar insolation of 480 kcal/d SHADE & HEAT STREAM INFORMATION RIPARIAN CODES -- LEFT BANK-- code only vegetation that CWS is responsible for RIPARIAN CODES -- RIGHT BANK-- code only vegetation that CWS is responsible for PROJECT Effective Shade (% ) Thermal Load Blocked (kcal/d) Segment Length (ft) Orientation (0 deg=n) Wetted Width (ft) NSDZ Width (ft) Channel Incision (ft) LB 0-15 ft LB ft LB 30-45ft LB ft LB ft LB ft LB ft LB ft LB ft RB 0-15 ft RB ft RB 30-45ft RB ft RB ft RB ft RB ft RB ft RB ft SWCD % 2.6E SWCD % 2.5E SWCD % 2.6E SWCD % 2.6E SWCD % 2.7E SWCD % 2.6E SWCD % 2.5E SWCD % 2.3E SWCD % 2.5E SWCD % 2.6E SWCD % 2.6E SWCD % 2.6E SWCD % 2.6E SWCD % 2.6E SWCD % 2.6E SWCD % 2.1E SWCD % 0.0E SWCD % 2.1E SWCD % 2.0E SWCD % 1.9E SWCD % 1.8E SWCD % 2.4E SWCD % 1.4E SWCD % 3.2E SWCD % 1.8E SWCD % 1.8E SWCD % 1.9E SWCD % 1.9E SWCD % 1.9E SWCD % 4.3E SWCD % 4.1E SWCD % 4.3E SWCD % 3.4E SWCD % 4.0E SWCD % 3.5E SWCD % 4.1E SWCD % 4.0E SWCD % 4.1E SWCD % 4.3E SWCD % 4.3E SWCD % 4.3E SWCD % 4.8E SWCD % 4.4E SWCD % 2.8E SWCD % 2.9E SWCD % 2.5E SWCD % 3.1E SWCD % 3.2E SWCD % 8.4E SWCD % 1.4E SWCD % 1.7E SWCD % 1.6E Annual Report 28
30 Table 3. Riparian Codes for Shade-a-Lator Inputs Height Density OH Code Source Description (m) (%) (m) 1000 CWS Not in project 0.0 0% CWS Forest fully vegetated % CWS Forest partially vegetated % CWS Forest partially vegetated % CWS No existing forest vegetation 0.0 0% CWS Wetland fully vegetated % CWS Wetland partially vegetated % CWS Wetland partially vegetated % CWS No existing wetland vegetation 0.0 0% Annual Report 29
 Stream Length Average Stream Width 2,794 ft 66 ft.")
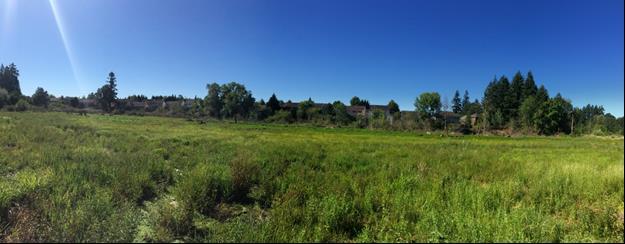
31 Tualatin River Farm Project Summary Site ID Acres Location Public property on the Tualatin River in the Tualatin subbasin, south of Minter Bridge Rd. Lat/Long Number of Plants Installed , ,725 (total from ) Stream Length Average Stream Width 2,794 ft 66 ft. Initial Planting Year/Credit Year Thermal Benefits/Credits 2014/ / 0.89 (million kcal/day) Plant Communities Riparian Forest, Forested Wetland, Scrub-Shrub, Upland Forest, Emergent Marsh, and Wet Prairie (refer to the Site Assessment Report for additional information) Partners Metro and Natural Resources Conservation Service Riparian Planting Activities Site preparation, targeted invasive species treatment, herbivore control, and riparian plantings Stream Enhancement Activities Floodplain wood assemblages Project Map 2015 Annual Report 30
32 Site Assessment Summary Plant Community: Riparian Forest Phase: Transitional Stems Per Acre: 1422 pacific crab apple beaked hazelnut black twinberry clustered wild rose elderberry mock-orange red elderberry American bird's-foot trefoil bluehead gilia common beggarticks common selfheal common woolly sunflower common yarrow Cusick's popcornflower denseflower farewell to spring fringecup giant horsetail grand collomia gumweed lupine meadow barley popcornflower sedge shortspur seablush skunkweed slender hairgrass spike bentgrass spotted touch-me-not stinging nettle tarweed western yellow cress bittersweet nightshade morning-glory Interplant Interplant Seeding Seeding Herbivore Control Herbivore Control 2015 Annual Report 31
33 Thermal Credit for Shade Enhancement Stream Length (ft) Thermal Load Blocked (Baseline Conditions) (kcal/d) Thermal Load Blocked (Enhanced Conditions) (kcal/d) Thermal Load Reduction (Environmental Benefits) (kcal/d) Thermal Credit Received (kcal/d) Credit per Length (kcal/d/ft) E E E E Shade-a-Lator Input and Output Spreadsheets Table 1. Tualatin River Farm Input and Output Data for Baseline Shade Conditions SHADE DETAILS All columns under STREAM INFORMATION and under RIPARIAN CODES are input to the Shade-O-Later from the Heat Source model; codes are included only for riparian zones that were restored or protected The 'Effective Shade' column is output from the Shade-O-Later from the Heat Source model The "Thermal Load Blocked" column is calculated from the stream width and length, the effective shade, and an assumption of solar insolation of 480 kcal/d PROJECT SHADE & HEAT STREAM INFORMATION RIPARIAN CODES -- LEFT BANK-- code only vegetation that CWS is responsible for RIPARIAN CODES -- RIGHT BANK-- code only vegetation that CWS is responsible for Thermal Segment Wetted NSDZ Channel Load Orientation LB LB LB LB LB LB LB LB LB RB RB RB RB RB RB RB RB Length Width Width Incision Blocked (0 deg=n) 0-15 ft ft 30-45ft ft ft ft ft ft ft 0-15 ft ft 30-45ft ft ft ft ft ft (ft) (ft) (ft) (ft) (kcal/d) Effective Shade (%) Tualatin River Farm % 2.5E Tualatin River Farm % 5.5E Tualatin River Farm % 6.0E Tualatin River Farm % 4.1E Tualatin River Farm % 4.2E Tualatin River Farm % 3.6E Tualatin River Farm % 3.6E Tualatin River Farm % 2.1E Tualatin River Farm % 1.7E Tualatin River Farm % 3.2E Tualatin River Farm % 3.2E Tualatin River Farm % 7.9E Tualatin River Farm % 1.4E Tualatin River Farm % 2.7E Tualatin River Farm % 2.3E Tualatin River Farm % 1.7E Tualatin River Farm % 6.2E Tualatin River Farm % 7.8E Tualatin River Farm % 5.4E Tualatin River Farm % 1.4E Tualatin River Farm % 7.1E Tualatin River Farm % 7.0E Tualatin River Farm % 5.8E Tualatin River Farm % 4.8E Tualatin River Farm % 4.3E Tualatin River Farm % 3.0E Tualatin River Farm % 1.9E Tualatin River Farm % 1.4E RB ft 2015 Annual Report 32
34 Table 2. Tualatin River Farm Input and Output Data for Enhanced Shade Conditions SHADE DETAILS All columns under STREAM INFORMATION and under RIPARIAN CODES are input to the Shade-O-Later from the Heat Source model; codes are included only for riparian zones that were restored or protected The 'Effective Shade' column is output from the Shade-O-Later from the Heat Source model The "Thermal Load Blocked" column is calculated from the stream width and length, the effective shade, and an assumption of solar insolation of 480 kcal/d SHADE & HEAT STREAM INFORMATION RIPARIAN CODES -- LEFT BANK-- code only vegetation that CWS is responsible for RIPARIAN CODES -- RIGHT BANK-- code only vegetation that CWS is responsible for PROJECT Effective Shade (% ) Thermal Load Blocked (kcal/d) Segment Length (ft) Orientation (0 deg=n) Wetted Width (ft) NSDZ Width (ft) Channel Incision (ft) LB 0-15 ft LB ft LB 30-45ft LB ft LB ft LB ft LB ft LB ft LB ft RB 0-15 ft RB ft RB 30-45ft RB ft RB ft RB ft RB ft RB ft RB ft Tualatin River Farm % 5.5E Tualatin River Farm % 5.9E Tualatin River Farm % 6.4E Tualatin River Farm % 5.2E Tualatin River Farm % 4.7E Tualatin River Farm % 3.8E Tualatin River Farm % 3.8E Tualatin River Farm % 2.2E Tualatin River Farm % 2.1E Tualatin River Farm % 3.4E Tualatin River Farm % 3.5E Tualatin River Farm % 2.0E Tualatin River Farm % 2.0E Tualatin River Farm % 3.0E Tualatin River Farm % 2.5E Tualatin River Farm % 1.8E Tualatin River Farm % 6.5E Tualatin River Farm % 9.1E Tualatin River Farm % 1.0E Tualatin River Farm % 2.3E Tualatin River Farm % 7.7E Tualatin River Farm % 7.9E Tualatin River Farm % 7.8E Tualatin River Farm % 6.5E Tualatin River Farm % 5.2E Tualatin River Farm % 3.5E Tualatin River Farm % 2.1E Tualatin River Farm % 1.4E Table 3. Riparian Codes for Shade-a-Lator Inputs Height Density OH Code Source Description (m) (%) (m) 1000 CWS Not in project 0.0 0% CWS Forest fully vegetated % CWS Forest partially vegetated % CWS Forest partially vegetated % CWS No existing forest vegetation 0.0 0% CWS Wetland fully vegetated % CWS Wetland partially vegetated % CWS Wetland partially vegetated % CWS No existing wetland vegetation 0.0 0% Annual Report 33

35 Bronson Creek Greenway Project Summary Site ID Acres Location Public property on Bronson Creek, in the Rock Creek subbasin, near Beaverton, OR, between Sunset Hwy and NW West Union Rd Lat/Long Number of Plants Installed , ,114 (total from ) Stream Length 4,600 ft 7 ft. Average Stream Width Initial Planting Year/Credit Year Thermal Benefits/Credits 2013/ / (million kcal/day) Plant Communities Riparian Forest, Scrub Shrub, and Forested Wetland (refer to the Site Assessment Report for additional information) Partners Tualatin Hills Park and Recreation District Riparian Planting Activities Site preparation, targeted invasive species treatment, herbivore control, and riparian plantings Stream Enhancement Activities Floodplain wood assemblages Project Map 2015 Annual Report 34
36 Site Assessment Summary Plant Community: Scrub-Shrub Phase: Transitional Stems Per Acre: 1466 bigleaf maple Oregon oak beaked hazelnut black twinberry clustered wild rose mock-orange Pacific Willow Piper s willow serviceberry Sitka Willow American bird's-foot trefoil American sloughgrass American speedwell California figwort cleavers common cattail common horsetail cursed buttercup fringecup marsh pennywort nodding beggarticks northern water plantain rice cutgrass sawbeak sedge sedge slender rush slough sedge small duckweed soft rush tufted hairgrass wapato water foxtail western swordfern bittersweet nightshade common hawthorn common teasel Continued on Next Page 2015 Annual Report 35
37 Plant Community: Forested Wetland Stems Per Acre: 2950 black cottonwood cascara vine maple western red cedar Plant Community: Riparian Forest Stems Per Acre: 9200 Douglas-fir Oregon oak Pacific dogwood black twinberry clustered wild rose nootka rose oceanspray Pacific Willow Scouler s Willow Sitka Willow tall Oregon grape Western wahoo baldhip rose beaked hazelnut mock-orange osoberry, indian plum Pacific poison oak salal serviceberry tall Oregon grape American speedwell buttercup California figwort cleavers Cooley's hedge-nettle fringecup lady fern pointed rush rice cutgrass slender hairgrass slough sedge soft rush spike bentgrass taperfruit shortscale sedge western swordfern western yellow cress western starflower western swordfern Interplant Interplant Phase: Established bittersweet nightshade bull thistle Phase: cherry Seeding Seeding Herbivore Control Herbivore Control English holly Established 2015 Annual Report 36
38 Thermal Credit for Shade Enhancement Stream Length (ft) Thermal Load Blocked (Baseline Conditions) (kcal/d) Thermal Load Blocked (Enhanced Conditions) (kcal/d) Thermal Load Reduction (Environmental Benefits) (kcal/d) Thermal Credit Received (kcal/d) Credit per Length (kcal/d/ft) E E E E Annual Report 37
39 Shade-a-Lator Input and Output Spreadsheets Table 1. Bronson Creek Greenway Input and Output Data for Baseline Shade Conditions SHADE DETAILS All columns under STREAM INFORMATION and under RIPARIAN CODES are input to the Shade-O-Later from the Heat Source model; codes are included only for riparian zones that were restored or protected The 'Effective Shade' column is output from the Shade-O-Later from the Heat Source model The "Thermal Load Blocked" column is calculated from the stream width and length, the effective shade, and an assumption of solar insolation of 480 kcal/d PROJECT SHADE & HEAT STREAM INFORMATION RIPARIAN CODES -- LEFT BANK-- code only vegetation that CWS is responsible for RIPARIAN CODES -- RIGHT BANK-- code only vegetation that CWS is responsible for Thermal Segment Wetted NSDZ Channel Load Orientation LB LB LB LB LB LB LB LB LB RB RB RB RB RB RB RB RB Length Width Width Incision Blocked (0 deg=n) 0-15 ft ft 30-45ft ft ft ft ft ft ft 0-15 ft ft 30-45ft ft ft ft ft ft (ft) (ft) (ft) (ft) (kcal/d) Effective Shade (%) Bronson Creek Greenway % 3.8E Bronson Creek Greenway % 6.4E Bronson Creek Greenway % 6.6E Bronson Creek Greenway % 6.4E Bronson Creek Greenway % 2.8E Bronson Creek Greenway % 6.1E Bronson Creek Greenway % 4.4E Bronson Creek Greenway % 4.6E Bronson Creek Greenway % 4.4E Bronson Creek Greenway % 1.7E Bronson Creek Greenway % 5.4E Bronson Creek Greenway % 4.8E Bronson Creek Greenway % 5.0E Bronson Creek Greenway % 2.0E Bronson Creek Greenway % 4.5E Bronson Creek Greenway % 0.0E Bronson Creek Greenway % 4.1E Bronson Creek Greenway % 5.8E Bronson Creek Greenway % 6.4E Bronson Creek Greenway % 0.0E Bronson Creek Greenway % 0.0E Bronson Creek Greenway % 0.0E Bronson Creek Greenway % 6.5E Bronson Creek Greenway % 8.6E Bronson Creek Greenway % 4.8E Bronson Creek Greenway % 0.0E Bronson Creek Greenway % 8.9E Bronson Creek Greenway % 1.5E Bronson Creek Greenway % 0.0E Bronson Creek Greenway % 3.3E Bronson Creek Greenway % 3.1E Bronson Creek Greenway % 4.2E Bronson Creek Greenway % 1.3E Bronson Creek Greenway % 9.6E Bronson Creek Greenway % 1.1E Bronson Creek Greenway % 4.7E Bronson Creek Greenway % 3.7E Bronson Creek Greenway % 2.1E Bronson Creek Greenway % 2.8E Bronson Creek Greenway % 4.1E Bronson Creek Greenway % 0.0E Bronson Creek Greenway % 0.0E Bronson Creek Greenway % 0.0E Bronson Creek Greenway % 2.9E Bronson Creek Greenway % 3.1E Bronson Creek Greenway % 0.0E RB ft 2015 Annual Report 38
40 Table 2. Bronson Creek Greenway Input and Output Data for Enhanced Shade Conditions SHADE DETAILS All columns under STREAM INFORMATION and under RIPARIAN CODES are input to the Shade-O-Later from the Heat Source model; codes are included only for riparian zones that were restored or protected The 'Effective Shade' column is output from the Shade-O-Later from the Heat Source model The "Thermal Load Blocked" column is calculated from the stream width and length, the effective shade, and an assumption of solar insolation of 480 kcal/d SHADE & HEAT STREAM INFORMATION RIPARIAN CODES -- LEFT BANK-- code only vegetation that CWS is responsible for RIPARIAN CODES -- RIGHT BANK-- code only vegetation that CWS is responsible for PROJECT Effective Shade (% ) Thermal Load Blocked (kcal/d) Segment Length (ft) Orientation (0 deg=n) Wetted Width (ft) NSDZ Width (ft) Channel Incision (ft) LB 0-15 ft LB ft LB 30-45ft LB ft LB ft LB ft LB ft LB ft LB ft RB 0-15 ft RB ft RB 30-45ft RB ft RB ft RB ft RB ft RB ft RB ft Bronson Creek Greenway % 6.3E Bronson Creek Greenway % 6.4E Bronson Creek Greenway % 6.6E Bronson Creek Greenway % 6.4E Bronson Creek Greenway % 5.8E Bronson Creek Greenway % 6.1E Bronson Creek Greenway % 4.4E Bronson Creek Greenway % 4.6E Bronson Creek Greenway % 4.4E Bronson Creek Greenway % 1.7E Bronson Creek Greenway % 5.5E Bronson Creek Greenway % 7.6E Bronson Creek Greenway % 1.2E Bronson Creek Greenway % 2.6E Bronson Creek Greenway % 2.8E Bronson Creek Greenway % 4.4E Bronson Creek Greenway % 4.2E Bronson Creek Greenway % 3.6E Bronson Creek Greenway % 4.9E Bronson Creek Greenway % 9.4E Bronson Creek Greenway % 2.2E Bronson Creek Greenway % 1.1E Bronson Creek Greenway % 2.9E Bronson Creek Greenway % 1.3E Bronson Creek Greenway % 1.3E Bronson Creek Greenway % 6.3E Bronson Creek Greenway % 6.2E Bronson Creek Greenway % 1.1E Bronson Creek Greenway % 1.7E Bronson Creek Greenway % 2.0E Bronson Creek Greenway % 5.9E Bronson Creek Greenway % 4.2E Bronson Creek Greenway % 6.8E Bronson Creek Greenway % 2.7E Bronson Creek Greenway % 2.6E Bronson Creek Greenway % 4.7E Bronson Creek Greenway % 1.1E Bronson Creek Greenway % 3.4E Bronson Creek Greenway % 3.4E Bronson Creek Greenway % 1.1E Bronson Creek Greenway % 3.2E Bronson Creek Greenway % 1.1E Bronson Creek Greenway % 2.2E Bronson Creek Greenway % 3.5E Bronson Creek Greenway % 2.3E Bronson Creek Greenway % 1.1E Annual Report 39
41 Table 3. Riparian Codes for Shade-a-Lator Inputs Height Density OH Code Source Description (m) (%) (m) 1000 CWS Not in project 0.0 0% CWS Forest fully vegetated % CWS Forest partially vegetated % CWS Forest partially vegetated % CWS No existing forest vegetation 0.0 0% CWS Wetland fully vegetated % CWS Wetland partially vegetated % CWS Wetland partially vegetated % CWS No existing wetland vegetation 0.0 0% Annual Report 40

42 Cedar Creek Stella Olsen Project Summary Site ID Acres Location Public property in Sherwood, OR, bisected by Cedar Creek in the Chicken Creek subbasin, and located just south of Pacific Hwy. Two riparian planting projects were conducted at this site one credited in 2004 and the other credited in Credits noted in this summary reflect the project conducted in Lat/Long , Stream Length 7,194 ft (total for 2004 and 2015 project) 2,027 ft (2015 only) Number of Plants Installed 98,763 (total from ) 21,873 (2015 only) Average Stream Width 14 ft. Initial Planting Year/Credit Year Thermal Benefits/Credits 2004/ / 2.3 (million kcal/day) Plant Communities Riparian Forest and Scrub Shrub (refer to the Site Assessment Report for additional information) Partners City of Sherwood and Friends of Trees Riparian Planting Activities Site preparation, targeted invasive species treatment, herbivore control, and riparian plantings Stream Enhancement Activities Large woody debris Project Map 2015 Annual Report 41
Site Plans, SWPPP Reviews, Checklists & Enforcement, OH MY!
 Site Plans, SWPPP Reviews, Checklists & Enforcement, OH MY! Project/Environmental/Regulatory Manager January 23, 2018 2018 MECA Improving MS4 Compliance Workshop Improving MS4 Compliance Good, Better,
In the proposed amendment below, text shown with underline is proposed to be added and text shown with strikethrough is proposed to be removed.
 ZOA-13-07 AN ORDINANCE TO AMEND, REENACT AND RECODIFY ARTICLES 13 AND 18 OF THE ARLINGTON COUNTY ZONING ORDINANCE TO DEFINE LARGE MEDIA SCREENS AS AUTOMATIC CHANGEABLE COPY SIGNS LARGER THAN 12 SQUARE
City. Faribault. Small Town Pride Big City Opportunities! March 20, 2017 Public Hearing
 City Faribault Of March 20, 2017 Public Hearing ZTA 3-17 Ordinance Amendments to Allow a) Raising/Keeping Chickens b) Raising/Keeping Honey Bees c) Prescribed Grazing to Control Noxious Weeds and Overgrown
Analysis of Background Illuminance Levels During Television Viewing
 Analysis of Background Illuminance Levels During Television Viewing December 211 BY Christopher Wold The Collaborative Labeling and Appliance Standards Program (CLASP) This report has been produced for
The National Traffic Signal Report Card: Highlights
 The National Traffic Signal Report Card: Highlights THE FIRST-EVER NATIONAL TRAFFIC SIGNAL REPORT CARD IS THE RESULT OF A PARTNERSHIP BETWEEN SEVERAL NTOC ASSOCIATIONS LED BY ITE, THE AMERICAN ASSOCIATION
TABLE OF CONTENTS [LETTER AGREEMENT]
![TABLE OF CONTENTS [LETTER AGREEMENT]](/thumbs/89/101183179.jpg "TABLE OF CONTENTS [LETTER AGREEMENT]") The Table of Contents, the footnotes, and the paragraph and subparagraph headings shown in brackets and bold print, are NOT part of the Document, but have been added for the convenience of the reader.
The Table of Contents, the footnotes, and the paragraph and subparagraph headings shown in brackets and bold print, are NOT part of the Document, but have been added for the convenience of the reader.
SECTION 5900 TRAFFIC SIGNALS CITY OF LEE S SUMMIT, MISSOURI DESIGN CRITERIA
 SECTION 5900 TRAFFIC SIGNALS CITY OF LEE S SUMMIT, MISSOURI DESIGN CRITERIA TABLE OF CONTENTS Section Title Page 5901 GENERAL... 2 5902 DESIGN CRITERIA... 2 5902.1 Codes and Standards... 2 5902.2 Signal
Village of Glenview Appearance Commission
 Village of Glenview Appearance Commission STAFF REPORT February 6, 2013 TO: Chairman and Appearance Commissioners FROM: Planning & Economic Development Department CASE MANAGER: Michelle House, Planner
Review of ACE Model for High Efficiency TVs Initiative
 May 2, 2013 REPORT #E13-256 Review of ACE Model for High Efficiency TVs Initiative Prepared by: Evergreen Economics 1020 SW Taylor Street, #680 Portland, OR 97205 Northwest Energy Efficiency Alliance PHONE
SYMPHONY OF THE RAINFOREST Part 2: Soundscape Saturation
 SYMPHONY OF THE RAINFOREST Part 2: Soundscape Saturation Time: One to two 45-minute class periods with homework. Objectives: The student will Analyze graphical soundscape saturation data to determine the
Alberta Electric System Operator
 Decision 21038-D01-2016 Downtown Calgary 138-kV Transmission System Reinforcement June 1, 2016 Alberta Utilities Commission Decision 21038-D01-2016 Downtown Calgary 138-kV Transmission System Reinforcement
Montezuma Wetlands Project Technical Review Team (TRT) Charter September 2002 (revised June 2008)
 Charter September 2002 (revised June 2008)") 1.0 INTRODUCTION Montezuma Wetlands Project Technical Review Team (TRT) Charter September 2002 (revised June 2008) This Charter Agreement ( the Charter ) is established in accordance with Special Condition
1.0 INTRODUCTION Montezuma Wetlands Project Technical Review Team (TRT) Charter September 2002 (revised June 2008) This Charter Agreement ( the Charter ) is established in accordance with Special Condition
New Solar Homes Partnership Flexible Installation Calculator User Guide
 New Solar Homes Partnership Flexible Installation Calculator User Guide Updated October 12, 2017 Table of Contents New Solar Homes Partnership Flexible Installation Calculator User Guide... 1 Introduction...
User Guide Stand-Alone Metering for OptiPlant
 User Guide Stand-Alone Metering for OptiPlant BAS-SVU030A-GB Table of Contents Introduction...4 General Features...5 User Interface...6 Top display area... 6 Bottom display area... 6 Main display area...
Before the Federal Communications Commission Washington, D.C ) ) ) ) ) ) ) ) ) REPORT ON CABLE INDUSTRY PRICES
 ) ) ) ) ) ) ) ) REPORT ON CABLE INDUSTRY PRICES") Before the Federal Communications Commission Washington, D.C. 20554 In the Matter of Implementation of Section 3 of the Cable Television Consumer Protection and Competition Act of 1992 Statistical Report
Before the Federal Communications Commission Washington, D.C. 20554 In the Matter of Implementation of Section 3 of the Cable Television Consumer Protection and Competition Act of 1992 Statistical Report
GROWING VOICE COMPETITION SPOTLIGHTS URGENCY OF IP TRANSITION By Patrick Brogan, Vice President of Industry Analysis
 RESEARCH BRIEF NOVEMBER 22, 2013 GROWING VOICE COMPETITION SPOTLIGHTS URGENCY OF IP TRANSITION By Patrick Brogan, Vice President of Industry Analysis An updated USTelecom analysis of residential voice
OCC Installation Conduit Guidelines Excerpt from Optical Cable Corporation s INSTALLATION GUIDE
 Installation Conduit Guidelines Excerpt from Optical Cable Corporation s INSTALLATION GUIDE Conduit Installation A conduit cable installation involves placement of one or more optical cables inside a preinstalled
APPLICATION AND EFFECTIVENESS OF THE SEA DIRECTIVE (DIRECTIVE 2001/42/EC) 1. Legal framework CZECH REPUBLIC LEGAL AND ORGANISATIONAL ARRANGEMENTS 1
 1. Legal framework CZECH REPUBLIC LEGAL AND ORGANISATIONAL ARRANGEMENTS 1") APPLICATION AND EFFECTIVENESS OF THE SEA DIRECTIVE (DIRECTIVE 2001/42/EC) CZECH REPUBLIC LEGAL AND ORGANISATIONAL ARRANGEMENTS 1 This summary provides basic information on the legal, administrative and
APPLICATION AND EFFECTIVENESS OF THE SEA DIRECTIVE (DIRECTIVE 2001/42/EC) CZECH REPUBLIC LEGAL AND ORGANISATIONAL ARRANGEMENTS 1 This summary provides basic information on the legal, administrative and
City of Palm Coast 2016 Capital Projects Timeline - 1st Quarter
 CAPITAL PROJECTS FUND Seminole Woods Path Sesame-Seminole to Selma Tr (south) Design, Permits, Env. Clearance, CDBG Release TIMELINE TIMELINE TIMELINE PROJECTED Q1-3 Q1-3 Sesame - Selma Tr (south) to Citation/Seminole
Set-Top-Box Pilot and Market Assessment
 Final Report Set-Top-Box Pilot and Market Assessment April 30, 2015 Final Report Set-Top-Box Pilot and Market Assessment April 30, 2015 Funded By: Prepared By: Alexandra Dunn, Ph.D. Mersiha McClaren,
An Assessment of Options for the Future of Brockton s Desalination Facility
 An Assessment of Options for the Future of Brockton s Desalination Facility Authors: Alex Gaines, Amanda Rodriguez, Carla Romo, Mike Kane Advisors: Jennifer dewinter, Seth Tuler Sponsor: Marcus Gay, NEWIN
MINNEHAHA COUNTY ON-SITE WASTEWATER TREATMENT SITE EVALUATION WORKSHEET Form #1. Land Owner. Legal Description
 MINNEHAHA COUNTY ON-SITE WASTE TREATMENT SITE EVALUATION WORKSHEET Form #1 Land Owner Legal Description Type of Structure (check one): Residence Commercial Industrial Accessory Building Other If Residence:
First Year Evaluation Report for PDAE Grant Accentuating Music, Language and Cultural Literacy through Kodály Inspired Instruction
 First Year Evaluation Report for PDAE Grant Accentuating Music, Language and Cultural Literacy through Kodály Inspired Instruction Developed for the USD #259 Wichita, Kansas Public Schools and the U.S.
ATTACHMENT 2: SPECIFICATION FOR SEWER CCTV VIDEO INSPECTION
 ATTACHMENT 2: SPECIFICATION FOR SEWER CCTV VIDEO INSPECTION 1.0 General 1.1 The work covered by this section consists of providing all labor, equipment, insurance, accessories, tools, transportation, supplies,
GROUNDWATER MONITORING DATA RELEASE 2011 SAMPLING EVENT HARSHAW CHEMICAL COMPANY FUSRAP SITE
 GROUNDWATER MONITORING DATA RELEASE 2011 SAMPLING EVENT HARSHAW CHEMICAL COMPANY FUSRAP SITE U.S. Army Corps of Engineers Building Strong Buffalo District April 2012 Formerly Utilized Sites Remedial Action
Official Journal L 191, 23/07/2009 P
 Commission Regulation (EC) No 642/2009 of 22 July 2009 implementing Directive 2005/32/EC of the European Parliament and of the Council with regard to ecodesign requirements for televisions Text with EEA
The Executive Summary of Senate Bill 2106
 Overview Thanks to the leadership provided by Senator Garrett and Representative Daniel Biss, Senate Bill 2106 is a huge boon for small businesses, local governments, the environment and residents of the
Cotton Boll Weevil Control Act
 Cotton Boll Weevil Control Act Provides for the establishment of control districts, organic cotton regulations, collection of assessments and abolishment of control districts. 76-6A-1. Short title. Chapter
Integrated Precision Harvesting System: A Promising Technology to Improve Berry Yield and Quality. Precision Agriculture Research Team
 Integrated Precision Harvesting System: A Promising Technology to Improve Berry Yield and Quality Precision Research Team Objectives Develop improved integrated harvesting management systems = coupling
Licensing & Regulation #379
 Licensing & Regulation #379 By Anita Gallucci I t is about three years before your local cable operator's franchise is to expire and your community, as the franchising authority, receives a letter from
Cover Sheet In-Lieu Fee Program Proposal Procedures Draft Prospectus/Prospectus March, 2011
 Cover Sheet In-Lieu Fee Program Proposal Procedures Draft Prospectus/Prospectus March, 2011 Section I - General Information This package provides procedures and information to initiate the development
A Research Report by the Book Industry Environmental Council Prepared by Green Press Initiative
 BOOK INDUSTRY ENVIRONMENTAL TRENDS 206 A Research Report by the Book Industry Environmental Council Prepared by Green Press Initiative INTRODUCTION AND EXECUTIVE SUMMARY Tracking environmental trends in
Laurance Lake Temperature Model
 Portland State University PDXScholar Civil and Environmental Engineering Faculty Publications and Presentations Civil and Environmental Engineering 6-2 Laurance Lake Temperature Model Chris Berger Portland
AltaLink Management Ltd.
 Decision 21317-D01-2016 Central Alberta Underground Fibre Optic Build July 12, 2016 Alberta Utilities Commission Decision 21317-D01-2016 Central Alberta Underground Fibre Optic Build Proceeding 21317 Application
Planning & Zoning Commission Meeting Date: June 18, 2012
 Department of Planning and Research City of League City Planning & Zoning Commission Meeting Date: June 18, 2012 Requests Zoning Change Z12-04 (Lucas Construction) Rezone approximately 0.92 acres from
Unofficial Comment Form Project Establish and Communicate System Operating Limits (SOL and SOL Exceedance Definitions)
") Unofficial Comment Form Project 2015-09 Establish and Communicate System Operating Limits (SOL and SOL Exceedance Definitions) Do not use this form for submitting comments. Use the electronic form to submit
Unofficial Comment Form Project 2015-09 Establish and Communicate System Operating Limits (SOL and SOL Exceedance Definitions) Do not use this form for submitting comments. Use the electronic form to submit
1 Power Protection and Conditioning
 Power Protection and Conditioning MCR Hardwired Series Power Line Conditioning with Voltage Regulation The MCR Hardwired Series provides excellent noise filtering and surge protection to safeguard connected
Planning Commission Staff Report Street Vacation Hearing Date: December 11, 2013
 Planning Commission Staff Report Street Vacation Hearing Date: December 11, 2013 ITEM 3* Tara Riddle, as agent for Provo City Corporation, requests approval of a street vacation of North 250 West from
TITLE OF PROJECT: 2004 Processing Pea Cultivar Evaluation
 TITLE OF PROJECT: 2004 Processing Pea Cultivar Evaluation PEA04-1 NAME OF CONTRIBUTOR(S) AND THEIR AGENCY: J.W. Zandstra and R.C. Squire, Ridgetown College, University of Guelph. Ridgetown ON. N0P 2C0
ELIGIBLE INTERMITTENT RESOURCES PROTOCOL
 FIRST REPLACEMENT VOLUME NO. I Original Sheet No. 848 ELIGIBLE INTERMITTENT RESOURCES PROTOCOL FIRST REPLACEMENT VOLUME NO. I Original Sheet No. 850 ELIGIBLE INTERMITTENT RESOURCES PROTOCOL Table of Contents
DISCLAIMER. This document is current at the date of downloading. Hunter Water may update this document at any time.
 DISCLAIMER This Standard Technical Specification was developed by Hunter Water to be used for construction or maintenance of water and/or sewerage works that are to become the property of Hunter Water.
2013 Environmental Monitoring, Evaluation, and Protection (EMEP) Citation Analysis
 Citation Analysis") 2013 Environmental Monitoring, Evaluation, and Protection (EMEP) Citation Analysis Final Report Prepared for: The New York State Energy Research and Development Authority Albany, New York Patricia Gonzales
2013 Environmental Monitoring, Evaluation, and Protection (EMEP) Citation Analysis Final Report Prepared for: The New York State Energy Research and Development Authority Albany, New York Patricia Gonzales
About Us. Agenda 11/12/2014. Maximizing Benefits from Telephone and Cable Agreements. Municipal Association of South Carolina November 12, 2014
 Maximizing Benefits from Telephone and Cable Agreements Municipal Association of South Carolina November 12, 2014 About Us McLean Engineering Company Established 1936 78 years working to help municipals
Image Contrast Enhancement (ICE) The Defining Feature. Author: J Schell, Product Manager DRS Technologies, Network and Imaging Systems Group
 The Defining Feature. Author: J Schell, Product Manager DRS Technologies, Network and Imaging Systems Group") WHITE PAPER Image Contrast Enhancement (ICE) The Defining Feature Author: J Schell, Product Manager DRS Technologies, Network and Imaging Systems Group Image Contrast Enhancement (ICE): The Defining Feature
WHITE PAPER Image Contrast Enhancement (ICE) The Defining Feature Author: J Schell, Product Manager DRS Technologies, Network and Imaging Systems Group Image Contrast Enhancement (ICE): The Defining Feature
subplots (30-m by 33-m) without space between potential subplots. Depending on the size of the
 without space between potential subplots. Depending on the size of the") REM-S-13-00090 Online Supplemental Information Pyke et al. Appendix I Subplot Selection within Arid SageSTEP whole plots Each of the four whole plots (fuel reduction treatments) was gridded into potential
REM-S-13-00090 Online Supplemental Information Pyke et al. Appendix I Subplot Selection within Arid SageSTEP whole plots Each of the four whole plots (fuel reduction treatments) was gridded into potential
Fieldbus Testing with Online Physical Layer Diagnostics
 Technical White Paper Fieldbus Testing with Online Physical Layer Diagnostics The significant benefits realized by the latest fully automated fieldbus construction & pre-commissioning hardware, software
Upgrade of 450/550 MHz Cable Systems to 600 MHz Using a Phase Area Approach. Robb Balsdon Vice President, Engineering Services Rogers Engineering
 Upgrade of 45/55 MHz Cable Systems to 6 MHz Using a Phase Area Approach Robb Balsdon Vice President, Engineering Services Rogers Engineering ABSTRACT This paper reviews the issues that Rogers considered
EUROPEAN COMMISSION. Brussels, 16/07/2008 C (2008) State aid N233/08 Latvia Latvian film support scheme 1. SUMMARY
 State aid N233/08 Latvia Latvian film support scheme 1. SUMMARY") EUROPEAN COMMISSION Brussels, 16/07/2008 C (2008) 3542 PUBLIC VERSION WORKING LANGUAGE This document is made available for information purposes only. Dear Sir Subject: State aid N233/08 Latvia Latvian
EUROPEAN COMMISSION Brussels, 16/07/2008 C (2008) 3542 PUBLIC VERSION WORKING LANGUAGE This document is made available for information purposes only. Dear Sir Subject: State aid N233/08 Latvia Latvian
Minutes of the Planning Board of the Township Of Hanover JULY 28, Board Secretary, Kimberly Bongiorno took the Roll Call.
 Page 1 of 7 Minutes of the Planning Board of the Township Of Hanover Chairman Robert Nardone called the Work Session Meeting to order at 7:07PM in Conference Room A and The Open Public Meetings Act Statement
REDUCING DYNAMIC POWER BY PULSED LATCH AND MULTIPLE PULSE GENERATOR IN CLOCKTREE
 Available Online at www.ijcsmc.com International Journal of Computer Science and Mobile Computing A Monthly Journal of Computer Science and Information Technology IJCSMC, Vol. 3, Issue. 5, May 2014, pg.210
Interface Practices Subcommittee SCTE STANDARD SCTE Composite Distortion Measurements (CSO & CTB)
") Interface Practices Subcommittee SCTE STANDARD Composite Distortion Measurements (CSO & CTB) NOTICE The Society of Cable Telecommunications Engineers (SCTE) / International Society of Broadband Experts
Interface Practices Subcommittee SCTE STANDARD Composite Distortion Measurements (CSO & CTB) NOTICE The Society of Cable Telecommunications Engineers (SCTE) / International Society of Broadband Experts
REPORT TO THE PLANNING COMMISSION
 REPORT TO THE PLANNING COMMISSION Meeting Date: May 13, 2015 Application: Design Review PDR15-0006 Location / APN: Near 19700 Prospect Road / 386-35-070 Owner / Applicant: Staff Planner: City of Saratoga
International Journal of Emerging Technologies in Computational and Applied Sciences (IJETCAS)
") International Association of Scientific Innovation and Research (IASIR) (An Association Unifying the Sciences, Engineering, and Applied Research) International Journal of Emerging Technologies in Computational
International Association of Scientific Innovation and Research (IASIR) (An Association Unifying the Sciences, Engineering, and Applied Research) International Journal of Emerging Technologies in Computational
Escorting / Supervision of service providers and contractors
 Escorting / Supervision of service providers and contractors PIN020 Operations Directorate 8 The Director of Operations 29/01/14 See Section 5 of this document - - 29/01/2016 29/01/2014 IPS Policy for
BPA s Network Open Season
 May 2009 Summary Welcome to the Twenty Second National Wind Coordinating Collaborative (NWCC) Transmission Update! Kevin Porter of Exeter Associates, Inc. led the April 21, 2009, Transmission Update conference
City of Palm Coast Capital Projects Timeline - 2nd Quarter CAPITAL PROJECTS FUND
 City of Palm Coast 2015 Capital Projects Timeline - 2nd Quarter The Infrastructure Team is tasked with tracking the one year project timeline every quarter to help facilitate and manage necessary resources
RF Safety Surveys At Broadcast Sites: A Basic Guide
 ENGINEERING EXTRA REPRINTED FROM FEB. 22, 2012 The News Source for Radio Managers and Engineers RF Safety Surveys At Broadcast Sites: A Basic Guide The Process of Measuring RF Safety Compliance Often Is
Safety Codes Council Conference Banff C Panel Discussion
 Safety Codes Council Conference Banff 2014 90 C Panel Discussion Tim Driscoll OBIEC Consulting Ltd. George Morlidge Fluor Canada Ltd. Scott Basinger Eaton Canada René Leduc Marex Canada Limited Perspectives
(6&2575(48,5(0(176)257$1.9(66(/6,135,1&(:,//,$06281'") 7+($1$/
7+($1$/ 1. PROBLEM ASSIGNED TO STUDENTS
 1. PROBLEM ASSIGNED TO STUDENTS 2. STUDENTS GROUPS FORMED 3.SUPERVISOR TEAMS ASSIGNED TO THE PERFORM LITERATURE REVIEW 1. PROPERTIES, USE AND ECONOMICS OF PRODUCT 2. PHYSICAL AND CHEMICAL PROPERTIES 3.
FROM: CITY MANAGER DEPARTMENT: ADMINISTRATIVE SERVICES SUBJECT: COST ANALYSIS AND TIMING FOR INTERNET BROADCASTING OF COUNCIL MEETINGS
 TO: HONORABLE CITY COUNCIL FROM: CITY MANAGER DEPARTMENT: ADMINISTRATIVE SERVICES DATE: FEBRUARY 3, 2003 CMR: 131:03 SUBJECT: COST ANALYSIS AND TIMING FOR INTERNET BROADCASTING OF COUNCIL MEETINGS RECOMMENDATION
WATER/RECYCLED FIFM Complex Works Assessment Sheet
 WATER/RECYCLED FIFM Complex Works Assessment Sheet Project Title / Name MAXIMO number: Case No: Criteria to identify complex FIFM for referral to Area Teams Comments 1. Is entry into a hydraulic asset
Table of Contents. Introduction...1 Welcome to the World of WeatherTRAK...1
 Table of Contents Introduction...1 Welcome to the World of WeatherTRAK...1 Chapter 1: Getting to Know Your WeatherTRAK ET plus...5 Overview of the Controller...6 Selecting and Adjusting the Settings...10
in the Howard County Public School System and Rocketship Education
 Technical Appendix May 2016 DREAMBOX LEARNING ACHIEVEMENT GROWTH in the Howard County Public School System and Rocketship Education Abstract In this technical appendix, we present analyses of the relationship
Review of the Comcast. Fort Collins Cable System. Technical Characteristics
 Review of the Comcast Fort Collins Cable System Technical Characteristics Prepared by: January 30, 2004 Dick Nielsen Senior Engineer CBG Communications, Inc. Introduction and Background CBG Communications,
LUPA Proposed Final Programmatic Agreement November 20, 2015
 1 2 3 4 5 6 7 8 9 10 11 12 13 14 15 16 17 18 19 20 21 22 23 24 25 26 27 28 29 30 31 32 33 34 35 36 37 38 39 40 41 42 43 44 45 46 PROPOSED FINAL PROGRAMMATIC AGREEMENT AMONG THE BUREAU OF LAND MANAGEMENT
DIGGERS HOTLINE. Midwest Fiber Networks, LLC. CALL : (414) OR TOLL FREE (800) MIDWESTFIBERNETWORKS
 OR TOLL FREE (800) MIDWESTFIBERNETWORKS") 24.75' 24.75' 24.75' 70' RESERVED 24.75' 47.08' 10' NTH 80TH 70' 30' 6' 14' 6' ROAD RESERVED PUBLIC UTILITY EASEMENT 33' 80' 52' BRADLEY ROAD 6' 30' INGRESS & EGRESS 20' 20' AVENUE BRADLEY ROAD 52' NO
24.75' 24.75' 24.75' 70' RESERVED 24.75' 47.08' 10' NTH 80TH 70' 30' 6' 14' 6' ROAD RESERVED PUBLIC UTILITY EASEMENT 33' 80' 52' BRADLEY ROAD 6' 30' INGRESS & EGRESS 20' 20' AVENUE BRADLEY ROAD 52' NO
HONEYWELL VIDEO SYSTEMS HIGH-RESOLUTION COLOR DOME CAMERA
 Section 00000 SECURITY ACCESS AND SURVEILLANCE HONEYWELL VIDEO SYSTEMS HIGH-RESOLUTION COLOR DOME CAMERA PART 1 GENERAL 1.01 SUMMARY The intent of this document is to specify the minimum criteria for the
Selecting Cables for Power over Ethernet
 Hitachi Cable America Inc. Selecting Cables for Power over Ethernet Factors to Consider when Selecting the Appropriate Cable 8/12/217 Ratio of Power Dissipated vs 1 Power over Ethernet Standards and applications
Real-time QC in HCHP seismic acquisition Ning Hongxiao, Wei Guowei and Wang Qiucheng, BGP, CNPC
 Chengdu China Ning Hongxiao, Wei Guowei and Wang Qiucheng, BGP, CNPC Summary High channel count and high productivity bring huge challenges to the QC activities in the high-density and high-productivity
GLX Project Green Line Extension Project. March 2, 2016 Public Meeting
 GLX Project Green Line Extension Project Presentation Overview Project Status Redesign Constraints Key Areas of Redesign Focus Q&A - Discussion Past Future Present 2 The Clock is Ticking... Day 36 and
Southwest Florida Water Management District
 Southwest Florida Water Management District Micro Irrigation System, Hernando. Photo by J.F. Ferguson The Southwest Florida Water Management District (District) does not discriminate on the basis of disability.
OUR CONSULTATION PROCESS WITH YOU
 OUR CONSULTATION PROCESS WITH YOU OneMusic Australia is consulting with you and would like to hear what you think. If you use music in your dance school, performance school, or are an instructor of either,
EVAPORATIVE COOLER. ...Simple Effective Inexpensive to operate Economical. MODEL EC2.5 EC to CFM Nominal Airflow
 ...Simple Effective Inexpensive to operate Economical The Saudi Factory for Air Conditioning Units No air cooled condenser needed No chiller or cooling tower needed No major control center No refrigerant
Licence for the transmission of digital terrestrial television multiplex service
 1 Wireless Telegraphy Act 2006 Licence for the transmission of digital terrestrial television multiplex service Date of Issue 6 July 2007 Licensee Company number (if a company) Registered address of Licensee
Township of Egg Harbor August 15, 2011 Planning Board
 Township of Egg Harbor August 15, 2011 Planning Board Solicitor: Engineer: Planner: Christopher Brown, Esq.(Ted Strickland, Esq., in attendance for Solicitor Brown) James Mott, P.E. (Mott and Associates),
QCTV PROGRAM REPORT. Council Chambers Presentation Audiovisual Systems. Member Cities: Andover, Anoka, Champlin, and Ramsey
 QCTV PROGRAM REPORT Council Chambers Presentation Audiovisual Systems Member Cities: Andover, Anoka, Champlin, and Ramsey Contents Executive Summary... 2 Systems Descriptions... 2 City of Andover... 3
IMS Brochure. Integrated Management System (IMS) of the ILF Group
 of the ILF Group") Br ochur e IMS Brochure Integrated Management System (IMS) of the ILF Group FOREWORD ILF Consulting Engineers always endeavours to precisely analyse the requests and needs of its customers and to subsequently
Br ochur e IMS Brochure Integrated Management System (IMS) of the ILF Group FOREWORD ILF Consulting Engineers always endeavours to precisely analyse the requests and needs of its customers and to subsequently
Low Power VLSI Circuits and Systems Prof. Ajit Pal Department of Computer Science and Engineering Indian Institute of Technology, Kharagpur
 Low Power VLSI Circuits and Systems Prof. Ajit Pal Department of Computer Science and Engineering Indian Institute of Technology, Kharagpur Lecture No. # 29 Minimizing Switched Capacitance-III. (Refer
Environmental Impact Statement (EIS)/ Section 106 Public Meeting Level 1 Concept Screening. May 16, 2017
/ Section 106 Public Meeting Level 1 Concept Screening. May 16, 2017") Environmental Impact Statement (EIS)/ Section 106 Public Meeting Level 1 Concept Screening May 16, 2017 Today s Agenda Project Overview Project Schedule Purpose and Need Level 1 Concept Screening Results
Environmental Impact Statement (EIS)/ Section 106 Public Meeting Level 1 Concept Screening May 16, 2017 Today s Agenda Project Overview Project Schedule Purpose and Need Level 1 Concept Screening Results
Notes Generator Verification SDT Project
 Notes Generator Verification SDT Project 2007-09 FERC Office 888 First Street, NE Washington, DC 20426 1. Administration a. The following were in attendance: Bob Snow, Cynthia Pointer, Lim Hansen, Keith
Attachment 2 Wastewater
 Attachment 2 Wastewater 1 Overview 11 Objective The objective of this attachment is to set the minimum controls for planning and implementing flow isolation / flow management (FIFM) to ensure the safety
Literature Review Exercise
 Literature Review Exercise Assignment Overview In this assignment you will review some of the scientific literature that covers the environmental science question you have identified in your Observations
Tech Paper. HMI Display Readability During Sinusoidal Vibration
 Tech Paper HMI Display Readability During Sinusoidal Vibration HMI Display Readability During Sinusoidal Vibration Abhilash Marthi Somashankar, Paul Weindorf Visteon Corporation, Michigan, USA James Krier,
CARLITE grain orien TEd ELECTRICAL STEELS
 CARLITE grain ORIENTED ELECTRICAL STEELS M-3 M-4 M-5 M-6 Product d ata Bulletin Applications Potential AK Steel Oriented Electrical Steels are used most effectively in transformer cores having wound or
The University of Texas at Austin September 30, 2011
 SECTION 27 08 20 COPPER TESTING PART 1 - GENERAL 1.1 SUMMARY A. Test measurements shall be taken for all balanced-twisted pair cabling, including horizontal and backbone copper cables and wall-to-rack
Interface Practices Subcommittee SCTE STANDARD SCTE Measurement Procedure for Noise Power Ratio
 Interface Practices Subcommittee SCTE STANDARD SCTE 119 2018 Measurement Procedure for Noise Power Ratio NOTICE The Society of Cable Telecommunications Engineers (SCTE) / International Society of Broadband
APPENDIX D TECHNOLOGY. This Appendix describes the technologies included in the assessment
 APPENDIX D TECHNOLOGY This Appendix describes the technologies included in the assessment and comments upon some of the economic factors governing their use. The technologies described are: coaxial cable
Welcome SIGN CODE UPDATE
 Welcome SIGN CODE UPDATE PUBLIC MEETING Aztlan Community Center Thursday, May 24, 2018 Community Room 5:30 7:30 PM 112 E Willow Street, Fort Collins *Brief orientation at 6:00 PM* PROCESS AND HOW TO PARTICIPATE
Writing Style Guide of the Geography Earth Science Department Shippensburg University
 Writing Style Guide of the Geography Earth Science Department Shippensburg University By Geography-Earth Science Department Faculty February 11, 2015 DRAFT Table of Contents Section Page Introduction:
Guatemala Capital Area Digital Telephone Network Improvement and Expansion Project
 Guatemala Capital Area Digital Telephone Network Improvement and Expansion Project 1. Project Profile and Japan s ODA Loan Report date: March 2001 Field survey: August 2000 Project site Site Map: Guatemala
Roads Analysis Report
 United States Department of Agriculture Forest Service Jan. 2002 Roads Analysis Report Deep Project Area Deep Creek Watershed Paulina Ranger District Ochoco National Forest Crook County, Oregon 1 Introduction
Other funding sources. Amount requested/awarded: $200,000 This is matching funding per the CASC SCRI project
 FINAL PROJECT REPORT Project Title: Robotic scout for tree fruit PI: Tony Koselka Organization: Vision Robotics Corp Telephone: (858) 523-0857, ext 1# Email: tkoselka@visionrobotics.com Address: 11722
Official Journal of the European Union L 82/3 DECISIONS COMMISSION
 28.3.2009 Official Journal of the European Union L 82/3 II (Acts adopted under the EC Treaty/Euratom Treaty whose publication is not obligatory) DECISIONS COMMISSION COMMISSION DECISION of 12 March 2009
REQUEST FOR PROPOSALS: FOR AN INTEGRATED IN-CAR AND BODY-WORN VIDEO MANAGEMENT SYSTEM
 REQUEST FOR PROPOSALS: FOR AN INTEGRATED IN-CAR AND BODY-WORN VIDEO MANAGEMENT SYSTEM Addendum #1 Responses to Vendor Questions August 17, 2017 El Centro Police Department John Seaman, Sergeant Question
EPC GaN FET Open-Loop Class-D Amplifier Design Final Report 7/10/2017
 Problem Statement Define, Design, Develop and Characterize an Open-Loop Stereo Class-D Amplifier using the EPC GaN FET Technology and Devices for the purpose of providing an entry-level evaluation for
AN EXPERIMENT WITH CATI IN ISRAEL
 Paper presented at InterCasic 96 Conference, San Antonio, TX, 1996 1. Background AN EXPERIMENT WITH CATI IN ISRAEL Gad Nathan and Nilufar Aframian Hebrew University of Jerusalem and Israel Central Bureau
Informational Panel: Current Trends and Future of NetZero Building
 Informational Panel: Current Trends and Future of NetZero Building Panelists: Kiere DeGrandchamp President, High Performance Homes Ellen Larson Vaughan Policy Director, High Performance Green Buildings
Lesson 7: Measuring Variability for Skewed Distributions (Interquartile Range)
") : Measuring Variability for Skewed Distributions (Interquartile Range) Student Outcomes Students explain why a median is a better description of a typical value for a skewed distribution. Students calculate
: Measuring Variability for Skewed Distributions (Interquartile Range) Student Outcomes Students explain why a median is a better description of a typical value for a skewed distribution. Students calculate
This document is meant purely as a documentation tool and the institutions do not assume any liability for its contents
 2009R0642 EN 12.09.2013 001.001 1 This document is meant purely as a documentation tool and the institutions do not assume any liability for its contents B COMMISSION REGULATION (EC) No 642/2009 of 22