Sector sampling. Nick Smith, Kim Iles and Kurt Raynor
|
|
|
- Clarence Pearson
- 5 years ago
- Views:
Transcription
1 Sector sampling Nick Smith, Kim Iles and Kurt Raynor Partly funded by British Columbia Forest Science Program, Canada; Western Forest Products, Canada with support from ESRI Canada


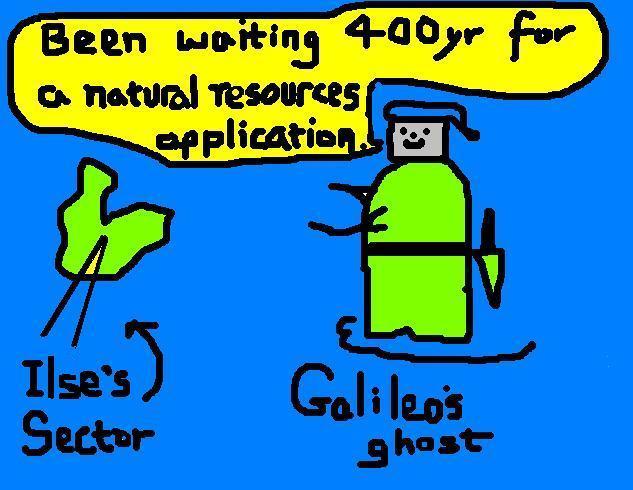
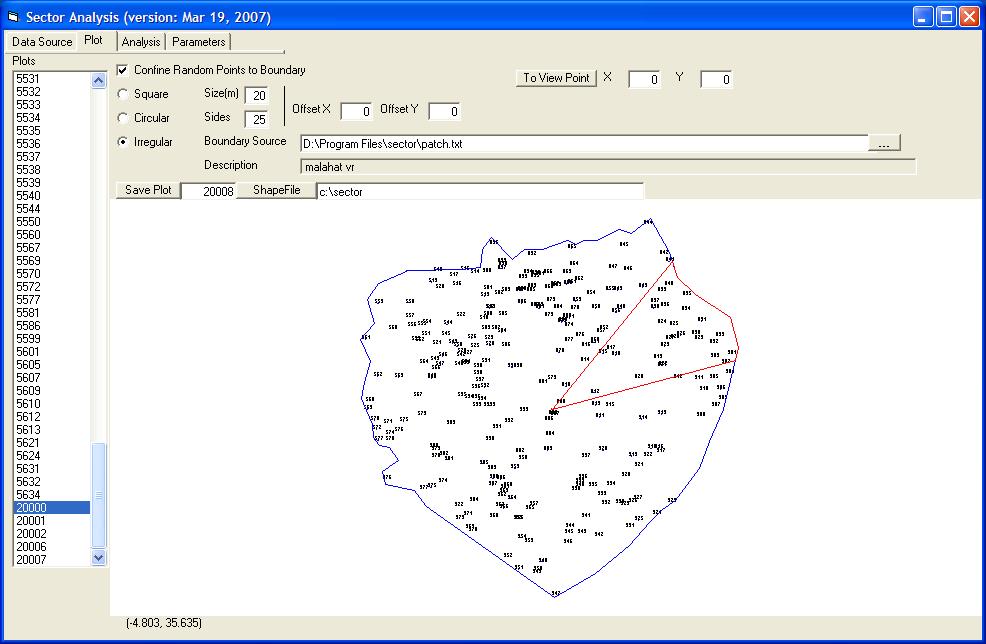
2 What do sector samples look like? Reduction to partial sectorreduced effort Harvest area edge 10% sample Pivot point Constant angle which has variable area Designed to sample objects inside small, irregular polygons Remaining group Named after Galileo s Sector
3
4 Probability of Selecting Each Tree from a Random Spin = (cumulative angular degrees in sectors)/360 o* Stand boundary Example: total degrees in sectors 36 o or 10% of a circle. tree b tree a For a complete revolution of the sectors, 10% of the total arc length that passes through each tree is swept within the sectors Sectors *= s/c (sector arc length/circumference)

5 The probability of selecting each tree is the same irrespective of where the pivot-point is located within the polygon Stand boundary
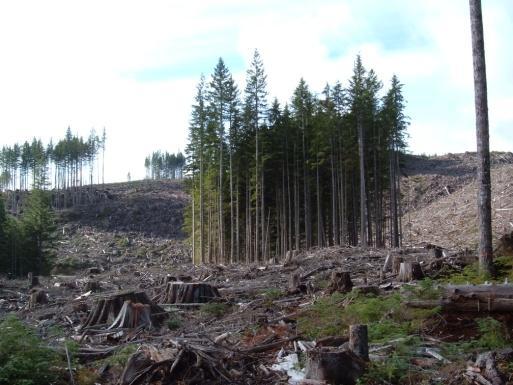
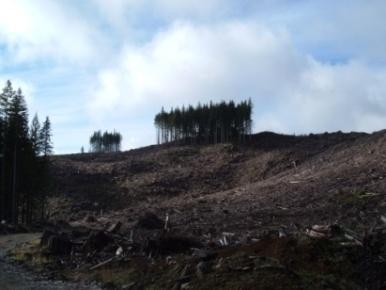
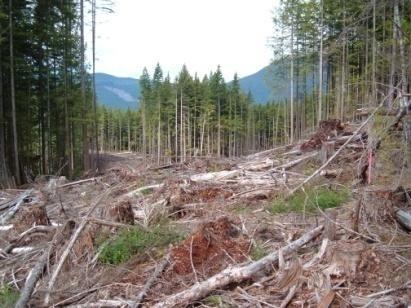
6 Background Designed to sample variable-retention (VR), a new forest harvesting approach in BC, Canada VR definition: half the harvested area within one tree length of a retained tree or group of trees Designed set of large scale experiments (100ha+) to look at impacts of VR


7 Experimental design:100ha Group Retention Dispersed Retention Group Size Group Removal Supplemental : 30ha Dispersed Retention Mixed Retention


8 Example of sector plot layout
9 Simulation Program


10 Two data sets Data used Variable retention patch PSP

11 Scenarios: Center of regular polygon Off-centre in regular polygon Irregular polygon Off-centre systematic
12 Simulation details Select pivot point Split into a large number of sequential sectors Resample for different sample sizes area,ha per sector basal area, m 2 /sector
13 Two Sorts of Data Tract totals and means (don t know area)-use Expansion Factor Unit area estimates e.g. ba/ha
14 Expansion factor For example total and mean patch basal area Expansion factor for the sample For each tree, e.g. 36 o is 36/360=10 Don t need areas Use ordinary statistics: means and variance
15 total basal area, m 2 /patch total basal area, m 2 /patch Expansion Factor sample size Totals Standard error sample size off-centre centre systematic off-centre centre systematic Estimates are unbiased A systematic arrangement reduces variance Systematic sample as good as putting in the centre
16 Unit area estimates Two approaches 1. Random angles (ROM) E.g. (Basal area)/(hectares) weights sectors proportional to sector area 2. Random points (MOR) probability proportional to sector size (importance sampling)


17 Per unit area estimates Random angle Random point Ratio of means Use usual ratio of means formulas Mean of ratios Use standard formulas
18 Random point selection is more efficient (standard error)/mean, % group size sample size Sector selection Random angle (real) Random points
19 Ratio estimator: no advantage to using systematic 100 coefficient of variation sample size Expansion factor-random Expansion factor-systematic Ratio estimator-random Ratio estimator-systematic Systematic approach:antithetic variates
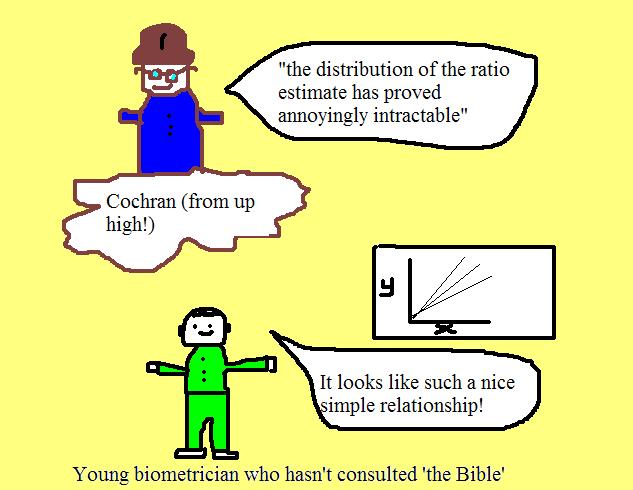
20 Ratio estimation bias basal area, m 2 /ha sample size Corrections: e.g. Hartley Rao and Mickey Means can be highly variable and biased for small sample size off center centre off centre-systematic
21
22 Ratio Data Properties Often positively skewed (small areas) basal area, m 2 patch count basal area, m 2 ha sector size, m 2 ha
23 basal area/ha: S 2 or S Ratio variance is biased for small bias SD SE sample size sample sizes Population from population variance (N= 1000 sectors) Population Actual Ratio of means Actual from resampled standard error for a given sample size, n 50 basal area/ha: S 2 or S SD SE sample size Population Actual Ratio of means Ratio of means resampled variance for each sample size, n

24 Bias in the standard error by sample size standard error bias percent sample size For small sample sizes actual se up to 40% larger Data set 2 Data set 1
25 Standard deviation, m 2 /ha Correct the SD bias: Raynor s method : Ŝ S sample size 2 Ordinary 0.84 Actual :green Ordinary Actual Ratio 2 ROM ( S S ) 2 ROM n Fitted line: black
26 CONCLUSIONS EXPANSION FACTOR AREA put in centre, and/or systematic sample (balanced) Small sample size ROM variance estimator biased: 1) Raynorize 2) Or avoid it (make bias very small) Can use systematic arrangement 3) Or use random points approach (mean of ratios variance estimator is unbiased)
27 Sub-sampling inside the Sector Sample Any plot shape can be used along a sector sample mid-line( ray ) Reasons For example: natural regeneration may be very dense You may simply prefer fixed area or perhaps prism plots
28 Example: fixed area plots Circular plots along a ray from the pivot-point plots Equal selection of plot center-line along random ray. Equal area plots: Selection probability is plot area divided by ring area. Relative Weight=distance from pivot-point
29 Computational cost: weights Each Ray Plots are weighted by distance from pivotpoint (plots at edge have greatest weighting) If plot overlaps boundary then trees in plots must have their selection probabilities corrected Combining Rays Random angle: ray averages are weighted by plot number Random point: no weighting is needed
30 Variance of weighted means When combining several rays using random angle selection Variance of weighted means: no exact solution Used (ba/ha*no plots)= total ba/ha per ray vs. no. plots per ray in a ROM approach: Mean =weighted ba/ha total ba/ha per ray number of plots per ray
31 Off-centre ray mean basal area m 2 /ha sample size standard error sample size Actual Population ROM
32 Random Point mean basal area m 2 /ha sample size standard error sample size Actual Population ROM Random Point v. Random Angle 50 Standard error m 2 /ha sample size Random Point Random Angle
33 Conclusions Fixed area plots can be used Easy to establish and measure Weighting/edge effect considerations by distance from pivot point edge trees, could use walk-through method combining rays: weighting by plot number per ray (not needed if random point selection) Other extensions: prism plots, line transects, etc.
Bootstrap Methods in Regression Questions Have you had a chance to try any of this? Any of the review questions?
 ICPSR Blalock Lectures, 2003 Bootstrap Resampling Robert Stine Lecture 3 Bootstrap Methods in Regression Questions Have you had a chance to try any of this? Any of the review questions? Getting class notes
AP Statistics Sec 5.1: An Exercise in Sampling: The Corn Field
 AP Statistics Sec.: An Exercise in Sampling: The Corn Field Name: A farmer has planted a new field for corn. It is a rectangular plot of land with a river that runs along the right side of the field. The
NAA ENHANCING THE QUALITY OF MARKING PROJECT: THE EFFECT OF SAMPLE SIZE ON INCREASED PRECISION IN DETECTING ERRANT MARKING
 NAA ENHANCING THE QUALITY OF MARKING PROJECT: THE EFFECT OF SAMPLE SIZE ON INCREASED PRECISION IN DETECTING ERRANT MARKING Mudhaffar Al-Bayatti and Ben Jones February 00 This report was commissioned by
StaMPS Persistent Scatterer Practical
 StaMPS Persistent Scatterer Practical ESA Land Training Course, Leicester, 10-14 th September, 2018 Andy Hooper, University of Leeds a.hooper@leeds.ac.uk This practical exercise consists of working through
COMP Test on Psychology 320 Check on Mastery of Prerequisites
 COMP Test on Psychology 320 Check on Mastery of Prerequisites This test is designed to provide you and your instructor with information on your mastery of the basic content of Psychology 320. The results
Estimating. Proportions with Confidence. Chapter 10. Copyright 2006 Brooks/Cole, a division of Thomson Learning, Inc.
 Estimating Chapter 10 Proportions with Confidence Copyright 2006 Brooks/Cole, a division of Thomson Learning, Inc. Principal Idea: Survey 150 randomly selected students and 41% think marijuana should be
unbiased , is zero. Yï) + iab Fuller and Burmeister [4] suggested the estimator: N =Na +Nb + Nab Na +NB =Nb +NA.
![unbiased , is zero. Yï) + iab Fuller and Burmeister [4] suggested the estimator: N =Na +Nb + Nab Na +NB =Nb +NA.](/thumbs/74/70099131.jpg "unbiased , is zero. Yï) + iab Fuller and Burmeister [4] suggested the estimator: N =Na +Nb + Nab Na +NB =Nb +NA.") RELTIVE EFFICIENCY OF SOME TWO -FRME ESTIMTORS H. Huang, Minnesota State Department of Education 1. Introduction In sample surveys, a complete frame is often unavailable or too expensive to construct.
RELTIVE EFFICIENCY OF SOME TWO -FRME ESTIMTORS H. Huang, Minnesota State Department of Education 1. Introduction In sample surveys, a complete frame is often unavailable or too expensive to construct.
STAT 113: Statistics and Society Ellen Gundlach, Purdue University. (Chapters refer to Moore and Notz, Statistics: Concepts and Controversies, 8e)
") STAT 113: Statistics and Society Ellen Gundlach, Purdue University (Chapters refer to Moore and Notz, Statistics: Concepts and Controversies, 8e) Learning Objectives for Exam 1: Unit 1, Part 1: Population
STAT 113: Statistics and Society Ellen Gundlach, Purdue University (Chapters refer to Moore and Notz, Statistics: Concepts and Controversies, 8e) Learning Objectives for Exam 1: Unit 1, Part 1: Population
What is Statistics? 13.1 What is Statistics? Statistics
 13.1 What is Statistics? What is Statistics? The collection of all outcomes, responses, measurements, or counts that are of interest. A portion or subset of the population. Statistics Is the science of
Frequencies. Chapter 2. Descriptive statistics and charts
 An analyst usually does not concentrate on each individual data values but would like to have a whole picture of how the variables distributed. In this chapter, we will introduce some tools to tabulate
UNIVERSITY OF CAMBRIDGE INTERNATIONAL EXAMINATIONS General Certificate of Education Ordinary Level
 UNIVERSITY OF CAMBRIDGE INTERNATIONAL EXAMINATIONS General Certificate of Education Ordinary Level *0192736882* STATISTICS 4040/12 Paper 1 October/November 2013 Candidates answer on the question paper.
Chapter 27. Inferences for Regression. Remembering Regression. An Example: Body Fat and Waist Size. Remembering Regression (cont.)
") Chapter 27 Inferences for Regression Copyright 2007 Pearson Education, Inc. Publishing as Pearson Addison-Wesley Slide 27-1 Copyright 2007 Pearson Education, Inc. Publishing as Pearson Addison-Wesley An
Chapter 27 Inferences for Regression Copyright 2007 Pearson Education, Inc. Publishing as Pearson Addison-Wesley Slide 27-1 Copyright 2007 Pearson Education, Inc. Publishing as Pearson Addison-Wesley An
StaMPS Persistent Scatterer Exercise
 StaMPS Persistent Scatterer Exercise ESA Land Training Course, Bucharest, 14-18 th September, 2015 Andy Hooper, University of Leeds a.hooper@leeds.ac.uk This exercise consists of working through an example
Modeling memory for melodies
 Modeling memory for melodies Daniel Müllensiefen 1 and Christian Hennig 2 1 Musikwissenschaftliches Institut, Universität Hamburg, 20354 Hamburg, Germany 2 Department of Statistical Science, University
Precision testing methods of Event Timer A032-ET
 Precision testing methods of Event Timer A032-ET Event Timer A032-ET provides extreme precision. Therefore exact determination of its characteristics in commonly accepted way is impossible or, at least,
Reliability. What We Will Cover. What Is It? An estimate of the consistency of a test score.
 Reliability 4/8/2003 PSY 721 Reliability 1 What We Will Cover What reliability is. How a test s reliability is estimated. How to interpret and use reliability estimates. How to enhance reliability. 4/8/2003
Mixed models in R using the lme4 package Part 2: Longitudinal data, modeling interactions
 Mixed models in R using the lme4 package Part 2: Longitudinal data, modeling interactions Douglas Bates 2011-03-16 Contents 1 sleepstudy 1 2 Random slopes 3 3 Conditional means 6 4 Conclusions 9 5 Other
EE241 - Spring 2013 Advanced Digital Integrated Circuits. Announcements. Lecture 14: Statistical timing Latches
 EE241 - Spring 2013 Advanced Digital Integrated Circuits Lecture 14: Statistical timing Latches Announcements Homework 3 posted this week, due after Spring break Quiz #2 today Midterm project report due
Other funding sources. Amount requested/awarded: $200,000 This is matching funding per the CASC SCRI project
 FINAL PROJECT REPORT Project Title: Robotic scout for tree fruit PI: Tony Koselka Organization: Vision Robotics Corp Telephone: (858) 523-0857, ext 1# Email: tkoselka@visionrobotics.com Address: 11722
Resampling Statistics. Conventional Statistics. Resampling Statistics
 Resampling Statistics Introduction to Resampling Probability Modeling Resample add-in Bootstrapping values, vectors, matrices R boot package Conclusions Conventional Statistics Assumptions of conventional
SEVENTH GRADE. Revised June Billings Public Schools Correlation and Pacing Guide Math - McDougal Littell Middle School Math 2004
 SEVENTH GRADE June 2010 Billings Public Schools Correlation and Guide Math - McDougal Littell Middle School Math 2004 (Chapter Order: 1, 6, 2, 4, 5, 13, 3, 7, 8, 9, 10, 11, 12 Chapter 1 Number Sense, Patterns,
Color Quantization of Compressed Video Sequences. Wan-Fung Cheung, and Yuk-Hee Chan, Member, IEEE 1 CSVT
 CSVT -02-05-09 1 Color Quantization of Compressed Video Sequences Wan-Fung Cheung, and Yuk-Hee Chan, Member, IEEE 1 Abstract This paper presents a novel color quantization algorithm for compressed video
Moving on from MSTAT. March The University of Reading Statistical Services Centre Biometrics Advisory and Support Service to DFID
 Moving on from MSTAT March 2000 The University of Reading Statistical Services Centre Biometrics Advisory and Support Service to DFID Contents 1. Introduction 3 2. Moving from MSTAT to Genstat 4 2.1 Analysis
AN EXPERIMENT WITH CATI IN ISRAEL
 Paper presented at InterCasic 96 Conference, San Antonio, TX, 1996 1. Background AN EXPERIMENT WITH CATI IN ISRAEL Gad Nathan and Nilufar Aframian Hebrew University of Jerusalem and Israel Central Bureau
International Comparison on Operational Efficiency of Terrestrial TV Operators: Based on Bootstrapped DEA and Tobit Regression
 , pp.154-159 http://dx.doi.org/10.14257/astl.2015.92.32 International Comparison on Operational Efficiency of Terrestrial TV Operators: Based on Bootstrapped DEA and Tobit Regression Yonghee Kim 1,a, Jeongil
Chapter 3. Averages and Variation
 Chapter 3 Averages and Variation Understandable Statistics Ninth Edition By Brase and Brase Prepared by Yixun Shi Bloomsburg University of Pennsylvania Measures of Central Tendency We use the term average
MATH 214 (NOTES) Math 214 Al Nosedal. Department of Mathematics Indiana University of Pennsylvania. MATH 214 (NOTES) p. 1/3
 Math 214 Al Nosedal. Department of Mathematics Indiana University of Pennsylvania. MATH 214 (NOTES) p. 1/3") MATH 214 (NOTES) Math 214 Al Nosedal Department of Mathematics Indiana University of Pennsylvania MATH 214 (NOTES) p. 1/3 CHAPTER 1 DATA AND STATISTICS MATH 214 (NOTES) p. 2/3 Definitions. Statistics is
MATH 214 (NOTES) Math 214 Al Nosedal Department of Mathematics Indiana University of Pennsylvania MATH 214 (NOTES) p. 1/3 CHAPTER 1 DATA AND STATISTICS MATH 214 (NOTES) p. 2/3 Definitions. Statistics is
Best Pat-Tricks on Model Diagnostics What are they? Why use them? What good do they do?
 Best Pat-Tricks on Model Diagnostics What are they? Why use them? What good do they do? Before we get started feel free to download the presentation and file(s) being used for today s webinar. http://www.statease.com/webinar.html
Time Domain Simulations
 Accuracy of the Computational Experiments Called Mike Steinberger Lead Architect Serial Channel Products SiSoft Time Domain Simulations Evaluation vs. Experimentation We re used to thinking of results
Open Access Determinants and the Effect on Article Performance
 International Journal of Business and Economics Research 2017; 6(6): 145-152 http://www.sciencepublishinggroup.com/j/ijber doi: 10.11648/j.ijber.20170606.11 ISSN: 2328-7543 (Print); ISSN: 2328-756X (Online)
Set-Top-Box Pilot and Market Assessment
 Final Report Set-Top-Box Pilot and Market Assessment April 30, 2015 Final Report Set-Top-Box Pilot and Market Assessment April 30, 2015 Funded By: Prepared By: Alexandra Dunn, Ph.D. Mersiha McClaren,
2.1 Telephone Follow-up Procedure
 TELEPHONE SURVEY DEVELOPMENT ON THE CANADIAN LABOUR FORCE SURVEY 3. Douglas Drew and Richard G. 3aworski Statistics Canada Introduction A recently launched telephone survey development program at Statistics
Sample Analysis Design. Element2 - Basic Software Concepts (cont d)
") Sample Analysis Design Element2 - Basic Software Concepts (cont d) Samples per Peak In order to establish a minimum level of precision, the ion signal (peak) must be measured several times during the scan
Sample Analysis Design Element2 - Basic Software Concepts (cont d) Samples per Peak In order to establish a minimum level of precision, the ion signal (peak) must be measured several times during the scan
Experiment on adjustment of piano performance to room acoustics: Analysis of performance coded into MIDI data.
 Toronto, Canada International Symposium on Room Acoustics 203 June 9- ISRA 203 Experiment on adjustment of piano performance to room acoustics: Analysis of performance coded into MIDI data. Keiji Kawai
Homework 3 posted this week, due after Spring break Quiz #2 today Midterm project report due on Wednesday No office hour today
 EE241 - Spring 2013 Advanced Digital Integrated Circuits Lecture 14: Statistical timing Latches Announcements Homework 3 posted this week, due after Spring break Quiz #2 today Midterm project report due
Estimation of inter-rater reliability
 Estimation of inter-rater reliability January 2013 Note: This report is best printed in colour so that the graphs are clear. Vikas Dhawan & Tom Bramley ARD Research Division Cambridge Assessment Ofqual/13/5260
Proceedings of the 2010 Winter Simulation Conference B. Johansson, S. Jain, J. Montoya-Torres, J. Hugan, and E. Yücesan, eds.
 Proceedings of the 2010 Winter Simulation Conference B. Johansson, S. Jain, J. Montoya-Torres, J. Hugan, and E. Yücesan, eds. STATE ESTIMATION OF A SUPPLY CHAIN USING IMPROVED RESAMPLING RULES FOR PARTICLE
More About Regression
 Regression Line for the Sample Chapter 14 More About Regression is spoken as y-hat, and it is also referred to either as predicted y or estimated y. b 0 is the intercept of the straight line. The intercept
AP Statistics Sampling. Sampling Exercise (adapted from a document from the NCSSM Leadership Institute, July 2000).
.") AP Statistics Sampling Name Sampling Exercise (adapted from a document from the NCSSM Leadership Institute, July 2000). Problem: A farmer has just cleared a field for corn that can be divided into 100
AP Statistics Sampling Name Sampling Exercise (adapted from a document from the NCSSM Leadership Institute, July 2000). Problem: A farmer has just cleared a field for corn that can be divided into 100
UPDATE TO DOWNSTREAM FREQUENCY INTERLEAVING AND DE-INTERLEAVING FOR OFDM. Presenter: Rich Prodan
 UPDATE TO DOWNSTREAM FREQUENCY INTERLEAVING AND DE-INTERLEAVING FOR OFDM Presenter: Rich Prodan 1 CURRENT FREQUENCY INTERLEAVER 2-D store 127 rows and K columns N I data subcarriers and scattered pilots
THE USE OF RESAMPLING FOR ESTIMATING CONTROL CHART LIMITS
 THE USE OF RESAMPLING FOR ESTIMATING CONTROL CHART LIMITS Draft of paper published in Journal of the Operational Research Society, 50, 651-659, 1999. Michael Wood, Michael Kaye and Nick Capon Management
Processes for the Intersection
 7 Timing Processes for the Intersection In Chapter 6, you studied the operation of one intersection approach and determined the value of the vehicle extension time that would extend the green for as long
Quantitative methods
 Quantitative methods Week #7 Gergely Daróczi Corvinus University of Budapest, Hungary 23 March 2012 Outline 1 Sample-bias 2 Sampling theory 3 Probability sampling Simple Random Sampling Stratified Sampling
3rd takes a long time/costly difficult to ensure whole population surveyed cannot be used if the measurement process destroys the item
 1a Observation or measurement of every member of a population. 1.2 2nd 1b Two from: 1.2 3rd takes a long time/costly difficult to ensure whole population surveyed cannot be used if the measurement process
New Filling Pattern for SLS-FEMTO
 SLS-TME-TA-2009-0317 July 14, 2009 New Filling Pattern for SLS-FEMTO Natalia Prado de Abreu, Paul Beaud, Gerhard Ingold and Andreas Streun Paul Scherrer Institut, CH-5232 Villigen PSI, Switzerland A new
Multiple-point simulation of multiple categories Part 1. Testing against multiple truncation of a Gaussian field
 Multiple-point simulation of multiple categories Part 1. Testing against multiple truncation of a Gaussian field Tuanfeng Zhang November, 2001 Abstract Multiple-point simulation of multiple categories
homework solutions for: Homework #4: Signal-to-Noise Ratio Estimation submitted to: Dr. Joseph Picone ECE 8993 Fundamentals of Speech Recognition
 INSTITUTE FOR SIGNAL AND INFORMATION PROCESSING homework solutions for: Homework #4: Signal-to-Noise Ratio Estimation submitted to: Dr. Joseph Picone ECE 8993 Fundamentals of Speech Recognition May 3,
subplots (30-m by 33-m) without space between potential subplots. Depending on the size of the
 without space between potential subplots. Depending on the size of the") REM-S-13-00090 Online Supplemental Information Pyke et al. Appendix I Subplot Selection within Arid SageSTEP whole plots Each of the four whole plots (fuel reduction treatments) was gridded into potential
REM-S-13-00090 Online Supplemental Information Pyke et al. Appendix I Subplot Selection within Arid SageSTEP whole plots Each of the four whole plots (fuel reduction treatments) was gridded into potential
Box Plots. So that I can: look at large amount of data in condensed form.
 LESSON 5 Box Plots LEARNING OBJECTIVES Today I am: creating box plots. So that I can: look at large amount of data in condensed form. I ll know I have it when I can: make observations about the data based
Object selectivity of local field potentials and spikes in the macaque inferior temporal cortex
 Object selectivity of local field potentials and spikes in the macaque inferior temporal cortex Gabriel Kreiman 1,2,3,4*#, Chou P. Hung 1,2,4*, Alexander Kraskov 5, Rodrigo Quian Quiroga 6, Tomaso Poggio
Introductory Statistics. Lecture 1 Sinan Hanay
 Introductory Statistics Lecture 1 Sinan Hanay Image: wikipedia.org There are three kinds of lies: Image: wikipedia.org There are three kinds of lies: lies, Image: wikipedia.org There are three kinds of
Lecture 10: Release the Kraken!
 Lecture 10: Release the Kraken! Last time We considered some simple classical probability computations, deriving the socalled binomial distribution -- We used it immediately to derive the mathematical
WEB APPENDIX. Managing Innovation Sequences Over Iterated Offerings: Developing and Testing a Relative Innovation, Comfort, and Stimulation
 WEB APPENDIX Managing Innovation Sequences Over Iterated Offerings: Developing and Testing a Relative Innovation, Comfort, and Stimulation Framework of Consumer Responses Timothy B. Heath Subimal Chatterjee
Problem Points Score USE YOUR TIME WISELY USE CLOSEST DF AVAILABLE IN TABLE SHOW YOUR WORK TO RECEIVE PARTIAL CREDIT
 Stat 514 EXAM I Stat 514 Name (6 pts) Problem Points Score 1 32 2 30 3 32 USE YOUR TIME WISELY USE CLOSEST DF AVAILABLE IN TABLE SHOW YOUR WORK TO RECEIVE PARTIAL CREDIT WRITE LEGIBLY. ANYTHING UNREADABLE
DEFINITION OF VISUAL ACUITY*
 Brit. J. Ophthal. (1953), 37, 661. DEFINITION OF VISUAL ACUITY* BY M. GILBERT London IT is well known that different types of test object will give different measures of acuity in terms of the size of
Simulation Supplement B
 Simulation Supplement B Simulation Simulation: The act of reproducing the behavior of a system using a model that describes the processes of the system. Time Compression: The feature of simulations that
LCD and Plasma display technologies are promising solutions for large-format
 Chapter 4 4. LCD and Plasma Display Characterization 4. Overview LCD and Plasma display technologies are promising solutions for large-format color displays. As these devices become more popular, display
Edge-Aware Color Appearance. Supplemental Material
 Edge-Aware Color Appearance Supplemental Material Min H. Kim 1,2 Tobias Ritschel 3,4 Jan Kautz 2 1 Yale University 2 University College London 3 Télécom ParisTech 4 MPI Informatik 1 Color Appearance Data
DIFFERENTIAL CONDITIONAL CAPTURING FLIP-FLOP TECHNIQUE USED FOR LOW POWER CONSUMPTION IN CLOCKING SCHEME
 DIFFERENTIAL CONDITIONAL CAPTURING FLIP-FLOP TECHNIQUE USED FOR LOW POWER CONSUMPTION IN CLOCKING SCHEME Mr.N.Vetriselvan, Assistant Professor, Dhirajlal Gandhi College of Technology Mr.P.N.Palanisamy,
The H.263+ Video Coding Standard: Complexity and Performance
 The H.263+ Video Coding Standard: Complexity and Performance Berna Erol (bernae@ee.ubc.ca), Michael Gallant (mikeg@ee.ubc.ca), Guy C t (guyc@ee.ubc.ca), and Faouzi Kossentini (faouzi@ee.ubc.ca) Department
Sample Design and Weighting Procedures for the BiH STEP Employer Survey. David J. Megill Sampling Consultant, World Bank May 2017
 Sample Design and Weighting Procedures for the BiH STEP Employer Survey David J. Megill Sampling Consultant, World Bank May 2017 1. Sample Design for BiH STEP Employer Survey The sampling frame for the
Pitch correction on the human voice
 University of Arkansas, Fayetteville ScholarWorks@UARK Computer Science and Computer Engineering Undergraduate Honors Theses Computer Science and Computer Engineering 5-2008 Pitch correction on the human
BARB Establishment Survey Quarterly Data Report: Total Network
 BARB Establishment Survey Quarterly Data Report: Total Network Jan 2018 to Mar 2018 BARB ESTABLISHMENT SURVEY OF TV HOMES DATA PERIOD: QUARTERLY Jan - Mar 2018 Page 1 Contents Page Total Network (All Areas)
RANDOMIZED COMPLETE BLOCK DESIGN (RCBD) Probably the most used and useful of the experimental designs.
 Probably the most used and useful of the experimental designs.") Description of the Design RANDOMIZED COMPLETE BLOCK DESIGN (RCBD) Probably the most used and useful of the experimental designs. Takes advantage of grouping similar experimental units into blocks or replicates.
Description of the Design RANDOMIZED COMPLETE BLOCK DESIGN (RCBD) Probably the most used and useful of the experimental designs. Takes advantage of grouping similar experimental units into blocks or replicates.
Validity. What Is It? Types We Will Discuss. The degree to which an inference from a test score is appropriate or meaningful.
 Validity 4/8/2003 PSY 721 Validity 1 What Is It? The degree to which an inference from a test score is appropriate or meaningful. A test may be valid for one application but invalid for an another. A test
EFFECT OF REPETITION OF STANDARD AND COMPARISON TONES ON RECOGNITION MEMORY FOR PITCH '
 Journal oj Experimental Psychology 1972, Vol. 93, No. 1, 156-162 EFFECT OF REPETITION OF STANDARD AND COMPARISON TONES ON RECOGNITION MEMORY FOR PITCH ' DIANA DEUTSCH " Center for Human Information Processing,
Supplementary Figures Supplementary Figure 1 Comparison of among-replicate variance in invasion dynamics
 1 Supplementary Figures Supplementary Figure 1 Comparison of among-replicate variance in invasion dynamics Scaled posterior probability densities for among-replicate variances in invasion speed (nine replicates
Measuring Variability for Skewed Distributions
 Measuring Variability for Skewed Distributions Skewed Data and its Measure of Center Consider the following scenario. A television game show, Fact or Fiction, was canceled after nine shows. Many people
How Large a Sample? CHAPTER 24. Issues in determining sample size
 388 Resampling: The New Statistics CHAPTER 24 How Large a Sample? Issues in Determining Sample Size Some Practical Examples Step-Wise Sample-Size Determination Summary Issues in determining sample size
Normalization Methods for Two-Color Microarray Data
 Normalization Methods for Two-Color Microarray Data 1/13/2009 Copyright 2009 Dan Nettleton What is Normalization? Normalization describes the process of removing (or minimizing) non-biological variation
FIM INTERNATIONAL SURVEY ON ORCHESTRAS
 1st FIM INTERNATIONAL ORCHESTRA CONFERENCE Berlin April 7-9, 2008 FIM INTERNATIONAL SURVEY ON ORCHESTRAS Report By Kate McBain watna.communications Musicians of today, orchestras of tomorrow! A. Orchestras
A Statistical Framework to Enlarge the Potential of Digital TV Broadcasting
 A Statistical Framework to Enlarge the Potential of Digital TV Broadcasting Maria Teresa Andrade, Artur Pimenta Alves INESC Porto/FEUP Porto, Portugal Aims of the work use statistical multiplexing for
Comparison of Mixed-Effects Model, Pattern-Mixture Model, and Selection Model in Estimating Treatment Effect Using PRO Data in Clinical Trials
 Comparison of Mixed-Effects Model, Pattern-Mixture Model, and Selection Model in Estimating Treatment Effect Using PRO Data in Clinical Trials Xiaolei Zhou, 1,2 Jianmin Wang, 1 Jessica Zhang, 1 Hongtu
Why t? TEACHER NOTES MATH NSPIRED. Math Objectives. Vocabulary. About the Lesson
 Math Objectives Students will recognize that when the population standard deviation is unknown, it must be estimated from the sample in order to calculate a standardized test statistic. Students will recognize
abc Mark Scheme Statistics 3311 General Certificate of Secondary Education Higher Tier 2007 examination - June series
 abc General Certificate of Secondary Education Statistics 3311 Higher Tier Mark Scheme 2007 examination - June series Mark schemes are prepared by the Principal Examiner and considered, together with the
Self-Test and Adaptation for Random Variations in Reliability
 Self-Test and Adaptation for Random Variations in Reliability Kenneth M. Zick and John P. Hayes University of Michigan, Ann Arbor, MI USA August 31, 2010 Motivation Physical variation is increasing dramatically
Sampling Worksheet: Rolling Down the River
 Sampling Worksheet: Rolling Down the River Name: Part I A farmer has just cleared a new field for corn. It is a unique plot of land in that a river runs along one side. The corn looks good in some areas
Visual Color Matching under Various Viewing Conditions
 Visual Color Matching under Various Viewing Conditions Hitoshi Komatsubara, 1 * Shinji Kobayashi, 1 Nobuyuki Nasuno, 1 Yasushi Nakajima, 2 Shuichi Kumada 2 1 Japan Color Research Institute, 4-6-23 Ueno
SIMULATION OF PRODUCTION LINES THE IMPORTANCE OF BREAKDOWN STATISTICS AND THE EFFECT OF MACHINE POSITION
 ISSN 1726-4529 Int j simul model 7 (2008) 4, 176-185 Short scientific paper SIMULATION OF PRODUCTION LINES THE IMPORTANCE OF BREAKDOWN STATISTICS AND THE EFFECT OF MACHINE POSITION Ilar, T. * ; Powell,
Sampling Plans. Sampling Plan - Variable Physical Unit Sample. Sampling Application. Sampling Approach. Universe and Frame Information
 Sampling Plan - Variable Physical Unit Sample Sampling Application AUDIT TYPE: REVIEW AREA: SAMPLING OBJECTIVE: Sampling Approach Type of Sampling: Why Used? Check All That Apply: Confidence Level: Desired
156 B. J. Dunne, R. D. Nelson, and R. G. Jahn
 Journal of Scientific Exploration. Vol. 56 B. J. Dunne, R. D. Nelson, and R. G. Jahn Two major protocol variations have been explored, one employing remote operators, the other, multiple operators. In
Algebra I Module 2 Lessons 1 19
 Eureka Math 2015 2016 Algebra I Module 2 Lessons 1 19 Eureka Math, Published by the non-profit Great Minds. Copyright 2015 Great Minds. No part of this work may be reproduced, distributed, modified, sold,
Using DICTION. Some Basics. Importing Files. Analyzing Texts
 Some Basics 1. DICTION organizes its work units by Projects. Each Project contains three folders: Project Dictionaries, Input, and Output. 2. DICTION has three distinct windows: the Project Explorer window
Improving music composition through peer feedback: experiment and preliminary results
 Improving music composition through peer feedback: experiment and preliminary results Daniel Martín and Benjamin Frantz and François Pachet Sony CSL Paris {daniel.martin,pachet}@csl.sony.fr Abstract To
Nuclear Instruments and Methods in Physics Research A
 Nuclear Instruments and Methods in Physics Research A 623 (2) 24 29 Contents lists available at ScienceDirect Nuclear Instruments and Methods in Physics Research A journal homepage: www.elsevier.com/locate/nima
Variation in fibre diameter profile characteristics between wool staples in Merino sheep
 Variation in fibre diameter profile characteristics between wool staples in Merino sheep D.J. Brown 1,2,B.J.Crook 1 and I.W. Purvis 3 1 Animal Science, University of New England, Armidale, NSW 2351 2 Current
Analysis, Synthesis, and Perception of Musical Sounds
 Analysis, Synthesis, and Perception of Musical Sounds The Sound of Music James W. Beauchamp Editor University of Illinois at Urbana, USA 4y Springer Contents Preface Acknowledgments vii xv 1. Analysis
Reviews of earlier editions
 Reviews of earlier editions Statistics in medicine ( 1997 by John Wiley & Sons, Ltd. Statist. Med., 16, 2627Ð2631 (1997) STATISTICS AT SQUARE ONE. Ninth Edition, revised by M. J. Campbell, T. D. V. Swinscow,
BARB Establishment Survey Annual Data Report: Volume 1 Total Network and Appendices
 BARB Establishment Survey Annual Data Report: Volume 1 Total Network and Appendices Apr 2017 to Mar 2018 BARB ESTABLISHMENT SURVEY OF TV HOMES Page 1 DATA PERIOD: ANNUAL Apr 2017 - Mar 2018 Contents Page
Release Year Prediction for Songs
 Release Year Prediction for Songs [CSE 258 Assignment 2] Ruyu Tan University of California San Diego PID: A53099216 rut003@ucsd.edu Jiaying Liu University of California San Diego PID: A53107720 jil672@ucsd.edu
K ABC Mplus CFA Model. Syntax file (kabc-mplus.inp) Data file (kabc-mplus.dat)
 Data file (kabc-mplus.dat)") K ABC Mplus CFA Model Syntax file (kabc-mplus.inp) title: principles and practice of sem (4th ed.), rex kline two-factor model of the kabc-i, figure 9.7, table 13.1 data: file is "kabc-mplus.dat"; type
K ABC Mplus CFA Model Syntax file (kabc-mplus.inp) title: principles and practice of sem (4th ed.), rex kline two-factor model of the kabc-i, figure 9.7, table 13.1 data: file is "kabc-mplus.dat"; type
CONCLUSION The annual increase for optical scanner cost may be due partly to inflation and partly to special demands by the State.
 Report on a Survey of Changes in Total Annual Expenditures for Florida Counties Before and After Purchase of Touch Screens and A Comparison of Total Annual Expenditures for Touch Screens and Optical Scanners.
Human Hair Studies: II Scale Counts
 Journal of Criminal Law and Criminology Volume 31 Issue 5 January-February Article 11 Winter 1941 Human Hair Studies: II Scale Counts Lucy H. Gamble Paul L. Kirk Follow this and additional works at: https://scholarlycommons.law.northwestern.edu/jclc
Proceedings of Meetings on Acoustics
 Proceedings of Meetings on Acoustics Volume 19, 2013 http://acousticalsociety.org/ ICA 2013 Montreal Montreal, Canada 2-7 June 2013 Psychological and Physiological Acoustics Session 4aPPb: Binaural Hearing
Open loop tracking of radio occultation signals in the lower troposphere
 Open loop tracking of radio occultation signals in the lower troposphere S. Sokolovskiy University Corporation for Atmospheric Research Boulder, CO Refractivity profiles used for simulations (1-3) high
Reduced complexity MPEG2 video post-processing for HD display
 Downloaded from orbit.dtu.dk on: Dec 17, 2017 Reduced complexity MPEG2 video post-processing for HD display Virk, Kamran; Li, Huiying; Forchhammer, Søren Published in: IEEE International Conference on
STAT 250: Introduction to Biostatistics LAB 6
 STAT 250: Introduction to Biostatistics LAB 6 Dr. Kari Lock Morgan Sampling Distributions In this lab, we ll explore sampling distributions using StatKey: www.lock5stat.com/statkey. We ll be using StatKey,
Chapter 21. Margin of Error. Intervals. Asymmetric Boxes Interpretation Examples. Chapter 21. Margin of Error
 Context Part VI Sampling Accuracy of Percentages Previously, we assumed that we knew the contents of the box and argued about chances for the draws based on this knowledge. In survey work, we frequently
ELIGIBLE INTERMITTENT RESOURCES PROTOCOL
 FIRST REPLACEMENT VOLUME NO. I Original Sheet No. 848 ELIGIBLE INTERMITTENT RESOURCES PROTOCOL FIRST REPLACEMENT VOLUME NO. I Original Sheet No. 850 ELIGIBLE INTERMITTENT RESOURCES PROTOCOL Table of Contents
Published by O Reilly Media, Inc., 1005 Gravenstein Highway North, Sebastopol, CA
 Think Stats by Allen B. Downey Copyright 2011 Allen B. Downey. All rights reserved. Printed in the United States of America. Published by O Reilly Media, Inc., 1005 Gravenstein Highway North, Sebastopol,