Lecture 10: Release the Kraken!
|
|
|
- Jessica Black
- 5 years ago
- Views:
Transcription

1 Lecture 10: Release the Kraken!
2 Last time We considered some simple classical probability computations, deriving the socalled binomial distribution -- We used it immediately to derive the mathematical formula for the null distribution for Arbuthnot s test of hypothesis We then started in on the Normal distribution and examined a simple graphical device for assessing normality of a set of data, the Q-Q or quantile-quantile plot
3 Today We are going to start on estimation in earnest -- We are going to extend our toolkit of computational procedures and examine a simple way to assess uncertainty in estimates We will use as our main navigation point the sampling distribution of an estimate -- It is a fantasy that lets us think about a host of interesting questions These questions become answerable through something called the bootstrap, a procedure that will let us asses bias, compute standard errors, RMS and even confidence intervals
4 Statistics: Description As we noted in an early lecture (2 or 3?) a statistic is something computed from a data set -- Statistics server different purposes, however So far, we have seen descriptive statistics (the mean and median and interquartile range, say) that tell us something about a particular set of data > summary(enroll$tottime) Min. 1st Qu. Median Mean 3rd Qu. Max Here are a handful of descriptive statistics that helped us look at the number of minutes UCLA students spent in class per week last quarter
5 Statistics: Testing Test statistics are used to judge the adequacy of some null hypothesis and are often compared to a reference null distribution histogram of diffferences (tabs list) in average pv/visit, 1000 re randomizations At the right we recall the results of the NY TImes Travel Section experiment -- The test statistic was absolute difference in average page views per visit for New York Times readers who were show the Tabs versus Lists designs Using the experimental results, we computed a value of which was compared to the reference null distribution (here just simple differences) to see if the value we obtained could have arisen purely by chance Frequency differences (tabs list)
6 Statistics: Estimation Estimators are statistics computed from a random sample that are used to estimate the parameters a population distribution which we will denote generically with the greek letter θ In our CDC BRFSS telephone survey, for example, our parameter of interest might be the fraction of the adult population in the U.S. that is obese and we could estimate it using a proportion computed from the CDC sample
7 Statistics Note that statistics, the quantities we compute from data, can play different roles -- The same quantity can function as description, as the basis for a test or as an estimate of some quantity in the parent population The source of the data, its design, and the goals of our study suggest which of these different roles are sensible or desirable This lecture, we ll focus on estimates!
8 Random sampling Toward this end, we want to start looking at a statistical design other than random allocation into one or more treatments -- Specifically we will examine random sampling from a population and examine what we can infer about a population from a sample To be a little rigorous about this, we ll first spell out what we mean by a population...
9 Populations A population (at least for the purposes of this course) consists of a number of units or cases with three characteristics 1. They all have or could have values for variables we are interested in; 2. We are interested in learning something about the distribution of one or more variables across the population; and 3. The population is sufficiently well-defined that we can draw from it a random sample of cases (think placing some identifier for each case in a -- possibly enormous -- hat) There are several different kinds of populations -- A natural population, for example, is something larger than the study you re conducting and has a degree of permanence to it (the population of the U.S., all the employees of a company)
10 Populations A prospective population, on the other hand, is linked to one of our previously discussed experiments -- For example, suppose we draw a random sample from a group of people suffering from a particular disease (a natural population) and we randomize them to receive either the standard or a new therapy The two groups (standard and new therapy) are samples from different prospective populations -- Each prospective population consists of the same cases as in the associated natural population (the group of all patients suffering from the disease), but we pretend that all of them have received one or the other therapy This explains the term prospective because in truth only the patients in the sample receive the treatments being studied
11 Populations Constructed populations are as fully defined as a natural population but lack permanence and some exist solely to provide random samples -- For example, all of the students enrolled in the introductory courses in the psychology department of a given university might be used as a constructed population from which psych researchers draw samples for their various experiments The constructed population, then, is one that is easily sampled -- We hope that it is similar to some natural population that you would like to study (like all the students at the university or all college students) if you had the resources
12 Random samples Just like randomized allocation into treatment groups provided us with the ability to perform statistical tests, random sampling from populations will be the underlying motivation and justification of a collection of inferential procedures Forming a random sample from a population involves mimicking in some way the act of placing an identifier for each unit in the population into a hat and drawing a small sample The procedure used by the California Secretary of State for creating a randomized alphabet is a good mental model...
13 The Secretary of State shall conduct a drawing of the letters of the alphabet, the result of which shall be known as a randomized alphabet. The procedure shall be as follows: (a) Each letter of the alphabet shall be written on a separate slip of paper, each of which shall be folded and inserted into a capsule. Each capsule shall be opaque and of uniform weight, color, size, shape, and texture. The capsules shall be placed in a container, which shall be shaken vigorously in order to mix the capsules thoroughly. The container then shall be opened and the capsules removed at random one at a time. As each is removed, it shall be opened and the letter on the slip of paper read aloud and written down. The resulting random order of letters constitutes the randomized alphabet, which is to be used in the same manner as the conventional alphabet in determining the order of all candidates in all elections. For example, if two candidates with the surnames Campbell and Carlson are running for the same office, their order on the ballot will depend on the order in which the letters M and R were drawn in the randomized alphabet drawing. (b) (1) There shall be six drawings, three in each even-numbered year and three in each odd-numbered year. Each drawing shall be held at 11 a.m. on the date specified in this subdivision. The results of each drawing shall be mailed immediately to each county elections official responsible for conducting an election to which the drawing is applicable, who shall use it in determining the order on the ballot of the names of the candidates for office. (A) The first drawing under this subdivision shall take place on the 82nd day before the April general law city elections of an even-numbered year, and shall apply to those elections and any other elections held at the same time. (B) The second drawing under this subdivision shall take place on the 82nd day before the direct primary of an even-numbered year, and shall apply to all candidates on the ballot in that election. (C) (i) The third drawing under this subdivision shall take place on the 82nd day before the November general election of an even-numbered year, and shall apply to all candidates on the ballot in the November general election. (ii) In the case of the primary election and the November general election, the Secretary of State shall certify and transmit to each county elections official the order in which the names of federal and state candidates, with the exception of candidates for State Senate and Assembly, shall appear on the ballot. The elections official shall determine the order on the ballot of all other candidates using the appropriate randomized alphabet for that purpose. (D) The fourth drawing under this subdivision shall take place on the 82nd day before the March general law city elections of each odd-numbered year, and shall apply to those elections and any other elections held at the same time. (E) The fifth drawing under this subdivision shall take place on the 82nd day before the first Tuesday after the first Monday in June of each odd-numbered year, and shall apply to all candidates on the ballot in the elections held on that date. (F) The sixth drawing under this subdivision shall take place on the 82nd day before the first Tuesday after the first Monday in November of the oddnumbered year, and shall apply to all candidates on the ballot in the elections held on that date. (2) In the event there is to be an election of candidates to a special district, school district, charter city, or other local government body at the same time as one of the five major election dates specified in subparagraphs (A) to (F), inclusive, and the last possible day to file nomination papers for the local election would occur after the date of the drawing for the major election date, theprocedure set forth in Section shall apply. (c) Each randomized alphabet drawing shall be open to the public. At least 10 days prior to a drawing, the Secretary of State shall notify the news media and other interested parties of the date, time, and place of the drawing. The president of each statewide association of local officials with responsibilities for conducting elections shall be invited by the Secretary of State to attend each drawing or send a representative. The state chairman of each qualified political party shall be invited to attend or send a representative in the case of drawings held to determine the order of candidates on the primary election ballot, the November generalelection ballot, or a special election ballot as provided for in subdivision (d).
14 Random samples Reasoning like a classical probabilist, this means that if we have N objects in our population, the first selection assigns probability 1/N to each -- After the first item is identified, we have N-1 remaining, and select each with probability 1/(N-1) We have seen that the sample() command in R can be used to emulate this process using pseudo-random numbers
15 Random sampling Sometimes random selection is just this easy -- At the right, we have 10 calls to sample in R, each producing a sample() of 10 items from the population, the numbers from 1 to 100 We have already seen examples where sampling is much harder -- The CDC, for example, employs random digit dialing for the BRFSS (and an expanding set of techniques) to try to sample randomly from the adult U.S. population > sample(1:100,10) [1] > sample(1:100,10) [1] > sample(1:100,10) [1] > sample(1:100,10) [1] > sample(1:100,10) [1] > sample(1:100,10) [1] > sample(1:100,10) [1] > sample(1:100,10) [1] > sample(1:100,10) [1] > sample(1:100,10) [1]
16


17
18 The CDC again So let s pick up there for the moment... You looked at data from the BRFSS in lab and computed the BMI for the people in the sample and today we ll focus on the average BMI -- In R, we compute this to be 26.3 (25 is the threshold for Overweight ) > source(" > dim(cdc) [1] > bmi <- 703*(cdc$weight)/(cdc$height * cdc$height) > mean(bmi) [1] Our interest, of course, is not in the BMI of the 20,000 people in our sample, but instead what this number says about the average BMI computed over the adult population in the U.S. -- What can we say?
19 The frequentist approach Recall that the frequentist view of probability relies on repeated trials -- Probability emerges by looking at the long-run frequency of events We saw this idea when we tested simple hypotheses -- The null distribution consisted of a range of experimental outcomes that could have happened under the null hypothesis For estimation, we will again invoke this idea of repeated trials to come up with an indication of how accurate a statistic t is when estimating a population parameter θ
20 A repeatable process Our approach is based on a fairly simple idea -- Rather than thinking about our specific sample and the associated statistic (the 20,000 people in our BRFSS data and their average BMI t=26.3), let s consider our experiment as a repeatable process So, we can imagine the CDC repeating its sampling, coming up with another set of 20,000 people and computing a different (almost certainly) statistic t -- In fact, we can imagine (imagining is cheap!) doing it 10 times, 100 times, 1000 times...
21 Population θ Sample 1 Sample 100 Sample M Statistic t 1 Statistic t 100 Statistic t M
22 Random samples We know from the last two lectures how to count the number of samples we could draw from a given population -- That is, how many sets of size n from N elements we could form M = ( N n ) = N! n!(n n)! For even small population sizes N, this number becomes enormous > choose(100,10) [1] Yes, that s 17 trillion possible samples of size 10 from a population of 100 objects!
23 The sampling distribution t The set of estimates 1, t 2,...,t associated M with forming all possible M samples from our population is tknown as the sampling distribution -- Call our particular 1 estimate (the one we computed by conducting the CDC telephone surveys) Admittedly, this construction is a fantasy -- First off, the number of samples M we can form from even modestly-sized populations is enormous and, second, we would never actually repeat our experiment in this way But as a mental exercise, what does it buy us?
24 Bias Consider, for example, the center and spread of the sampling distribution, the values t 1, t 2,...,t -- The M center tells us whether or not our M estimates (again, each coming from a different sample of the population) are close to the population parameter we re interested in -- If, for example, their average 1 M M i=1 t i is far from, θthe population parameter, we say that the estimate is biased
25 Standard error t 1, t 2,...,t M The spread of the sampling distribution, the spread of the values, tells us about how our estimates change from sample to sample -- In most cases, we ll prefer having less rather than more variability when we repeat our experiments One measure of spread that is used in this context is the standard deviation of the values t -- It is so important, actually, that it has a special name, 1, t 2,...,t M and is called the standard error of our estimate
26 Root mean squared error You will often see bias referred to as a measure of accuracy and the standard error as a measure of precision -- Given a single data set, our estimate might be t 1 far from the parameter we re after because of either effect t 1 For example, may be far from because θ the sampling distribution is not centered on so θ that, on average (across all possible samples) our estimates are some distance from It might also be far because the sampling distribution is wide -- A large spread means more variability from sample to sample We can capture both effects with a quantity called the root mean squared error which is as much a sentence as it is a computational recipe 1 M (t i θ) M 2 i=1 You can show with a little algebra that 1 M M (t i θ) 2 = Bias 2 + SE 2 i=1
27 The bootstrap We ve been somewhat abstract for about 10 slides now, it s time to get practical -- We are now going to try to have a look at the sampling distribution, but without calling anyone or collecting any new data Our approach will be a fairly general methodology called the bootstrap -- The idea fits naturally with our strategy of analyze as you randomized, which, in this case, means drawing more samples
28 The bootstrap world Suppose we have a real world population of 1,000 people (say the population of Plymouth, CA) and we take a random sample of size We form a bootstrap world population by cloning each of our 100 data points 10 times to construct a set of size 1,000 In general, if we have a population of size N from which we draw a sample of size n, then we can create a bootstrap world population by copying each of the n items N/n times (assuming it divides evenly, but don t worry about this now)

29
30 The bootstrap world This new bootstrap world population is completely known to us and we can sample from it as often as we like -- It s still not practical to form all samples of size n from this new collection and so instead we look at a few thousand random samples and examine the distribution of the associated estimates Let s see what that means for our CDC data -- On the next page, we have formed 5,000 samples from the bootstrap world population and for each we have computed the mean BMI of the people in the sample To get some notation here, we ll let denote our 5,000 mean BMI numbers computed from each of the 5,000 t 1,...,t bootstrap 5000 samples -- we call these bootstrap replicates
31 Histogram of 5,000 bootstrap estimates replicates of the mean BMI Frequency bootstrap sample mean BMI
32 The bootstrap What we are looking at on the previous page is an approximation of the sampling distribution associated with the estimate of mean BMI -- Again, the sampling distribution describes what would happen if we repeated our experiment many times, drawing new samples from the real world population each time This distribution looks shockingly normal, a fact we ll come back to...
33 Normal Q Q Plot Theoretical Quantiles Sample Quantiles
34 A general principle Here is a simple sketch of the bootstrap procedure -- It falls under our general strategy of analyze as you randomized In terms of notation, we have been using to refer to the estimate computed from our actual sample -- From now on, in sympathy with the population parameter we are going to let θ the symbol refer to θ t 1 t 1 We will also use the notation s() to represent the computation of our estimate from a given set of data -- In R you can think of it like mean() or median() say
35 Real world Bootstrap world Real world parameter θ Bootstrap world parameter θ = t 1 Population of N items Population of N items based on copying x 1, x 2,...,x n Observed sample x 1, x 2,...,x n Bootstrap sample x 1, x 2,...,x n Bootstrap replicate Estimate t 1 = s(x 1,...,x n ) t = s(x 1,...,x n)
36 The bootstrap The bootstrap distribution (the distribution of the bootstrap replicates) is an approximation to the sampling distribution of the statistic we re interested in -- It is an approximation in the following senses: Shape: The bootstrap distribution approximates the shape of the sampling distribution, allowing you to check normality Center: In most cases, the bootstrap distribution will be centered on the estimate from the original θ sample -- If it is not, we have evidence that our estimate is biased Spread: We can estimate the standard error of by θ the standard deviation of the bootstrap distribution
37 The bootstrap To see broadly what s going on here, suppose instead of 20,000 people, the CDC talked to 2,000 or even just What do you expect would happen to the sampling distribution? On the next two pages we took a subsample of the CDC data set, one of 2,000 and one of By ignoring the remaining data, we can pretend that the CDC only conducted surveys of 2,000 and 200 people respectively Then, for example, in the case of a survey of size 200, we create the bootstrap world population and construct 5,000 bootstrap samples, each of size We then look at the average BMI for each bootstrap sample and form a histogram of the bootstrap replicates
38 Bootstrap mean replicates BMI, sample size 200 Frequency BMI bootstrap mean
39 Bootstrap mean replicates BMI, sample size 2,000 Frequency BMI bootstrap mean
40 Bootstrap mean replicates BMI, sample size 20,000 Frequency BMI bootstrap mean
41 Standard errors What we see here is somewhat intuitive -- If the bootstrap replicates are doing a good job of approximating the sampling distribution, then our standard error is dropping as the CDC talks to more people This makes intuitive sense in that as we collect more data in our original sample, we ought to be doing a better job of estimating the population parameter, in this case the average θ BMI of the U.S. adult population
42 Bias In addition to considering the precision of our estimates, we can also assess any bias that might be present -- Using our comparison between the bootstrap and real worlds, we can estimate the true bias 1 M M t i θ i=1 using the bootstrap replicates (assuming 5,000 bootstrap iterations) 5,000 1 t i 5, 000 θ i=1 In the original CDC survey (with 20,000 respondents), our mean BMI was and the mean of our 5,000 bootstrap replicates was , suggesting almost no bias
43 Confidence intervals The idea should be getting clear -- If there is some function of the sampling distribution that we would like to estimate, we can use the bootstrap replicates as if they were actually from a repeated experiment While bias and standard error are extremely informative, the main use for a sampling distribution is the construction of a confidence interval for our population parameter A confidence interval is a (frequentist) expression of the uncertainty we have about the population parameter -- Rather θ than report a single estimate, we provide t 1 an interval of plausible values for θ It again starts with the idea of a repeatable process...
44 Confidence intervals Suppose we knew the sampling distribution exactly -- That is, somehow we were given estimates associated with all M samples that we could form from our population A 90% confidence interval, say, is constructed by a rule that ensures that, if we used this rule for every one of the M estimates, 90% of them would contain the population parameter θ This is our notion of confidence -- When we actually draw a random sample from the population and use the rule to compute an interval, we are hoping that our sample is one of the 90% of M for which the resulting interval contains the the population parameter θ
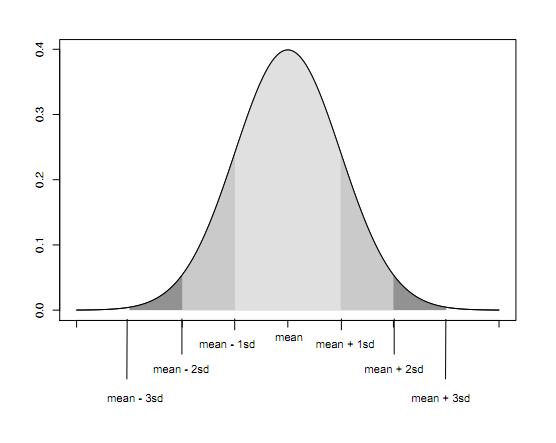
45 A simple example If our sampling distribution looks normal (many, but not all, of them do), then we can come up with a simple rule for a 95% confidence interval -- Recall that for any normal distribution, 95% of the mass must be within two standard deviations of the mean We had this picture from last lecture...
46
47 A simple rule If our sampling distribution is centered on the population parameter, this θ rule implies that 95% of the samples we could take have values that are within two standard errors of Here s a simple rule: For any estimate, form the interval t ± 2SE -- Let s see how this might perform
48 t θ 2SE θ θ + 2SE
49 t θ 2SE θ θ + 2SE
50 t θ 2SE θ θ + 2SE
51 A simple rule The curves on the previous slides represent what happens when we consider all M possible samples we can from a population of size N -- Each t represents one of M possible outcomes and 95% of them are associated with intervals that contain our population parameter The notion of confidence is important to keep in mind -- When we compute an interval, we don t know if it contains the truth or not, we just know that 95% of the intervals we could compute do contain the truth
52 A simple rule We can use the bootstrap to tell us about the bias (whether the sampling distribution is centered on ) and we can θestimate the standard error -- That gives us all we need to compute these simple intervals For the CDC data set with 20,000 respondents, the standard error is estimated to be and the mean BMI was, again, so that a 95% confidence interval is [26.233, ]
53 A more general rule Notice that in the normal case we are simply taking the lower and upper quantile of the sampling distribution -- In general, we can use our bootstrap replicates and tform 1,...,t an 5,000 interval using the and quantiles of the values This is called the percentile bootstrap confidence interval and is pretty easy to work with -- It is intuitive and will work reasonably well even if there your bootstrap distribution suggests things are skewed For the CDC data, because the bootstrap distribution looks fairly normal, these two approaches are about the same (black and dashed = +/- 2SE and cyan = quantiles)
54 5,000 bootstrap replicates, mean BMI Frequency bootstrap replicates
55 The bootstrap We will see that this relatively easy mechanism will provide us with the ability to estimate the bias, standard errors, RMS and confidence intervals in a wide range of problems We ve looked at the mean so far, but we could have as easily looked at the median, a trimmed mean or even the relative risk in any of our Vioxx trials! Over the next lecture or two we ll refine these ideas and extend them to other estimation contexts
Chapter 27. Inferences for Regression. Remembering Regression. An Example: Body Fat and Waist Size. Remembering Regression (cont.)
") Chapter 27 Inferences for Regression Copyright 2007 Pearson Education, Inc. Publishing as Pearson Addison-Wesley Slide 27-1 Copyright 2007 Pearson Education, Inc. Publishing as Pearson Addison-Wesley An
Chapter 27 Inferences for Regression Copyright 2007 Pearson Education, Inc. Publishing as Pearson Addison-Wesley Slide 27-1 Copyright 2007 Pearson Education, Inc. Publishing as Pearson Addison-Wesley An
Bootstrap Methods in Regression Questions Have you had a chance to try any of this? Any of the review questions?
 ICPSR Blalock Lectures, 2003 Bootstrap Resampling Robert Stine Lecture 3 Bootstrap Methods in Regression Questions Have you had a chance to try any of this? Any of the review questions? Getting class notes
STAT 113: Statistics and Society Ellen Gundlach, Purdue University. (Chapters refer to Moore and Notz, Statistics: Concepts and Controversies, 8e)
") STAT 113: Statistics and Society Ellen Gundlach, Purdue University (Chapters refer to Moore and Notz, Statistics: Concepts and Controversies, 8e) Learning Objectives for Exam 1: Unit 1, Part 1: Population
STAT 113: Statistics and Society Ellen Gundlach, Purdue University (Chapters refer to Moore and Notz, Statistics: Concepts and Controversies, 8e) Learning Objectives for Exam 1: Unit 1, Part 1: Population
NAA ENHANCING THE QUALITY OF MARKING PROJECT: THE EFFECT OF SAMPLE SIZE ON INCREASED PRECISION IN DETECTING ERRANT MARKING
 NAA ENHANCING THE QUALITY OF MARKING PROJECT: THE EFFECT OF SAMPLE SIZE ON INCREASED PRECISION IN DETECTING ERRANT MARKING Mudhaffar Al-Bayatti and Ben Jones February 00 This report was commissioned by
Why t? TEACHER NOTES MATH NSPIRED. Math Objectives. Vocabulary. About the Lesson
 Math Objectives Students will recognize that when the population standard deviation is unknown, it must be estimated from the sample in order to calculate a standardized test statistic. Students will recognize
Estimating. Proportions with Confidence. Chapter 10. Copyright 2006 Brooks/Cole, a division of Thomson Learning, Inc.
 Estimating Chapter 10 Proportions with Confidence Copyright 2006 Brooks/Cole, a division of Thomson Learning, Inc. Principal Idea: Survey 150 randomly selected students and 41% think marijuana should be
Chapter 5. Describing Distributions Numerically. Finding the Center: The Median. Spread: Home on the Range. Finding the Center: The Median (cont.
 Chapter 5 Describing Distributions Numerically Copyright 2007 Pearson Education, Inc. Publishing as Pearson Addison-Wesley Copyright 2007 Pearson Education, Inc. Publishing as Pearson Addison-Wesley Slide
MATH 214 (NOTES) Math 214 Al Nosedal. Department of Mathematics Indiana University of Pennsylvania. MATH 214 (NOTES) p. 1/3
 Math 214 Al Nosedal. Department of Mathematics Indiana University of Pennsylvania. MATH 214 (NOTES) p. 1/3") MATH 214 (NOTES) Math 214 Al Nosedal Department of Mathematics Indiana University of Pennsylvania MATH 214 (NOTES) p. 1/3 CHAPTER 1 DATA AND STATISTICS MATH 214 (NOTES) p. 2/3 Definitions. Statistics is
MATH 214 (NOTES) Math 214 Al Nosedal Department of Mathematics Indiana University of Pennsylvania MATH 214 (NOTES) p. 1/3 CHAPTER 1 DATA AND STATISTICS MATH 214 (NOTES) p. 2/3 Definitions. Statistics is
Chapter 21. Margin of Error. Intervals. Asymmetric Boxes Interpretation Examples. Chapter 21. Margin of Error
 Context Part VI Sampling Accuracy of Percentages Previously, we assumed that we knew the contents of the box and argued about chances for the draws based on this knowledge. In survey work, we frequently
Algebra I Module 2 Lessons 1 19
 Eureka Math 2015 2016 Algebra I Module 2 Lessons 1 19 Eureka Math, Published by the non-profit Great Minds. Copyright 2015 Great Minds. No part of this work may be reproduced, distributed, modified, sold,
What is Statistics? 13.1 What is Statistics? Statistics
 13.1 What is Statistics? What is Statistics? The collection of all outcomes, responses, measurements, or counts that are of interest. A portion or subset of the population. Statistics Is the science of
Resampling Statistics. Conventional Statistics. Resampling Statistics
 Resampling Statistics Introduction to Resampling Probability Modeling Resample add-in Bootstrapping values, vectors, matrices R boot package Conclusions Conventional Statistics Assumptions of conventional
Box Plots. So that I can: look at large amount of data in condensed form.
 LESSON 5 Box Plots LEARNING OBJECTIVES Today I am: creating box plots. So that I can: look at large amount of data in condensed form. I ll know I have it when I can: make observations about the data based
Journal of the Association of Chartered Physiotherapists in Respiratory Care A guide to writing an experimental study
 Journal of the Association of Chartered Physiotherapists in Respiratory Care A guide to writing an experimental study Experimental study: any study that involves the quantitative collection of data will
Measuring Variability for Skewed Distributions
 Measuring Variability for Skewed Distributions Skewed Data and its Measure of Center Consider the following scenario. A television game show, Fact or Fiction, was canceled after nine shows. Many people
How Large a Sample? CHAPTER 24. Issues in determining sample size
 388 Resampling: The New Statistics CHAPTER 24 How Large a Sample? Issues in Determining Sample Size Some Practical Examples Step-Wise Sample-Size Determination Summary Issues in determining sample size
THE USE OF RESAMPLING FOR ESTIMATING CONTROL CHART LIMITS
 THE USE OF RESAMPLING FOR ESTIMATING CONTROL CHART LIMITS Draft of paper published in Journal of the Operational Research Society, 50, 651-659, 1999. Michael Wood, Michael Kaye and Nick Capon Management
Distribution of Data and the Empirical Rule
 302360_File_B.qxd 7/7/03 7:18 AM Page 1 Distribution of Data and the Empirical Rule 1 Distribution of Data and the Empirical Rule Stem-and-Leaf Diagrams Frequency Distributions and Histograms Normal Distributions
More About Regression
 Regression Line for the Sample Chapter 14 More About Regression is spoken as y-hat, and it is also referred to either as predicted y or estimated y. b 0 is the intercept of the straight line. The intercept
Normalization Methods for Two-Color Microarray Data
 Normalization Methods for Two-Color Microarray Data 1/13/2009 Copyright 2009 Dan Nettleton What is Normalization? Normalization describes the process of removing (or minimizing) non-biological variation
Quantitative methods
 Quantitative methods Week #7 Gergely Daróczi Corvinus University of Budapest, Hungary 23 March 2012 Outline 1 Sample-bias 2 Sampling theory 3 Probability sampling Simple Random Sampling Stratified Sampling
MATH 214 (NOTES) Math 214 Al Nosedal. Department of Mathematics Indiana University of Pennsylvania. MATH 214 (NOTES) p. 1/11
 Math 214 Al Nosedal. Department of Mathematics Indiana University of Pennsylvania. MATH 214 (NOTES) p. 1/11") MATH 214 (NOTES) Math 214 Al Nosedal Department of Mathematics Indiana University of Pennsylvania MATH 214 (NOTES) p. 1/11 CHAPTER 6 CONTINUOUS PROBABILITY DISTRIBUTIONS MATH 214 (NOTES) p. 2/11 Simple
MATH 214 (NOTES) Math 214 Al Nosedal Department of Mathematics Indiana University of Pennsylvania MATH 214 (NOTES) p. 1/11 CHAPTER 6 CONTINUOUS PROBABILITY DISTRIBUTIONS MATH 214 (NOTES) p. 2/11 Simple
Tutorial 0: Uncertainty in Power and Sample Size Estimation. Acknowledgements:
 Tutorial 0: Uncertainty in Power and Sample Size Estimation Anna E. Barón, Keith E. Muller, Sarah M. Kreidler, and Deborah H. Glueck Acknowledgements: The project was supported in large part by the National
Reviews of earlier editions
 Reviews of earlier editions Statistics in medicine ( 1997 by John Wiley & Sons, Ltd. Statist. Med., 16, 2627Ð2631 (1997) STATISTICS AT SQUARE ONE. Ninth Edition, revised by M. J. Campbell, T. D. V. Swinscow,
AGAINST ALL ODDS EPISODE 22 SAMPLING DISTRIBUTIONS TRANSCRIPT
 AGAINST ALL ODDS EPISODE 22 SAMPLING DISTRIBUTIONS TRANSCRIPT 1 FUNDER CREDITS Funding for this program is provided by Annenberg Learner. 2 INTRO Pardis Sabeti Hi, I m Pardis Sabeti and this is Against
The Fox News Eect:Media Bias and Voting S. DellaVigna and E. Kaplan (2007)
") The Fox News Eect:Media Bias and Voting S. DellaVigna and E. Kaplan (2007) Anna Airoldi Igor Cerasa IGIER Visiting Students Presentation March 21st, 2014 Research Questions Does the media have an impact
The Fox News Eect:Media Bias and Voting S. DellaVigna and E. Kaplan (2007) Anna Airoldi Igor Cerasa IGIER Visiting Students Presentation March 21st, 2014 Research Questions Does the media have an impact
Sample Analysis Design. Element2 - Basic Software Concepts (cont d)
") Sample Analysis Design Element2 - Basic Software Concepts (cont d) Samples per Peak In order to establish a minimum level of precision, the ion signal (peak) must be measured several times during the scan
Sample Analysis Design Element2 - Basic Software Concepts (cont d) Samples per Peak In order to establish a minimum level of precision, the ion signal (peak) must be measured several times during the scan
Margin of Error. p(1 p) n 0.2(0.8) 900. Since about 95% of the data will fall within almost two standard deviations, we will use the formula
 n 0.2(0.8) 900. Since about 95% of the data will fall within almost two standard deviations, we will use the formula") Name Margin of Error A survey of a sample population gathers information from a few people and then the results are used to reflect the opinions of a larger population. The reason that researchers and
Name Margin of Error A survey of a sample population gathers information from a few people and then the results are used to reflect the opinions of a larger population. The reason that researchers and
Lesson 7: Measuring Variability for Skewed Distributions (Interquartile Range)
") : Measuring Variability for Skewed Distributions (Interquartile Range) Student Outcomes Students explain why a median is a better description of a typical value for a skewed distribution. Students calculate
: Measuring Variability for Skewed Distributions (Interquartile Range) Student Outcomes Students explain why a median is a better description of a typical value for a skewed distribution. Students calculate
Moving on from MSTAT. March The University of Reading Statistical Services Centre Biometrics Advisory and Support Service to DFID
 Moving on from MSTAT March 2000 The University of Reading Statistical Services Centre Biometrics Advisory and Support Service to DFID Contents 1. Introduction 3 2. Moving from MSTAT to Genstat 4 2.1 Analysis
Lesson 7: Measuring Variability for Skewed Distributions (Interquartile Range)
") : Measuring Variability for Skewed Distributions (Interquartile Range) Exploratory Challenge 1: Skewed Data and its Measure of Center Consider the following scenario. A television game show, Fact or Fiction,
: Measuring Variability for Skewed Distributions (Interquartile Range) Exploratory Challenge 1: Skewed Data and its Measure of Center Consider the following scenario. A television game show, Fact or Fiction,
abc Mark Scheme Statistics 3311 General Certificate of Secondary Education Higher Tier 2007 examination - June series
 abc General Certificate of Secondary Education Statistics 3311 Higher Tier Mark Scheme 2007 examination - June series Mark schemes are prepared by the Principal Examiner and considered, together with the
in the Howard County Public School System and Rocketship Education
 Technical Appendix May 2016 DREAMBOX LEARNING ACHIEVEMENT GROWTH in the Howard County Public School System and Rocketship Education Abstract In this technical appendix, we present analyses of the relationship
Sampler Overview. Statistical Demonstration Software Copyright 2007 by Clifford H. Wagner
 Sampler Overview Statistical Demonstration Software Copyright 2007 by Clifford H. Wagner (w44@psu.edu) Introduction The philosophy behind Sampler is that students learn mathematics and statistics more
COMP Test on Psychology 320 Check on Mastery of Prerequisites
 COMP Test on Psychology 320 Check on Mastery of Prerequisites This test is designed to provide you and your instructor with information on your mastery of the basic content of Psychology 320. The results
Hybrid resampling methods for confidence intervals: comment
 Title Hybrid resampling methods for confidence intervals: comment Author(s) Lee, SMS; Young, GA Citation Statistica Sinica, 2000, v. 10 n. 1, p. 43-46 Issued Date 2000 URL http://hdl.handle.net/10722/45352
UNIVERSITY OF CAMBRIDGE INTERNATIONAL EXAMINATIONS General Certificate of Education Ordinary Level
 UNIVERSITY OF CAMBRIDGE INTERNATIONAL EXAMINATIONS General Certificate of Education Ordinary Level *0192736882* STATISTICS 4040/12 Paper 1 October/November 2013 Candidates answer on the question paper.
Chapter 6. Normal Distributions
 Chapter 6 Normal Distributions Understandable Statistics Ninth Edition By Brase and Brase Prepared by Yixun Shi Bloomsburg University of Pennsylvania Edited by José Neville Díaz Caraballo University of
Chapter 3. Averages and Variation
 Chapter 3 Averages and Variation Understandable Statistics Ninth Edition By Brase and Brase Prepared by Yixun Shi Bloomsburg University of Pennsylvania Measures of Central Tendency We use the term average
Western Statistics Teachers Conference 2000
 Teaching Using Ratios 13 Mar, 2000 Teaching Using Ratios 1 Western Statistics Teachers Conference 2000 March 13, 2000 MILO SCHIELD Augsburg College www.augsburg.edu/ppages/schield schield@augsburg.edu
The Impact of Media Censorship: Evidence from a Field Experiment in China
 The Impact of Media Censorship: Evidence from a Field Experiment in China Yuyu Chen David Y. Yang January 22, 2018 Yuyu Chen David Y. Yang The Impact of Media Censorship: Evidence from a Field Experiment
Blueline, Linefree, Accuracy Ratio, & Moving Absolute Mean Ratio Charts
 INTRODUCTION This instruction manual describes for users of the Excel Standard Celeration Template(s) the features of each page or worksheet in the template, allowing the user to set up and generate charts
Chapter 1 Midterm Review
 Name: Class: Date: Chapter 1 Midterm Review Multiple Choice Identify the choice that best completes the statement or answers the question. 1. A survey typically records many variables of interest to the
Does Music Directly Affect a Person s Heart Rate?
 Wright State University CORE Scholar Medical Education 2-4-2015 Does Music Directly Affect a Person s Heart Rate? David Sills Amber Todd Wright State University - Main Campus, amber.todd@wright.edu Follow
UNIVERSITY OF MASSACHUSETTS Department of Biostatistics and Epidemiology BioEpi 540W - Introduction to Biostatistics Fall 2002
 1 UNIVERSITY OF MASSACHUSETTS Department of Biostatistics and Epidemiology BioEpi 540W - Introduction to Biostatistics Fall 2002 Exercises Unit 2 Descriptive Statistics Tables and Graphs Due: Monday September
STAT 250: Introduction to Biostatistics LAB 6
 STAT 250: Introduction to Biostatistics LAB 6 Dr. Kari Lock Morgan Sampling Distributions In this lab, we ll explore sampling distributions using StatKey: www.lock5stat.com/statkey. We ll be using StatKey,
Producing Data: Sampling
 CHAPTER 8 Producing Data: Sampling 8.1 8.2 8.3 First Steps Sampling Design Selected Exercise Solutions Introduction In this chapter, we use TI calculators to simulate the collection of random samples.
Problem Points Score USE YOUR TIME WISELY USE CLOSEST DF AVAILABLE IN TABLE SHOW YOUR WORK TO RECEIVE PARTIAL CREDIT
 Stat 514 EXAM I Stat 514 Name (6 pts) Problem Points Score 1 32 2 30 3 32 USE YOUR TIME WISELY USE CLOSEST DF AVAILABLE IN TABLE SHOW YOUR WORK TO RECEIVE PARTIAL CREDIT WRITE LEGIBLY. ANYTHING UNREADABLE
1996 Yampi Shelf, Browse Basin Airborne Laser Fluorosensor Survey Interpretation Report [WGC Browse Survey Number ]
![1996 Yampi Shelf, Browse Basin Airborne Laser Fluorosensor Survey Interpretation Report [WGC Browse Survey Number ]](/thumbs/93/113486699.jpg "1996 Yampi Shelf, Browse Basin Airborne Laser Fluorosensor Survey Interpretation Report [WGC Browse Survey Number ]") 1996 Yampi Shelf, Browse Basin Airborne Laser Fluorosensor Survey Interpretation Report [WGC Browse Survey Number 1248.1] Prepared For Australian Geological Survey Organisation April 2000 AGSO Record No.
1996 Yampi Shelf, Browse Basin Airborne Laser Fluorosensor Survey Interpretation Report [WGC Browse Survey Number 1248.1] Prepared For Australian Geological Survey Organisation April 2000 AGSO Record No.
GENERAL WRITING FORMAT
 GENERAL WRITING FORMAT The doctoral dissertation should be written in a uniform and coherent manner. Below is the guideline for the standard format of a doctoral research paper: I. General Presentation
Linear mixed models and when implied assumptions not appropriate
 Mixed Models Lecture Notes By Dr. Hanford page 94 Generalized Linear Mixed Models (GLMM) GLMMs are based on GLM, extended to include random effects, random coefficients and covariance patterns. GLMMs are
Comparison of Mixed-Effects Model, Pattern-Mixture Model, and Selection Model in Estimating Treatment Effect Using PRO Data in Clinical Trials
 Comparison of Mixed-Effects Model, Pattern-Mixture Model, and Selection Model in Estimating Treatment Effect Using PRO Data in Clinical Trials Xiaolei Zhou, 1,2 Jianmin Wang, 1 Jessica Zhang, 1 Hongtu
SEVENTH GRADE. Revised June Billings Public Schools Correlation and Pacing Guide Math - McDougal Littell Middle School Math 2004
 SEVENTH GRADE June 2010 Billings Public Schools Correlation and Guide Math - McDougal Littell Middle School Math 2004 (Chapter Order: 1, 6, 2, 4, 5, 13, 3, 7, 8, 9, 10, 11, 12 Chapter 1 Number Sense, Patterns,
MANUSCRIPT FORMAT FOR JOURNAL ARTICLES SUBMITTED TO AMMONS SCIENTIFIC, LTD. FOR POSSIBLE PUBLICATION IN PERCEPTUAL AND MOTOR
 Manuscript format... Running head: [INSERT RUNNING HEAD] MANUSCRIPT FORMAT FOR JOURNAL ARTICLES SUBMITTED TO AMMONS SCIENTIFIC, LTD. FOR POSSIBLE PUBLICATION IN PERCEPTUAL AND MOTOR SKILLS OR PSYCHOLOGICAL
Technical Theater Certificate
 Technical Theater Certificate The Inland Empire/Desert Region (Riverside-San Bernardino-Ontario Metropolitan Statistical Area) and the Los Angeles/Orange County Region (Los Angeles-Long Beach-Anaheim Metropolitan
Confidence Intervals for Radio Ratings Estimators
 Social Statistics Section JSM 009 Confidence Intervals for Radio Ratings Estimators Richard Griffiths 1 1 Arbitron, Inc., 9705 Patuxent Woods Drive, Columbia, MD 1046 Abstract Arbitron s current method
Quarterly Progress and Status Report. Perception of just noticeable time displacement of a tone presented in a metrical sequence at different tempos
 Dept. for Speech, Music and Hearing Quarterly Progress and Status Report Perception of just noticeable time displacement of a tone presented in a metrical sequence at different tempos Friberg, A. and Sundberg,
Common assumptions in color characterization of projectors
 Common assumptions in color characterization of projectors Arne Magnus Bakke 1, Jean-Baptiste Thomas 12, and Jérémie Gerhardt 3 1 Gjøvik university College, The Norwegian color research laboratory, Gjøvik,
GBA 327: Module 7D AVP Transcript Title: The Monte Carlo Simulation Using Risk Solver. Title Slide
 GBA 327: Module 7D AVP Transcript Title: The Monte Carlo Simulation Using Risk Solver Title Slide Narrator: Although the use of a data table illustrates how we can apply Monte Carlo simulation to a decision
NETFLIX MOVIE RATING ANALYSIS
 NETFLIX MOVIE RATING ANALYSIS Danny Dean EXECUTIVE SUMMARY Perhaps only a few us have wondered whether or not the number words in a movie s title could be linked to its success. You may question the relevance
Modeling memory for melodies
 Modeling memory for melodies Daniel Müllensiefen 1 and Christian Hennig 2 1 Musikwissenschaftliches Institut, Universität Hamburg, 20354 Hamburg, Germany 2 Department of Statistical Science, University
Note for Applicants on Coverage of Forth Valley Local Television
 Note for Applicants on Coverage of Forth Valley Local Television Publication date: May 2014 Contents Section Page 1 Transmitter location 2 2 Assumptions and Caveats 3 3 Indicative Household Coverage 7
WEB APPENDIX. Managing Innovation Sequences Over Iterated Offerings: Developing and Testing a Relative Innovation, Comfort, and Stimulation
 WEB APPENDIX Managing Innovation Sequences Over Iterated Offerings: Developing and Testing a Relative Innovation, Comfort, and Stimulation Framework of Consumer Responses Timothy B. Heath Subimal Chatterjee
Sources of Error in Time Interval Measurements
 Sources of Error in Time Interval Measurements Application Note Some timer/counters available today offer resolution of below one nanosecond in their time interval measurements. Of course, high resolution
GS122-2L. About the speakers:
 Dan Leighton DL Consulting Andrea Bell GS122-2L A growing number of utilities are adapting Autodesk Utility Design (AUD) as their primary design tool for electrical utilities. You will learn the basics
Centre for Economic Policy Research
 The Australian National University Centre for Economic Policy Research DISCUSSION PAPER The Reliability of Matches in the 2002-2004 Vietnam Household Living Standards Survey Panel Brian McCaig DISCUSSION
STOCK MARKET DOWN, NEW MEDIA UP
 FOR RELEASE: SUNDAY, NOVEMBER 9, 1997, 4:00 P.M. STOCK MARKET DOWN, NEW MEDIA UP FOR FURTHER INFORMATION CONTACT: Andrew Kohut, Director Beth Donovan, Editor Greg Flemming, Survey Director Pew Research
Supplemental Material: Color Compatibility From Large Datasets
 Supplemental Material: Color Compatibility From Large Datasets Peter O Donovan, Aseem Agarwala, and Aaron Hertzmann Project URL: www.dgp.toronto.edu/ donovan/color/ 1 Unmixing color preferences In the
Noise. CHEM 411L Instrumental Analysis Laboratory Revision 2.0
 CHEM 411L Instrumental Analysis Laboratory Revision 2.0 Noise In this laboratory exercise we will determine the Signal-to-Noise (S/N) ratio for an IR spectrum of Air using a Thermo Nicolet Avatar 360 Fourier
THE MONTY HALL PROBLEM
 University of Nebraska - Lincoln DigitalCommons@University of Nebraska - Lincoln MAT Exam Expository Papers Math in the Middle Institute Partnership 7-2009 THE MONTY HALL PROBLEM Brian Johnson University
What can you tell about these films from this box plot? Could you work out the genre of these films?
 FILM A FILM B FILM C Age of film viewer What can you tell about these films from this box plot? Could you work out the genre of these films? Compare the box plots and write down anything you notice FILM
Collecting Data Name:
 Collecting Data Name: Gary tried out for the college baseball team and had received information about his performance. In a letter mailed to his home, he found these recordings. Pitch speeds: 83, 84, 88,
Objective: Write on the goal/objective sheet and give a before class rating. Determine the types of graphs appropriate for specific data.
 Objective: Write on the goal/objective sheet and give a before class rating. Determine the types of graphs appropriate for specific data. Khan Academy test Tuesday Sept th. NO CALCULATORS allowed. Not
Special Article. Prior Publication Productivity, Grant Percentile Ranking, and Topic-Normalized Citation Impact of NHLBI Cardiovascular R01 Grants
 Special Article Prior Publication Productivity, Grant Percentile Ranking, and Topic-Normalized Citation Impact of NHLBI Cardiovascular R01 Grants Jonathan R. Kaltman, Frank J. Evans, Narasimhan S. Danthi,
Time Domain Simulations
 Accuracy of the Computational Experiments Called Mike Steinberger Lead Architect Serial Channel Products SiSoft Time Domain Simulations Evaluation vs. Experimentation We re used to thinking of results
Fundamentals and applications of resampling methods for the analysis of speech production and perception data.
 Fundamentals and applications of resampling methods for the analysis of speech production and perception data. Olivier Crouzet 1 Laboratoire de Linguistique de Nantes (LLING UMR 6310, Université de Nantes
A Short Guide to Writing about Science
 A Short Guide to Writing about Science DAVID PORUSH Rensselaer Polytechnic Institute! HarperCoMinsCollegePublisbers Detailed Contents CHECKLISTS PREFACE xxi xix 1 INTRODUCTION: SCIENCE WRITING AND THE
Use black ink or black ball-point pen. Pencil should only be used for drawing. *
 General Certificate of Education June 2009 Advanced Subsidiary Examination MATHEMATICS Unit Statistics 1B MS/SS1B STATISTICS Unit Statistics 1B Wednesday 20 May 2009 1.30 pm to 3.00 pm For this paper you
Estimation of inter-rater reliability
 Estimation of inter-rater reliability January 2013 Note: This report is best printed in colour so that the graphs are clear. Vikas Dhawan & Tom Bramley ARD Research Division Cambridge Assessment Ofqual/13/5260
SoundExchange compliance Noncommercial webcaster vs. CPB deal
 SoundExchange compliance Noncommercial webcaster vs. CPB deal SX compliance under CPB rules 1 can be challenging. Noncommercial Webcaster 2 (NW) is another set of rates and terms that some stations might
Grading Summary: Examination 1 45% Examination 2 45% Class participation 10% 100% Term paper (Optional)
") Biofeedback, Meditation and Self-Regulation Spring, 2000 PY 405-24 Instructor: Edward Taub Office: 157 Campbell Hall Telephone: 934-2471 Office Hours: Mon. & Wed. 10:00 12:00 (or call for alternate time)
Biofeedback, Meditation and Self-Regulation Spring, 2000 PY 405-24 Instructor: Edward Taub Office: 157 Campbell Hall Telephone: 934-2471 Office Hours: Mon. & Wed. 10:00 12:00 (or call for alternate time)
User Guide. S-Curve Tool
 User Guide for S-Curve Tool Version 1.0 (as of 09/12/12) Sponsored by: Naval Center for Cost Analysis (NCCA) Developed by: Technomics, Inc. 201 12 th Street South, Suite 612 Arlington, VA 22202 Points
Rounding Foldable Download or Read Online ebook rounding foldable in PDF Format From The Best User Guide Database
 Free PDF ebook Download: Download or Read Online ebook rounding foldable in PDF Format From The Best User Guide Database Nov 25, 2013 - Make this to help you organize information about decimals. Begin
The One Penny Whiteboard
 The One Penny Whiteboard Ongoing, in the moment assessments may be the most powerful tool teachers have for improving student performance. For students to get better at anything, they need lots of quick
Sampling Plans. Sampling Plan - Variable Physical Unit Sample. Sampling Application. Sampling Approach. Universe and Frame Information
 Sampling Plan - Variable Physical Unit Sample Sampling Application AUDIT TYPE: REVIEW AREA: SAMPLING OBJECTIVE: Sampling Approach Type of Sampling: Why Used? Check All That Apply: Confidence Level: Desired
Math 81 Graphing. Cartesian Coordinate System Plotting Ordered Pairs (x, y) (x is horizontal, y is vertical) center is (0,0) Quadrants:
 (x is horizontal, y is vertical) center is (0,0) Quadrants:") Math 81 Graphing Cartesian Coordinate System Plotting Ordered Pairs (x, y) (x is horizontal, y is vertical) center is (0,0) Ex 1. Plot and indicate which quadrant they re in. A (0,2) B (3, 5) C (-2, -4)
Math 81 Graphing Cartesian Coordinate System Plotting Ordered Pairs (x, y) (x is horizontal, y is vertical) center is (0,0) Ex 1. Plot and indicate which quadrant they re in. A (0,2) B (3, 5) C (-2, -4)
MUSIC AND MEMORY. Jessica Locke Megan Draughn Olivia Cotton James Segodnia Caitlin Annas
 MUSIC AND MEMORY Jessica Locke Megan Draughn Olivia Cotton James Segodnia Caitlin Annas INTRODUCTION Purpose: Does listening to music while studying affect recall ability? Independent Variable: music condition
WHAT MAKES FOR A HIT POP SONG? WHAT MAKES FOR A POP SONG?
 WHAT MAKES FOR A HIT POP SONG? WHAT MAKES FOR A POP SONG? NICHOLAS BORG AND GEORGE HOKKANEN Abstract. The possibility of a hit song prediction algorithm is both academically interesting and industry motivated.
FPA (Focal Plane Array) Characterization set up (CamIRa) Standard Operating Procedure
 Characterization set up (CamIRa) Standard Operating Procedure") FPA (Focal Plane Array) Characterization set up (CamIRa) Standard Operating Procedure FACULTY IN-CHARGE Prof. Subhananda Chakrabarti (IITB) SYSTEM OWNER Hemant Ghadi (ghadihemant16@gmail.com) 05 July 2013
FPA (Focal Plane Array) Characterization set up (CamIRa) Standard Operating Procedure FACULTY IN-CHARGE Prof. Subhananda Chakrabarti (IITB) SYSTEM OWNER Hemant Ghadi (ghadihemant16@gmail.com) 05 July 2013
AN EXPERIMENT WITH CATI IN ISRAEL
 Paper presented at InterCasic 96 Conference, San Antonio, TX, 1996 1. Background AN EXPERIMENT WITH CATI IN ISRAEL Gad Nathan and Nilufar Aframian Hebrew University of Jerusalem and Israel Central Bureau
Multiple-point simulation of multiple categories Part 1. Testing against multiple truncation of a Gaussian field
 Multiple-point simulation of multiple categories Part 1. Testing against multiple truncation of a Gaussian field Tuanfeng Zhang November, 2001 Abstract Multiple-point simulation of multiple categories
Paired plot designs experience and recommendations for in field product evaluation at Syngenta
 Paired plot designs experience and recommendations for in field product evaluation at Syngenta 1. What are paired plot designs? 2. Analysis and reporting of paired plot designs 3. Case study 1 : analysis
Music Therapists Training Program by Hyogo Prefectural Administration
 Music Therapists Training Program by Hyogo Prefectural Administration Presentation at the 15 th WFMT World Congress of Music Therapy July 4-8, 2017 in Tsukuba, Japan, by Takako TSUKUDA, Public Interest
Richard B. Haynes Philip J. Muniz Douglas C. Smith
 A New Technique for Measuring the Shielding Effectiveness of Interconnection in Shielding Technologies: Application to Cellular Phone Gaskets for the Housing Richard B. Haynes Philip J. Muniz Douglas C.
By: Claudia Romo, Heidy Martinez, Ara Velazquez
 By: Claudia Romo, Heidy Martinez, Ara Velazquez Introduction With so many genres of music, how can we know which one is at the top and most listened to? There are music charts, top 100 playlists, itunes
ECONOMICS 351* -- INTRODUCTORY ECONOMETRICS. Queen's University Department of Economics. ECONOMICS 351* -- Winter Term 2005 INTRODUCTORY ECONOMETRICS
 Queen's University Department of Economics ECONOMICS 351* -- Winter Term 2005 INTRODUCTORY ECONOMETRICS Winter Term 2005 Instructor: Web Site: Mike Abbott Office: Room A521 Mackintosh-Corry Hall or Room
MENC: The National Association for Music Education
 MENC: The National Association for Music Education Teaching Clarinet Fingerings with Teaching Machines Author(s): Leslie E. Woelflin Reviewed work(s): Source: Journal of Research in Music Education, Vol.
Mixed Effects Models Yan Wang, Bristol-Myers Squibb, Wallingford, CT
 PharmaSUG 2016 - Paper PO06 Mixed Effects Models Yan Wang, Bristol-Myers Squibb, Wallingford, CT ABSTRACT The MIXED procedure has been commonly used at the Bristol-Myers Squibb Company for quality of life
PERCEPTUAL QUALITY COMPARISON BETWEEN SINGLE-LAYER AND SCALABLE VIDEOS AT THE SAME SPATIAL, TEMPORAL AND AMPLITUDE RESOLUTIONS. Yuanyi Xue, Yao Wang
 PERCEPTUAL QUALITY COMPARISON BETWEEN SINGLE-LAYER AND SCALABLE VIDEOS AT THE SAME SPATIAL, TEMPORAL AND AMPLITUDE RESOLUTIONS Yuanyi Xue, Yao Wang Department of Electrical and Computer Engineering Polytechnic
Evaluation of Serial Periodic, Multi-Variable Data Visualizations
 Evaluation of Serial Periodic, Multi-Variable Data Visualizations Alexander Mosolov 13705 Valley Oak Circle Rockville, MD 20850 (301) 340-0613 AVMosolov@aol.com Benjamin B. Bederson i Computer Science