ACOUSTILYZER. User Manual AL1
|
|
|
- Tiffany Hall
- 6 years ago
- Views:
Transcription


1 ACOUSTILYZER User Manual AL1
2 Contact details: Headquarter Americas China Czech Germany Japan japan@nti-audio.com South Korea korea@nti-audio.com UK uk@nti-audio.com NTi Audio AG Im alten Riet 102, 9494 Schaan Liechtenstein, Europe is an ISO 9001:2008 certified company. NTi Audio AG All rights reserved. Subject to change without notice. Release Oct 2017 / Firmware A1.32 or higher MiniLINK, Minilyzer, Digilyzer, Acoustilyzer, Minirator, MiniSPL and Minstruments are trademarks of NTi Audio. Made in Switzerland 2
3 Contents 1. Introduction 4 Registration 5 CE Declaration of Conformity 6 International Warranty and Repair 7 Warnings 8 Test & Calibration Certificate 8 2. Overview 9 Acoustilyzer Functions 10 Easy Operation 10 Connectors Basic Operation 13 Start-up Screen 14 Menu Bar Measurement Functions 23 SPL/RTA - Sound Level Meter 24 SPL/RTA - Real Time Analyzer RTA 28 Reverberation Time RT60 37 FFT Analysis 43 Polarity Test 47 Delay Time 49 Electrical Measurements - RMS/THD 52 Speech Intelligibility STI-PA (optional) 54 Calibration MiniLINK PC Software 65 Installation 65 Start the MiniLINK PC Software 66 Free Registration of your Test Instrument 67 Readout of Stored Test Results 68 Visualizing the Test Results 69 Test Result Logging at the PC 73 Remote Test Instrument Control with the PC 75 MiniLINK Tools 76 Activate Options Troubleshooting Accessories Technical Specification Appendix: Introduction to STI-PA 89 3
4 1. Introduction Congratulations and thank you for buying NTi Audio s Acoustilyzer AL1, a product specially suited for professional acoustical test applications. The Acoustilyzer offers advanced acoustic functions including an optional speech intelligibility STI-PA measurement module and further basic electrical features. We are convinced you will enjoy using it! This manual describes the Acoustilyzer AL1 functions and measurements in detail. Further application information about the acoustical and electrical measurements can be found on the web site The Acoustilyzer AL1 is available as a stand-alone test instrument or as a crossgrade package for existing Minilyzer ML1 users. The same crossgrade option can be used to install the Minilyzer functionalities on the AL1. The STI-PA measurement feature is optional. The product packages include the following items: Acoustilyzer AL1 1x Acoustilyzer AL1 1x MiniLINK CD (PC software) 1x MiniLINK USB Cable 1x Acoustilyzer Test CD 1x Acoustilyzer User Manual ML1-AL1 Crossgrade 1x MiniLINK CD (PC software) 1x Acoustilyzer Test CD (audio samples) 1x License Number Crossgrade 1x Acoustilyzer User Manual 1x Minilyzer User Manual STI-PA Measurement Option 1x STI-PA Test CD (STI-PA test signal) 1x License Number STI-PA 1x Acoustilyzer User Manual 4
5 Registration Register as a customer with NTi Audio and benefit from the following possibilities: Keep your products up-to-date Access free firmware and software updates. Activate options Enable additional functions for your products. Access premium content Access downloads, information and specific support for your products. Receive application and product news Sign in for the NTi Audio Newsletter. Get fast worldwide support Register your products for fast support. Confirm your ownership Allows us to contact you with important product notifications and provides a product record in case of loss or theft. How to Register Open the web page You are prompted to login or create the My NTi Audio Account. The web page My NTi Audio Products opens. Select the product type and enter the serial number. Confirm with Register. Now your product is listed in the table My NTi Audio Products. 5
6 Declaration of Conformity We, the manufacturer NTi Audio AG, Im alten Riet 102, 9494 Schaan, Liechtenstein, hereby declare that the product Acoustilyzer AL1 conforms to the following standards or other normative documents. EMC: 2004/108/EG Harmonized standards: EN Explosive atmospheres (ATEX): 94/9/EG Directive 2011/65/EC on the restriction of the use of certain hazardous substances in electrical and electronic equipment (RoHS). Directive 2002/96/EC on waste electrical and electronic equipment (WEEE). This declaration becomes void in case of any changes on the product without written authorization by NTi Audio. Date: 1. September 2013 Signature: Position of signatory: Technical Director 6
7 International Warranty and Repair International Warranty NTi Audio guarantees the functionality of Acoustilyzer AL1 against defects in material or workmanship for a period of one year from the date of original purchase, and agrees to repair or to replace at its discretion any defective unit at no cost for either parts or labor during this period. Restrictions This warranty does not cover damages caused through accidents, misuse, lack of care, the attachment or installation of any components that were not provided with the product, loss of parts, connecting the instrument to a power supply, input signal voltage or connector type other than specified or wrongly polarized batteries. In particular, no responsibility is granted for special, incidental or consequential damages. This warranty becomes void if servicing or repairs of the product are performed by any party other than an authorized NTi Audio service center or if the instrument has been opened in a manner other than specified in this manual. No other warranty, written or verbal, is authorized by NTi Audio. Except as otherwise stated in this warranty, NTi Audio makes no representation or warranty of any kind, expressed or implied in law or in fact, including, without limitation, merchandising or fitting for any particular purpose and assumes no liability, either in tort, strict liability, contract or warranty for products. Repair In case of malfunction, take - or ship prepaid - your NTi Audio Acoustilyzer AL1 packed in the original box, to the authorized NTi Audio representative in your country. For contact details see the NTi Audio web page Make sure to include a copy of your sales invoice as proof of purchase date. Transit damages are not covered by this warranty. 7
8 Warnings In order to avoid any problems during the operation of the instrument, follow the guidelines listed below: Use the instrument for the intended purpose only. Never connect the instrument to a high voltage output such as a power amplifier, mains power plug, etc. Do not disassemble the instrument. Never use the instrument in a damp environment. Remove the batteries as soon as they are flat or if it is not intended to use the instrument for an extended period of time. Test & Calibration Certificate This is to certify the Acoustilyzer AL1 is fully tested to the manufacturer s specifications. NTi Audio recommends calibration of this test instrument one (1) year after purchase, and every subsequent one (1) year thereafter. 8

 or M2010 (class 1 frequency response).")
9 2. Overview The Acoustilyzer AL1 is a sophisticated tool used to analyze acoustic signals. It is designed for easy and quick detailed analysis of the acoustic environment and to carry out significant electrical measurements. An accurate overview of the actual acoustic signal is displayed on a large LCD. The AL1 is a class 1 accuracy instrument and available with the measurement microphones MiniSPL (class 2) or M2010 (class 1 frequency response). Alternatively, other measurement microphones can be used. Class 1 acoustical analyzer NTi Audio offers the class 1 frequency response microphone M2010 (an external phantom power supply is required). The Acoustilyzer in combination with the M2010 measurement microphone forms a highly accurate class 1 acoustical analyzer. Class 2 acoustical analyzer The Acoustilyzer in combination with the MiniSPL forms a comprehensive class 2 acoustical analyzer. MiniSPL is a battery-powered measurement microphone. It is the ideal accessory for the Acoustilyzer. 9
10 Acoustilyzer Functions The Acoustilyzer AL1 features many measurement functions, which are accessible through a drop down menu bar. The base element is the cursor (inverted area), which may be navigated through the various functions by using the cursor keys. SPL/RTA: RT60: FFT: POLARITY: DELAY: RMS/THD: STI-PA: CALIBRTE: Sound Pressure Level (SPL) & time-averaged sound pressure level (Leq) measurements of wideband values. Real Time Analysis (RTA) of octave or ⅓ octave values Reverberation time with 1/1 octave band resolution Real-time zoom Fast Fourier Transform (FFT) Polarity measurement of speakers and line signals Delay time measurements between speakers Root Mean Square (RMS) level and Total Harmonic Distortion (THD) measurements Speech intelligibility measurement is visible after Speech Transmission Index for Public Address systems (STI-PA) license key has been activated Calibration of connected measurement microphone Easy Operation Unit selected with cursor to change setting All selectable settings may be adjusted simply by Pressing the enter key to select the required value. Alternatively, for longer selection lists, the chosen field flashes. Now select the required value with the cursor keys. Confirm the setting by pressing the enter key again. 10
.")
11 Connectors On top of the AL1, three connectors as well as the internal microphone are located: The XLR and RCA inputs allow a signal to be fed into the AL1. We recommend using the XLR input for best performance (minimum noise floor and best dynamic range). In case a measurement microphone with unbalanced output is used, connect to the XLRinput between pin 2 and 3. A 3.5 mm (1/8 ) jack headphone monitor output is used to monitor the electrical input signal. The internal microphone is used to test the polarity of loudspeakers and for delay time measurements. SPL measurements are not supported with this internal microphone. XLR & RCA Inputs Monitor Output Internal Microphone Note: Never connect the XLR- and the RCA input at the same time! 11


12 Battery Replacement After unpacking, insert three (3) 1.5 V alkaline batteries, type AA, LR6, AM3 into the AL1 battery compartment as shown below. The typical life-time for a set of alkaline batteries is 16 hours. Notes: We do not recommend the use of rechargeable NiCd- or NiMHbatteries. Do not insert batteries of different types. Replace all batteries at the same time - never mix old and new batteries. Ensure the correct polarities of the inserted batteries. Remove the batteries as soon as they are flat or if it is not intended to use the instrument for an extended period of time. 12

13 3. Basic Operation Despite the wide range of availability of measurement functions and optional setups, the operation of the Acoustilyzer is almost self-explanatory. Menu Bar Test Result Escape button Power On/Off- Backlight Enter / Cursor Keys The LCD is divided into the menu bar on top and the measurement results displayed below. The cursor keys and the escape button allow straightforward navigation through the available features Actual settings (measurement function, filters) Measurement results (numeric or graphic display) 13
14 Start-up Screen The start-up screen remains displayed by pressing and holding any button during the start-up of the unit. This allows you, for example, to read the instrument serial number of your device. The serial number starts with three letters (e.g. ANK675A2A2). After the successful registration (See details in Free Registration of your Test Instrument later in this user manual) of your AL1 the start-up screen may be customized (See details in Customizing the Start-up Screen later in this user manual). Menu Bar Use the menu bar to select the basic test configurations. Measurement Functions Screen Selector Input Filters Setup Screen Memory Menu & Battery Status Indication 14
15 Measurement Functions SPL/RTA: SPL & RTA measurement RT60: Reverberation Time FFT: Real time zoom FFT Polarity: Speaker polarity Delay: Delay time RMS/THD: RMS level and distortion STI-PA: Speech intelligibility Calibrte: Calibration menu Screen Selector The SPL/RTA, RT60 and STI-PA measurement functions can be viewed in two test result screens. For example, the SPL/RTA 123 selector displays the sound level meter screen while the bargraph symbol selector displays the real time spectrum analyzer. Short-cut Hold the ESC button down and simultaneously press the left or right arrow key to switch between the two display screens within the same measurement function. 15
16 Input Filters Depending on the selected measurement function the following sets of filters are available: SPL/RTA function: Filters FLAT Flat frequency response (no filtering) A-WTD A-weighting filter in accordance with IEC C-WTD C-weighting filter in accordance with IEC X-CRV -1 Inverted X-Curve filter in accordance with ISO 2969 RLB (Revised Lowfrequency B-curve) Broadcast Loudness filter in accordance with AES Paper Loudness Assessment of Music and Speech 2004 Applications Overall sound pressure level; all sound signal components are included without weighting - required for special applications. Applicable to most common sound pressure levels if level weighting compensation for human loudness perception is required. Applicable to higher sound levels if level weighting compensation for human loudness perception is required. Required for cinema installations Applicable for loudness measurement of broadcast material. The revised B-weighted Leq measurement (RLB) has the best correlation to the subjective experience of humans. 16
17 RMS/THD function: Filters FLAT Flat frequency response (no filtering) A-WTD A-weighting filter in accordance with IEC C-WTD C-weighting filter in accordance with IEC HP400 Highpass 400 Hz in accordance with DIN 45045, -120dB/dec. HP19k Highpass 19 khz Applications Overall sound pressure level; all sound signal components are included without weighting - required for special applications. Applicable to most common sound pressure levels if level weighting compensation for human loudness perception is required. For example, measuring residual noise of a device in sound broadcasting applications. Applicable to higher sound levels if level weighting compensation for human loudness perception is required - for special applications. Removes any mains frequency (50/60Hz) components from the test signal. Removes any low frequency components from the test signal, e.g. to measure critical public announcements systems with no audible change to the signal (using a 20kHz pilot tone level) 17
18 Setup Screen The setup screen allows customization of basic settings of the Acoustilyzer AL1: Move the cursor to the corresponding field and press the enter key. Select the required status using the arrow keys. Press the enter key to confirm. AUTO POWER OFF defines the time period, after the last keypress, after which the AL1 is switched OFF automatically. The available settings are 3 MIN, 10 MIN, 30 MIN, 60 MIN and DISABLE. If DISABLE is selected, the user has to turn the unit off manually or it will run until the batteries are discharged. AUTO LIGHT OFF defines how long the backlight stays on after any key stroke. Possible selections are 3 SEC, 10 SEC, 60 SEC and DISABLE. If DISABLE is selected, the backlight will stay on until the unit is switched off. Note that the backlight reduces the lifetime of the batteries. Acoustilyzer operation with MiniLINK PC Software During the operation of the AL1 with the MiniLINK PC software, the AL1 is powered from the PC and the Auto Power Off and Auto Light Off power-saving functions are disabled. After the PC software MiniLINK is closed, and until the USB cable is disconnected, the Acoustilyzer continues to be powered from the PC but these power-saving features are again enabled. LCD CONTRAST adjusts the contrast of the display. Alternatively, hold the ESC button down and simultaneously press the up/down arrow key while in any measurement function. MULTIPLE SETUP allows storage of up to four individual settings. To enable the multiple setup mode, set the corresponding entry to ENABLE and confirm. The next time the Acoustilyzer is switched on, the user will be prompted to select the individual setup-id (1, 2, 3 or 4) in the startup screen. All parameter settings in all measurement functions are now stored under this ID at switch off. 18
19 Memory Menu & Battery Status Indication All measurements can be stored into the internal instrument memory. Each record is saved with a file name consisting of the test mode and a continuous running number from , such as A001_RMS_THD or A002_RT60. After 999 the running number starts again with 000. You can store the test results as follows: STORE+BMP Saves the numeric test results including the graphical screenshot, indicated by BMP (bitmap), in the memory overview. STORE Saves the numeric test result only, thus occupying less memory space. VIEW + DELETE The stored measurement results are listed in decending order, so the latest recorded measurement is always on top of the list. The remaining memory space is displayed in the right-upper corner of the screen. 19
20 All screenshots marked with BMP can be reviewed directly on the instrument. Select any record in the list using the cursor. Press and hold the enter key. The recorded measurement is displayed on the instrument screen The selected record is marked in the memory menu with the shaded square on the left. You can recall the marked record at any time later by holding down the ESC button and simultaneously pressing the enter key. Delete individual memory records Individually stored results can be deleted from the memory. Select the DEL field beside the memory location to be deleted. Select OK within the pop up window and press the enter key. The memory location is deleted from the device memory. Delete all memory records The complete memory can be deleted by selecting the field DEL ALL. 20
21 LOAD Various Acoustilyzer functions support test result data loading from the internal AL1 memory. This feature is useful for reviewing test results of measurements previously stored on the test instrument. The following measurements support this feature: SPL/RTA RT60 FFT STI-PA Note: Any ongoing measurement is continuing during loading and viewing of a previous test result. Application example using SPL/RTA: Select LOAD in the memory menu and press enter. The data available for loading is displayed. Select the test result of interest. Confirm the selection with the enter key the square symbol on the left of the selection is shaded. Press the ESC button (cursor jumps to OK) and confirm with enter. 21
22 The loaded test result is displayed on the active AL1 screen and the abbreviation LOD flashes in the status bar memory field. The individual band levels can be viewed, the Y-axis altered or even the Leq or min/ max test result shown. Return to the live mode by selecting LIVE MODE in the memory menu of the upper menu bar. Low battery indication A low battery symbol is displayed in the MEM field of the menu bar when a change of batteries is required. 22
23 4. Measurement Functions Overview Function SPL/RTA RT60 FFT POLARITY DELAY RMS/THD STI-PA CALIBRTE Test Result Screens Test Features Sound Level Meter Sound pressure level SPL, MAX/MIN SPL, Leq, LCpeak Real Time Analyzer 1/1 and 1/3 octave real time spectrum analyzer showing SPL, MAX/MIN SPL & Leq per band Reverberation Time in octave band resolution based on T20 results Reverberation Time detailed test results listed in seconds, including correlation factor Real-time Zoom FFT Polarity Test of acoustic speaker or electrical line signals Delay Time Propagation delay measurement between electrical reference and acoustic signal Electrical Measurements Level RMS, THD+N, Frequency Speech intelligibility with STI or CIS values. Visible after STI-PA license key has been activated Speech intelligibility Individual Leq and STI-PA modulation indices of test frequency bands Calibration Menu for external measurement microphones, sensitivity set by default to NTi Audio MiniSPL 23
24 SPL/RTA - Sound Level Meter The Acoustilyzer features a comprehensive, integrating sound level meter with timer for single or repeated measurements. All results may be logged into the internal memory for further review. The measurements displayed on the big and small result position may be chosen among SPL Actual sound pressure level MIN SPL Minimum sound pressure level MAX SPL Maximum sound pressure level Leq time-averaged sound pressure level PreLeq Leq of the previous timer period (only available when timer is in repeat mode LCpeak C-weighted peak sound pressure level The Timer can be configured to Stop the Leq, LCpeak and MAX/MIN SPL measurements after a user-defined time period Reset the Leq, LCpeak and MAX/MIN SPL measurements after a user-defined time period in order to start a new measurement Timer Status Pause Reset Test Cycle Period Measurement Timer, Clock Big Result Small Result Input Range indicator arrows SPL Bargraph and range indication Time Weighting indicator / selector 24
25 Test Applications: Timer Status Setting TIMER OFF (applicable for standard measurements) All values are recorded and monitored continuously. The measurement timer shows the actual testing period length. Pressing the RESET icon sets the clock and the test results back to zero. TIMER SINGLE Sound pressure level measurement with user-defined time setting. Set the required test cycle period. The clock counts back to zero. After the defined test time is completed, the clock flashes The test results Leq, LCpeak and MAX/ MIN SPL are frozen. Changing the test cycle period setting or pressing the RESET icon restarts the measurement. TIMER REPEAT Automatically repeat measurements with user-defined test time interval. Set the required test cycle period. The measurement timer counts back to zero. When the test time has elapsed, the clock and the test results are reset and a new measurement is started. The previously measured Leq is displayed as PreLeq (useful for Leq monitoring at live concerts) Changing the test cycle period or pressing the RESET icon restarts the measurement. 25
26 Pause: The Leq, LCpeak and MAX/MIN measurements can be paused Select the PAUSE symbol and press the enter key. The PAUSE symbol flashes. The actual SPL value is continuously measured and displayed. Select the pause symbol and press the enter key to continue the measurement; the clock continues to count. Reset: Pressing the RESET icon restarts the measurement. The timer and test results are reset. Test Cycle Period: Applicable in SINGLE and REPEAT timer status only. SINGLE: Set to 10 min by default REPEAT: Set to 10 sec by default Measurement Timer: Actual measurement in hours:minutes:seconds. Big and Small Result: Two of the previously-listed measurements may be display at the same time. Time Weighting: All SPL measurements (SPL and MAX/MIN SPL) are time-weighted measurements. Changes in the SPL level are smoothed, resulting in quicker or slower change of the displayed value. Available time weightings, corresponding to IEC 61672, are SLOW (long attack and release response time, t = 1s) FAST (short attack and release response time, t = 125ms) The time weighting for the broad band values ( ) and the RTA ( ) are always the same. Overload The OVL (Overload) flashes if the input voltage exceeds the selected input range of the instrument. As long as the OVL is flashing the displayed Leq and LCpeak results are not accurate. 26
27 Input Range Selector & Bargraph In the SPL/RTA Mode the AL1 has three measurement ranges (RNGE). The span of each range depends on the sensitivity of the microphone used. For a MiniSPL with a sensitivity of 20mV/Pa the measurement ranges are: 20 to 100 db 40 to 120 db 60 to 140 db The selected input range is displayed at the bottom of the bargraph and may be changed by operating the range indicator arrows. The bargraph provides an analog display of the actual sound pressure level. Primary Indicator Range To achieve best measurement accuracy the appropriate range, called the primary indicator range, must be selected. Correct setting avoids overflow indications and lowers the influence of noise on the measurement result. The two range indicator arrows assist the user to set the optimal range. As soon as the indicated bargraph value is found lower than the primary indicator range, the down arrow symbol below RNGE will start to move, symbolizing that the actual SPL measurements are inaccurate. The bargraph range needs to be changed manually by selecting the moving left arrow symbol and pressing the enter key. Note: Changing the ranging resets all ongoing measurements. When exceeding the primary indicator range, three overload arrows replace the big result reading. Select the right arrow below RNGE and press enter to change to the next higher bargraph range. 27
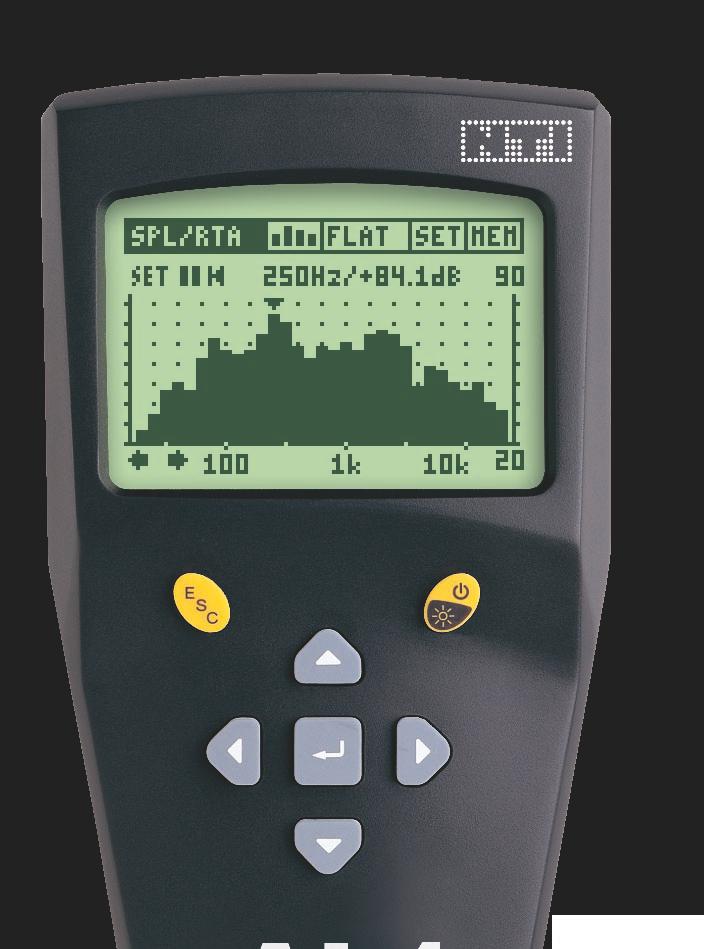
28 SPL/RTA - Real Time Analyzer RTA The Acoustilyzer sound level meter features 1/3 rd or full octave band test results using class 0 filters. The SPL, MAX / MIN and Leq values are displayed per band. Stored spectra may be averaged by using the available mathematical functions. The MAX-MIN display is particularly helpful for characterizations of listening areas. Set Menu Pause Reset Cursor Readout Audio Spectrum Input Range indicator arrows X-Axis with manual range selection Y-Axis The audio spectrum is displayed without interrupting any ongoing sound level measurements, so e.g. changing from to screen will not interrupt the ongoing sound level measurements. Input Filter The SPL/RTA input filter for the broad band values ( ) and the RTA ( ) may be selected independently - so e.g. a FLAT RTA is available while the broad band values are acquired using an A weighted filter. Please note that only various filter combinations are possible. Note: Changing filter settings re-starts the ongoing measurement. 28
29 Set Menu The SET menu provides access to measurement settings and display options as listed below: RES - Resolution Select 1/3 rd octave or full (1/1) octave band resolution by pressing the enter key. SHOW - Test Result The actual SPL, MAX/MIN SPL and Leq can be displayed per band. The actual SPL is displayed with filled bars. The Leq spectrum is displayed with framed bars. The MAX/MIN SPL range is displayed with filled bars. The cursor readout shows either the maximum, the max-min difference or the minimum sound pressure level of the selected band. Simply toggle through these results with upper & lower arrow keys: - max. SPL - min. SPL - max. - min. SPL 29
30 TWTD - Time Weighting Applicable for the actual sound pressure level measurement. The available response times, corresponding to IEC 61672, are SLOW (long attack and release time) FAST (short attack and release time) The time weighting for the broad band values ( ) and the RTA view ( ) are always the same. HOLD - Cursor Hold The cursor indicates the band of highest sound pressure level. For simple readout and traceability the cursor can remain for 1-9 seconds at the frequency band with the highest level. This may e.g. support finding of feedback frequencies. Cursor Readout: Actual level result in the indicated frequency band. The cursor readout displays the center frequency and the level of the band pointed to by the arrow. The cursor automatically jumps to the highest level band in the spectrum. Alternatively the cursor readout may be controlled manually: Select the readout data field and press the enter key. A frame flashes around the data readout. Move the cursor and read the corresponding test results. Pause / Reset / Input Range Indicator / TWTD - Time Weighting: These controls are exactly the same as found on the sound level meter screen and also effect both, the RTA and the sound level meter measurement (e.g. pressing PAUSE in the RTA screen also pauses the broad band Leq, LCpeak and MAX/MIN SPL measurements).. 30
31 X-Axis: Logarithmic scale fixed to 20 Hz - 20kHz Y-Axis: The scaling of the spectrum s Y-axis (sensitivity) can be adjusted manually. Select the displayed upper value of Y-axis and press the enter key. Use the up/down keys to scroll the displayed level along the Y-axis and the left/right keys zoom in/out the Y-axis, e.g. to alter the display resolution. 31
32 SPL/RTA - Memory Functions The SPL/RTA mode includes special memory features, such as SPL/RTA - Sound Level Meter LOGGING: records the measured parameters to the internal device memory every time the log interval t expires (in table form). SPL/RTA - Real Time Analyzer RTA LOAD: loads stored test results into the active AL1 display for review. MATH: completes mathematical averaging of various stored measurements selected from the memory. Logging The Acoustilyzer can record various levels over time into the instrument memory. e.g. for monitoring sound levels during an event for many hours. Every time the recording interval t elapses, the results are stored and values marked with _dt are reset. The logging may stop automatically after the preset measurement time has elapsed. The results can then be loaded to a PC and visualized as a level diagram using, for example, Microsoft Excel. Note: The stored results remain within the AL1 memory even in the event of a battery failure during the recording session. The following parameters are recorded during the logging: Leq PreLeq Leq_dt Leq over the whole measurement period. The measurement period is indicated and controlled by the measurement timer. Leq of the previous measurement timer period (in timer repeat mode only). Short time Leq of the actual log interval t. Leq_dt values may be combined to derive the Leq of any desired period: 32
.")
33 N 1 LEQ = 10 log 10 N n= 1 LEQ _ dt 10 n MIN_dt MAX_dt Minimum SPL value measured within the actual log interval t; time weighted value (SLOW/FAST). Maximum SPL value measured within the actual log interval t; time weighted value (SLOW/FAST). Example of an SPL/LEQ log visualized with Microsoft Excel (without LCpeak) LCpeak Maximum C-weighted peak sound pressure level during the whole measurement period. The measurement period is indicated and controlled by the measurement timer. LCpeak_dt Maximum C-weighted peak sound pressure level during the log interval t. SPL_Act Indicates the actual SPL level measured exactly at the end of the log interval. Note that Leq_dt, MIN_dt and MAX_dt characterize an interval more appropriately than this single SPL_Act value. 33
.")
34 Example of an SPL/LEQ log visualized with Microsoft Excel (LCpeak only) OVER_dt A 1 indicates an overload during the log interval t (thus all values tend to be too low). OVER_Hold A 1 indicates an overload during the measurement period. UNDER_dt A 1 indicates an underload during the measurement period (thus all values tend to be too high). Prepare Logging Select LOGGING from the Memory Menu. This will bring up the Logger Setup Screen: Setting of recording time The maximum recording time (END) of the sound pressure level logging depends on the remaining memory and the selected test interval ( t). The logger may record a maximum of about 580 points over a custom defined time. The test interval ( t) and the total logging time can be defined by the user in the format hh:mm:ss. 34
35 Note: During SPL/RTA logging the instrument may be switched to display the audio spectrum. This is possible without interruption to the ongoing log. Review logged records The measurement data is saved under the file name Axxx_LOGSPL, where xxx is a continuous running number. The detailed records can be reviewed using the MiniLINK PC software. LOAD - Loading Test Results For details see the earlier chapter Memory Menu & Battery Status Indication. 35
36 MATH - Mathematical Averaging of Records The MATH function allows averaging of stored test results. Application example: The available previously-memorized data is displayed. Make your selection with the enter key the square symbol to the left of the selection is shaded. Select any number of test results for averaging. Press the ESC button (cursor jumps to OK) and confirm with enter. The averaged test result is displayed on the active AL1 screen and the abbreviation MAT flashes in the status bar memory field. The individual band levels can be read out, the Y-axis altered or even the Leq or MIN/ MAX test result shown. Return back to the live mode by selecting LIVE MODE in the memory menu. 36
37 Reverberation Time RT60 The Acoustilyzer supports reverberation time measurements in octave band resolution according to ISO3382 with auto trigger, auto ranging and averaging functionality. What is Reverberation Time RT60 Reverberation time RT60 is the time required for the sound pressure level to decrease by 60 db after a sound stimulus signal is stopped. In practice, since ambient noise often defeats measurements of 60dB level decrease, the RT60 results are based on T20 measurements. This requires only a 35 db level decrease within each octave band. The RT60 test result is the extrapolation of the measured 20 db decay. Test Signal It is recommended to use a gated pink noise signal as the test signal. Various test tracks with different on/off time are included on the accompanying AL1 Test CD. Alternatively the Minirator features the required gated pink noise signal. a. Bargraph display Ranging, initial record of environmental noise prior measurement Octave Bands Start Pause Measurement Status Number of Test Results taken for automatic averaging Octave bands scroll 63Hz - 8kHz X-Axis, level with 10 dbspl marks Individual Octave Band Spectrum RT60 Lower Mark Indicator RT60 Upper Mark Indicator 37
38 b. How to measure The room under test is injected with a pink noise signal through speakers. The sound source has to be active until a balance between injected and absorbed acoustical energy has been reached. i.e. allow enough time for the sound to reflect off all surfaces. As a rule of thumb, the noise should be played for at least the number of seconds recorded in the RT60 result. The source signal is then stopped. The AL1 recognizes this interruption, triggers, the decay time is measured and the RT60 test result is automatically calculated. Please follow the RT60 test instruction below: Ranging Select RANGE and press the enter key to measure the actual sound pressure level in the room without a test signal present. The SET RANGE field pops up. Confirm the automatic ranging with OK. Now the RT60 upper mark indicators are set to the minimum pink noise level needed to successfully complete a measurement. The lower marks indicate the environmental noise without any test signal present. 38
39 Start the pink noise test signal with the appropriate on/off time according the room under test. Note: Use an initial low sound pressure level (to protect your ears against excessive sound level and hearing damage). Increase the test signal level until all individual octave band marks for the minimum test signal level have been passed. If required, an equalizer can be used to push up individual band levels. Start RT60 measurement Select the START icon and press the enter key to initiate the reverberation time measurement. The status indication switches to ARMED. Complete several test cycles so an averaged test result can be calculated. The individual octave band sound pressure level increases above the upper marks. Switch off the test signal. Once the sound pressure level has fallen below the lower marks in each individual octave band the RT60 is calculated. Confirmation marks are displayed for successful octave band reverberation time measurements. 39
40 Test result readout The detailed RT60 test results in x.xx seconds are listed in the RT60 test result screen. Select the detailed test result readout screen by Using the screen menu Alternatively press the ESC and the left or right arrow key simultaneously. Note: D u r i n g t h e o n g o i n g R T 6 0 measurement the memory menu is not available. c. RT60 Test Result Readout Delete selected Test Result Start Pause Test Result Selection Number of continuously taken test results Octave bands scroll 63Hz - 8kHz Test Result in seconds Relative Test Result, displayed as bargraph Correlation Factor in % or Measurement Uncertainty Test Result Selection: The RT60 measurement function enables consecutive reverberation time measurements within one test sequence. Automatically an averaged test result of all measurements is calculated. 40
41 Toggle with the left and right AL1 cursor keys through the individual test result cycles and the following results are displayed: Last test result The test result of the last test cycle is displayed when selectiing LAST. Additionally, you can use the upper and lower cursor keys to display the 63 Hz or 8 khz octave band test result. Single test cycle results The individual single test results are marked with CYC xx, whereby xx is an incrementing number. Averaged test result By selecting AVRG the averaged test results of all measurements taken are calculated and displayed. The correlation factor is replaced by the measurement uncertainty factor expressed in %. Relative Test Result, displayed as bargraph: To simplify the data readout the reverberation time is additionally displayed as a bargraph. The bar with the maximum length shows the octave band with the longest measured reverberation time. The other octave band test results are displayed relative to this longest time. Correlation Factor in % Correlation Factor in % (applicable for single test results) This factor will be 100% for perfect linear sound pressure level decay after the source is switched off. Deviations from linearity result in lower correlation values. (typically % for reliable RT60 test results). 41
42 Uncertainty Factor in % Uncertainty Factor in % (applicable for averaged test result) Based on at least three individual test results, the uncertainty factors are calculated. This factor indicates the statistical test result accuracy based on the randomly created pink noise test signal (typically 0-15% for reliable RT60 test results). Please see the standard ISO 3382 for details. Error Indications Delete single test results Various error indications display unsuccessful RT60 measurements, These can be deleted individually. Non-valid results are excluded from average calculations. LOW LEVL This is the abbreviation of low test signal level during the measurement Increase the test signal level, verifying that all levels exceed the upper marks while the source signal is switched on Use an RT60 test signal with longer on/off times, ensuring sufficient time for the lower level marks to be reached after the source is switched off CORR<70% The correlation factor is lower than 70% indicating an unreliable measurement result. T>18S The measured reverberation time exceeds the time limit of 18 seconds, e.g. caused by a unsuitable ranging or environmental noise. In this case repeat the ranging and start the measurement again. 42
43 FFT Analysis The Acoustilyzer includes an extremely fast, real-time Zoom FFT with resolutions of up to 0.7Hz over the entire frequency range. The display shows 93 bins simultaneously. The FFT measurement is the ideal tool for visualization of comb filters and narrow band effects. It allows a detailed investigation of the frequency response of audio systems. Set Menu Pause Cursor Readout FFT Audio Spectrum Start Frequency of Display Size of displayed Frequency Range End Frequency of Display Y-Axis Set Menu The SET menu is used to set the measurement and display options as follows: 43
44 Range - AL1 Input Ranging The Acoustilyzer has different input ranges. The range is set automatically when entering the FFT mode SET the input ranging if any clipping or high noise occurs SHOW - Test Result Select the display of actual SPL or averaged sound pressure level (Leq). The Leq measurement is reset when the range is SET or when SHOW: LEQ is reselected. HOLD - Cursor Hold The cursor indicates the frequency of highest sound pressure level. For simple readout and traceability the cursor can remain for 1-9 seconds at the frequency with the highest level. Pause: The FFT measurement may be frozen for a user-defined time. Select the PAUSE symbol and press the enter key. The PAUSE symbol flashes. Select the PAUSE symbol and press the enter key to continue the measurement. Cursor Readout: Actual level result of the indicated frequency bin. The cursor readout displays the bin frequency and the corresponding level. The cursor automatically jumps to the highest level in the spectrum. Alternatively the cursor readout may be controlled manually: Select the readout data field and press the enter key. A frame flashes around the data readout. Move the cursor and read the corresponding test results. 44
45 X-Axis: Linear scale showing, from left to right, the start frequency, the frequency range and the end frequency within 92 bins. Includes zooming functionality. Y-Axis: The scaling of the Y-axis can be adjusted manually. Select the displayed upper value of Y-axis and press the enter key. Use the up/down keys to scroll the displayed level along the Y-axis and the left/right keys zoom in/out the Y-axis, e.g. to alter the display resolution. How to measure: Select the FFT function. The cursor readout shows the maximum level automatically. Select the cursor readout field and confirm with enter. A frame flashes around the readout data. Read out other values using the left or right arrow keys. Zoom in/out to cursor position Select the cursor readout field. Use the lower arrow key to zoom in up to a 0.7 Hz frequency resolution and the upper arrow key to zoom out. Move the X-axis with left/right key press. Zoom in/out with quick X-axis shifting Select the X-axis frequency range field The zoom in/out functionality refers to the displayed center frequency. Use the left/right arrow key for quick left/ right shifting of the X-axis. 45
46 Application: FFT and White Noise White noise is most often used as a test signal when measuring the performance of acoustical systems. The FFT shows a flat spectrum with this input signal. Feeding white noise into an electro-acoustic system and measuring the FFT using a measurement microphone shows the frequency response of the system with very high resolution. Please note that the frequency response seen is most often a combination of two effects: a) The real frequency response of the electronics and speakers b) Interference effects (resulting in comb filtering) With a high resolution FFT, interference effects can easily be seen - while they are nearly impossible to notice on a 1/3 octave resolution RTA. With the Zoom FFT of the AL1 you can Zoom In at any frequency point to a resolution of up to 0.73 Hz. White Noise and Zooming The energy of White Noise is equally distributed over the linear frequency axis. Let s assume we have a White Noise signal with a level of 0 db measured using a bandwidth of 20 khz. 4 x zoom level reduces by 6 db What happens if we decrease the measurement bandwidth to 10 khz? We only measure one half of the energy resulting in a level of -3 db (10*log10(0.5)). This is exactly what happens if we Zoom In using an FFT. Every time we Zoom In the measurement bandwidth is halved resulting in a 3 db lower level in every bin. 46
47 Polarity Test The polarity test function detects the correct cable and speaker polarity in combination with the Minirator MR1 polarity test signal. The Acoustilyzer provides the following test configurations: a. Speaker Polarity Test Feed the speaker system with the polarity test signal of the Minirator. Adjust the level (at MR1 or amplifier) so the test signal is clearly audible. Acoustilyzer settings: IN:MIC (INT), using the internal mic of the Acoustilyzer AL1 IN:XLR/RCA, using an external mic, such as the MiniSPL Choose the polarity test frequency range: FULL/MID, for wide band speaker tests WOOFER, for woofer tests Notes: Please note the polarity testing is a simplified measurement of a very complex signal phasing. Drivers, speakers and cross-overs cause severe phase shifts of the audio signal. The polarity of various speakers within the same cabinet can be different. This is often by design and is therefore not a problem. Polarity testing is most useful for checking the correct wiring of similar speaker systems. 47
48 b. Cable Polarity Test Use the polarity test signal of the Minirator to feed the cable under test. The Acoustilyzer analyzes the signal polarity at the other end of the cable. Acoustilyzer settings: IN: XLR/RCA, Mode: Cable The following problems may be detected quickly and easily: Wrong polarity, caused by wrong or defective wiring inside the cable Cable problems, unsymmetrical signals; displayed with the balance indicator, such as 2UBAL indicates an audio signal only on pin 2 of the symmetrical XLR cable no signal on pin 3. -UBAL3 indicates an audio signal only on pin 3 of the symmetrical XLR cable no signal on pin 2. The balance indicator being out of center indicates other cable problems as explained in detail in the NTi Audio application note Signal Balance (available for download at the NTi Audio website). The level measurement is very useful for applications, such as testing of multicore cables (see the NTi Audio website for application notes). 48
49 Delay Time The setting of the acoustical propagation delay time from speaker to speaker in e.g. churches or auditoriums, is required so the listening public perceive the direction of speech as coming from the speaking person s actual position and not from the side or rear speakers. The Acoustilyzer measures the delay time of the acoustic speaker signal (using the built-in microphone) against the electrical line reference signal (connected at RCA or XLR input). The delay time test signal that has to be used is provided on the AL1 Test CD. Delay Time Memory Automatically calculated Delay Time Store - Actual Actual measured Delay Time to Electrical Reference Signal Converted Delay Time in meter/feet Start Synchronization Synchronization Time Bar 100% = 100 seconds Status Indication Synchronization: The automatic synchronization allows delay time measurements without any connected electrical reference signal for 100 seconds and displays the time remaining until the next required synchronization. Manual Synchronization: Initiate a manual synchronization by selecting SYNC. 49
50 How to measure Note: Please de-activate any shock protection of the CD-player since this might cause incorrect test results! Test preparations Switch on the acoustical delay time measurement signal, available on the AL1 Test CD. Connect the electrical signal, e.g. from the CD player, to the AL1 RCA or XLR input. Wait until the Acoustilyzer synchronizes to the incoming delay time test chirp and the synchronization time bar fills up to 100%. The delay time measurement is conducted between the synchronized electrical input signal and the built-in microphone of the Acoustilyzer. Measure Reference Speaker Select a speaker as reference speaker, called speaker A, e.g. the first speaker in the delay line. Position yourself in the sound field of the next speaker under test, e.g. called speaker B, to measure the delay time compared to the reference speaker A. Note: Do not position the Acoustilyzer too close to reflecting surfaces, such as walls or floors. The reflections may interfere with accurate measurements. 50
51 Change [m][ C] [feet][ F] Enable the test signal at the reference speaker A. Switch off all other speakers. The delay time of the acoustic signal with reference to the electrical input signal is displayed in milliseconds. The distance result in meter/feet is displayed for easy verification of the test results. The readings are based on 330 m/s sound speed at 0 C / 32 F. Set the actual environment temperature, so the distance is displayed correctly. Store reference Select STORE to memorize this test result as reference record for further delay time measurements. The stored reference delay time is shown in the delay time memory field. Measure Propagation Time at Speaker B Enable the test signal at the speaker B. Switch off all other speakers. The acoustical delay time of speaker B with reference to the electrical input signal is displayed as big test result. Automatic Time Difference Calculation The delay time difference is automatically calculated and shown in the upper small STO-ACT (stored - actual) field. The automatic difference calculation simplifies the verification of delay line arrangements, e.g. used in larger halls or auditoriums. 51
52 Electrical Measurements - RMS/THD The Acoustilyzer supports basic electrical measurement functions, such as Level RMS - Root Mean Square; reflects the absolute level of the line input signal. THD+N - Total Harmonic Distortion plus Noise; besides checking the linear purity of a sine signal - e.g. measuring the amount of harmonic distortions - this mode is particularly suited to get a quick idea whether unwanted interferences, like hum, are present. Signal Frequency Signal Balance Indicator Level RMS Result and Unit Distortion THD+N Level RMS: The units dbu, dbv, dbspl and V are selectable. Distortion THD+N: The distortion measurement, expressed in db or %, is carried out in the bandwidth 10 Hz - 20 khz. 52
53 Signal Balance shows the matching deviation of the incoming signal between pin 2 and pin 3 in percent (%). The arrow position indicates the following: Arrow in center, the input signal is balanced. Arrow out of center, linear indication of a balancing problem, e.g. arrow moves left nearer to the number 2 shows the signal level on pin 2 is higher than on pin 3. Arrow at left or right end, the signal balance error is 33% or higher. 33% equals a difference in the signal level of 6 db. 2UBAL-, indicates an audio signal only on pin 2 of the symmetrical XLR cable no signal on pin 3. -UBAL3, indicates an audio signal only on pin 3 of the symmetrical XLR cable no signal on pin 2. Notes: The Adapter -20dB should be applied for balanced input levels higher than +20 dbu (see Accessories for details). The THD+N results are calculated using a measuring bandwidth of 10 Hz - 20 khz. 53
54 Speech Intelligibility STI-PA (optional) The speech intelligibility measurement STI-PA is an optional sales package for the Acoustilyzer AL1. Ask your local representative for purchasing details. The STI-PA analyzer option allows reliable measurement of the speech transmission index within 15 seconds. Besides the single value STI or CIS test result, a detailed view of the modulation indices and individual band level results is provided. The STI-PA analyzer fulfills the latest 2003 IEC standard and is a TNO verified algorithm (Dutch STI-PA research institute). Find more information about speech intelligibility basics and the historical developments in the Appendix to this user manual. a. STI-PA Measurement Screen Start Measurement Measurement Progress Bar (0..15 seconds) STI-PA Test Result Actual Sound Pressure Level Measurement Status Indication Analogue STI-PA Bargraph STI-PA Test Result: Single-value speech transmission index result in STI (speech transmission index) or CIS (common intelligibility scale), whereby CIS is calculated as CIS = 1 + log STI. Sound Pressure Level: Shows actual SPL value in dbas (A-weighting frequency and Slow time weighting). 54

55 b. How to measure Select the STI-PA function. Monitor the actual sound pressure level of your environment on the Acoustilyzer display. Preconditions: To avoid measurement failures the STI-PA test signal level should be at least 60 dbspl. The STI-PA measurement should be carried out in simulated emergency conditions (same sound pressure level and all components activated). No impulsive noise events should occur during the 15 seconds measurement time. NOTE: Even intermittent noise may affect the STI-PA test result. Signal Source: The NTi Audio TalkBox can simulate a human talker at normal and emergency speaking levels, enabling the measurement of the complete system including the acoustic signal to the microphone (directivity, room characteristics, etc.). Place the NTi Audio TalkBox at the typical human speaker position. The Minirator MR-PRO or a CD Player (with the NTi Audio CD STI-PA V1.1 or higher) can be used for electrical signal injection for system tests without the microphone. 55
56 Start the STI-PA test signal. Set the acoustical sound pressure level of the PA system according the typical emergency condition requirements, e.g. 85 dbas. Press START on the AL1 menu to initiate the measurement. Ensure that there is no speaking or additional noise near the measurement microphone during the measurement. A STI-PA measurement takes 15 seconds. The elapsed test time is visible in the upper measurement progress bar. The test result tendency is shown on the STI-PA bargraph below, marked with BAD, PR (poor), FR (fair), GD (good) and EXLT (excellent). After the 15 seconds test cycle time the Measurement Status Indication switches to FINISHED and the final STI-PA test result is displayed. On the bargraph below the quality of the speech intelligibility test result is displayed as BAD STI PR (poor) STI FR (fair) STI GD (good) STI EXLT (excellent) STI 56
57 The detailed test result view of the modulation indices and individual band level results is provided on the second STI-PA measurement screen. c. Detailed Test Result Readout STI-PA Octave Bands Error Detection Individual Octave Band LEQ Level STI-PA Modulation Index 1 STI-PA Modulation Index 2 STI-PA Modulation Index 1 & 2: For high speech intelligibility it is mandatory that the integrity of the transmitted voice signal modulations are preserved. Therefore STI-PA is based on measuring the MTF (Modulation Transfer Function). This function quantifies the degree to which the voice modulations are preserved in individual octave bands. STI-PA determines the MTF by analyzing all seven frequency bands, each band being modulated with two frequencies, resulting in the modulation index 1 and index 2 57
58 d. STI-PA Post Processing Measuring speech intelligibility index in realistic environment conditions is often not applicable, e.g. playing the test signal in a railway station at emergency levels during peak hours will irritate passengers. Additionally, at rush hours the characteristics of background noise is likely to be highly impulsive, while a prerequisite for accurate STI-PA measurements is a negligible impulsivity in the background noise. Under such circumstances the STI-PA measurement should be shifted to a more suitable time of the day, e.g. at night. Such STI-PA measurements taken with atypical background noise conditions have to be post-processed. Post processing combines the STI-PA measurement data taken with quasi noise-free ambient conditions with the unweighted octave band noise levels (Leq) taken e.g. during day time with realistic environmental conditions. The STI Reporting Tool is exactly tailored for this application e.g. to combine the night and day time measurements. It creates measurement reports according to the IEC and VDE0833 standards. Import the data directly from your XL2 including the ambient noise measurements. The corresponding speech intelligibility STI or CIS values are shown. The STI Reporting Tool is free to download on the XL2 Support website for all registered users. (Enable all macros when opening the document.) System Requirements: - PC running Windows XP, Windows 7, 8 or 10 - Excel (32 bit or 64 bit versions) 58
59 e. STI-PA Error Detection The Acoustilyzer STI-PA measurement function has a built in error detection which helps you identifying faulty measurements. The error detection checks the following parameters: Invalid modulation indices (MF1 or MF2 > 1.3) Irregularities during ongoing measurements Both parameters depend on the amount of impulsive environmental noise. Impulsive environmental noise influences the accuracy of any STI-PA measurement. If the error detection finds any problem, the common STI-PA test result display is interrupted with flashing?.?? question marks. This error indication might be caused either by missing test signal level, or impulsive background noise events Detailed test result screen The octave bands detected with irregularities, are marked with a question mark (?). Recommendation If the error detection finds any faults, NTi Audio recommends you repeat the measurement and compare the STI test result with the previous ones. 59
60 f. STI-PA Measurement Hints 1. Any background noise has to be sufficiently static during the measurement, e.g. pink noise fulfills this requirement. 2. Verify the environmental conditions prior to testing. Run STI-PA measurements without any test signal - the results should be < 0.20 STI. 3. Impulsive background noise during the measurement, such as speech, causes severe measurement errors. The STI-PA result is usually too high. 4. In case such impulsive noise cannot be prevented, the measurements might be shifted e.g. to the night time, and afterwards corrected with the averaged daily background noise, using external post processing. 5. Only high-quality CD-Players should be used to reproduce the STI-PA test signal as only limited time-shifts (+/- 20 ppm) ensure reliable test results. Pitch control and shock protection should be disabled. We recommend that only professional CD-Players be used. You can verify the time shift of the CD-Player using a 1 khz test signal: Insert the NTi Audio Test CD into the CD-Player and start track 1, which is the 1 khz test signal. Connect the Acoustilyzer directly to the audio output of the CD-Player and measure the signal frequency in RMS/THD mode. The displayed frequency should be in the range from Hz to khz 6. The STI-PA test signals of other test system manufacturers may sound similar but are not compatible. Only the NTi Audio STI-PA test signal CD V1.1 or higher should be used in combination with the Acoustilyzer AL1. 7. STI-PA measurement of alarm systems should be carried out in simulated emergency conditions (same sound pressure level and all components activated). 8. At locations with variable conditions, e.g. public areas with few people or crowded areas, the worst-case STI-PA results have to be measured. 60
61 9. Select typical locations, such as positioning the microphone at meters above ground in sitting areas or meters in standing areas (typical worst-case measurement positions are normally not directly in front of the speakers) 10. The person taking the measurements should be out of the acoustic field, so as to not affect the measurement results. For this purpose the measurement microphone can be mounted on a mic stand and connected electrically (using an extension audio cable) to the AL Low STI-PA readings can be caused by Excessive sound reverberation, echoes or reflections Poor speaker directivity or speaker coverage Speaker power setting not in order (e.g. low signal-to-noise ratio) Incompatible speaker polarity Please see the NTi Audio website or Appendix for further information. 61
62 Calibration In order to obtain correct measurement results, the sensitivity of the microphone connected to the AL1 must be set and calibrated accordingly. The microphone sensitivity is set by default to the NTi Audio MiniSPL measurement microphone factory adjustment 20mV/Pa. MiniSPL is the standard measurement microphone for the Acoustilyzer AL1. Together they form a comprehensive class 2 acoustical analyzer. Alternatively to the MiniSPL, the NTi Audio M2010 class 1 frequency response microphone can be used for highly accurate class 1 measurements. Microphone Sensitivity Microphone Balance Indicator, arrow has to be centered to verify the balanced mic input singal Default Factory Setting Manual Calibration with external microphone calibrator The following three calibration modes are available: DEFAULT All MiniSPL microphones are factory calibrated to a sensitivity of 20.0 mv/pa. Reset to default setting by: Select DEFAULT Press the enter key 62
63 CALIBRATE The sensitivity may be adjusted with an external calibrator. Select the dbspl value field (default = 114 dbspl), press the enter key and adjust the sound pressure level as provided by your calibrator. Use up/ down keys for 1.0 db SPL steps and left/ right keys for 0.1 db SPL steps. The level range db SPL is supported. Confirm the setting with the enter key. Produce the specific reference signal with the calibrator onto the microphone. Press enter to execute the calibration, whilst the reference signal of the calibrator is still present. The frame WORKING... followed by the frame CALIBRATION FINISHED! is shown centered on the calibration screen. The new sensitivity is shown in mv/pa. Enter the SPL/RTA mode and check the calibration by applying the reference signal again to the attached microphone. The sound pressure level of the calibrator shall be shown to confirm that the calibration has carried out correctly. In case of calibration problems various error indications may be displayed, indicating too low or too high input level. the calculated sensitivity is out of the range 2-80 mv/pa. 63
64 Manual sensitivity setting Select the sensitivity value field, Press enter and adjust the sensitivity using the up/down keys for 1.0 mv/pa steps and left/right keys for 0.1 mv/pa steps. The setting range 2-80 mv/pa is supported. Press enter to confirm the setting. 64
65 5. MiniLINK PC Software The MiniLINK PC software enables the transfer of stored measurements from the Acoustilyzer AL1 to a PC. Additionally online data logging from the AL1 directly to the PC is supported Installation a. Start-up the PC with Windows XP, Windows 7, 8 or 10 (32 bit or 64 bit version). b. Insert the enclosed MiniLINK CD into the CD drive. c. The MiniLINK software installation starts automatically. Follow the instructions on the screen. If the CD auto-start is disabled on the PC, follow the instructions below: Click Start Run on the windows taskbar. Type d:\setup (assuming d is the letter of the CD drive) Confirm with ok d. Use the supplied USB cable to connect the AL1 to the PC. Windows recognizes the new hardware component automatically and starts the hardware installation assistant. e. The pop-up window Digital signature found will be displayed. Confirm this and continue with the installation. 65

66 Start the MiniLINK PC Software After the successful driver installation, the MiniLINK software can be started. To start the software follow the windows path Start Program MiniLINK. The analyzer switches on automatically and the following screen is displayed on the monitor: The AL1 is now powered by the USB interface and therefore switches on by itself. During the operation with the connected USB interface the batteries should not be removed from the device. 66
67 Free Registration of your Test Instrument The Acoustilyzer includes additional bonus features, enabled after the registration of the test instrument at the NTi Audio web site. Overview of available bonus features: Instrument Function Display AL1 Customized start-up screen Online registration: After the start-up, the MiniLINK software automatically suggests the registration of non-registered connected instruments. The test instrument needs to be connected to the PC. Proceed with the automatic registration or alternatively select the MiniLINK menu Help Register. Offline registration: Register your device at Key in your details and the serial number of the device. Read out the instrument serial number from your device by starting the instrument and keeping any button pressed. The start up screen remains displayed. The serial number starts with three letters (such as ANK675A0A2). After successfully registering your device, you will receive an with your registration key within a few minutes. Please insert this key in the MiniLINK menu Help Register. The test instrument needs to be connected to the PC. 67
68 Readout of Stored Test Results The analyzer memory is automatically transferred to the PC and visualized through small screenshots on the MiniLINK memory window. Note: The MiniLINK memory window remains empty when no test results are stored on the instrument. Otherwise, use the PC mouse to click onto the AL1 Memory tab to initiate and update the data memory window. The test instrument display on the PC is synchronized to the actual LCD screen display of the connected audio analyzer. The title bar shows the serial number and firmware version of the test instrument. MiniLINK PC Software Release Version Firmware of connected audio analyzer Synchronized Display Serial Number of connected audio analyzer 68

69 Visualizing the Test Results All stored screenshots are shown in the MiniLINK tab AL1 Memory. Stored screenshot incl. numerical results Stored data without screenshot Arrows indicating additional numerical test results are stored together with this screenshot Big view of screenshots A double click on a screenshot will enlarge the screenshot. In this mode the menu allows printing, saving or copying of the screenshot or the numerical test results. Any available numeric table is listed below the big view screenshot. 69
70 Copying of Test Results and Screenshots The displayed screenshots can directly be copied into reports for documentation. Select the menu Edit Copy Bitmap to choose the graphics or select the menu Edit Copy Text to choose the numerical measurement data Insert the clipboard into the reporting document (such as Excel) with Ctrl + V. Alternatively import the stored *.txt file, including the numerical measurement data, e.g. to Microsoft Excel by using the Excel import assistant. 70

71 Example: Display of SPL/RTA test results The SPL/RTA sound pressure level measurement provides the following test results: Test configuration Time, relative to logging start All relevant sound level parameters (please refer to section SPL/RTA - Memory Functions for details). 71

72 Save Test Results & Screenshots The displayed screenshots can be saved as bitmap files (*.bmp) and numeric data as text files (*.txt) to the hard drive. The file names consist of the first six device serial number digits and the screenshots name. For example the screenshot A011_RT60 recorded e.g. with an Acoustilyzer S/N ANK675 is saved as ANK675_A011_RT60.bmp & ANK675_A011_RT60.txt This enables the storage of various test results from more than one audio analyzer on the same PC. Save the stored test results as follows: Select the screenshots to be saved in the memory field. Press the SAVE button or select in the menu File SAVE. The menu below will be displayed. The directory path may differ according the installed Windows system. Select the SAVE/DELETE configuration and press SAVE. 72
73 When saving the screenshots to the PC the same values on the AL1 memory can be simultaneously deleted. In the above displayed menu, simply select Delete files in instrument memory after save to simultaneously empty the test instrument memory. Delete Test Results of Analyzer Memory The memorized test results in the test instrument can be deleted as follows: Directly in the test instrument memory overview Select the screenshot in the MiniLINK memory screen and press DEL on the PC keyboard or use the delete function of the MiniLINK memory menu Select the delete function when saving the screenshots/test results to the PC Test Result Logging at the PC MiniLINK also allows the continuous logging of the Acoustilyzer test results online in user-defined time intervals. This test data is saved into the default log file software directly. At the end of the logging process, press the SAVE button to save and the data will be saved under the file name e.g. ANK675_PcLog_Level SPL. The logging function is ideally suited for long term monitoring or troubleshooting, e.g. in repair or broadcast applications. Note: For sound pressure logging of specific events the tick box Reset Leq on Start has to be enabled. This resets the device timer of the Acoustilyzer at the begin of the online logging and a new measurement is started automatically. 73
74 icon for direct copying of present screenshot To log online results, please: Select the requested measurement function on the test instrument Select the Logging screen in the MiniLINK PC Software menu Select the required log time interval Press the START button to start the test result logging Press the STOP button to end the logging process Press the SAVE button to save the record to file Additionally the present screenshot displayed on the MiniLINK PC software can be directly copied to file by pressing the marked icon with the mouse button. Paste the screenshot into any document with CTRL + V. 74

75 Remote Test Instrument Control with the PC MiniLINK supports the remote control of the analyzer from a PC. Just click on the displayed test instrument and all keys can be operated with the mouse or the PC keys as listed below. Click into these areas to change the screen selection (e.g. SPL RTA) On/Off: Ctrl + P ESC Light: Ctrl + L arrow keys & enter Shift or shift or the keys indicated above allow the screen selection of the enabled measurement function to be changed. 75

76 MiniLINK Tools The MiniLINK PC software includes many useful tools: LCD Fullscreen Update Firmware Crossgrade Firmware StartUp Screen 76
77 LCD Fullscreen The actual test instrument display can be shown on the PC monitor in a full screen mode. To enter the full screen mode: Select the MiniLINK menu Tools FullScreen or click on the symbol. To exit the full screen mode: Press the Q button on the PC keyboard or simply click into the screen with your PC mouse. icon for large screen display 77
78 Firmware Update NTi Audio provides free updates of the test instrument firmware and the MiniLINK PC software on the NTi Audio website To check out any available online updates, follow these instructions: Connect your PC to the web & start the MiniLINK PC software Connect the instrument with the USB cable to the PC Select the MiniLINK menu Help Look for Updates Follow the download instructions Alternatively you can check for any new firmware and software releases on the web site Select the MiniLINK menu Tools Update Firmware Select the new firmware version in the displayed screen below: for Minilyzer ML1: ML1dA_V3.xx.bin for Acoustilyzer: AL1dA_A1.xx.bin applicable firmware for the connected device After confirming the selected device firmware, the test instrument firmware is updated automatically. In case of any problems during the firmware upgrade, such as power failure, etc., the upgrade procedure can be repeated anytime. Note: The firmware update deletes the internal device memory. 78

79 Firmware Crossgrade The Acoustilyzer AL1 and the Minilyzer are based on the same hardware platform with different specific firmware installed. The available crossgrade package installs the ML1 firmware into the AL1 or the AL1 firmware into the ML1. Select the MiniLINK menu Tools Crossgrade Firmware Select the displayed firmware version in the screen below: for Minilyzer ML1: AL1dA_A1.xx.bin for Acoustilyzer: ML1dA_V3.xx.bin applicable firmware for the connected device After confirming the selected device firmware, the crossgrade firmware is installed automatically within several seconds. The instrument displays UPDATING FIRMWARE. Note: The firmware crossgrade deletes the internal device memory, thus the customized start-up screen needs to be reloaded onto the instrument. 79
80 Customizing the Start-up Screen The MiniLINK PC software supports the transfer of customized startup screens to the test instruments. Your personal start-up screen will be displayed instead of the factory logo every time the test instrument is switched on. Start the MiniLINK PC software Connect the instrument with the USB cable to the PC Select the MiniLINK menu Tools StartupScreen The following screen is displayed on the monitor: The panel Set Startup Screen displays a sample default factory start-up screen. The white center area (100 x 32 pixels) can be customized by the user. The remaining top & bottom gray area is fixed and cannot be altered. 80
81 Guideline to define the new start-up screen: Use a pre-defined picture. The MiniLINK PC software will convert it to a 100x32 pixels black & white picture automatically. The following file types can be used as start-up screens: *.pcx;*.bmp;*.dic;*.rle;*.ico; *.wmf. Alternatively create a new start-up screen yourself using any picture / paint programs, such as Microsoft Paint. Set the file size to 100x32 pixel and insert any text or graphics for the start-up screen. Save the file as *.bmp* format. Press the button Load Image to select the file containing the new start up screen. The start-up screen preview is displayed on the PC monitor. Press the button Send to Device to transfer the file to the device The audio analyzer then switches off and on automatically, so you can check out your new start-up screen immediately. Sample start-up screens: 81

82 Activate Options The activate options menu is required for Activation of AL1 functionalities on your Minilyzer ML1 or the ML1 functionalities on your Acoustilyzer with the crossgrade package Activation of STI-PA measurement functionalities on the instrument To activate one of the above functionalities Select the MiniLINK menu Help Activate Options The following menu will be displayed Follow the online activation instructions. Additionally detailed instructions are enclosed with the license number within the individual product package. 82
83 6. Troubleshooting Numeric data import of *.txt files to Excel Problem: Numbers are recognized as text only during the import of numeric test results to e.g. Microsoft Excel, so you cannot create tables or use the data for further calculations. Solution: The MiniLINK data files use the. as decimal separator. Therefore please set the decimal separator to. within Excel before starting the import procedure. Alternatively you can use copy paste in the big view mode, select the menu Edit Copy Text and paste the data into an open Excel document. Factory Reset To reset the instrument back to factory settings proceed as follows: Switch off the unit Press the ESC button and the On button at the same time for a few seconds The start-up screens shows up, reading in the bottom line LOADING DEFAULT SETUP The instrument is now reset to factory conditions. 83


84 7. Accessories MiniSPL The MiniSPL is the perfect accessory for acoustic measurements. Together with the Acoustilyzer AL1 a comprehensive integrating sound level meter is formed. The MiniSPL is a self-contained omnidirectional 1/2" measuring microphone with built in impedance converter, pre-amplifier and power supply. It is battery powered with balanced XLR-output. The MiniSPL is classified as class 2 in accordance with IEC and is factory adjusted to a sensitivity of 20 mv/pa. STI-PA Measurement Option The STI-PA analyzer option allows the reliable measurement of the speech transmission index according to the latest IEC standards within 15 sec. Besides the single value STI or CIS test result, a detailed view of the modulation indices and individual band level results is provided. NTi Audio TalkBox The TalkBox is the missing link for the complete evaluation of speech intelligibility in emergency life & safety announcement systems, from the talker s microphone to the listener s ear. The NTi Audio TalkBox presents the standardized voice-like acoustic signal emission simulating a human talker according to IEC , combined with a TNO certified speech intelligibility signal at standardized levels. 84


85 ML1 - AL1 Crossgrade The ML1 - AL1 Crossgrade package enables loading of the Minilyzer firmware onto your AL1, providing test functionalities, such as vu-ppm Balance THD 2nd - 5th harmonics Scope Frequency Sweep Time Sweep Induction Loop Mode Adapter -20dB The Adapter -20dB may be applied for balanced input levels higher than +20 dbu. This passive adapter extends the balanced input range of your Minilyzer/Acoustilyzer up to +40 dbu. The adapter is supplied with pin1-fuse for safe operation in combination with the USB interface MiniLINK. Pouch The soft pouch protects your Minstrument against shocks, dust and water. With its convenient belt-clip you can keep your Minstrument close to you even when you need both hands for other tasks. Now available with a MiniSPL microphone holder, offering a space to store your mic. Minstruments System Case Store your valuable Minstruments test system consisting of the Minirator MR1, the Minilyzer ML1 or Acoustilyzer AL1 and the MiniSPL adequately in the compact system case which gives you extra space for cables, connectors and other accessories you may wish to bring along when you are out in the field checking audio systems. 85
86 8. Technical Specification Measurements Sound Pressure Level Real Time Analyzer Zoom FFT Reverberation Time Delay Time Level RMS, Distortion THD+N Frequency Polarity Test Speech Intelligibility STI-PA (optional) Sound Pressure Level SPL, Leq, LCpeak, Lmin, Lmax in accordance with IEC Timer for single and repeated measurements Dynamic range (using MiniSPL): dba Filters: Flat, A, C, X-Curve -1, RLB (Broadcast Loudness) Logging of SPL/RTA results into AL1 memory Wideband and RTA values simultaneously available Real Time Analyzer 1/3 or full octave band resolution, class 0 filters SPL, Leq and Max-Min display per band Reverberation Time 1/1 Octave band resolution, 63 Hz - 8 khz, based on T20 results, according to ISO3382 1/3 Octave band resolution with post-processing Automatic averaging with individual result readout and storage Source signal: Gated pink noise (from Test-CD or Minirator) Zoom FFT Real-time Zoom FFT with 50% overlapping, 93 Bins Frequency Range: 10 Hz - 20 khz Resolution: Hz to 0.73 Hz Delay Time Propagation delay between electrical and acoustic signal input using built-in mic. Resolution < 0.1ms, max time: 1 s Dedicated test signal: NTi Audio chirp (from Test-CD or Minirator) 86
87 Polarity Test Positive / Negative detection through internal microphone or XLR RCA connector. Checks polarity of midrange-speakers, woofers, sub-woofers and cables. Down to 10 db S/N ratio of input signal. Testsignal: NTi Audio Polarity Signal (AL1 Test CD or Minirator) Electrical Level RMS, THD+N, Frequency, Polarity Filters: Flat, A-weighting, C-weighting, Highpass 400 Hz, Highpass 19 khz STI-PA (Option) Single value STI and CIS test result. Modulation indices and individual band level results accessible. Error indicator. Fulfills the IEC release 2003 standard (including amplitude weighting) TNO verified algorithm Frequency Range 10 Hz to 20 khz Resolution 4 digits Accuracy < ± 0.1 % Level Units dbu, dbv, V RMS Resolution 3 digits (db-scale) or 4 digits (V-scale) Accuracy ± khz Bandwidth 20 Hz to 20 khz Flatness ± 0.1 db THD+N (Total Harmonic Distortion + Noise) Bandwidth 10 Hz to 20 khz Resolution 3 digits (db-scale) or 4 digits (%-scale) Residual balanced < dbu to +20 dbu THD+N unbalanced < dbu to +14 dbu PC Interface Internal device memory for up to 580 records USB interface to MiniLINK PC software Online data logging from Acoustilyzer directly to PC 87
88 Input Connectors XLR balanced, RCA unbalanced Input Impedance 40 kohm balanced, 20 kohm unbalanced Input RMS ( upper measurement limit ) balanced +20 dbu (7.75 V RMS ) unbalanced +14 dbu (3.8 V RMS ) for input levels > 20 dbu (balanced) the Adapter -20 db is available as accessory Max. DC Input ± 50 V DC Residual Noise < 12 μv, XLR-input shorted Internal Microphone (for Polarity and Delay measurement only) Omni directional Monitor Output Jack 3.5 mm (1/8 ), suitable for all common headsets Display Graphic LCD 64 x 100 pixel, with backlight Batteries 3x AA batteries (alkaline) Typical battery lifetime > 16 hours Dimensions (L x W x H) 163 x 86 x 42 mm (6.4 x 3.38 x 1.63 ) Weight 300 g (10.5 oz) incl. batteries Temperature 0 to +45 C (32 to 113 F) Humidity < 90 % R.H., non-condensing 88
89 9. Appendix: Introduction to STI-PA Application: In case of emergency, public address systems in buildings like airports, railway stations, shopping centers or concert halls have to (clearly) inform persons in danger about escape information and directions. However if such announcements are misunderstood due to poor system quality, tragic consequences may result. Therefore, it is essential to design, install and verify sound reinforcement systems properly for intelligibility. In addition, a variety of other applications such as legal and medical applications may require intelligibility verification. Standard: The IEC standard (national standards - see next section) requires the verification of electro-acoustic sound systems for emergency purposes to ascertain a minimum level of speech intelligibility in case of an emergency under realistic circumstances. Therefore, speech intelligibility from a regulatory view is not a subjective measurement, but can be verified with several, more or less complex methods that have been standardized in IEC National standards: IEC Sound systems for emergency purposes (also VDE 0828 part 1 and DIN-EN, BS-EN, SN-EN, OEVE-EN, ) NFPA 72 National Fire Alarm Code 2002 (2002 edition, section ) BS Fire detection and alarm systems for buildings. Code of practice for the design, installation and servicing of voice alarm systems Subjective Testing Methods: Although frequency response, distortion and loudness are important to intelligibility, conventional measurements of these parameters alone only marginally relate to intelligibility. When additional issues such as directionality of drivers and the environment are taken into consideration, the question then is how well a spoken message can be understood at different locations, and particularly at the worst location. One approach is to let a trained human speaker read a number of existing or synthetic words, while a representative number of listeners 89
90 individually write down what they believe to have understood. The statistical analysis of these notes results in a value representing the percentage of the listeners who have understood the messages correctly. Important procedures according to this method are PB-words, CVC or SRT (Speech Reception Threshold). However, conducting such tests is rather costly, and in some hazardous locations, even impossible. Therefore, these methods are mainly used to verify technical principles during development. Technical Methods: Already back in 1940, Bell Laboratories started to develop measurement technologies to determine the speech intelligibility. Nowadays, highly developed algorithms such as SII (Speech Intelligibility Index) and various forms of the STI (Speech Transmission Index) measure speech intelligibility. These techniques take care of many parameters which are important for intelligibility such as: Speech level Background noise level Reflections Reverberation Psycho acoustic effects (masking effects) Measurement techniques use synthesized test signals that don t sound like speech, but which have many common characteristics to real speech signals. The averaged frequency response, as well as low frequency modulation, is based on human speech. Since the speech of men s and women s voices sound different, some measurement techniques use separate male and female test signals: Speech intelligibility measurements acquire and evaluate the signals in a manner characteristic of the way human speech is altered before reaching the ears of a listener. Extensive investigations have revealed the relationship between the alteration of speech characteristics and the resulting speech intelligibility. These findings are incorporated into the speech intelligibility meter that is able to display the intelligibility result as a single number between 0 (unintelligible) and 1 (excellent intelligibility). 90

.")

91 STI, RASTI or STI-PA STI, RASTI or STI-PA are the most established methods for measuring speech intelligibility. All three of them basically apply the same principle, whereby RASTI and STI-PA are a simplified version of STI. This article explains the principles behind these methods. Speech Model: First of all, measuring the speech intelligibility requires a model for speech signals. For instance, speech may be described as superposition of various phoneme frequencies that are modulated (i.e. of which the amplitude is varied). Frequency Spectrum: The frequency analysis of a male voice over a certain period results in a typical characteristic as shown in Figure 1. Time Modulations: Within each frequency band, the signal level varies, i.e. it is modulated by the speaker. Figure 2 shows the envelope of a speech signal in the 250 Hz band, whereby the shape of the envelope is given by the speech contents. By analyzing the spectra of envelope sequences it can be shown that a speaker modulates the individual frequency bands in the range from 0.2 to 12.5 Hz. Fig. 1: Averaged octave band spectrum of a male speaker. Fig. 2: Envelope of a speech signal (250 Hz band). Fig. 3: frequency spectrum of the envelope of a speech signal (250 Hz band). 91
92 Modulation Transfer Function (MTF) For high speech intelligibility it is mandatory that the integrity of the modulations of the transmitted voice signal be preserved. Therefore, the three core intelligibility measurement methods, STI, RASTI und STI-PA are based on measuring the MTF (Modulation Transfer Function). This function quantifies the degree to which the voice modulations are preserved in the individual frequency bands. The envelope shown in Figure 3 is divided into 1/3rd octave band frequencies, thus resulting in 14 frequency bands between 0.63 and 12.5 Hz. The modulation transfer function determines for each of the 7 voice bands (refer to Figure 1) how well the modulations are preserved. Based on the MTF results as well as further parameters such as the sound pressure level, hearing threshold, frequency response or psycho acoustic effects (masking effects) it becomes possible to reliably determine the speech intelligibility. The corresponding calculations, which are optimized continuously, are based on extensive and profound evaluations and comparisons with subjective methods. Measuring the complete MTF as required for STI can become rather complex. For instance, 14 * 7 = 98 individual measurements must be executed, thus resulting in a total acquisition duration of 15 minutes. Therefore, different approaches have been developed to reduce the test period and to enable speech intelligibility measurements with portable instruments. 92
93 STI - Speech Transmission Index The STI result is based on the complete set of 98 measurements. Since this approach requires a rather long test period, it is less frequently applied in practice. However, STI represents the most detailed method to measure the speech intelligibility and is mostly used if alternative approaches do not provide reliable results due to unfavorable environmental conditions. In practice, the STI result is preferably calculated out of the impulse response (MLSA) that has been acquired e.g. with a PC-based system. This approach is much quicker, but requires a lot of experience and especially a linear behavior of the setup, i.e. there must be no non-linear processing or conditions, including compressors or limiters, which is a rather rare situation. RASTI - Room Acoustics Speech Transmission Index RASTI acquires only few segments of a complete MTF, which at first glance obviously represents an extreme simplification of STI. Therefore, tight use restrictions must be met to acquire reliable speech intelligibility results with RASTI. Furthermore, the RASTI result does not consider significant and practical auxiliary parameters such as the frequency response, echoes or frequency-dependent reverberation times. For a RASTI measurement, only two simultaneously generated frequency bands are considered, i.e. the 500 Hz and the 2 khz band which are then modulated with four and five frequencies respectively. The practical application of RASTI is mainly restricted to acquisitions between two persons. However, RASTI was, for a long time, the only method to measure the speech intelligibility with a portable instrument 93

94 STI-PA - Speech Transmission Index for Public Address Systems A rising awareness of security issues from unintelligible speech, new technological means and the shortcomings of RASTI triggered the speaker manufacturer Bose and the research institute TNO to develop a new method for speech intelligibility measurements of PA installations. The result of these efforts is STI-PA, which allows quick and accurate tests with portable instruments. Like RASTI, STI-PA applies a simplified procedure to calculate the MTF. But STI-PA determines the MTF by analyzing all seven frequency bands, whereby each band is modulated with two frequencies. Supposing that no severe impulsive background noise is present and that no massive non-linear distortions occur, STI-PA provides results as accurate as STI. If however impulsive background noise is present during the normal system operation hours, it is usually possible to mitigate the effects by also acquiring a measurement at a more favorable time e.g. under slightly different conditions in the area, or during the night time - and to calculate an unbiased overall measurement by using the results of both test cycles. NTi Audio STI-PA measurement table: Portable STI-PA analyzers, e.g. NTi Audio s Acoustilyzer, are able to evaluate speech intelligibility within 15 seconds per position and are thus well suited for wide-area measurements and high productivity. Read more on the web site 94
ACOUSTILYZER User Manual
 ACOUSTILYZER User Manual AL1 NTI contact details: NTI AG Im alten Riet 102 9494 Schaan Liechtenstein, Europe Tel. +423-239 6060 Fax +423-239 6089 E-mail info@nt-instruments.com Web www.nt-instruments.com
OPERATING MANUAL MINIRATOR MR2 / MR-PRO
 OPERATING MANUAL MINIRATOR MR2 / MR-PRO NTI Contact Info NTI AG Im alten Riet 102 9494 Schaan Liechtenstein, Europe Tel.: +423-239 6060 Fax: +423-239 6089 E-Mail: info@nti-audio.com Web: www.nti-audio.com
Digilyzer DL1 User Manual
 Digilyzer DL1 User Manual NTi Audio Contact Headquarter: NTi Audio AG Im alten Riet 102 9494 Schaan Liechtenstein, Europe Tel +423-239 6060 Fax +423-239 6089 E-mail info@nti-audio.com Home www.nti-audio.com
OPERATING MANUAL MINIRATOR MR2 / MR-PRO
 OPERATING MANUAL Minirator MR2 / MR-PRO Contact NTi Audio at Headquarter +423 239 6060 info@nti-audio.com Americas +1 503 684 7050 americas@nti-audio.com China +86 512 6802 0075 china@nti-audio.com Czech
OPERATING MANUAL MINIRATOR MR2 / MR-PRO
 OPERATING MANUAL MINIRATOR MR2 / MR-PRO NTI Contact Details Head Office NTI AG Im alten Riet 102 9494 Schaan Liechtenstein, Europe Americas NTI Americas PO Box 131027 Tigard, Oregon 97281 USA China NTI
OPERATING MANUAL MINIRATOR MR2 / MR-PRO
 OPERATING MANUAL Minirator MR2 / MR-PRO NTi Audio Contact Details Head Office NTi Audio AG Im alten Riet 102 9494 Schaan Liechtenstein, Europe Americas NTI Americas PO Box 131027 Tigard, Oregon 97281 USA
OPERATING MANUAL MINIRATOR MR2 / MR-PRO
 OPERATING MANUAL Minirator MR2 / MR-PRO NTi Audio Contact Details Head Office NTi Audio AG Im alten Riet 102 9494 Schaan Liechtenstein, Europe Americas NTI Americas PO Box 131027 Tigard, Oregon 97281 USA
clipping; yellow LED lights when limiting action occurs. Input Section Features
 ELX-1A Rack-Mount Mic/Line Mixer Four inputs, one output in a single rack space Very-highery-high-quality audio performance High reliability Extensive filtering circuitry and shielding protect against
Sound Insulation Reporter
 Sound Insulation Reporter for XL2 Sound Level Meter V1.28.00 www.nti-audio.com Jul 18, Page 1 / 58 Index 1. Introduction...3 2. Standards...4 3. My First Steps...5 Software Installation... 5 Additional
LavryBlack Series Model DA10 Digital to Analog Converter
 LavryBlack Series Model DA10 Digital to Analog Converter Lavry Engineering, Inc. P.O. Box 4602 Rolling Bay, WA 98061 http://lavryengineering.com email: techsupport@lavryengineering.com January 14, 2008
Performing a Sound Level Measurement
 APPENDIX 9 Performing a Sound Level Measurement Due to the many features of the System 824 and the variety of measurements it is capable of performing, there is a great deal of instructive material in
AES-402 Automatic Digital Audio Switcher/DA/Digital to Analog Converter
 Broadcast Devices, Inc. AES-402 Automatic Digital Audio Switcher/DA/Digital to Analog Converter Technical Reference Manual Broadcast Devices, Inc. Tel. (914) 737-5032 Fax. (914) 736-6916 World Wide Web:
True RMS AC/DC Mini Clamp Meter
 User's Guide True RMS AC/DC Mini Clamp Meter Model 380947 Introduction Congratulations on your purchase of the Extech 380947 True RMS Clamp Meter. This Clamp meter measures current up to 400A DC/AC and
User s Manual. Model Digital Sound Level Meter
 User s Manual Model 407727 Digital Sound Level Meter Introduction Congratulations on your purchase of Extech s Digital Sound Level Meter. This professional meter, with proper care, will provide years of
DP1 DYNAMIC PROCESSOR MODULE OPERATING INSTRUCTIONS
 DP1 DYNAMIC PROCESSOR MODULE OPERATING INSTRUCTIONS and trouble-shooting guide LECTROSONICS, INC. Rio Rancho, NM INTRODUCTION The DP1 Dynamic Processor Module provides complete dynamic control of signals
AES-404 Digital Audio Switcher/DA/Digital to Analog Converter
 Broadcast Devices, Inc. AES-404 Digital Audio Switcher/DA/Digital to Analog Converter Technical Reference Manual Broadcast Devices, Inc. Tel. (914) 737-5032 Fax. (914) 736-6916 World Wide Web: www.broadcast-devices.com
MANUAL ENGLISH Core Club Ordercode: D2314
 MANUAL ENGLISH Core Club Ordercode: Highlite International B.V. Vestastraat 2 6468 EX Kerkrade the Netherlands Table of contents Warning... 2 Unpacking Instructions... 2 Safety Instructions... 2 Operating
Connevans.info. DeafEquipment.co.uk. This product may be purchased from Connevans Limited secure online store at
 Connevans.info Solutions to improve the quality of life Offering you choice Helping you choose This product may be purchased from Connevans Limited secure online store at www.deafequipment.co.uk DeafEquipment.co.uk
Calibrating Measuring Microphones and Sound Sources for Acoustic Measurements with Audio Analyzer R&S UPV
 Product: R&S UPV Calibrating Measuring Microphones and Sound Sources for Acoustic Measurements with Audio Analyzer R&S UPV Application Note 1GA47_0E This application note explains how to use acoustic calibrations
HD-CM HORIZON DIGITAL CABLE METER
 HD-CM OFF! Max RF i/p = +17dBm 75Ω Max AC/DC i/p = 120Vrms MENU INPUT ON HORIZON DIGITAL CABLE METER Horizon Global Electronics Ltd. Unit 3, West Side Flex Meadow Harlow, Essex CM19 5SR Phone: +44(0) 1279
Element 78 MPE-200. by Summit Audio. Guide To Operations. for software version 1.23
 Element 78 MPE-200 by Summit Audio Guide To Operations for software version 1.23 TABLE OF CONTENTS IMPORTANT SAFETY AND GROUNDING INSTRUCTIONS COVER 1. UNPACKING AND CONNECTING...3 AUDIO CONNECTIONS...4
Users Manual. Stroboscope. September 2014
 820-2 Stroboscope Users Manual September 2014 2014 Fluke Corporation. All rights reserved. Specifications are subject to change without notice. All product names are trademarks of their respective companies.
OPERATING MANUAL DIGIRATOR DR2
 OPERATING MANUAL DIGIRATOR DR2 Contact NTi Audio at Headquarter +423 239 6060 info@nti-audio.com Americas +1 503 684 7050 americas@nti-audio.com China +86 512 6802 0075 china@nti-audio.com Czech +420 2209
Getting Started with the LabVIEW Sound and Vibration Toolkit
 1 Getting Started with the LabVIEW Sound and Vibration Toolkit This tutorial is designed to introduce you to some of the sound and vibration analysis capabilities in the industry-leading software tool
ENG-44 Field Portable Audio Mixer. Operator s Manual. SignVideo SE Gideon Street - Portland, Oregon
 Field Portable Audio Mixer Operator s Manual SignVideo - 1226 SE Gideon Street - Portland, Oregon 97202 503.236.0000 www.signvideo.com Safety Warning Protect your ears. Always turn down the headphone volume
Oxygen ORDERCODE D2150
 Oxygen ORDERCODE D2150 Congratulations! You have bought a great, innovative product from DAP Audio. The DAP Audio Oxygen brings excitement to any venue. Whether you want simple plug-&-play action or a
INSTRUCTION SHEET FOR NOISE MEASUREMENT
 Customer Information INSTRUCTION SHEET FOR NOISE MEASUREMENT Page 1 of 16 Carefully read all instructions and warnings before recording noise data. Call QRDC at 952-556-5205 between 9:00 am and 5:00 pm
Recording to Tape (Analogue or Digital)...10
...10") c o n t e n t s DUAL MIC-PRE Green Dual Mic Pre (introduction).............................4 Section (i): Setting Up Power Connections...........................................4 Power Supply................................................5
c o n t e n t s DUAL MIC-PRE Green Dual Mic Pre (introduction).............................4 Section (i): Setting Up Power Connections...........................................4 Power Supply................................................5
12 Channel Media Splitter MS12 Mk2 User manual
 12 Channel Media Splitter MS12 Mk2 User manual 01. 12 Channel Media Splitter MS12 Mk2 An audio distribution amplifier primarily designed to feed multiple ENG cameras from a single lectern microphone at
DCX-24 ORDERCODE D2020
 DCX-24 ORDERCODE D2020 Congratulations! You have bought a great, innovative product from DAP Audio. The DAP Audio DCX-24 brings excitement to any venue. Whether you want simple plug-&-play action or a
Noise Detector ND-1 Operating Manual
 Noise Detector ND-1 Operating Manual SPECTRADYNAMICS, INC 1849 Cherry St. Unit 2 Louisville, CO 80027 Phone: (303) 665-1852 Fax: (303) 604-6088 Table of Contents ND-1 Description...... 3 Safety and Preparation
Ambient Weather WS-01 Intelligent Color Changing Temperature Night Light with Ambient Backlight User Manual
 Ambient Weather WS-01 Intelligent Color Changing Temperature Night Light with Ambient Backlight User Manual Table of Contents 1 Introduction... 1 2 Warnings... 2 3 Getting Started... 2 3.1 Parts List...
A PRACTICAL APPROACH ON DIGILYZER DL1
 A PRACTICAL APPROACH ON DIGILYZER DL1 Digilyzer is the latest development in the Minstrument series. It is a comprehensive and complete digital analyzer that covers most measurements in the digital audio
Concert Series ORDERCODE D3470 ORDERCODE D3471 ORDERCODE D3472 D3470 D3471 D3472
 Concert Series ORDERCODE D3470 ORDERCODE D3471 ORDERCODE D3472 D3470 D3471 D3472 Congratulations! You have bought a great, innovative product from DAP Audio. The DAP Audio Concert Series brings excitement
Digital Terrestrial Alignment & Installation Meter
 Digital Terrestrial Alignment & Installation Meter Instruction Booklet Version 3 - February 2005 www.horizonhge.com Thank you for choosing our latest and most innovative terrestrial meter. It has been
Sphinx II. Owner s Manual. Tube Hybrid Integrated Power Amplifier. Rogue Audio, Inc. 3 Marian Lane Brodheadsville, PA Issue date: 08/01/16
 Sphinx II Tube Hybrid Integrated Power Amplifier Owner s Manual Rogue Audio, Inc. 3 Marian Lane Brodheadsville, PA 18322 Issue date: 08/01/16 TABLE OF CONTENTS 1) Introduction 2 2) Unpacking the Sphinx
Operating Instructions
 CNTX Contrast sensor Operating Instructions CAUTIONS AND WARNINGS SET-UP DISTANCE ADJUSTMENT: As a general rule, the sensor should be fixed at a 15 to 20 angle from directly perpendicular to the target
LavryBlack Series Model AD10 Analog to Digital Converter
 LavryBlack Series Model AD10 Analog to Digital Converter Lavry Engineering, Inc. P.O. Box 4602 Rolling Bay, WA 98061 http://lavryengineering.com email: techsupport@lavryengineering.com Rev 1.20 January
AES Channel Digital/Analog Audio Switcher/DA/Digital to Analog Converter
 Broadcast Devices, Inc. AES-408 8 Channel Digital/Analog Audio Switcher/DA/Digital to Analog Converter Technical Reference Manual Broadcast Devices, Inc. Tel. (914) 737-5032 Fax. (914) 736-6916 World Wide
USER GUIDE MULTI-CHANNEL STEREO MIXER S MIX 4M2S UD
 USER GUIDE MULTI-CHANNEL STEREO MIXER S MIX 4M2S UD FEATURES 4 mono input channels and 2 stereo input channels. Frequency EQ on each input channel. Low-noise mic pre-amp on microphone inputs. Low cut filter
CPH-10 SUBWOOFER OWNERS MANUAL
 CPH-10 SUBWOOFER OWNERS MANUAL www.artcoustic.com Welcome to the world of Artcoustic! Congratulations with your purchase of the Artcoustic CPH-10 Subwoofer. The CPH-10 has an efficient design, producing
SigPlay User s Guide
 SigPlay User s Guide . . SigPlay32 User's Guide? Version 3.4 Copyright? 2001 TDT. All rights reserved. No part of this manual may be reproduced or transmitted in any form or by any means, electronic or
TABLE OF CONTENTS. 1) Introduction 2. 2) Unpacking the Ares 2. 3) Installing the Ares in your system 3. 4) Setting the Operational Parameters 4
 Introduction 2. 2) Unpacking the Ares 2. 3) Installing the Ares in your system 3. 4) Setting the Operational Parameters 4") TABLE OF CONTENTS 1) Introduction 2 2) Unpacking the Ares 2 3) Installing the Ares in your system 3 4) Setting the Operational Parameters 4 5) High Output MM/MC Cartridge Setup 6 6) Medium Output Cartridge
TABLE OF CONTENTS 1) Introduction 2 2) Unpacking the Ares 2 3) Installing the Ares in your system 3 4) Setting the Operational Parameters 4 5) High Output MM/MC Cartridge Setup 6 6) Medium Output Cartridge
Kramer Electronics, Ltd. USER MANUAL. Model: VA-14. 4x1 Balanced Audio Mixer
 Kramer Electronics, Ltd. USER MANUAL Model: VA-14 4x1 Balanced Audio Mixer Contents Contents 1 Introduction 1 2 Getting Started 2.1 Quick Start 1 1 3 Overview 3 4 Your VA-14 4x1 Balanced Audio Mixer 4
OWNER'S MANUAL MYCRO SUB
 OWNER'S MANUAL MYCRO SUB OWNER'S MANUAL MYCRO SUB Features Compact dimensions and high output. Dual coil woofer provides multiple wiring configurations. Recessed connectors allow the enclosure to be used
Please feel free to download the Demo application software from analogarts.com to help you follow this seminar.
 Hello, welcome to Analog Arts spectrum analyzer tutorial. Please feel free to download the Demo application software from analogarts.com to help you follow this seminar. For this presentation, we use a
SAWM60 AUDIO/VIDEO MODULATOR
 SAWM60 LIMITED WARRANTY Holland Electronics LLC, warrants that the product enclosed with this Limited Warranty statement will conform to the manufacturer s specifications and be free of defects in the
Keysight FieldFox Microwave Analyzers
 Quick Reference Guide Contents Keysight FieldFox Microwave Analyzers Do you have everything?... 1 The Power Button and LED... 1 Battery Usage... 2 Measure Return Loss (CAT Mode)... 3 Measure 1-Port Cable
USER MANUAL MX102 & MX1202
 USER MANUAL MX102 & MX1202 WWW.PULSE-AUDIO.CO.UK 1 SAVE THESE SAFETY INSTRUCTIONS Thank you for purchasing our product. To assure the optimum performance, please read this manual carefully and keep it
DIGITAL SPEAKER MANAGEMENT UK
 DSM2-6mkII DIGITAL SPEAKER MANAGEMENT 170.659UK Features 96kHz sampling frequency, 32-bit A/D and D/A converter, 24-bit DSP processor Input channel: 6-band parametric EQ, Delay, Polarity Output channel:
The Audio Toolbox Contractor s Firmware
 The Audio Toolbox Contractor s Firmware User Manual Version 3.30 TerraSonde (303) 545-5848 2434 30 th Street fax: (303) 545-6066 Boulder CO 80301 USA sales & support (888) 433-2821 the makers of the Audio
Quick Start. RSHS1000 Series Handheld Digital Oscilloscope
 Quick Start RSHS1000 Series Handheld Digital Oscilloscope General Safety Summary Carefully read the following safety precautions to avoid personal injury and prevent damage to the instrument or any products
FRQM-2 Frequency Counter & RF Multimeter
 FRQM-2 Frequency Counter & RF Multimeter Usage Instructions Firmware v2.09 Copyright 2007-2011 by ASPiSYS Ltd. Distributed by: ASPiSYS Ltd. P.O.Box 14386, Athens 11510 (http://www.aspisys.com) Tel. (+30)
HMA-860H AGILE MODULATOR
 HMA-860H AGILE MODULATOR LIMITED WARRANTY Holland Electronics LLC, warrants that the product enclosed with this Limited Warranty statement will conform to the manufacturer s specifications and be free
T L Audio. User Manual C1 VALVE COMPRESSOR. Tony Larking Professional Sales Limited, Letchworth, England.
 T L Audio User Manual C1 VALVE COMPRESSOR Tony Larking Professional Sales Limited, Letchworth, England. Tel: 01462 490600. International +44 1462 490600. Fax: 01462 490700. International +44 1462 490700.
ST-4000 SIGNAL LEVEL METER
 ST-4000 SIGNAL LEVEL METER Table of Contents Features / Specifications.... 1 Keypad Illustration....... 2 Keypad Controls.... 2 Getting Started: Powering the Meter.... 3 Quick Use Instructions.. 3 Main
Distribution Unit. User Guide
 Distribution Unit User Guide CONTENTS 1. Introduction Page 2 2. Technical Specifications Page 3 3. Installation 3.1 Inspection and un-packing Page 4 3.2 Operating environment Page 4 3.3 Power requirements
Quick Start Guide. Handheld Transmitter HHa-941. Digital Hybrid Wireless US Patent 7,225,135
 Quick Start Guide Handheld Transmitter HHa-941 Digital Hybrid Wireless US Patent 7,225,135 For FCC Part 74 licensed operators Fill in for your records: Serial Number: Purchase Date: This guide is intended
C8000. switch over & ducking
 features Automatic or manual Switch Over or Fail Over in case of input level loss. Ducking of a main stereo or surround sound signal by a line level microphone or by a pre recorded announcement / ad input.
Field Test 2. Installation and operation manual OPDAQ Installation and operation manual
 Field Test 2 Installation and operation manual OPDAQ 17.08.25 Installation and operation manual January 2016 How to get copies of OpDAQ technical publications: 53, St-Germain Ouest Rimouski, Québec Canada
PROFESSIONAL DJ MIXER OWNER S MANUAL. STANTON MAGNETICS, INC
 M.303 PROFESSIONAL DJ MIXER OWNER S MANUAL STANTON MAGNETICS, INC information@stantondj.com www.stantondj.com WELCOME! Thank you for making Stanton your first choice in professional DJ mixers. This innovative
843-R 843-R LASER POWER METER USER MANUAL. NEWPORT CORPORATION
 843-R 843-R LASER POWER METER USER MANUAL NEWPORT CORPORATION www.newport.com Table of Contents Chapter 1.Introduction: How to Use This Manual. 3 Chapter 2.Quick Reference... 4 2.1 Getting Started... 4
User Manual. Model 1372A and 1374A HDMI Switchers. 1T-SX-632 Model 1372A 2X1 Switcher. v1.3 2x1 SWITCHER. v1.3 INPUT ENHANCE POWER
 User Manual 1T-SX-632 Model 1372A 2X1 Switcher v1.3 v1.3 2x1 SWITCHER 1 2 INPUT ENHANCE POWER 1 2 INPUT ENHANCE POWER Model 1372A and 1374A HDMI Switchers Table Of Contents 1.0 Introduction.......................
MaxView Cinema Kit Quick Install Guide
 SYSTEM SETUP The MaxView will work at any of the following display settings: INSTALLATION MaxView Cinema Kit Quick Install Guide Step 1 - Turn off your computer. Disconnect your monitor s VGA cable from
Kramer Electronics, Ltd. USER MANUAL. Models: 6410N, Digital to Analog Audio Converter 6420N, Analog to Digital Audio Converter
 Kramer Electronics, Ltd. USER MANUAL Models: 6410N, Digital to Analog Audio Converter 6420N, Analog to Digital Audio Converter Contents Contents 1 Introduction 1 2 Getting Started 1 2.1 Quick Start 1 3
ST-4000D SIGNAL LEVEL METER
 ST-4000D SIGNAL LEVEL METER Rev 100606 Table of Contents Features / Specifications.... 1 Keypad Illustration....... 2 Keypad Controls.... 2 Getting Started: Powering the Meter...... 3 Quick Use Instructions.....
DRAFT RELEASE FOR BETA EVALUATION ONLY
 IPM-16 In-Picture Audio Metering User Manual DRAFT RELEASE FOR BETA EVALUATION ONLY Ver 0.2 April 2013 1 Contents Introduction...3 In Picture Audio Meter Displays...4 Installation...7 External Audio Board
SyncGen. User s Manual
 SyncGen User s Manual 1 IMPORTANT SAFETY INSTRUCTION READ FIRST This symbol, whenever it appears, alerts you to the presence of uninsulated dangerous voltage inside the enclosure-voltage that may be sufficient
Signal Stability Analyser
 Signal Stability Analyser o Real Time Phase or Frequency Display o Real Time Data, Allan Variance and Phase Noise Plots o 1MHz to 65MHz medium resolution (12.5ps) o 5MHz and 10MHz high resolution (50fs)
4 MHz Lock-In Amplifier
 4 MHz Lock-In Amplifier SR865A 4 MHz dual phase lock-in amplifier SR865A 4 MHz Lock-In Amplifier 1 mhz to 4 MHz frequency range Low-noise current and voltage inputs Touchscreen data display - large numeric
R&S ZVA-Zxx Millimeter-Wave Converters Specifications
 R&S ZVA-Zxx Millimeter-Wave Converters Specifications Data Sheet Version 19.00 CONTENTS Definitions... 3 General information... 4 Specifications... 5 Test port... 5 Source input (RF IN)... 5 Local oscillator
DIVERSITY DVB-T RECEIVER (DDR)
") User s Manual The most important thing we build is trust. DIVERSITY DVB-T RECEIVER (DDR) Cobham Surveillance GMS Products 1916 Palomar Oaks Way Ste 100 Carlsbad, CA 92008 100-M0062X2 T: 760-496-0055 05/15/09
User s Manual The most important thing we build is trust. DIVERSITY DVB-T RECEIVER (DDR) Cobham Surveillance GMS Products 1916 Palomar Oaks Way Ste 100 Carlsbad, CA 92008 100-M0062X2 T: 760-496-0055 05/15/09
KHT 1000C HV-Probe Calibrator. Instruction Manual
 KHT 1000C HV-Probe Calibrator Instruction Manual Copyright 2015 PMK GmbH All rights reserved. Information in this publication supersedes that in all previously published material. Specifications are subject
Instruction manual MK 8
 Instruction manual MK 8 A B C MKS 4* D MK 8 P48 IEC 61938 E MZP 40* MKW 4* * optional accessory F Important safety information Please read this instruction manual carefully and completely before using
VOX. Operating manual VOX VOX-01 VOX. IEC rev. 4 IEC Class 2 / ANSI S1.4 Type 2 SPEECH INTELLIGIBILITY TESTER
 IEC 60268-16 rev. 4 IEC 61672 Class 2 / ANSI S1.4 Type 2 VOX SPEECH INTELLIGIBILITY TESTER Operating manual VOX SPEECH INTELLIGIBILITY TESTER Specialized Fire Products VOX SPEECH INTELLIGIBILITY TESTER
Agilent Technologies. N5106A PXB MIMO Receiver Tester. Error Messages. Agilent Technologies
 Agilent Technologies N5106A PXB MIMO Receiver Tester Messages Agilent Technologies Notices Agilent Technologies, Inc. 2008 2009 No part of this manual may be reproduced in any form or by any means (including
OPERATING MANUAL DIGIRATOR DR2
 OPERATING MANUAL DIGIRATOR DR2 NTI Contact Details Head Office NTI AG Im alten Riet 102 9494 Schaan Liechtenstein, Europe Americas NTI Americas PO Box 131027 Tigard, Oregon 97281 USA China NTI China Room
MX-206 Stereo Microphone Mixer. Operating Manual
 MX-206 Stereo Microphone Mixer Operating Manual ASHLY AUDIO INC. 847 Holt Road Webster, NY 14580-9103 Phone: (585) 872-0010 Toll-Free: (800) 828-6308 Fax: (585) 872-0739 www.ashly.com Operating Manual
Agilent FieldFox RF Analyzer N9912A
 Contents Agilent FieldFox RF Analyzer N9912A Quick Reference Guide Do You Have Everything?... 2 The Power Button and LED... 2 Battery Usage... 3 Measure Return Loss... 4 Measure Cable Loss (1-Port)...
USERS GUIDE MCX-HTS. HDMI to 3G SDI Converter. Manual Number:
 USERS GUIDE MCX-HTS HDMI to 3G SDI Converter i Manual Number: 151226 SAFETY INSTRUCTIONS Please review the following safety precautions. If this is the first time using this model, then read this manual
Kramer Electronics, Ltd.
 Kramer Electronics, Ltd. Preliminary USER MANUAL Model: VP-2K 1:2 UXGA / Audio Distributor Contents Contents 1 Introduction 1 2 Getting Started 1 2.1 Quick Start 2 3 Overview 3 4 Your VP-2K 1:2 UXGA /
NanoGiant Oscilloscope/Function-Generator Program. Getting Started
 Getting Started Page 1 of 17 NanoGiant Oscilloscope/Function-Generator Program Getting Started This NanoGiant Oscilloscope program gives you a small impression of the capabilities of the NanoGiant multi-purpose
Linrad On-Screen Controls K1JT
 Linrad On-Screen Controls K1JT Main (Startup) Menu A = Weak signal CW B = Normal CW C = Meteor scatter CW D = SSB E = FM F = AM G = QRSS CW H = TX test I = Soundcard test mode J = Analog hardware tune
R&S ZN-Z154 Calibration Unit Specifications
 ZN-Z154_dat-sw_en_3607-0481-22_v0101_cover.indd 1 Data Sheet 01.01 Test & Measurement R&S ZN-Z154 Calibration Unit Specifications 25.06.2014 10:27:09 CONTENTS Definitions... 3 Measurement range... 4 Effective
Instruction Guide. The TV Jockey Computer Monitor TV Tuner with Remote COMP2VGATVGB. The Professionals Source For Hard-to-Find Computer Parts
 VIDEO ADAPTER The TV Jockey Computer Monitor TV Tuner with Remote COMP2VGATVGB Instruction Guide * Actual product may vary from photo The Professionals Source For Hard-to-Find Computer Parts FCC COMPLIANCE
USB AUDIO INTERFACE I T
 USB AUDIO INTERFACE EN DE FR ES IT JA Contents Introduction...3 Contents in this Operation Manual... 3 Features... 3 Panel Controls and Terminals (Details)...4 Rear Panel... 4 Front Panel... 6 Panel Controls
OPERATIONS MANUAL FOR EDISON PROFESSIONAL Professional ABS Molded Loudspeaker M4000
 M4000 Introduction: Congratulations on your purchase of an M-4000 powered loudspeaker, engineered and manufactured by BriteLite Enterprises. The M-4000 includes a high-output compression driver, and 15
R&S ZN-Z85 Switch Matrix Specifications
 R&S ZN-Z85 Switch Matrix Specifications Data Sheet Version 01.02 CONTENTS Definitions... 3 Block diagrams... 4 Specifications... 5 General features... 5 Performance data... 5 Remote control... 5 Switching
USB-TG124A Tracking Generator User Manual
 USB-TG124A Tracking Generator User Manual Signal Hound USB-TG124A User Manual 2017, Signal Hound, Inc. 35707 NE 86th Ave La Center, WA 98629 USA Phone 360.263.5006 Fax 360.263.5007 This information is
AEROTRAK PORTABLE AIRBORNE PARTICLE COUNTER MODEL 9110 QUICK START GUIDE
 AEROTRAK PORTABLE AIRBORNE PARTICLE COUNTER MODEL 9110 QUICK START GUIDE Thank you for purchasing a TSI AeroTrak Model 9110 Portable Airborne Particle Counter (particle counter). This guide will help you
Operating Manual. DVB-T Meter MFK 16
 Operating Manual DVB-T Meter MFK 16 Preface Dear customer, KATHREIN-Werke KG has made every effort to ensure the accuracy and completeness of this manual. However, no liability can be accepted for potential
MKH 8060 Directional studio microphone
 MKH 8060 Directional studio microphone Instruction manual Contents Contents Important safety information... 2 The MKH 8060... 3 Delivery includes... 4 Product overview... 5 Putting the MKH 8060 into operation...
SCALE & WEIGHT DISPLAYS
 The MICRO SERIES SCALE & WEIGHT DISPLAYS LARGE DIGIT MODELS Mighty-5S DPM MODELS Micro-S & Mighty-1S Mighty-1S Micro-S ELECTRO-NUMERICS, INC. Introduction The Electro-Numerics family of Digital Panel Meters
ORPHEUS ZERO U S E R M A N U A L
 ORPHEUS ZERO U S E R M A N U A L I N T R O D U C T I O N FEATURES Class 1 product CD drive (ORPHEUS ZERO Drive) or player (ORPHEUS ZERO Player) Multiple formats reader : CD, CD-R, CD-RW Software controlled
RT-DRIVE DLM808 DIGITAL PROCESSOR AUDIO MATRIX PROCESSOR
 RT-DRIVE DLM808 DIGITAL PROCESSOR AUDIO MATRIX PROCESSOR 2 1. Introduction 2. Features 3. Usefull Data 4. Function Buttons and LED Indicators 5. Rear Panel 6. DSP Control 1. Configuration of IP Address
imso-104 Manual Revised August 5, 2011
 imso-104 Manual Revised August 5, 2011 Section 1 Getting Started SAFETY 1.10 Quickstart Guide 1.20 SAFETY 1.30 Compatibility 1.31 Hardware 1.32 Software Section 2 How it works 2.10 Menus 2.20 Analog Channel
FOUR CHANNEL USB RECORDER PCRU01. User manual. Table of Contents
 FOUR CHANNEL USB RECORDER PCRU01 User manual Table of Contents Features 2 Specifications 2 hardware 2 software: 2 system requirements 2 Software installation 2 SAFETY and WARNINGS 3 Warranty 3 Connections
MULTIMIX 8/4 DIGITAL AUDIO-PROCESSING
 MULTIMIX 8/4 DIGITAL AUDIO-PROCESSING Designed and Manufactured by ITEC Tontechnik und Industrieelektronik GesmbH 8200 Laßnitzthal 300 Austria / Europe MULTIMIX 8/4 DIGITAL Aim The most important aim of
Litile34 OPERATION MANUAL
 Litile34 OPERATION MANUAL Seamless Tiled Panel Wall Solution for Large Area Digital Signage Display (1st Edition 3/25/2009) All information is subject to change without notice. Approved by Checked by Prepared
CDM10: Channel USB Mixer. Item ref: UK User Manual
 CDM10:4 19 4 Channel USB Mixer Item ref: 171.135UK User Manual Caution: Please read this manual carefully before operating Damage caused by misuse is not covered by the warranty Introduction Thank you