LED Channel Letter Lighting
|
|
|
- Osborn Oswald Freeman
- 6 years ago
- Views:
Transcription

1 Design & Engineering Services LED Channel Letter Lighting ET06.12 Prepared by: Design & Engineering Services Customer Service Business Unit Southern California Edison December 16, 2008
2 Acknowledgements Southern California Edison s Design & Engineering Services (D&ES) group is responsible for this project. It was developed as part of Southern California Edison s Emerging Technology program under internal project number ET D&ES project manager Vireak Ly conducted this technology evaluation with overall guidance and management from Henry Lau. For more information on this project, contact vireak.ly@sce.com. Disclaimer This report was prepared by Southern California Edison (SCE) and funded by California utility customers under the auspices of the California Public Utilities Commission. Reproduction or distribution of the whole or any part of the contents of this document without the express written permission of SCE is prohibited. This work was performed with reasonable care and in accordance with professional standards. However, neither SCE nor any entity performing the work pursuant to SCE s authority make any warranty or representation, expressed or implied, with regard to this report, the merchantability or fitness for a particular purpose of the results of the work, or any analyses, or conclusions contained in this report. The results reflected in the work are generally representative of operating conditions; however, the results in any other situation may vary depending upon particular operating conditions. Southern California Edison
3 ABBREVIATIONS AND ACRONYMS AC CCD cd LCD LED PQL SCE SCLTC W Alternating Current Charge-Coupled Device Candelas Liquid Crystal Display Light Emitting Diode Power Quality Logger Southern California Edison Southern California Lighting Technology Center Watts Southern California Edison Page i
4 FIGURES Figure 1: LED Channel Letter Signs with Acrylic Face on the C of the LED Sign...1 Figure 2: Figure 3: Figure 4: Figure 5: Demand of Individual Neon and LED White Light Sources...3 Efficiency of Individual Neon and LED White Light Sources with White Acrylic Face...4 Average Efficiency Comparison of White Neon and White LED with Colored Acrylic Face...5 Average Efficiency Comparison of Color Neon and Color LED with Matching Color Face...6 Figure 6: Neon (Top) and LED (Bottom) Channel Letter Signs with Acrylic Face on the C of the LED Sign...8 Figure 7: Traditional Incandescent or Neon Light Output Loss Figure 8: Luminance Camera Figure 9: Photolux Luminance Map Figure 10: Chroma Meter Figure 11: Demand and Power Quality Logger Figure 12: Measurement Points Along S Stroke Figure 13: False Color Luminance Map for LED-Set 2-W1-W Showing Outline of Luminance Area Statistic Zone Figure 14: Luminance Statistics Display Figure 15: Possible Contrasting Light and Dark Spots Between LED Clusters Figure 16: Photolux Software Maximum and Minimum Luminance Points for Neon (Left) and LED (Right) products Figure 17: Luminance Photos of the Neon (Left) and LED (Right) Products Displayed in Figure Figure 18: Photolux Region Maximum Luminance Results Figure 19: Photo Comparison of Region with Highest (Neon) and Lowest (LED) Maximum Luminance Figure 20: Photo Comparison of Neon with Lowest Maximum (Left) and LED with Highest Maximum (Right) Luminance Figure 21: Region Contrast Ratio for Neon versus LED Figure 22: Neon- Set 2-W2-W (Lower contrast of 4) versus Neon- Set 5-W1-W (higher contrast of 30) Figure 23: Power Consumption of Neon Versus LED Southern California Edison Page ii
5 Figure 24: Efficiency (Luminance/Watt) of all Tested Neon and LED Products Figure 25: Luminance Photo Comparison of Regions with Low Contrast Ratio (left) to High Contrast Ratio (Right) using a White Light Source and Blue Face Figure 26: Average Luminance Values by Lighting Type Across 7 Spot Measurements for White Source Plus Color Face Figure 27: Average of Seven Chroma Meter Luminance Values, White Light Source with Colored Face Figure 28: Average Luminance Values by Lighting Type Across 7 Spot Measurements for Colored Light Source Plus Matching Color Face Figure 29: Average Luminance Values by Lighting Type Across 7 Spot Measurements for Green and Blue Colored Light Source Plus Matching Color Face Figure 30: Average of Seven Chroma Meter Luminance Values, Color Light Source with Color Face Figure 31: Chromaticity Diagram with Coordinates of Neon and LED Color Light Sources with Color Face Figure 32: Efficiency Comparison of White Neon and LED with Color Face Figure 33: Product Efficiency Values, White Light Source with Colored Face Figure 34: Efficiency Comparison of Color Neon and LED with Matching Color Face Figure 35: Product Efficiency of Color Neon and LED with Matching Color Face TABLES Table 1: Energy Savings Summary for LED Use Over Neon Use for 12 or 24 Hours/Day...6 Table 2: Camera Exposure Settings Table 3: Chroma Meter Results for Four White Light Source products with Blue Face with Varying Contrast Table 4: Color Coordinates for Neon vs. LED, White Light Source with Color Face Table 5: Average Chromaticity Coordinates for White Neon and LED with Color Faces Table 6: Color Coordinates for Neon vs. LED, Color Light Source with Color Face Southern California Edison Page iii
6 Table 7: Average Chromaticity Coordinates for White Neon and LED with Color Faces Table 8: Energy Savings for LED use over Neon for 12 and 24 hour/day Operation EQUATIONS Equation 1: Energy Savings Southern California Edison Page iv
7 CONTENTS EXECUTIVE SUMMARY 1 Technology Description...1 Project Objective...1 Test Equipment...1 Summary of Results...2 Luminance Measurements...2 White Light Source...2 Colored Light Source...2 Chromaticity Coordinates...2 Demand...2 Efficiency...3 White Light Source with White Acrylic Face...3 White Light Source with Colored Acrylic Face...4 Colored Light Source with Colored Acrylic Face...5 Energy Savings...6 Cost...7 Summary of Conclusions...7 INTRODUCTION 8 Technology Description...8 Objective...9 Background...9 Sign Industry Codes and Standards Cost Manufacturing Labor Installation Labor Material Cost METHODOLOGY 11 SCLTC Test Sign Independent Variables Lamp Technology Lamp Color Acrylic Face Color Dependant Variables Minimum, Maximum, and Average Luminance Color Coordinates Connected Load Efficiency Southern California Edison Page v
8 Luminance Measurements Equipment Luminance Camera Photolux Chroma Meter Standard Photographs Sony DSC-V1 Camera Demand Measurements Equipment Power Quality Logger (PQL) Detailed Procedures Luminance and Photolux Standard Photographs Demand Measurements RESULTS 18 Overview Naming Conventions in Results Section Photolux Results- White Light Source with White Face Processing Analysis Chroma Meter Results- All Light Source Colors with All Face Colors25 Processing Analysis Luminance Color Coordinates Demand Measurements Processing Analysis Lamp Efficiency CONCLUSION 43 REFERENCES 44 Southern California Edison Page vi
9 EXECUTIVE SUMMARY TECHNOLOGY DESCRIPTION Channel letter lighting is used in both interior and exterior sign identification and is typically used to display the name of a store or business. Neon has been the traditional light source for channel letter signs, but like LED EXIT signs, light emitting diode (LED) technology is emerging as another light source for the channel letter sign market. However, there are many mixed energy savings and brightness sufficiency claims for LED technology compared to neon. FIGURE 1: LED CHANNEL LETTER SIGNS WITH ACRYLIC FACE ON THE C OF THE LED SIGN LED technology has been used as an alternative to incandescent and fluorescent technology in exit sign lighting. It is currently being used in an increasing number of businesses as an alternative to traditional neon technology for open signs. The directional nature of a LED can potentially make it an ideal technology for channel letter signs, an application in which light is wanted on the face of the letter. Channel letter signs are usually illuminated with neon. PROJECT OBJECTIVE The objective of the project is to show the incremental energy savings and demand reduction of currently available LED channel letter signs over traditional neon channel letter signs. The project assesses and verifies energy savings and demand reductions by measuring the performance of the technologies in a controlled laboratory environment. Photometric tests were performed to verify uncertainties associated with the LED technology, including the brightness, or luminance, of the LED compared to the neon channel letter. Luminance measurements relatively quantify the brightness of LED channel letter signs in comparison to that of neon signs. TEST EQUIPMENT All testing was conducted at Southern California Lighting Technology Center (SCLTC) in Irwindale, California. The sign used for all testing was a Southern California Edison sign displaying the acronym SCE. For uniformity in all photometric tests, only the S was tested, while the C and E were covered with black stage curtains. For power testing, the entire sign was plugged in and measured. Southern California Edison Page 1
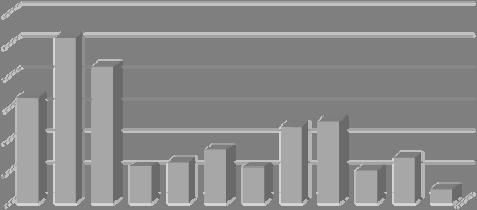
10 SUMMARY OF RESULTS LUMINANCE MEASUREMENTS WHITE LIGHT SOURCE On average, neon has three times the luminance of LED technology. The difference was the least for the white light source with the blue acrylic face, in which neon showed an average of 2.7 times the luminance of LED. Examining the individual products shows that some LEDs have luminance values approaching that of the least luminous neon product. COLORED LIGHT SOURCE In comparing the average luminance values for the red and orange light sources, the neon is only 1.2 and 1.5 times brighter than the LED technology, respectively. The yellow light source with yellow face showed the greatest disparity, with the neon having 5 times greater average luminance than the LED products. Blue and green neon was 3.1 and 4.9 times more luminous than the LED products. Doubling of the blue LED lights greatly increased the LED luminance. CHROMATICITY COORDINATES The chromaticity values (x and y coordinates) were averaged across seven points on the letter S for all products. In comparing white light sources with colored acrylic faces, the largest color difference is units for the green face, with the average neon being slightly more pure green than the average LED. The smallest color hue difference is for red, with both technologies falling well within the range of pure red. In comparing colored light sources with matching colored acrylic faces, the largest color hue difference is again for green, with a difference of units. The smallest color hue difference is again for red (0.003 units), followed by blue (0.006 units). DEMAND Power measurements were taken on all the white light source products. The neon products are all larger demand consumers than the LED products, as shown in Figure 2. On average, the neon products consumed 68.1 watts, ranging from 44.3 watts to watts. The LED products consumed, on average, 24.0 watts, nearly one third of the neon average. The LED products ranged from 13.9 watts to 42.0 watts. Southern California Edison Page 2
 FIGURE 2: DEMAND OF INDIVIDUAL NEON AND LED WHITE LIGHT SOURCES EFFICIENCY One of the objectives of the channel letter tests was to determine if replacing neon with")
11 Photolux Test Average Power Consumption (W) per Sign Region: "SCE" Channel Letter Sign Light Source: White Neon versus White LED Face Color: White Power (W) Average Power Consumption (W) FIGURE 2: DEMAND OF INDIVIDUAL NEON AND LED WHITE LIGHT SOURCES EFFICIENCY One of the objectives of the channel letter tests was to determine if replacing neon with LED would result in energy savings without compromising sign quality. Luminance alone is not an adequate comparison without considering the energy consumption. Efficiency is measured in average luminance per Watt (cd/m 2 /W), and allows an apples to apples comparison across the two product types. WHITE LIGHT SOURCE WITH WHITE ACRYLIC FACE Average luminance across seven spot measurements was used to determine efficiency. On average, the neon products are more efficient, with an average efficiency of 9.3 cd/m 2 /W. The LEDs have an average efficiency of 6.6 cd/m 2 /W. However, the best LEDs are more efficient than the worst neon lamps, as shown in Figure 3. Southern California Edison Page 3

12 14.00 Efficiency (Average Luminance per Watt) Region: "S" Channel Letter Light Source: White Neon versus White LED Face Color: White Luminance per Watt (cd/m 2 /W) Efficiency FIGURE 3: EFFICIENCY OF INDIVIDUAL NEON AND LED WHITE LIGHT SOURCES WITH WHITE ACRYLIC FACE WHITE LIGHT SOURCE WITH COLORED ACRYLIC FACE The white LED products are as efficient, on average, as the white neon products when covered with a colored acrylic face. Efficiency values of the LED products are only slightly lower than the neon products. The exception is the white colored face, in which the average LED product is nearly two points lower on the efficiency scale. Average efficiency values of the white light sources with colored acrylic faces are shown in Figure 4. Southern California Edison Page 4
13 Average Efficiency Values (Luminance per Watt) Data:Chroma Meter Average Luminance & PQL Average Wattage Light Source: White Neon and LED Face: Multiple Colors Luminance/Watt (cd/m 2 /W) LED Neon LED Neon LED Neon LED Neon LED Neon LED Neon Blue Green Orange Red White Yellow FIGURE 4: AVERAGE EFFICIENCY COMPARISON OF WHITE NEON AND WHITE LED WITH COLORED ACRYLIC FACE Some individual white LED products with a colored acrylic face are more efficient than neon products. One green and one yellow LED product out-performed all neon products in efficiency. COLORED LIGHT SOURCE WITH COLORED ACRYLIC FACE When comparing the efficiency of the color light sources, the average efficiency values of the LED products are often comparable or better than the neon products. The blue, orange, and red LEDs are more efficient than the same color neon, with red being considerably more efficient. The green LED is only slightly less efficient than the green neon. However, the average yellow LED performed poorly with much lower efficiency than the yellow neon. Average efficiency values of the colored light sources with matching colored acrylic faces are shown in Figure 5. Southern California Edison Page 5
 6.00 5.00 4.00 3.00 2.00 2.57 2.20 2.05 1.14 1.24 1.78 2.65 1.14 3.88 3.25 5.41 1.00 0.")

14 Average EfficiencyValues (Luminance per Watt) Data:Chroma Meter Average Luminance & PQL Average Wattage Light Source: Color Neon and Color LED Face: Multiple Colors Luminance/Watt (cd/m 2 /W) LED LED Neon LED LED Neon LED Neon LED Neon LED Neon Blue (2x) Blue Green (2x) Green Orange Red Yellow FIGURE 5: AVERAGE EFFICIENCY COMPARISON OF COLOR NEON AND COLOR LED WITH MATCHING COLOR FACE When comparing individual products, some color LED products with a colored acrylic face are more efficient than neon. In all cases with the exception of yellow, one or more LED products are more efficient than the same color neon product. Three yellow LED products approach the efficiency of the one tested yellow neon product. ENERGY SAVINGS Energy savings analysis indicates that LED channel letter lighting can provide significant energy savings, notably in applications where it is used 24 hours per day. TABLE 1: ENERGY SAVINGS SUMMARY FOR LED USE OVER NEON USE FOR 12 OR 24 HOURS/DAY LED LIGHT SOURCE COLOR ENERGY SAVINGS (KWH)- 12 HOURS/DAY Red Orange Yellow Green Green(2x) Blue Blue(2x) White ENERGY SAVINGS (KWH)- 24 HOURS/DAY Southern California Edison Page 6
15 COST The California Sign Association and the International Sign Association performed a survey in partnership with SCE to determine the relative costs of producing LED versus neon channel letters. Results indicate, on average, the total cost of producing LED channel letters is greater than the cost to produce comparable neon letters. The relative production costs ranged from one manufacturer that claims LEDs are 15% less expensive to produce, up to another manufacturer that claims LEDs are 23% more expensive to produce. CONCLUSIONS LED technology for channel letter lighting is promising. Much advancement has been made in recent years with continued advancements still expected. The sample of products assessed here are a good snapshot of products available in LED technology uses significantly less energy than the traditional neon technology used in many channel letter signs. To maintain sign quality, especially sign brightness, these energy savings need to be considered in conjunction with the product efficiency. On average, LED technology tended to be less efficient when compared to neon, largely due to some products that had very low luminance. However, when looking at individual products, it was clear that some LED products are much better performers than others, and out-perform some of the neon products. Another consideration when comparing LED to neon technology is the ease of purchase and installation. Neon channel letters must be hand formed to the channel, while LED channel letters come in flexible strips that do not need forming. This allows the user to manipulate the LED channel letter strips to create more luminance, if desired, by increasing the number of LEDs per letter. In these cases, one must weigh the energy consumption, luminance, and cost of the product to ensure it is still a cost-effective measure. Southern California Edison Page 7

16 INTRODUCTION TECHNOLOGY DESCRIPTION Channel letter lighting is used in both interior and exterior sign identification and is typically used to display the name of a store or business. Channel letter signs are individually internally illuminated letters and graphics. The letters are comprised of a metal or plastic housing, referred to as a U-shaped channel due to the squared U shape of a cross section of the housing, with the top opening of the housing often covered with a colored acrylic face. Neon has been the traditional light source for channel letter signs, but like LED EXIT signs, light emitting diode (LED) technology is emerging as another light source for the channel letter sign market. Figure 6 shows an example of both a neon and LED channel letter sign. Formatte Deleted: FIGURE 6: NEON (TOP) AND LED (BOTTOM) CHANNEL LETTER SIGNS WITH ACRYLIC FACE ON THE C OF THE LED SIGN LED channel letter signs use LED technology as an alternative to traditional neon technology. Instead of neon transformer and gas-filled neon tubes that have been bent and shaped to follow the U-shaped channel, the LED signs use an LED driver and various flexible strips of white or colored LEDs that follow the channel. The LED signs can replace both new and existing neon signs. There are many manufacturers currently selling LED channel letter sign technology, thus making the products easily attainable. An LED is a semiconductor that is completely covered in epoxy. It emits light when there is a proper amount of current in the LED. Often used as little indicator lights on everything from large appliances to portable electronics, the small, low-output LED is a fairly mature technology. However, advances in LED technology have made them Southern California Edison Page 8
17 brighter and more efficient, thereby expanding the application of LED to other markets. In the sign industry, LED is a new technology. The operation of the LED channel letter sign is the same as that of the neon channel letter sign from the perspective of the end-user. The LED sign can be turned on and off when needed, or wired up to a photocell or time-clock in the same way as a neon sign. OBJECTIVE The objective of the project is to show any incremental energy savings and demand reduction of LED channel letter signs over traditional neon channel letter signs. The project assesses and verifies energy savings and demand reductions by measuring the performance of the technologies in a controlled laboratory environment at the Southern California Lighting Technology Center (SCLTC). Photometric tests, also conducted at the SCLTC, demonstrate the differences and similarities between the LED and neon channel letter signs. LED channel letter lighting is currently rebated from $2/ft. of letter to $6/ft of letter for red LED channel letter signs only. The latest advancements in LED technology may allow other colors such as orange (amber), yellow, green, blue, and white to compete with potentially less efficient traditional neon systems. BACKGROUND LED technology, sometimes referred to as Solid State Lighting, differs from traditional light sources in the way light is produced. The historical light sources are incandescent and fluorescent. In an incandescent lamp, a tungsten filament is heated by electric current until it glows or emits light. In a fluorescent lamp, an electric arc excites mercury atoms, which in turn emits ultraviolet (UV) radiation. The UV radiation strikes the phosphor coating on the inside of glass tubes, and is converted to visible light. An LED, in contrast, is a semiconductor diode. The LED consists of a chip of semiconducting material treated to create a structure called a p-n (positive-negative) junction. When connected to a power source, current flows from the p-side or anode to the n-side, or cathode, but not in the reverse direction. Charge-carriers (electrons and electron holes) flow into the junction from electrodes. When an electron meets a hole, it falls into a lower energy level, and releases energy in the form of a photon (light). i The specific color produced by LED lights depends on the materials used in manufacturing. LEDs are manufactured to produce many colors. There are a few popular ways to produce white light. One method is to combine red, green, and blue LEDs (referred to as RBG light), but this can be expensive. A less expensive method is to coat blue LED chip with yellow phosphor, but this can result in a low quality product. For a better quality product, blue LED chips can be coated with high quality phosphors, a method used by many high quality LED manufacturers. Fluorescent light sources require a ballast to function, providing a starting voltage and then limiting electrical current to the lamp. LEDs also require additional Southern California Edison Page 9

18 electronics, called drivers. The driver converts line power to the appropriate voltage and current. LED s are directional in nature and have potentially higher application efficiency than other light sources in specific lighting applications. Because fluorescent and standard "bulb" shaped incandescent lamps emit light in all directions, much of the light produced by the lamp is lost within the fixture, reabsorbed by the lamp, or escapes from the fixture in a direction that is not useful for the intended application. For many fixture types it is not uncommon for 40-50% of the total light output of the lamp(s) to be wasted in a direction not intended for the purpose of the light. LEDs emit light in a specific direction and do not require reflectors or diffusers. Graphic from DOE, EERE FIGURE 7: TRADITIONAL INCANDESCENT OR NEON LIGHT OUTPUT LOSS ii SIGN INDUSTRY In the sign industry, LED is a newer technology. LED technology has been used as an alternative to incandescent technology in exit sign lighting and is currently being used as an alternative to traditional neon technology for open signs used in many businesses. The directional nature of a LED can potentially make it an ideal technology for channel letter signs, an application in which light is wanted on the face of the letter. Channel letter signs are usually illuminated with neon, which is formed by hand to fit inside the channel. CODES AND STANDARDS Current Title 24 standards require a maximum Lighting Power Density (LPD) of 12 W/sq. ft. for internally illuminated signs using magnetic ballasts. However, because the source light is typically neon, channel letter signs are not covered by Title 24 and therefore do not have to meet this LPD requirement. Southern California Edison Page 10
19 COST The California Sign Association and the International Sign Association performed a survey in partnership with SCE to determine the relative costs of producing LED versus neon channel letters. The sign builders surveyed were larger-volume builders whose costs should be representative of the industry at large. Results indicate, on average, the total cost of producing LED channel letters is greater than the cost to produce comparable neon letters. The relative production costs ranged from one manufacturer that claims LEDs are 15% less expensive to produce, up to another manufacturer that claims LEDs are 23% more expensive to produce. There are three basic components that comprise the total production cost: manufacturing labor, installation labor, and material cost. The survey results for each component are discussed, below. MANUFACTURING LABOR All survey participants indicated the labor cost to manufacture neon tubes that are housed in the channel letter is, on average, 20% more than the LED channel letter strips. The builders estimated costs for neon manufacturing labor ranged between 10% and 45% higher than LED manufacturing labor. INSTALLATION LABOR All survey participants indicated the labor cost to install neon channel letters is, on average, 25% more than the labor cost associated with LED channel letter strips. The builders estimated costs for neon installation labor ranged between 10% and 50% higher than LED installation labor. MATERIAL COST All survey participants indicated the material costs to produce LED channel letters is higher than for neon channel letters, costing approximately 26% more. The builders estimated costs for LED materials ranged between 17% and 40% higher than neon materials. METHODOLOGY All testing was conducted at Southern California Lighting Technology Center (SCLTC) in Irwindale, California. The lab allowed for a consistent environment to measure the performance of the signs. The ambient temperature was kept at 73 Fahrenheit throughout the test. The facility featured an internal, light-isolated dark room lined with black stage curtains. The test area was 10 feet deep, 5 feet wide and 8 feet high. This environment provided a near-black area to collect light-related values with negligible interference from external sources. The measurements taken at the SCLTC laboratory each verified some uncertainties associated with the technology. One of the uncertainties with the technology is the Southern California Edison Page 11
20 brightness, or luminance, of the LED compared to the neon channel letter. The purpose of the luminance measurement is to relatively quantify the brightness of LED channel letter signs in comparison to that of neon signs. Another uncertainty is the demand of the technology. The purpose of the demand measurements is to verify any demand reduction when going from neon to LED technology. SCLTC TEST SIGN The sign used for all testing was a Southern California Edison sign displaying the acronym SCE. For uniformity in all the photometric tests, only the S was tested. The C and E were covered with black stage curtains to avoid any light disturbance. For power testing, the entire sign was plugged in and measured. INDEPENDENT VARIABLES LAMP TECHNOLOGY A total of 2 neon and 6 LED manufacturers were tested. One hundred twelve tests were performed, of which 28 tested neon channel letter lighting and 84 tested LED channel letter lighting. The tests included various combinations of colored light and colored faces on the channel letter. LAMP COLOR Six lamp colors were tested: red, orange, yellow, green, blue, and white. Some manufacturers had more than one white color (e.g. white and warm white). In these cases, all white products were tested. ACRYLIC FACE COLOR Six acrylic face colors were tested: red, orange, yellow, green, blue, and white. The acrylic faces were 1/8 thickness. All colored faces were tested with the white light source. In addition, each face color was tested with the matching lamp color (e.g. red lamp with red face, orange lamp with orange face). DEPENDANT VARIABLES MINIMUM, MAXIMUM, AND AVERAGE LUMINANCE Luminance data is obtained from two tests. The results from the luminance camera data used with the Photolux software determines the minimum, maximum, and average luminance values for the white light sources (neon and LED) with a white acrylic face. The results from the chroma meter determine spot luminance and color coordinates for seven points along the S stroke. These seven points are discussed in more detail in the procedures section, below. Southern California Edison Page 12
21 COLOR COORDINATES The results from the chroma meter determine color coordinates for seven points along the middle of the stroke of the letter S. These color coordinates allow color comparison of the neon and LED white light sources with a colored acrylic face, as well as the neon and LED colored light sourced with a matching color acrylic face. The color coordinates also result in a visual representation of the true color of the lights. In other words, by plotting the color coordinates on a chromaticity diagram, one can determine if a yellow light with a yellow face falls within the visual spectrum of yellow. CONNECTED LOAD The signs were plugged in and logged to obtain power data that can be directly compared across products. These power data are also used to determine product efficiency, described below. EFFICIENCY The power data is combined with the sign luminance to provide an efficiency value of average luminance per watt, a unit used in this test for comparison across products. It is well known that LED wattage is significantly lower than neon. However, lower wattage is only of value if the luminance requirements are still met. Therefore, the average luminance per watt value allows an apples to apples comparison across the two product types. LUMINANCE MEASUREMENTS EQUIPMENT LUMINANCE CAMERA Area, total, and maximum luminance (cd/m 2 ) values for each test configuration were measured using a tripod-mounted Nikon Coolpix 5400 camera with installed fisheye lens. Images were recorded using the camera s memory card to allow for later transfer to a computer for analysis. Figure 8 shows the camera. Southern California Edison Page 13


22 FIGURE 8: LUMINANCE CAMERA This measurement technique utilized the camera s image sensor as an array of light sensors. Using specialized luminance software, Photolux 2.0 by ENTPE, similar images were taken at different apertures and shutter speeds and were combined and processed, resulting in false-color luminance maps. Area, total, and maximum luminance values were then obtained from these maps. PHOTOLUX The luminance was measured by using the Photolux system, based on the use of a calibrated CCD camera, the Nikon shown in Figure 8, equipped with a fish-eye lens. The Photolux software produces from one or more photos (with different exposures) a luminance map providing a quasi-continuous representation of the luminance of a scene. Figure 9 shows a luminance map from the test. Southern California Edison Page 14
23 FIGURE 9: PHOTOLUX LUMINANCE MAP The scale on the right hand side of the Photolux image shows the color index for the luminance scale. The brightest or most luminescent parts of the image (up to 2,000 cd/m 2 ) are represented by the red-orange end of the scale, with the pink-purple hues displaying the darkest or least luminescent parts of the image (down to 1 cd/m 2 ). The pink areas show the efficiency of the black stage curtains at cutting out ambient light. For this test a series of fourteen photos were taken and processed to produce the luminance map. Aperture and shutter speed for each photo are shown in Table 2. TABLE 2: CAMERA EXPOSURE SETTINGS PHOTO SHUTTER SPEED APERTURE / / / / / / / / / / / / CHROMA METER Spot luminance and chromaticity values for each product were measured using a handheld Konica Minolta CS-100A chroma meter with integrated LCD. Values were recorded and transferred to a computer for analysis. Figure 10 shows a picture of the chroma meter. Deleted: Southern California Edison Page 15


24 FIGURE 10: CHROMA METER STANDARD PHOTOGRAPHS SONY DSC-V1 CAMERA In addition to the photographs taken for the luminance measurements and Photolux analysis, a Sony DSC-V1 camera was used to take a standard photo of each test configuration. This allowed for a visual comparison of all tested light sources. DEMAND MEASUREMENTS EQUIPMENT POWER QUALITY LOGGER (PQL) Demand values for each sign configuration were measured using an Aemc Instruments PQL 120 power meter with integrated logging capability. Values were recorded using the internal memory for later transfer to a computer for analysis. Figure 11 shows the PQL 120. Southern California Edison Page 16

25 FIGURE 11: DEMAND AND POWER QUALITY LOGGER DETAILED PROCEDURES LUMINANCE AND PHOTOLUX Each of the neon and LED channel letters was measured using the same basic routine. First, the channel letter was set up with neon or LED technology following manufacturer specifications. The tri-pod mounted luminance camera was positioned one horizontal foot from letter to lens, at the same height as the letter. The sign was turned on and the time recorded. The neon technology was allowed to warm up, and the acrylic letter face was left off. Luminance and chromaticity values were measured with the chroma meter. Seven luminance, color coordinates, and power measurement readings were taken, and the time was recorded. The seven spot measurements were taken along the stroke of the letter S, at the middle of the width of the stroke, as shown in Figure 12. FIGURE 12: MEASUREMENT POINTS ALONG S STROKE. For both neon and LED, a 1/8 acrylic face was placed on the channel letter, and the seven measurements were recorded. This was repeated for all 5 colored faces (red, orange, yellow, green and blue), followed by the white acrylic face. After the seven spot measurements were taken with the white acrylic face, a set of images was taken with the fisheye lens. These images of the white light source plus white face were taken for later processing with the specialized Photolux luminance software. Additional tests repeated the spot measurement procedure using neon and LED colored light sources and matching acrylic face (i.e. blue light source with blue face). STANDARD PHOTOGRAPHS After the spot measurement procedure was completed for each configuration, standard pictures were taken with the Sony DSC-V1 camera. The shutter speed was set to 1/15 seconds with an aperture of 1/8. The camera was mounted at a distance of 9 feet from the letter. Southern California Edison Page 17
26 DEMAND MEASUREMENTS Each of the products was measured using the same basic routine. The power logger (PQL) was connected to a line voltage (approximately 110 VAC at 60 Hz) and configured to record in 5-second intervals for the duration of the testing period. The SCE sign was connected to the logger which recorded throughout the testing period. After the SCE sign was turned off, the logger continued to record as each configuration was tested. The logger was not turned off until the final test of the day was completed and the sign was turned off. RESULTS OVERVIEW Data was downloaded from equipment memory and imported into appropriate software for processing and analyzing luminance, demand, and startup characteristics. NAMING CONVENTIONS IN RESULTS SECTION Products are not directly identified in this report. Instead, a generic naming convention was created for each product tested. The tests are organized by neon and LED sets, which is the first part of the generic name. This is followed by one letter to describe the color of the light source and then an additional letter to describe the color of the acrylic face. For example, the first neon set with a red light source and red face would be named Neon-Set 1-R-R. Some manufacturers have two different white light sources, such as white and warm white. To differentiate between these two products, white light sources include a number after the W. For example, LED-Set 4-W1-R and LED-Set 4-W2-R represent the same LED manufacturer, with two white light sources tested with the red face. Tested products are listed by manufacturer in Appendix A, but are not identified with their generic name used in the analysis. PHOTOLUX RESULTS- WHITE LIGHT SOURCE WITH WHITE FACE PROCESSING Images for each sign were downloaded from the camera s memory card, and imported into the specialized luminance software for processing. False color luminance maps were created from the data. Figure 13 shows the false color luminance map for a white LED light source with a white face (LED-Set 2-W1-W). Southern California Edison Page 18


27 FIGURE 13: FALSE COLOR LUMINANCE MAP FOR LED-SET 2-W1-W SHOWING OUTLINE OF LUMINANCE AREA STATISTIC ZONE Area, maximum and minimum luminance (cd/m 2 ) values were obtained from these maps. Area luminance was defined as the average luminance of the area within the S region, shown in bright reds, yellows, greens and some blues. The area excludes the area surrounding the S that comprises the rest of the map, shown in dark blues and pinks. The area was obtained by using a statistic zone drawn around the perimeter of the S. Figure 13 includes the statistic zone, drawn as a thin black line around the edges of the S, for LED-Set 2-W1-W. Area luminance was obtained through direct output of the specialized Photolux luminance software. Figure 14 shows the statistics display for LED-Set 2-W1-W from which the average luminance of cd/m 2 is obtained for the statistic zone outlined in Figure 13. FIGURE 14: LUMINANCE STATISTICS DISPLAY The Photolux images were also used to determine the maximum and minimum luminance along the middle of the stroke of the letter, which represents the source of the neon or LED light. Ideally, the luminance values would be uniform across the face of the letter, such that dark and light spots would not be visible to the naked eye. In reality, nearly all products tested showed at least some contrast across the letter surface, though some products performed better than others. The maximum and minimum luminance test revealed that contrasting bright and dark spots are more likely to occur with LED strip lighting. This spotting is due to the spacing of the clustered LEDs along the strip, as shown in Figure 15. The arrow in Figure 15 highlights a space between two LED clusters where one might expect to see a dark spot between the light LED clusters. Southern California Edison Page 19


28 FIGURE 15: POSSIBLE CONTRASTING LIGHT AND DARK SPOTS BETWEEN LED CLUSTERS The Photolux image in Figure 16 displays the maximum and minimum luminance values along the source of both a neon light source and an LED light source. As expected, the neon light shows little contrast, as indicated by the small difference between the maximum and minimum points, while the LED shows greater contrast. However, it is important to note that not all contrast that is picked-up by the Photolux software is visible to the human eye, as evidenced by luminance photos of the identical neon and LED products in Figure 17. FIGURE 16: PHOTOLUX SOFTWARE MAXIMUM AND MINIMUM LUMINANCE POINTS FOR NEON (LEFT) AND LED (RIGHT) PRODUCTS Southern California Edison Page 20


29 FIGURE 17: LUMINANCE PHOTOS OF THE NEON (LEFT) AND LED (RIGHT) PRODUCTS DISPLAYED IN FIGURE 16. ANALYSIS The following figures compare white Neon and LED light sources with white faces. In comparing neon light sources with LED light sources, there was considerable variability between the two groups. As seen in Figure 18 through Figure 24, there was also significant variability within both neon and LED lighting. Note that one of the LED products was tested with twice the number of manufacture recommended LEDs for the size of the channel letter. This product name is followed by a 2x (for two-times the amount), and is apparent by the nearly double maximum luminance value in Figure 18. In many cases, if greater luminance is desired, the number of LEDs per letter may be increased. Deleted: Deleted: PhotoLux Test Region Maximum Luminance Results Region: "S" Channel Letter Light Source: White Neon versus White LED Face Color: White Luminance (cd/m 2 ) Region Maximum Luminance (cd/m2) FIGURE 18: PHOTOLUX REGION MAXIMUM LUMINANCE RESULTS As seen in Figure 18, all of the neon lights had higher maximum luminance measurements than the LED source light. For a visual comparison, the light source with the highest maximum luminance ( cd/m 2 ) is pictured beside the light Deleted: Southern California Edison Page 21
 with the LED with the highest maximum luminance (LED-Set 2-W2-W(2x)).")
 LUMINANCE The degree to which a light source has measurable contrast can be evaluated by a contrast ratio.")
30 source with the smallest maximum luminance (58.1 cd/m 2 ) in Figure 19. Figure 20 compares the neon with the lowest maximum luminance (Neon-Set 1-W1-W) with the LED with the highest maximum luminance (LED-Set 2-W2-W(2x)). Deleted: FIGURE 19: PHOTO COMPARISON OF REGION WITH HIGHEST (NEON) AND LOWEST (LED) MAXIMUM LUMINANCE FIGURE 20: PHOTO COMPARISON OF NEON WITH LOWEST MAXIMUM (LEFT) AND LED WITH HIGHEST MAXIMUM (RIGHT) LUMINANCE The degree to which a light source has measurable contrast can be evaluated by a contrast ratio. The ratio of the maximum luminance over minimum luminance provides a metric for easy comparison between products. A ratio of one represents a perfect light source with no measurable contrast. As the ratio diverges from one, the more that light source produces measurable contrast. Figure 21 displays the contrast ratio for all tested white light source with white acrylic face configurations. Southern California Edison Page 22


31 PhotoLux Test Region Contrast Ratio Maximum/Minimum Luminance Region: "S" Channel Letter Light Source: White Neon versus White LED Face Color: White Contrast Ratio (Max cd/m 2 / Min cd/m 2 ) Contrast Ratio FIGURE 21: REGION CONTRAST RATIO FOR NEON VERSUS LED It is apparent that, on average, the neon light sources have significantly lower contrast, meaning there is a more even distribution of light across the face of the letter. Having a ratio close to one signifies a more uniform region with less contrast. A high ratio indicates greater contrast, and may appear spotty to the naked eye. However, this is not always the case, as shown in Figure 22. The contrast in the image on the right is not visible to the naked eye. FIGURE 22: NEON- SET 2-W2-W (LOWER CONTRAST OF 4) VERSUS NEON-SET 5-W1-W (HIGHER CONTRAST OF 30) During the Photolux test, power measurements were taken on all the products. The neon products were all larger consumers than the LED products. On average, the neon products consumed 68.1 watts with a range of 44.3 watts (Neon-Set 4-W1-W) Southern California Edison Page 23
. 120.00 Photolux Test Average Power Consumption (W) per Sign Region: \"SCE\" Channel Letter Sign Light Source: White Neon versus White LED Face Color: White 100.00 80.")
32 to watts (Neon-Set 3-W1-W). The LED products consumed, on average, 24.0 watts, nearly one third of the average neon consumption. The LED products ranged from 13.9 watts (LED-Set 6-W1-W) to 42.0 watts (LED-Set 4-W1-W) Photolux Test Average Power Consumption (W) per Sign Region: "SCE" Channel Letter Sign Light Source: White Neon versus White LED Face Color: White Power (W) Average Power Consumption (W) FIGURE 23: POWER CONSUMPTION OF NEON VERSUS LED The Photolux software was used to determine the average luminance across the face of the S region. This average luminance was used to determine efficiency in average luminance per watt. Efficiency is reported, for each product tested, as shown in Figure 24. On average, the neon products were more efficient, with an average efficiency of 9.3 cd/m 2 /Watt. The LEDs had an average efficiency of 6.6 cd/m 2 /Watt. While the two most efficient products were neon (Neon-Set 4-W1-W and Neon-Set 5- W1-W) and stood out from all the tested products, the majority of the LED products were on par with Neon-Set 1-W1-W through Neon-Set 3-W1-W. The best LEDs were more efficient than the worst neon lamps. Southern California Edison Page 24
33 14.00 Efficiency (Average Luminance per Watt) Region: "S" Channel Letter Light Source: White Neon versus White LED Face Color: White Luminance per Watt (cd/m 2 /W) Efficiency FIGURE 24: EFFICIENCY (LUMINANCE/WATT) OF ALL TESTED NEON AND LED PRODUCTS CHROMA METER RESULTS- ALL LIGHT SOURCE COLORS WITH ALL FACE COLORS PROCESSING Images of test configurations for all color combinations were downloaded from the camera s memory for visual comparison of photometry results. Spot luminance (cd/m 2 ), and chromaticity (X and Y coordinates) values were transferred from the chroma meter and imported into Microsoft Excel for analysis. The data was arranged by product to create averages across the seven spot measurements. The data was then averaged and reported by technology type. ANALYSIS LUMINANCE While Figure 20 showed an example in which the contrast ratio of the LED is not quite visible to the human eye, Figure 25 shows three letters with fairly visible contrast ratios next to a neon letter with a low contrast ratio. In many cases, high contrast ratios were more visible with the colored faces. Southern California Edison Page 25
34 FIGURE 25: LUMINANCE PHOTO COMPARISON OF REGIONS WITH LOW CONTRAST RATIO (LEFT) TO HIGH CONTRAST RATIO (RIGHT) USING A WHITE LIGHT SOURCE AND BLUE FACE. The images in Figure 25 are Neon-Set 2-W1-B, LED-Set 4-W1-B, LED-Set 5-W1-B, and LED-Set 5-W2-B, from left to right. The chroma meter luminance results are displayed in Table 2. The image on the far left has the highest average luminance across the seven spot luminance measurements. TABLE 3: CHROMA METER RESULTS FOR FOUR WHITE LIGHT SOURCE PRODUCTS WITH BLUE FACE WITH VARYING CONTRAST SEVEN SPOT LUMINANCE MEASUREMENTS PRODUCT MIN MAX AVG Neon-Set 2-W1-B LED-Set 4-W1-B LED-Set 5-W1-B LED-Set 5-W2-B All luminance and chromaticity values were averaged for each color and technology. Figure 26 shows the averaged luminance values for the neon and LED technologies with a white light source and a colored acrylic face. The face colors are displayed on the axis below the chart. Southern California Edison Page 26


35 Average Chroma Meter Luminance Values Across Seven Spot Measurements Light Source: White Neon versus White LED Face: Muliple Colors Luminance (cd/m 2 ) LED Neon LED Neon LED Neon LED Neon LED Neon LED Neon Blue Green Orange Red White Yellow FIGURE 26: AVERAGE LUMINANCE VALUES BY LIGHTING TYPE ACROSS 7 SPOT MEASUREMENTS FOR WHITE SOURCE PLUS COLOR FACE On average, neon has three times the luminance of LED technology. The difference was the least for the white light source with the blue acrylic face, in which the neon showed 2.7 times the luminance of the LED. Figure 27 shows the results averaged across the two technologies. Examining the individual products shows that some LEDs have luminance values approaching that of the least luminous neon product. Southern California Edison Page 27
 120.0 100.0 80.0 60.0 40.0 20.")


 1000.0 900.0 800.0 700.0 600.0 500.0 400.0 300.0 200.0 100.0 0.")


36 Average Chroma Meter Luminance Values Across Seven Spot Measurements Light Source: White Face: Blue Average Chroma Meter Luminance Values Across Seven Spot Measurements Light Source: White Face: Green Luminance (cd/m 2 ) Luminance (cd/m 2 ) White Source with Blue Face Average Chroma Meter Luminance Values Across Seven Spot Measurements Light Source: White Face: Orange White Source with Green Face Average Chroma Meter Luminance Values Across Seven Spot Measurements Light Source: White Face: Red Luminance (cd/m 2 ) Luminance (cd/m 2 ) White Source with Orange Face Average Chroma Meter Luminance Values Across Seven Spot Measurements Light Source: White Face: White White Source with Red Face Average Chroma Meter Luminance Values Across Seven Spot Measurements Light Source: White Face: Yellow Luminance (cd/m 2 ) Luminance (cd/m 2 ) White Source with White Face White Source with Yellow Face FIGURE 27: AVERAGE OF SEVEN CHROMA METER LUMINANCE VALUES, WHITE LIGHT SOURCE WITH COLORED FACE LED-Set 4-W1 appears to have consistently higher luminance than the other LED products. The only exception is the doubled LED-Set 2-W2-W(2x) in the white source plus white face test. The chart displaying the white light source with the white acrylic face supports the similar luminance charts from the Photolux analysis. Refer to Figure 18 in which the Deleted: Southern California Edison Page 28


37 Photolux maximum luminance was charted. The same relative relationship is reported in the comparable white neon versus LED chroma meter chart displayed in Figure 18. This is a good indicator that the two testing procedures appropriately measure luminance data. Deleted: Next, the averaged luminance values for the neon and LED technologies with a color light source and matching colored acrylic face were examined. The results are displayed in Figure 28. The color of the light source and face are represented in the axis below the chart. Average Chroma Meter Luminance Values Across Seven Spot Measurements Light Source: Color Neon verus Color LED Face: Color Matches Light Source Luminance (cd/m 2 ) LED Neon LED Neon LED Neon LED Neon LED Neon Blue Green Orange Red Yellow FIGURE 28: AVERAGE LUMINANCE VALUES BY LIGHTING TYPE ACROSS 7 SPOT MEASUREMENTS FOR COLORED LIGHT SOURCE PLUS MATCHING COLOR FACE In comparing the average luminance values for the red and orange light sources, the neon is only 1.2 and 1.5 times brighter than the LED technology, respectively. The yellow light source with yellow face showed the greatest disparity, with the neon having 5 times greater average luminance than the LED products. Blue and green neon was 3.1 and 4.9 times more luminous than the LED products. To determine if increasing the number of LEDs would decrease the disparity, an additional test was run in which the total number of blue and green LEDs was doubled. Figure 29 shows the effect of doubling the number of manufacturer recommended LED lights in the channel letter for both blue and green lighting. Doubling of the blue LED lights greatly increased the LED luminance. Southern California Edison Page 29
 80.0 60.0 39.4 75.0 40.0 21.9 28.9 20.0 0.")

38 Average Chroma Meter Luminance Values Across Seven Spot Measurements Light Source: Green and Blue Neon versus LED Including LEDs with 2-Times Manufacturer Specifacation Face: Color Matches Light Source Luminance (cd/m 2 ) LED Neon LED LED Neon LED Blue Blue (2x) Green Green (2x) FIGURE 29: AVERAGE LUMINANCE VALUES BY LIGHTING TYPE ACROSS 7 SPOT MEASUREMENTS FOR GREEN AND BLUE COLORED LIGHT SOURCE PLUS MATCHING COLOR FACE Figure 28 and Figure 29 show the results averaged across the two technologies. Examining the individual products shows that some LEDs have greater luminance and may be comparable to some neon with lesser luminance. Figure 30 displays the individual neon products beside the individual LED products. Southern California Edison Page 30


 160.0 140.0 120.0 100.")

")


39 Average Chroma Meter Luminance Values Across Seven Spot Measurements Light Source: Blue Face: Blue Average Chroma Meter Luminance Values Across Seven Spot Measurements Light Source: Green Face: Green Luminance (cd/m 2 ) Luminance (cd/m 2 ) Blue Source with Blue Face Green Light with Green Face Average Chroma Meter Luminance Values Across Seven Spot Measurements Light Source: Orange Face: Orange Average Chroma Meter Luminance Values Across Seven Spot Measurements Light Source: Red Face: Red Luminance (cd/m 2 ) Luminance (cd/m 2 ) Orange Source with Orange Face Red Source with Red Face Average Chroma Meter Luminance Values Across Seven Spot Measurements Light Source: Yellow Face: Yellow Luminance (cd/m 2 ) Yellow Source with Yellow Face FIGURE 30: AVERAGE OF SEVEN CHROMA METER LUMINANCE VALUES, COLOR LIGHT SOURCE WITH COLOR FACE As noted in the Photolux results, the luminance alone is not an adequate comparison without considering the energy consumption. The Demand Measurements section below summarizes the consumption and efficiency (Luminance/Watt) data. Southern California Edison Page 31
40 COLOR COORDINATES The chromaticity values (coordinates) were averaged across the seven measurement point for both the neon and LED technology. Table 4 displays the results using the white light source with color face data. TABLE 4: COLOR COORDINATES FOR NEON VS. LED, WHITE LIGHT SOURCE WITH COLOR FACE WHITE LIGHT TECHNOLOGY Neon LED FACE COLOR Blue Green Orange Red White Yellow Blue Green Orange Red White Yellow COORD- INATE AVERAGE X Y X Y X Y X Y X Y X Y X Y X Y X Y X Y X Y X Y The averaged data was then arranged to create comparisons between technologies for each technology color coordinate. Subtracting an LED chromaticity coordinate from a neon chromaticity coordinate results in a difference that expresses the relative color hue between the represented items of each value (i.e. blue neon chromaticity coordinates subtracted from blue LED chromaticity coordinates results in the blue color hue difference between neon and LED signs). Table 5 shows the comparisons between the chromaticity coordinates of white neon and LED light sources with color faces. Southern California Edison Page 32
41 TABLE 5: AVERAGE CHROMATICITY COORDINATES FOR WHITE NEON AND LED WITH COLOR FACES FACE COLOR COORDINATE NEON LED DIFFERENCE REFERENCE X Blue Y X Green Y X Orange Y X Red Y X White Y X Yellow Y The largest color hue difference was units for the green color face, with the average neon being slightly more pure green than the average LED. The smallest color hue difference was for red, with both technologies falling well within the range of pure red. These color coordinates are averaged across the technology types. For a table of the color coordinates of the individual products, refer to Appendix B. The same analysis was performed for the color light sources with the matching color face. The chromaticity coordinates were averaged across the seven measurement points for both the neon and LED technology. Table 6 displays the results using the color light source with color face data. Southern California Edison Page 33
42 TABLE 6: COLOR COORDINATES FOR NEON VS. LED, COLOR LIGHT SOURCE WITH COLOR FACE WHITE LIGHT TECHNOLOGY Neon LED FACE COLOR Blue Green Orange Red Yellow Blue Green Orange Red Yellow COORD- INATE AVERAGE X Y X Y X Y X Y X Y X Y X Y X Y X Y X Y As with the white light source data, the average color light source coordinates were compared. Table 7 shows the difference between the color neon and LED chromaticity coordinates. Southern California Edison Page 34
43 TABLE 7: AVERAGE CHROMATICITY COORDINATES FOR WHITE NEON AND LED WITH COLOR FACES FACE COLOR COORDINATE NEON LED DIFFERENCE REFERENCE X Blue Y X Green Y X Orange Y X Red Y X Yellow Y Again, the largest color hue difference was for green. The average LED green light with green color face was units closer to more pure green than the average neon product. The smallest color hue difference of units was again for red, with both technologies falling well within the range of pure red. The X and Y coordinates refer to the CIE 1931 chromaticity diagram. Figure 31 shows this diagram with the average chromaticity coordinates plotted. Plotting the chromaticity coordinates allows for a visual comparison of the color hues and where they fall with respect to the normal range of the reference color. Southern California Edison Page 35

44 FIGURE 31: CHROMATICITY DIAGRAM WITH COORDINATES OF NEON AND LED COLOR LIGHT SOURCES WITH COLOR FACE It is apparent that there is considerable overlap between the red and orange hues, with the orange coordinates typically falling within the red hue range. In addition, the average yellow hues tend towards orange, especially when considering the yellow LED. These color coordinates are averaged across the technology types. For a table of the color coordinates of the individual products, refer to Appendix B. DEMAND MEASUREMENTS PROCESSING Power data was collected with the Power Quality Logger. The power logger recorded the power every 5 seconds, and stamped each reading with the date and time. This data was imported into Microsoft Excel for analysis. Southern California Edison Page 36

 6.00 5.00 4.00 3.00 2.00 1.00 1.96 2.00 0.73 0.89 1.26 1.62 2.82 3.54 0.")
45 ANALYSIS LAMP EFFICIENCY One of the objectives of the channel letter tests was to determine if replacing neon with LED would result in energy savings without compromising sign quality. The efficiency comparison provides information to help to answer this question. Average Efficiency Values (Luminance per Watt) Data:Chroma Meter Average Luminance & PQL Average Wattage Light Source: White Neon and LED Face: Multiple Colors Luminance/Watt (cd/m 2 /W) LED Neon LED Neon LED Neon LED Neon LED Neon LED Neon Blue Green Orange Red White Yellow FIGURE 32: EFFICIENCY COMPARISON OF WHITE NEON AND LED WITH COLOR FACE In general, the LED products are as efficient as the neon products, with efficiency values only slightly lower than the neon products. The exception is the white LED product, which is nearly two points lower on the efficiency scale. The efficiency values of the individual products are examined in Figure 33 to determine if some LED products are more efficient than the neon products. Deleted: Southern California Edison Page 37


 2.")

 14.00 12.00 10.")


46 Product Efficiency Values (Luminance per Watt) Data:Chroma Meter Average Luminance & PQL Average Wattage Light Source: White Neon and LED Face: Blue Product Efficiency Values (Luminance per Watt) Data:Chroma Meter Average Luminance & PQL Average Wattage Light Source: White Neon and LED Face: Green Luminance/Watt (cd/m 2 /W) Luminance/Watt (cd/m 2 /W) Blue Green Product Efficiency Values (Luminance per Watt) Data:Chroma Meter Average Luminance & PQL Average Wattage Light Source: White Neon and LED Face: Orange Product Efficiency Values (Luminance per Watt) Data:Chroma Meter Average Luminance & PQL Average Wattage Light Source: White Neon and LED Face: Red Luminance/Watt (cd/m 2 /W) Luminance/Watt (cd/m 2 /W) Orange Red Product Efficiency Values (Luminance per Watt) Data:Chroma Meter Average Luminance & PQL Average Wattage Light Source: White Neon and LED Face: White Product Efficiency Values (Luminance per Watt) Data:Chroma Meter Average Luminance & PQL Average Wattage Light Source: White Neon and LED Face: Yellow Luminance/Watt (cd/m 2 /W) Luminance/Watt (cd/m 2 /W) White Yellow FIGURE 33: PRODUCT EFFICIENCY VALUES, WHITE LIGHT SOURCE WITH COLORED FACE When comparing individual products, it is apparent that some white LED products with a colored acrylic face are more efficient than neon products. At least one green, red, and yellow LED product out-performed all neon products in efficiency. Next, the efficiency of color LED and neon products were compared, as shown in Figure 34. Deleted: Southern California Edison Page 38
47 Average EfficiencyValues (Luminance per Watt) Data:Chroma Meter Average Luminance & PQL Average Wattage Light Source: Color Neon and Color LED Face: Multiple Colors Luminance/Watt (cd/m 2 /W) LED LED Neon LED LED Neon LED Neon LED Neon LED Neon Blue (2x) Blue Green (2x) Green Orange Red Yellow FIGURE 34: EFFICIENCY COMPARISON OF COLOR NEON AND LED WITH MATCHING COLOR FACE When comparing the efficiency of the color light sources, the average efficiency values of the LED products are often comparable or better than the neon products. The blue, orange, and red LEDs are more efficient than the same color neon, with red being considerably more efficient. The green LED is only slightly less efficient than the green neon. However, the average yellow LED performed poorly with much lower efficiency than the yellow neon. Southern California Edison Page 39

 4.50 4.00 3.50 3.00 2.50 2.00 1.50 1.00 0.50 0.")

 4.00 3.50 3.00 2.50 2.00 1.50 1.00 0.50 0.")


48 Product Efficiency Values (Luminance per Watt) Data:Chroma Meter Average Luminance & PQL Average Wattage Light Source: Blue Neon and LED Face: Blue Product Efficiency Values (Luminance per Watt) Data:Chroma Meter Average Luminance & PQL Average Wattage Light Source: Green Neon and LED Face: Green Luminance/Watt (cd/m 2 /W) Luminance/Watt (cd/m 2 /W) Blue Green Product Efficiency Values (Luminance per Watt) Data:Chroma Meter Average Luminance & PQL Average Wattage Light Source: Orange Neon and LED Face: Orange Product Efficiency Values (Luminance per Watt) Data:Chroma Meter Average Luminance & PQL Average Wattage Light Source: Red Neon and LED Face: Red Luminance/Watt (cd/m 2 /W) Luminance/Watt (cd/m 2 /W) Orange Red Product Efficiency Values (Luminance per Watt) Data:Chroma Meter Average Luminance & PQL Average Wattage Light Source: Yellow Neon and LED Face: Yellow 6.00 Luminance/Watt (cd/m 2 /W) Yellow FIGURE 35: PRODUCT EFFICIENCY OF COLOR NEON AND LED WITH MATCHING COLOR FACE As with the white LED products, when comparing individual products, it is apparent that some color LED products with a colored acrylic face are more efficient than neon products. In all cases with the exception of yellow, one or more LED products was more efficient than the same color neon product. Three yellow LED products approached the efficiency of the one tested yellow neon product. Southern California Edison Page 40
LED Linear Architectural Lighting
 Design & Engineering Services LED Linear Architectural Lighting ET 06.17 Report Prepared by: Design & Engineering Services Customer Service Business Unit Southern California Edison December 14, 2009 Acknowledgements
Q1. Do LED lights burn out?
 Here are answers to your LED lighting Frequently Asked Questions. We hope this page is helpful and informative. Be sure to come back from time to time as we continually add to this page to reflect the
Sep 09, APPLICATION NOTE 1193 Electronic Displays Comparison
 Sep 09, 2002 APPLICATION NOTE 1193 Electronic s Comparison Abstract: This note compares advantages and disadvantages of Cathode Ray Tubes, Electro-Luminescent, Flip- Dot, Incandescent Light Bulbs, Liquid
LED Lighting 12 th Annual Building Codes Education Conference March Bozeman, MT Jaya Mukhopadhyay, Co-Director, Integrated Design Lab
 LED Lighting 12 th Annual Building Codes Education Conference March 27-30 2017 Bozeman, MT Jaya Mukhopadhyay, Co-Director, Integrated Design Lab Montana State University, Bozeman, MT Learning Objectives
Application Note [AN-007] LCD Backlighting Technologies and Configurations
![Application Note [AN-007] LCD Backlighting Technologies and Configurations](/thumbs/81/83266365.jpg "Application Note [AN-007] LCD Backlighting Technologies and Configurations") Application Note [AN-007] LCD Backlighting Technologies Introduction Liquid Crystal Displays (LCDs) are not emissive i.e. they do not generate their own light. Transmissive and transflective displays require
Application Note [AN-007] LCD Backlighting Technologies Introduction Liquid Crystal Displays (LCDs) are not emissive i.e. they do not generate their own light. Transmissive and transflective displays require
About LED Lighting. White Paper: Operating Characteristics. Low Power LEDs
 2940 Pacific Drive Norcross, GA 30071 Updated-February 19, 2010 White Paper: About LED Lighting Halco Lighting Technologies has spent a significant amount of effort in the development of effective LED
LED modules for illuminated signs Opto Semiconductors
 New creativity in lighting design LED modules for illuminated signs Opto Semiconductors Illuminated signs with LED modules. Modern. Professional. Creative. An excellent way to advertise: LED modules (BACKlight,
Monitor QA Management i model
 Monitor QA Management i model 1/10 Monitor QA Management i model Table of Contents 1. Preface ------------------------------------------------------------------------------------------------------- 3 2.
Power Consumption Trends in Digital TVs produced since 2003
 Power Consumption Trends in Digital TVs produced since 2003 Prepared by Darrell J. King And Ratcharit Ponoum TIAX LLC 35 Hartwell Avenue Lexington, MA 02421 TIAX Reference No. D0543 for Consumer Electronics
BUREAU OF ENERGY EFFICIENCY
 Date: 26 th May, 2016 Schedule No.: 11 Color Televisions 1. Scope This schedule specifies the energy labeling requirements for color televisions with native resolution upto 1920 X 1080 pixels, of CRT,
LEDs, New Light Sources for Display Backlighting Application Note
 LEDs, New Light Sources for Display Backlighting Application Note Introduction Because of their low intensity, the use of light emitting diodes (LEDs) as a light source for backlighting was previously
Background Statement for SEMI Draft Document 5379B Revision to D , TERMINOLOGY FOR LCD BACKLIGHT UNIT
 Background Statement for SEMI Draft Document 5379B Revision to D36-0306, TERMINOLOGY FOR LCD BACKLIGHT UNIT Notice: This background statement is not part of the balloted item. It is provided solely to
Seattle IFMA Education Symposium June The Riddles of LED Lighting. Chris Lewis, CFM
 Seattle IFMA Education Symposium June 2017 The Riddles of LED Lighting Chris Lewis, CFM LED Lighting A little history: Q: When was the LED invented? What s taking so long? The first LED s were not in the
Tipping the balancetotal Cost of Ownership
 Tipping the balancetotal Cost of Ownership White Paper www.pro.sony.eu/dcinema Total Cost of Ownership (TCO) analysis is an invaluable technique for financial comparison of different solutions and technologies
Light Emitting Diodes
 By Kenneth A. Kuhn Jan. 10, 2001, rev. Feb. 3, 2008 Introduction This brief introduction and discussion of light emitting diode characteristics is adapted from a variety of manufacturer data sheets and
Guidelines for Specification of LED Lighting Products 2010
 Guidelines for Specification of LED Lighting Products 2010 September 2010 Introduction With LED s emerging as a new functional light source there is a need to ensure performance claims are made in a consistent
Introduction. Characteristics (Note 1, 2) Parameters Typical Value Units Conditions
 Parameters Typical Value Units Conditions") LMG257-185XTN Introduction 18.5" Sunlight Readable LCD Module The LMG257-185XTN is a 18.5" Sunlight Readable LCD module. The module consists of an AUO M185XTN01.2 TFT color LCD panel and a VHB (very high
LMG257-185XTN Introduction 18.5" Sunlight Readable LCD Module The LMG257-185XTN is a 18.5" Sunlight Readable LCD module. The module consists of an AUO M185XTN01.2 TFT color LCD panel and a VHB (very high
Display Subsystem Power Measurement Recommendations. Revision 2.0
 Display Subsystem Power Measurement Recommendations Revision 2.0 The document and information contained herein is not a license, either expressly or impliedly, to any intellectual property owned or controlled
Implementation of LED Roadway Lighting
 Implementation of LED Roadway Lighting Ken Taillon, Principal Investigator Short Elliot Hendrickson, Inc. (SEH ) May 2016 Research Project Final Report 2016-17 To request this document in an alternative
CHICAGOMINIATURE LAMP, INC. WHERE INNOVATION COMES TO LIGHT
 Introduction Chicago Miniature Lamp Co., a division of SLI, is a world leader in the manufacture of LEDs and LED assemblies. CML offers a wide variety of products utilizing LEDs as a light source, from
2.2. VIDEO DISPLAY DEVICES
 Introduction to Computer Graphics (CS602) Lecture 02 Graphics Systems 2.1. Introduction of Graphics Systems With the massive development in the field of computer graphics a broad range of graphics hardware
Development of OLED Lighting Panel with World-class Practical Performance
 72 Development of OLED Lighting Panel with World-class Practical Performance TAKAMURA MAKOTO *1 TANAKA JUNICHI *2 MORIMOTO MITSURU *2 MORI KOICHI *3 HORI KEIICHI *4 MUSHA MASANORI *5 Using its proprietary
The use of an available Color Sensor for Burn-In of LED Products
 As originally published in the IPC APEX EXPO Conference Proceedings. The use of an available Color Sensor for Burn-In of LED Products Tom Melly Ph.D. Feasa Enterprises Ltd., Limerick, Ireland Abstract
Interaction of Infrared Controls And Fluorescent Lamp/Ballast Systems In Educational Facilities
 LSD 6-1999 A NEMA Lighting Systems Division Document Interaction of Infrared Controls And Fluorescent Lamp/Ballast Systems In Educational Facilities Prepared by Lamp Section Ballast Section National Electrical
Concurrent Contrast and Brightness Scaling for a Backlit TFT-LCD Display. Outline
 Concurrent Contrast and Brightness Scaling for a Backlit TFT-LCD Display Wei-Chung Cheng, Yu Hou, Massoud Pedram University of Southern California Dept. of EE Systems Los Angeles CA February 17, 2004 Outline!
Measurement of automatic brightness control in televisions critical for effective policy-making
 Measurement of automatic brightness control in televisions critical for effective policy-making Michael Scholand CLASP Europe Flat 6 Bramford Court High Street, Southgate London, N14 6DH United Kingdom
LEDs. Types and Uses. By Wil Davis June 18, 2016
 LEDs (Light Emitting Diodes) Types and Uses By Wil Davis June 18, 2016 Definition Commonly called LEDs. Found every where Basically, LEDs are like tiny light bulbs that fit easily into an electrical circuit.
REPORT 3933 US ROUTE 11 CORTLAND, NEW YORK 13045
 REPORT 3933 US ROUTE 11 CORTLAND, NEW YORK 13045 FOR THE SCOPE OF ACCREDITATION UNDER NVLAP LAB CODE 100402-0. Project No. G100508854 Date: November 2, 2011 REPORT NO. 100508854CRT-001A TEST OF ONE LED
1 Your computer screen
 U.S.T.H.B / C.E.I.L Unit 7 Computer science L2 (S2) 1 Your computer screen Discuss the following questions. 1 What type of display do you have? 2 What size is the screen? 3 Can you watch TV on your PC
Figure 1. High Efficiency T8 LED Tube. Figure 3. Full View of Light High Efficiency T8 LED Tube
 Figure 1. Figure 2. Lighting the with Enclosure Figure 3. Full View of Light Copyrights 2000-2013, Analog Technologies, Inc. All Rights Reserved. Updated on 1/31/2013. 1 FEATURES Cut electricity bill by
Press Release May 17, SMM Develops New Oxide-based Red Phosphor In Collaboration with Tohoku University Research Team
 Press Release May 17, 2012 Sumitomo Metal Mining Co., Ltd. SMM Develops New Oxide-based Red Phosphor In Collaboration with Tohoku University Research Team Sumitomo Metal Mining Co., Ltd. (SMM), working
CHAPTER 9. Actives Devices: Diodes, Transistors,Tubes
 CHAPTER 9 Actives Devices: Diodes, Transistors,Tubes 1 The electrodes of a semiconductor diode are known as anode and cathode. In a semiconductor diode, electrons flow from cathode to anode. In order for
OPTIMIZED LIGHT-EMITTING DIODE (LED) DEVICES THAT HAVE A HIGH COLOR RENDERING INDEX (CRI) FOR LIGHTING APPLICATIONS
 DEVICES THAT HAVE A HIGH COLOR RENDERING INDEX (CRI) FOR LIGHTING APPLICATIONS") The contents of U.S. Patent Pub. No. 20100001648, entitled LED lighting that has continuous and adjustable color temperature (CT), while maintaining a high CRI, published on January 7, 2010 is based in
The contents of U.S. Patent Pub. No. 20100001648, entitled LED lighting that has continuous and adjustable color temperature (CT), while maintaining a high CRI, published on January 7, 2010 is based in
ENERGY STAR Program Requirements Product Specification for Televisions. Eligibility Criteria Version 5.3
 ENERGY STAR Program Requirements Product Specification for Televisions Eligibility Criteria Version 5.3 Following is the Version 5.3 ENERGY STAR Product Specification for Televisions. A product shall meet
ZipTwo LED - Zipper board with Diffuse Batwing Lens, High Output. IES File Performance Summary
 Adaptive architectural lighting systems IES File Performance Summary The performance data in black text are confirmed through third party testing. See the following Light Laboratory report for details.
These are used for producing a narrow and sharply focus beam of electrons.
 CATHOD RAY TUBE (CRT) A CRT is an electronic tube designed to display electrical data. The basic CRT consists of four major components. 1. Electron Gun 2. Focussing & Accelerating Anodes 3. Horizontal
LED - TYPES. The main types of LEDs are miniature, high power devices and custom designs
 LED - TYPES Types The main types of LEDs are miniature, high power devices and custom designs such as alphanumeric or multi-color. Miniature LEDs These are mostly single-die LEDs used as indicators, and
NVLAP LAB CODE LM Test Report. For. LIGHT EFFICIENT DESIGN (Brand Name:N/A) 188 S. Northwest Highway Cary, IL
 188 S. Northwest Highway Cary, IL") LM-79-08 Test Report For LIGHT EFFICIENT DESIGN (Brand Name:N/A) 188 S. Northwest Highway Cary, IL 60013 LED Lamp Model name(s): LED-8087E40-A LED-8087M40-A Remark : The suffix of the model name E stand
LM-79-08 Test Report For LIGHT EFFICIENT DESIGN (Brand Name:N/A) 188 S. Northwest Highway Cary, IL 60013 LED Lamp Model name(s): LED-8087E40-A LED-8087M40-A Remark : The suffix of the model name E stand
Cree Engineering Services Testing Laboratory (CESTL) Photometric Testing and Evaluation Report
 Photometric Testing and Evaluation Report") NVLAP Lab Code 500077-0 Report Number: Model: PL10259-001A ZR24RK-50L-35K-10V-FD Date: 03/02/2017 Cree Engineering Services Testing Laboratory (CESTL) Photometric Testing and Evaluation Report Prepared
NVLAP Lab Code 500077-0 Report Number: Model: PL10259-001A ZR24RK-50L-35K-10V-FD Date: 03/02/2017 Cree Engineering Services Testing Laboratory (CESTL) Photometric Testing and Evaluation Report Prepared
THE OPERATION OF A CATHODE RAY TUBE
 THE OPERATION OF A CATHODE RAY TUBE OBJECT: To acquaint the student with the operation of a cathode ray tube, and to study the effect of varying potential differences on accelerated electrons. THEORY:
NVLAP LAB CODE LM Test Report. For. LIGHT EFFICIENT DESIGN (Brand Name:N/A) 188 S. Northwest Highway Cary, IL
 188 S. Northwest Highway Cary, IL") LM-79-08 Test Report For LIGHT EFFICIENT DESIGN (Brand Name:N/A) 188 S. Northwest Highway Cary, IL 60013 LED Lamp Model name(s): LED-8087E57C-A LED-8087M57C-A Remark : The suffix of the model name E stand
LM-79-08 Test Report For LIGHT EFFICIENT DESIGN (Brand Name:N/A) 188 S. Northwest Highway Cary, IL 60013 LED Lamp Model name(s): LED-8087E57C-A LED-8087M57C-A Remark : The suffix of the model name E stand
Barco Smart Laser - High performance cinema projection
 DATE AUTHOR 7/12/2017 Goran Stojmenovik Sr. Product Manager Laser Projection goran.stojmenovik@barco.com whitepaper Barco Smart Laser - High performance cinema projection Better image, operational simplicity
Photometric Test Report
 Photometric Test Report Relevant Standards IES LM-79-2008 ANSI C82.77-2002 UL1598-2008 Prepared For Mercury Lighting Stephen Bambush 20 Audrey Pl. Fairfield, NJ 07004-3416 Catalog Number LW3-4-4800-30K-HTA-S50-UNI-XXXX
LM-79 Test Report. Relevant Standards IES LM IES TM CIE Product SKU
 LM-79 Test Report Relevant Standards IES LM-79-28 IES TM-3-215 CIE 13.3-1995 Product SKU MATTONE 2 LED Step Light Fixture DI-MAT2-HL-* *No Faceplate Test Conditions Test Temperature: 24.3 C Luminaire Sample:
Cree Engineering Services Testing Laboratory (CESTL) Photometric Testing and Evaluation Report
 Photometric Testing and Evaluation Report") NVLAP Lab Code 500077-0 Report Number: Model: PL07695-001A OSQ-A-xx-WSN-U-30K-ULxxxxx Date: 4/1/2016 Cree Engineering Services Testing Laboratory (CESTL) Photometric Testing and Evaluation Report Prepared
NVLAP Lab Code 500077-0 Report Number: Model: PL07695-001A OSQ-A-xx-WSN-U-30K-ULxxxxx Date: 4/1/2016 Cree Engineering Services Testing Laboratory (CESTL) Photometric Testing and Evaluation Report Prepared
Challenges in the design of a RGB LED display for indoor applications
 Synthetic Metals 122 (2001) 215±219 Challenges in the design of a RGB LED display for indoor applications Francis Nguyen * Osram Opto Semiconductors, In neon Technologies Corporation, 19000, Homestead
Technical background and design options to raise energy efficiency and reduce the environmental impact of TVs
 Appliances Guide Get super efficient appliances Technical background and design options to raise energy efficiency and reduce the environmental impact of TVs Author Thomas Götz Published 11/2015 bigee.net
Product testing and evaluation to IES LM-79-08
 Product testing and evaluation to IES LM-79-08 PRODUCT DESCRIPTION 2 x 2 recessed LED lensed troffer REQUESTED BY REQUEST NUMBER Brent Harris F11053 EQUIPMENT The Measuring and Test Equipment used for
LM-79 Test Report. Relevant Standards IES LM IES TM CIE Product SKU. INFINILINE X 120V LED Light DI-120V-INFX60
 LM-79 Test Report Relevant Standards IES LM-79-28 IES TM-3-215 CIE 13.3-1995 Product SKU INFINILINE X 12V LED Light DI-12V-INFX6 Test Conditions Test Temperature: 26.5 C Luminaire Sample Length: 12 in.
LM-79 Test Report. Relevant Standards IES LM IES TM CIE Product SKU. INFINILINE X 120V LED Light DI-120V-INFX27
 LM-79 Test Report Relevant Standards IES LM-79-8 IES TM-3-15 CIE 13.3-1995 Product SKU INFINILINE X 1V LED Light DI-1V-INFX27 Test Conditions Test Temperature: 26.5 C Luminaire Sample Length: 12 in. Power
REPORT 3933 US ROUTE 11 CORTLAND, NEW YORK 13045
 REPORT 3933 US ROUTE 11 CORTLAND, NEW YORK 13045 Project No. 3195475 Revision Date: January 11, 2010 REPORT NO. 3195475CRT-001 TEST OF ONE LED HANDRAIL FIXTURE MODEL NO. HANDRAIL DRIVER MODEL NO. SOANAR
NVLAP LAB CODE:
 REPORT NUMBER: RAB01237 PAGE: 1 OF 5 LUMINAIRE: FABRICATED WHITE PAINTED METAL HOUSING, 2 WHITE CIRCUIT BOARDS EACH WITH 120 LEDS, FROSTED HOLOGRAPHIC PLASTIC LENS. LENS FROSTED SIDE UP. LAMP: TWO HUNDRED
CPD LED Course Notes. LED Technology, Lifetime, Efficiency and Comparison
 CPD LED Course Notes LED Technology, Lifetime, Efficiency and Comparison LED SPECIFICATION OVERVIEW Not all LED s are alike During Binning the higher the flux and lower the forward voltage the more efficient
NVLAP LAB CODE:
 REPORT NUMBER: RAB01231 PAGE: 1 OF 5 LUMINAIRE: FABRICATED WHITE PAINTED METAL HOUSING, 2 WHITE CIRCUIT BOARDS EACH WITH 120 LEDS, FROSTED HOLOGRAPHIC PLASTIC DIFFUSER. DIFFUSER FROSTED SIDE UP. LAMP:
Elements of a Television System
 1 Elements of a Television System 1 Elements of a Television System The fundamental aim of a television system is to extend the sense of sight beyond its natural limits, along with the sound associated
Data Sheet. HDSP-573x Seven Segment Displays for High Light Ambient Conditions. Description. Features
 HDSP-x Seven Segment Displays for High Light Ambient Conditions Data Sheet High Efficiency Red: HDSP-900 Series Yellow: HDSP-00/-10/-0/-00 Series Description The HDSP-900 and HDSP-00/-10/-0/-00 are. mm,
Number Eight Lighting Company 803/K2-HI-25-XX/DIM /FS-P-1-WH
 Report No: L101605126 Date: 12/8/2016 8165 E Kaiser Blvd. Anaheim, CA 92808 www.lightlaboratory.com NVLAP LAB CODE 200927-0 Report No: Prepared For: Model Number: Test: L101605126 Number Eight Lighting
THE OPERATION OF A CATHODE RAY TUBE
 THE OPERATION OF A CATHODE RAY TUBE OBJECT: To acquaint the student with the operation of a cathode ray tube, and to study the effect of varying potential differences on accelerated electrons. THEORY:
LMG EG01B - 17"
 LMG256-17EG1B - 17" Introduction Sunlight Readable LCD Module LMG256-17EG1B is a 17" sunlight readable LCD module. The module consists of an AUO G17EG1 V1 TFT color LCD panel and a VHB (very high brightness)
LMT X1 - a 12.1" VHB
 LMT268-121X1 - a 12.1" VHB Introduction LCD with PCAP Touch Screen The LMT268-121X1 is a 12.1" sunlight readable LCD module with a PCap touch screen. The LCD resolution is 1,024 x 768 (XGA). The module
Number Eight Lighting Company 526 Portal Street, Cotati, CA 94931
 Report No: L101605125 Date: 12/8/2016 8165 E Kaiser Blvd. Anaheim, CA 92808 www.lightlaboratory.com NVLAP LAB CODE 200927-0 Report No: L101605125 Report Prepared For: Number Eight Lighting Company 526
VARIOUS DISPLAY TECHNOLOGIESS
 VARIOUS DISPLAY TECHNOLOGIESS Mr. Virat C. Gandhi 1 1 Computer Department, C. U. Shah Technical Institute of Diploma Studies Abstract A lot has been invented from the past till now in regards with the
Advanced Display Technology (continued) Lecture 13 October 4, 2016 Imaging in the Electronic Age Donald P. Greenberg
 Lecture 13 October 4, 2016 Imaging in the Electronic Age Donald P. Greenberg") Advanced Display Technology (continued) Lecture 13 October 4, 2016 Imaging in the Electronic Age Donald P. Greenberg Cost of HDTV Displays Price $ Plasma Projection TV s LCD s Diagonal Inches Cost of HDTV
Advanced Display Technology (continued) Lecture 13 October 4, 2016 Imaging in the Electronic Age Donald P. Greenberg Cost of HDTV Displays Price $ Plasma Projection TV s LCD s Diagonal Inches Cost of HDTV
BRIGHT BRIGHTER BRIGHTEST ONE ILLUMINATOR DESIGN THREE LIGHT SOURCES. featuring the EvenVue Reflector System
 BRIGHT BRIGHTER BRIGHTEST ONE ILLUMINATOR DESIGN THREE LIGHT SOURCES featuring the EvenVue Reflector System DVC (DIAGNOSTIC VIEWING CENTER) The features and benefits of the TECHLINE can be combined with
Don t let Potential Customers pass you by!
 Don t let Potential Customers pass you by! Your colorful and vibrant messages will make you stand out and get noticed. LED lighting technology is the most energy efficient and our simple and reliable designs
Introduction. Characteristics (Note 1, 2) Parameters Typical Value Units Conditions
 Parameters Typical Value Units Conditions") LMG259A-121X1-12.1" Introduction VHB LCD Module with LED Backlight The LMG259A-121X1 is a 12.1" sunlight readable LCD module. The module consists of a ChiMei G121X1-L3 TFT color LCD panel and a VHB (very
LMG259A-121X1-12.1" Introduction VHB LCD Module with LED Backlight The LMG259A-121X1 is a 12.1" sunlight readable LCD module. The module consists of a ChiMei G121X1-L3 TFT color LCD panel and a VHB (very
Pauluhn Apex. Linear, high bay LED luminaires designed for harsh & heavy industrial applications
 Harsh & heavy industrial lighting Pauluhn linear LED luminaires Pauluhn Linear, high bay LED luminaires designed for harsh & heavy industrial applications Pauluhn Safe. Reliable. Efficient. Featuring the
Tech Paper. HMI Display Readability During Sinusoidal Vibration
 Tech Paper HMI Display Readability During Sinusoidal Vibration HMI Display Readability During Sinusoidal Vibration Abhilash Marthi Somashankar, Paul Weindorf Visteon Corporation, Michigan, USA James Krier,
LED Display Backlighting Monitor Applications using 6-lead MULTILED Application Note
 LED Display Backlighting Monitor Applications using 6-lead MULTILED Application Note Abstract This application note describes two reference designs for LCD backlighting using the 6-lead MULTILED LRTB G6SG.
Comparison of SONY ILX511B CCD and Hamamatsu S10420 BT-CCD for VIS Spectroscopy
 Comparison of SONY ILX511B CCD and Hamamatsu S10420 BT-CCD for VIS Spectroscopy Technical Note Thomas Rasmussen VP Business Development, Sales, and Marketing Publication Version: March 16 th, 2013-1 -
Overview of All Pixel Circuits for Active Matrix Organic Light Emitting Diode (AMOLED)
") Chapter 2 Overview of All Pixel Circuits for Active Matrix Organic Light Emitting Diode (AMOLED) ---------------------------------------------------------------------------------------------------------------
Chapter 2 Overview of All Pixel Circuits for Active Matrix Organic Light Emitting Diode (AMOLED) ---------------------------------------------------------------------------------------------------------------
STATE OF OHIO DEPARTMENT OF TRANSPORTATION SUPPLEMENTAL SPECIFICATION 872 LIGHT EMITTING DIODE TRAFFIC SIGNAL LAMP UNITS JULY 19, 2002
 STATE OF OHIO DEPARTMENT OF TRANSPORTATION SUPPLEMENTAL SPECIFICATION 872 LIGHT EMITTING DIODE TRAFFIC SIGNAL LAMP UNITS JULY 19, 02 872.01 Description 872.02 Prequalification 872.03 Material Requirements
NVLAP LAB CODE LM Test Report. For CE INNOVATIONS LTD. (Brand Name: IRICO) 911 Denison St Markham, ON L3R 3K4 Canada
 911 Denison St Markham, ON L3R 3K4 Canada") LM-79-08 Test Report For CE INNOVATIONS LTD (Brand Name: IRICO) 911 Denison St Markham, ON L3R 3K4 Canada 2x4 Luminaires for Ambient Lighting of Interior Commercial Spaces Model name(s): IR-P7-50W2B45500LM
LM-79-08 Test Report For CE INNOVATIONS LTD (Brand Name: IRICO) 911 Denison St Markham, ON L3R 3K4 Canada 2x4 Luminaires for Ambient Lighting of Interior Commercial Spaces Model name(s): IR-P7-50W2B45500LM
REPORT 3933 US ROUTE 11, CORTLAND, NEW YORK 13045
 REPORT 3933 US ROUTE 11, CORTLAND, NEW YORK 1345 FOR THE SCOPE OF. ACCREDITATION UNDER NVLAP LAB CODE 142-.. Project No. G11346762 REPORT NO. 11346762CRT-1 TEST OF ONE LED AREA LIGHT MODEL NO. GC228LEDGV133W
Joint Development of Ultra-Bright, Inorganic EL Light-Emitting Materials. November 2, 2005 KURARAY CO., LTD.
 Joint Development of Ultra-Bright, Inorganic EL Light-Emitting Materials November 2, 2005 KURARAY CO., LTD. Sales Trends of Display-related Products (Kuraray (standalone)) FY1994 FY1999 FY2004 Sales Ratio
The Knowledge Bank at The Ohio State University. Ohio State Engineer
 The Knowledge Bank at The Ohio State University Ohio State Engineer Title: Creators: Principles of Electron Tubes Lamoreaux, Yvonne Issue Date: 1944-03 Publisher: Ohio State University, College of Engineering
GORDON WATSON and ASSOCIATES
 KONDWERA TECHNICAL SERVICES PTY LTD TRADING AS GORDON WATSON and ASSOCIATES ELECTRICAL 29 CURRAWONG AVENUE LIGHTING NORMANHURST DESIGN NSW 2076 ACN 002 105 268 TEL 02 9487 2119 ABN 83 002 105 268 Mob 0412
Types of CRT Display Devices. DVST-Direct View Storage Tube
 Examples of Computer Graphics Devices: CRT, EGA(Enhanced Graphic Adapter)/CGA/VGA/SVGA monitors, plotters, data matrix, laser printers, Films, flat panel devices, Video Digitizers, scanners, LCD Panels,
LED Floodlight RoHS. Model: inner box: L273*W240*H165mm master carton: L549*W485*H175mm 4PCS
 71346 LED Floodlight RoHS OVERALL LAMP PARAMETERS LED DRIVER LED Model: Input Voltage Input Current Input Power Power Factor Luminance Luminous Efficiency CRI Beam Angle Main Structure Output Voltage Output
LM-79 Test Report. Relevant Standards IES LM IES TM CIE Product SKU
 LM-79 Test Report Relevant Standards IES LM-79-8 IES TM-3-15 CIE 13.3-1995 Product SKU EMERY BEAM Wet Location Linkable LED Batten - DI-EB35-48L-W48-1V Test Conditions Test Temperature: 26.5 C Luminaire
LM-79 Test Report. Relevant Standards IES LM IES TM CIE Product SKU
 LM-79 Test Report Relevant Standards IES LM-79-2008 IES TM-30-2015 CIE 13.3-1995 Product SKU EMERY BEAM Wet Location Linkable LED Batten - DI-EB40-48L-W48-10V Test Conditions Test Temperature: 26.5 C Luminaire
Light Emitting Diodes (LEDs)
") Light Emitting Diodes (LEDs) Example: Circuit symbol: Function LEDs emit light when an electric current passes through them. Connecting and soldering LEDs must be connected the correct way round, the diagram
Light Emitting Diodes (LEDs) Example: Circuit symbol: Function LEDs emit light when an electric current passes through them. Connecting and soldering LEDs must be connected the correct way round, the diagram
Based LEDs for Transit Model Boards
 Based LEDs for Transit Model Boards Based LE Ds SELECTOR GUIDE With the technological advancements in Light Emitting Diodes (LEDs) brightness can now rival the incandescent lamp when used in similar packages.
NVLAP LAB CODE LM Test Report. For DONGGUAN THAILIGHT SEMICONDCTOR LIGHTING CO.,LTD
 LM-79-08 Test Report For DONGGUAN THAILIGHT SEMICONDCTOR LIGHTING CO.,LTD (Brand Name: THAILIGHT) Sanhui Ind. Area, Cunwei, Hengli, Dongguan, China. Architectural Flood and Spot Luminaires Model name(s):
Osram Sylvania 200 Ballardvale Street Wilmington, Mass
 Report No: L011506002 Date: 1/26/2015 8165 E Kaiser Blvd. Anaheim, CA 92808 p. 714.282.2270 f. 714.676.5558 NVLAP LAB CODE 200927-0 Report No: L011506002 Report Prepared For: Osram Sylvania 200 Ballardvale
LUNERA SERIES L7 _ GEN 3
 Continuous Run Linear Direct / Indirect LED Luminairies Description The Lunera SERIES L7-G3 is a third generation family of linear LED luminaires for continuous run applications. The elegant, slim fixtures
The use of remote phosphor technology in EVE-L series LED lighting fixtures with method of protection II 2GD Ex de IIC T6 Gb / Ex tb IIIC T85 Db IP66
 February 2015 The use of remote phosphor technology in EVE-L series LED lighting fixtures with method of protection II 2GD Ex de IIC T6 Gb / Ex tb IIIC T85 Db IP66 The amount of energy resources has decreased
Controlling LEDs. why various control types are needed the existing methodologies used to control LEDs. Technical white paper January 2011
 Controlling LEDs why various control types are needed the existing methodologies used to control LEDs Technical white paper January 2011 Amanda Beebe Ethan Biery Table of contents 1 Controlling LEDs 1.1
REPORT 3933 US ROUTE 11 CORTLAND, NEW YORK 13045
 REPORT 3933 US ROUTE 11 CORTLAND, NEW YORK 13045 FOR THE SCOPE OF ACCREDITATION UNDER NVLAP LAB CODE 100402-0. Project No. G100896445 Date: September 26, 2012 REPORT NO. 100896445CRT-002 TEST OF ONE LED
Revolution Lighting Technologies (RVLT) 2280 Ward Ave. Docks 5&6, Simi Valley, CA 93065
 2280 Ward Ave. Docks 5&6, Simi Valley, CA 93065") Report No: L051704002 8165 E Kaiser Blvd. Anaheim, CA 92808 www.lightlaboratory.com Report No: L051704002 Issue Date: 5/16/2017 Report Prepared For: Revolution Lighting Technologies (RVLT) 2280 Ward Ave.
Report No: L051704002 8165 E Kaiser Blvd. Anaheim, CA 92808 www.lightlaboratory.com Report No: L051704002 Issue Date: 5/16/2017 Report Prepared For: Revolution Lighting Technologies (RVLT) 2280 Ward Ave.
Power wasted without doing anything useful
 Vampire Power What is it? Electricity sucked by your appliances and electronics when not being used (even when turned off!) Power wasted without doing anything useful aka: Phantom Power Standby Power Parasite
NVLAP LAB CODE LM Test Report. For LED PANEL LIGHTING CO.,LTD. (Brand Name: N/A)
") LM-79-08 Test Report For LED PANEL LIGHTING CO.,LTD. (Brand Name: N/A) 7 F,Jinchangda Industrial Park,zhangkengjing,GuanLan, Baoao,Shenzhen,Guangdong,China 2x4 Luminaires for Ambient Lighting of Interior
LM-79-08 Test Report For LED PANEL LIGHTING CO.,LTD. (Brand Name: N/A) 7 F,Jinchangda Industrial Park,zhangkengjing,GuanLan, Baoao,Shenzhen,Guangdong,China 2x4 Luminaires for Ambient Lighting of Interior
Attachment N - General Specifications for LED Luminaires. General Specifications for Solid State Lighting LED Roadway Luminaires
 Attachment N - General Specifications for LED Luminaires General Specifications for Solid State Lighting LED Roadway Luminaires Design Lighting Consortium (DLC) Approved Correlated Color Temperature (CCT)
Features. Applications
 ASMT-SWBM-Nxxxx Surface Mount LED Indicator Data Sheet Description The Long-Life White PLCC-4 SMT LEDs is the latest extension to our White PLCC-4 packages where besides having higher flux output, the
Surelight. EL Parallel Panels
 Surelight EL Parallel Panels 1 Surelight EL Parallel Panels Electroluminescent technology is the paper thin, enticing light source that is revolutionising the way businesses market their branded message
An Introduction to TrueSource
 An Introduction to TrueSource 2010, Prism Projection Inc. The Problems With the growing popularity of high intensity LED luminaires, the inherent problems with LEDs have become a real life concern for
Programmable Micro Remote LED Controller for RGB LED Strips - 12 or 24 VDC Part number: PMRC
 11235 West Bernardo Court, Suite 102 San Diego, CA 92127 888-880-1880 Fax: 707-281-0567 EnvironmentalLights.com Programmable Micro Remote LED Controller for RGB LED Strips - 12 or 24 VDC Part number: PMRC
Look on the Bright Side. LED Retrofits by Hillphoenix.
 Look on the Bright Side LED Retrofits by Hillphoenix. Short of installing all new cases, a retrofit to upgrade case lighting from fluorescents to LEDs is the most efficient and economical way to create
REPORT 3933 US ROUTE 11 CORTLAND, NEW YORK Project No. G Date: October 29, 2010 REPORT NO CRT-001 TEST OF ONE LED DESK LAMP
 REPORT 3933 US ROUTE 11 CORTLAND, NEW YORK 13045 Project No. G100225920 Date: October 29, 2010 REPORT NO. 100225920CRT-001 TEST OF ONE LED DESK LAMP FIXTURE MODEL NO. ADAPTER MODEL NO. JY15-240-050-UD
Samsung LED technology A cost-effective, eco-friendly alternative to conventional LCD technology
 Samsung LED technology A cost-effective, eco-friendly alternative to conventional LCD technology Contents Introduction 3 Samsung LED screens outperform CCFL screens in picture quality and reliability 3