Peak Performer 1 FID (920- Series) User Manual
|
|
|
- Lesley Hill
- 5 years ago
- Views:
Transcription
 User Manual Peak Laboratories, LLC www.peaklaboratories.com 650-691-1267 Version 5.")
1 Peak Performer 1 FID (920- Series) User Manual Peak Laboratories, LLC Version 5.1 6/18/14 Page#1
2 Forward This manual is a reference guide for the operation of the Peak Performer 1 series of gas analyzers. The Peak Performer 1 should only be operated by trained personnel familiar with the safe operating procedures of the analyzer. The following cautions should always be considered: High voltages are required for proper detector operation and are present when the unit is energized. High operating temperatures are required for proper detector and chromatographic operation. Hot surfaces may be present when the unit is energized Illustrations and photographs contained herein are for example only. Actual configurations may vary depending on specific application and installed options. Improper installation, operation or service of the analyzer can cause permanent damage to the instrument. The analyzer is designed to be operated with all covers installed, connected to a properly grounded 3 conductor AC line source. In event of fire, Class A, B, or C fire extinguishers can be used. The Peak Performer 1 must have standard electrical power and applicable gas supply pressures as noted on the test documentation for proper operation. Permanent damage and voiding of the warranty may result. Operators should not attempt to repair the instrument except under directed to do so by factory trained service technicians. Permanent damage and voiding of the warranty may result of improper operation. The FID utilizes low flows of pure hydrogen and clean air to generate a small continuously burning flame within the FID Tower. Use standard gas handling practices for combustible gases when working with the FID equipped PP H2 venting, H2 shut-off valve and H2 supply safety equipment must be supplied by customer. Page#2
3 Glossary and Terms FID Methanizer HSD Molecular Sieve Unibeads Gas Purity Gas Response Factor Name PkCen LW RW PkWin PkHgt Flame Ionization Detector Ruthenium Oxide Catalyst HayeSep D column packing material Zeolite column packing material Silica column packing material Amount of undesired elements in a gas supply Span Gas supply with known, certified amounts of specific compounds Proportionality factor between area count units and concentration units Peak identification tag Expected peak retention time (in seconds) Typical time span measured from the start of the peak s baseline rise to the peak apex PkCen (in seconds) Typical time span measured from the peak s apex PkCen to the end of the peak s baseline decline (in seconds) Total tolerance window (in seconds) for assignment of a Name to a quantified chromatographic peak. The tolerance window is centered upon the PkCen value Variable for establishing the cross-over point in peak detection modes. Chromatographic peaks higher than this parameter will be quantified using the Variable mode heights, peaks with height less than or equal to PkHgt will be quantified using the ForceB mode. Flt Convolution filter value expressing the overall peak shape. Flt = 2 is recommended for sharp, narrow peaks such as H2, and Flt = 8 is recommended for broad peaks such as CO. VICI Valco Instruments Company, Inc. ( Page#3
4 Table of Contents 1.0 Introduction Installation Considerations Unpacking Instructions General Considerations Electrical Connections Rack Mount Specifications Gas Supplies and Connections Carrier Gas Supply Carrier Gas Purity Carrier Gas Purity Requirements Carrier Gas Connection FID Hydrogen Gas Supply FID Hydrogen Gas Generators FID Hydrogen Gas Cylinders FID Zero Air Gas Supply Actuator Gas Supply Sample Gas Supply External Calibration Gas Supply Second Sample Supply Calibration Gas Connection for Analyzer with Internal Blender Span Gas Supply (For Internal Span Gas Blender) Standard Start-up Procedure Quick Start Sequence Column Conditioning Detector Conditioning Igniting the FID Flame Sample Analysis Calibration Establishing New Instrument Response Factors Shutdown and Transport Peak Performer 1 Operator Interface Set-up Screen Set-up Screen Upper Section Set-up Screen Upper Section Button Functions Set-up Screen Middle Section (Power-up) Set-up Screen Middle Section Button Functions (Power-up) Set-up Screen Middle Section (Normal) Set-up Screen Middle Section Button Functions (Normal) Set-up Screen Lower Section Error Messages on the Set-up Screen Lower Section Clearing Error Messages on the Set-up Screen Set-up Screen Lower Section Button Functions Analog Interface (Trend and Recorder Output) Screen Analog Interface Screen Button Function 32 Page#4
5 Analog Interface Connections Analog Interface Wiring Breakdown Calibration Database Screen Calibration Screen Button Functions Calibration Establishing New instrument Response Factors Analysis Database Screen Analysis Database Parameters Analysis Screen Button Function Event Program Editor Screen Event Program Commands Event Editor Screen Button Function Stream Selector Sequence Editor Screen (Optional) Stream Selector Commands Stream Selector Program Editor Screen Button Function Run / Chromatogram Screen Run Screen Button Functions Continuous Monitoring Analysis Manual Screen (Sub-Screen of Run Screen) Manual Screen Button Functions Display Screen (Sub-screen of Run Screen) Display Screen Button Functions Peak View Software System Requirements Installing the Viewer Software Starting the Viewer Software COM1 / COM2 Port and Cable Wiring Viewer Software Window File Menu on the Viewer Taskbar Communication Setting Window Viewer Line Details Window Start Menu on the Viewer Taskbar Stop Command on the Viewer Taskbar Chrom View Window and Chromatogram Viewer Window Chromatogram Files File Menu on the Chrom Viewer Taskbar Viewer Menu on the Chrom Viewer Taskbar Communication Port Protocols and Data Formats COM1 / COM2 Port and Cable Wiring Port 1 Protocol COM 1 Port Settings Peak View Output (Columns format in.csv file) Detector Output External Start Command String Detector Signal Data String Port 2 Protocol COM 2 Settings COM 2 Port PLC Output Format Modbus Protocol and Register Map for Peak Devices Mode of Transmission Modbus Packet Structure Packet Communications 58 Page#5
6 Modbus Data Format Broadcast Packets Trend / Analog Outputs Setting up a RS485 Network RS232 to RS485 Converters Chromatographic Principles Sample Injection Carrier Gas Purification Component Separation Venting and Flow Balancing Effects of Temperature and Flow on Analytical Columns Peak Identification and Quantification Peak Quantification : Baseline Mode Peak Quantification : Fixed Width Mode Peak Quantification : Variable Mode Chromatographic Stabilization of the Analyzer When Injecting 84 O2 Samples 8.0 Flame Ionization Detector (FID) Flame Ionization Detector Principles Temperature Effects Within the Methanizer and FID Tower Detector Flow Rate Effects Resolving Random Spikes on the FID Baseline Restriction of Water Flow Out of the FID Drain Line Moisture Trapped Within the FID Tower Analyzer and FID Maintenance and Service Procedures Peak Performer 1 System Block Diagram Monitor Regulator Pressures Verifying Valve Integrity (Carrier Blank, Zero Gas) Start-up Sequence for Replacement Methanizer Adjusting the Display Contrast Altering the Analytical Range of the Instrument Testing the Heater Resistance Main DC Power Supply Replacement Adjusting the 5 Volt DC Power Supply COM 1 (Viewer) Connections on Multiple Analyzers to a 109 Single Computer Page#6
 FID gas analyzer is a trace level gas analysis system capable of detecting part per trillion (ppt) concentrations of Hydrocarbons gases in")
7 Introduction The Peak Laboratories Peak Performer 1 (PP1) FID gas analyzer is a trace level gas analysis system capable of detecting part per trillion (ppt) concentrations of Hydrocarbons gases in a variety of sample matrices. Due to the specific nature of the detection method, analysis times are rapid and chromatographic complexity is minimized. The result is a simple and reliable system capable of following rapid trends in component concentration in laboratory, field, and process gas applications. The Peak Performer 1 has a fully integrated, stand-alone microprocessor operating system. Key functions of the operating systems include detector and temperature control, data collection and analysis, and operator / data interface Sampling hardware 4, 6, and 10 port VICI valves Column oven Covered Type Isothermal, Mandrel Heating Capacity Single or Multiple 1/8 Columns Temperature range (Ambient) 50 C > 295 C Temperature accuracy Power required ± 0.5 C 160 watts maximum Page#7

8 Installation Considerations 2.1 Unpacking Instructions: Remove the Peak Performer 1 from the packing material or traveling case, taking care to not scar the exterior surfaces of the analyzer. Set the analyzer on a firm, even surface and remove the protective plastic wrap. Each analyzer ships with adequate supplies for installation. Be certain to remove the installation accessories (tubing, power cord, compression fittings, etc.) from the packing materials. Remove the sleeve containing the Certificate of Conformity and Installation CD from the analyzer top panel. All shipping materials are reusable, please recycle these materials appropriately. 2.2 General Considerations Analyzer size is 26 L x 17 W x 7 H Maximum operating environment for the PP1 analyzer is 30 C Minimum operating environment for the PP1 analyzer is 15 C Power consumption is 160 watts maximum. Fuse size is VAC, 5 x 20 mm SLO-BLO Free air flow for adequate ventilation to the rear of the unit is required. Communication between the PP1 and your PC is via 9-pin straight through cable connection to COM 1 and COM 2. Analog outputs are available from the DIN screw terminal strips on the rear panel The FID drain line must be ¼ inside diameter minimum and without restrictions its entire length. 2.3 Electrical Connections Verify the correct operating voltage as marked on the rear of the analyzer at the main power switch. Attach a standard power cable to the rear of the instrument (see Figure 1) and connect to an appropriately grounded outlet Power Cord PP1 Power Entry Figure 1. AC Power Connection Details Page#8
9 The PP1 has been CE certified to be immune to AC frequency and voltage variances of +/- 10% of the nominal AC operating voltage. Refer to the final test report and/or markings on the rear of analyzers to verify the proper operating voltage for each unit. For best stability, power to the analyzer should originate from an electrical circuit free of large inductive or other current loads. Be sure to mount the analyzer in an area of adequate ventilation and make sure the cooling fan inlet is unobstructed. There are no battery back-ups or reserve power supplies built into the PP1, therefore any disruption of the AC supply will result in restarting of the analyzer. Peak Labs recommends the installation of a high quality on-line or double conversion type of uninterruptible power supply (UPS). Be sure to mount the analyzer in an area of adequate ventilation and make sure the cooling fan inlet is unobstructed. The operating environment for the PP1 analyzer should be maintained between 15 C and 30 C. 2.4 Rack Mount Specifications The PP1 is designed for mounting in a standard 19 instrument rack. The analyzer occupies 4U (6.9 ) of panel height, 26 in depth. Rack retaining flanges provided with the Peak rack mount kit attach via the analyzer top cover to provide secure connection to the instrument rack rails. Peak recommends use of high quality 26 full extension ball bearing slides for instrument mounting, such as Jonathan QD or equivalent. Page#9 Figure 2. Rack Mount Front View with Dimensions
10 Figure 3. Rack Mount Rear View with Dimensions Figure 4. Rack Mount Top View with Dimensions Page#10

11 Gas Supplies and Connections All plumbing connections are 1/16 female VICI bulkhead fittings. The Peak Performer 1 is shipped with tubing and fittings required to connect the analyzer to gas sources. Replacement materials are available from Peak Laboratories, or may be purchased directly. a) Standard gas fittings are 1/16 VICI compression fittings (VICI P/N ZN1 & ZF1) b) Supply tubing is 1/16 O.D x 0.03 I.D, cleaned and baked T300 stainless steel tubing Figure 5. Rear View of PP1 FID Page#11
 ** CAUTION**: Oxygen is never a suitable carrier or actuator supply gas.")
12 Figure 6. FID PP1 Gas Supply Schematic Carrier Gas Supply The instrument will accept a variety of carrier gases: N 2, Ar or He. ( See Section ) ** CAUTION**: Oxygen is never a suitable carrier or actuator supply gas. Oxygen is highly reactive, and many pneumatic components contain greases and oils that combust spontaneously when exposed to oxygen. Consult the test data shipped with the analyzer (in CD format) for carrier gas details specific for your analyzer. Commonly, the PP1 will utilize highly purified nitrogen as the carrier gas supply, and nitrogen is considered the best multi-purpose carrier gas. However, the best carrier to use approximates the sample matrix (i.e. nitrogen carrier for analysis of impurities in nitrogen). Matching the carrier gas to the sample will prevent upsets caused by the elution of high concentration sample balance peaks. For optimum performance, the carrier gas must match the balance gas of your analytical sample, although other carrier gases can be used for specific applications with factory assistance. PLEASE CONSULT THE TEST DATA ATTACHED TO YOUR ANALYZER IF UNCERTAINTY OF CARRIER GAS SELECTION EXISTS. Page#12
13 Carrier Gas Purity Chromatographic instrument detection limit is directly related to carrier gas purity. Improved carrier gas purity enables improved sensitivity. Typical Nitrogen 5N Gas Specifications (Pre-Purification) Source Gas Type THC Concentration CO, CO 2 Concentration O 2 Concentration H 2, H 2O Concentration High Pressure Cylinder or Liquid Dewar N 2 (Ar, He alternative) < 1 ppm < 3 ppm < 3 ppm < 3 ppm Consequently, the analyzer s minimum detectable quantity (MDQ) would be quite high (> 10 ppm) unless the carrier gas is purified. Peak recommends use of the best quality heated metal getter purifier available for carrier gas purification. This style of purifier typically has a hot catalyst element ahead of the heated getter material for complete removal of methane hydrocarbon (CH 4), a common contaminant in commercial nitrogen sources. Hydrogen, Carbon Monoxide, Carbon Dioxide, Hydrocarbons and Moisture carrier gas impurities are reduced to less than 10 ppt by this type of purifier. Typical Heated Metallic Getter Purifier Specifications Type Maximum Flow rate Gases Purified THC Concentration (outlet) CO, CO 2 Concentration (outlet) H 2, H 2O Concentration (outlet) Expected Life Heated Reactive Metal Getter >300 cc/min, < 5 L/min N 2 (Ar, He alternative) < 1ppb < 1ppb < 1ppb Consult Manufacturer Page#13
14 Carrier Gas Purity Requirements Gas Supply Gas Purity Nominal Pressure Typical Flow Carrier Nitrogen, Argon or Helium < 1 ppb total contaminants 60 psig 150 sccm Fuel Combustion Gas UHP Grade Hydrogen Medical Grade Air < 10 ppb THC < 1 ppm H2O 25 psig 35 sccm < 10 ppm CH4 20 psig 200 sccm Actuator Clean, Dry Air or better < 10 ppm H2O 70 psig 80 sccm Heated reactive metal getters are the only proven reliable technique for generating the specified carrier gas purification. Cold metallic getters and absorption getters do not reliably remove all common critical bulk gas contaminants Carrier Gas Connection The PP1 carrier gas connection utilizes a 1/16 female VICI bulkhead labeled CARRIER IN on the front or rear panel. 1) Connect purified N2 carrier gas supply gas (Ar, He alternative) to the carrier bulkhead and set the source regulator to the settings shown in final test data. 2) There are no internal regulators in the standard FID PP1 all gas pressures are controlled by external regulators (customer supplied). 3) Verify detector flow with a flow meter to roughly match the settings in the final test data 4) Verify the BYPASS OUT port is flowing approximately sccm. Carrier flow within the analyzer is split with a portion of the flow passing through a gas sampling valve, the other portion passes through a restrictor tube terminating at the location of the BYPASS OUT port. Under normal operating conditions the BYPASS OUT port is plugged. During column reconditioning, the plug may be removed and the SAMPLE IN switched to the bypass flow. In this manner, column reconditioning may be performed without requiring a shutdown of the sample gas flow, avoiding the lengthy re-equilibration period. Page#14
15 2.5.2 FID Hydrogen (H 2 ) Gas Supply H 2 venting, H 2 shut-off valve and H 2 supply safety equipment must be supplied by customer. The analyzer provides a NORMALLY OPEN switch contact for H 2 safety purposes. The analyzer will close the switch contact (CLOSED position) temporarily for 120 seconds any time the IGNITE command in invoked. If the FID Flame temperature is greater than the set point value, the switch contact will remain closed. Any time the FID Flame temperature is less than the set point value, the switch contact will revert to the NORMALLY OPEN position automatically (see Section 4.7.3) Combustion fuel must be supplied to the Flame Ionization Detector. The PP1 FID H 2 gas connection utilizes a 1/16 female VICI bulkhead labeled FID H 2 on the rear panel. 1) Connect the Hydrogen gas supply to the bulkhead and set the source regulator to approximately 25 psig. 2) There are no internal regulators in the standard FID PP1 all gas pressures are controlled by external regulators (customer supplied), FID Hydrogen Gas Specifications Source Gas Type Maximum Flow rate THC Concentration CO Concentration CO 2 Concentration H 2 O Concentration High Pressure Cylinder or Hydrogen Generator Hydrogen < 60 cc/min < 10 ppm < 10 ppm < 10 ppm < 100 ppm ** CAUTION** : High moisture content in the FID H 2 gas supply has been shown to irreversibly damage the methanizers ruthenium catalyst. Page#15
16 FID H 2 Gas Generators Peak recommends only the use of Palladium Transfer Tube or Regenerative Drying Hydrogen Generators. Hydrogen produced by electrolytic decomposition of water is extremely humid, at nearly 100% relative humidity. H 2 generators using only single stage gas H 2 dryers (molecular sieves) will saturate with moisture within a week or two of normal use, and therefore require frequent manual exchange and regeneration to maintain acceptable H 2 gas quality FID H 2 Gas Cylinders Cylinder sources suitable for use as FID H 2 include UHP and Zero Quality grades. Gas Supply Gas Purity Nominal Pressure Typical Flow Fuel UHP Grade Hydrogen < 10 ppb THC < 10 ppm H2O 25 psig 35 sccm FID Zero Air Gas Supply Oxygen-bearing gas must be supplied to the Flame Ionization Detector for combustion support. The PP1 FID Air gas connection utilizes a 1/16 female VICI bulkhead labeled FID AIR on the rear panel. FID Zero Air Gas Specifications Source High Pressure Cylinder or Zero Air Generator Gas Type 79%N 2, 21%O 2 Maximum Flow rate THC Concentration CO Concentration CO 2 Concentration H 2, H 2O Concentration < 500 cc/min < 10 ppm < 10 ppm < 1000 ppm < 100 ppm Page#16
17 Synthetic air sources suitable for use as FID Air include Zero and Breathing Quality grades. ** CAUTION**: Compressed room air is not recommended 1) Connect the Zero Air gas supply to the bulkhead and set the source regulator to approximately 20 psig. 2) There are no internal regulators in the standard FID PP1 all gas pressures are controlled by external regulators (customer supplied), Actuator Gas Supply The actuator supply is attached at the rear panel of the instrument. Attach the air or inert gas actuator supply to ACTUATOR IN port on the rear panel. Preset the source to psig. Gas Supply Gas Purity Nominal Pressure Typical Flow Actuator Clean, Dry Air or better < 10 ppm H 2 O 70 psig 100 sccm Sample Gas Supply Sample lines are normally attached to the rear panel of the instrument. Attach sample or span gas lines to the SAMPLE IN port on the rear panel. The SAMPLE OUT port must be unrestricted. Sample gas must be supplied to the analyzer at low pressure (0.3 to 1.0 psig) and moderate flow (30 to 120 ml/min). The analyzer does not have any sample gas pressure / flow regulation equipment. Higher sample pressures can be used if a fixed restrictor is set and calibrated to the incoming pressure. Please contact the factory for sample handling instructions if these input conditions are not available. SAMPLE GAS SUPPLY Figure 7. Sample Supply Flow Schematic Page#17
18 External Calibration Gas Supply Certified calibration standards must be connected periodically to the PP1 for verification of analyzer response. When using a mobile calibration gas source such as high pressure cylinder, the plumbing arrangement shown in figure 7 is recommended. The calibration source can be connected to the SAMPLE IN port on the analyzer front panel, or alternatively, make sure the front panel jumper between SAMPLE OUT and SAMPLE IN is installed and connect the calibration source to the rear panel SAMPLE IN port. The SAMPLE OUT port must be unrestricted when using either method Second Sample Gas Supply Peak Labs offers an optional second sample inlet stream for most analyzers. Connection to the SAMPLE 1 IN and SAMPLE 2 IN ports should replicate Figure 7.Sample lines are normally attached to the rear panel of the instrument. Attach sample or span gas lines to the SAMPLE IN ports on the rear panel. The SAMPLE OUT ports must be unrestricted Calibration Gas Connection for Analyzers Equipped with the Optional Internal Span Gas Blender. Peak Labs offers an optional internal span gas blender for most analyzers. Connection to the SPAN GAS IN port should replicate Figure 8. Nominal inlet span gas pressure is 50 psig and flow through the internal blender is preset within the analyzer. External restrictors are not required. It is important to measure the pressure applied to the SPAN GAS IN port as closely to the analyzer rear panel as possible Span Gas Supply (Optional: For internal span gas blender units only) Peak Labs offers an optional internal span gas blender for most analyzers. Connection to the SPAN GAS IN port should replicate Figure 8. It is important to measure the pressure applied to the SPAN GAS IN port as closely to the analyzer rear panel as possible. Nominal inlet span gas pressure is 50 psig and flow is restricted inside the analyzer. External restrictors are not required for these units Figure 8. Span Gas Supply Flow Schematic Page#18

19 3.0 Start-up Procedure Peak Labs recommends that the user read the entire operating manual prior to using the Quick Start sequence. ** CAUTION** Do not begin detector heating without carrier gas flow. Damage to the detector may result. 3.1 Quick Start Sequence 1. Confirm that all gas connections and supplies are properly made. 2. Remove the top cover of the instrument. Page#19 Figure 9. FID Detector 3. Pressurize the carrier gas supply line to 60 psig. 4. Pressurize the FID H2 gas supply to 25 psig. 5. Pressurize the FID Air gas supply to 20 psig. 6. Pressurize the Actuator gas supply to 65 psig 7. Verify that sample is flowing freely through loop - exit flow from the rear SAMPLE OUT port should be 20 to 120 cc/min. 8. Verify BYPASS OUT flow > 20 cc/minute. 9. Verify the analyzer is connected to the correct line voltage supply. 10. Energize the main power switch (located to the right of the power cable, see Figure 1). 11. After energizing, the instrument will display the MAIN screen in the IDLE state.
20 12. Set Date and Time. 13. Press command three times to position the cursor in the middle 1/3 of the screen. 14. Press the HEAT command once to activate heater zones. 15. Allow the 4 6 hours for the analyzer to thoroughly stabilize the heated zones. After temperature stabilization: 16. Verify that the FID FLAME reading is greater than 90 º C. 17. If the analyzer has been stored or idle without carrier gas flow for more than a few days, consider column conditioning as described in Section Press the PAGE command 4 times to reach the RUN SCREEN. 19. Press the MANUAL command once. 20. Press the IGNITE command once, wait 30 seconds and press the IGNITE command again. 21. Press the ESC command once. 22. Press the PAGE command once. 23. Verify that the FID FLAME MEAS reading is greater than the FID FLAME SET reading, if not, repeat steps 18 through Press the PAGE command 5 times to reach the RUN SCREEN. 25. If automatic sample cycles are desired, press the SINGLE command once to change the setting to CYCLE. 26. To initiate sampling, press the RUN command once. The FID bias voltage will be energized automatically, and the P1 event program will be automatically loaded and run. Cycle samples with SAMPLE IN connected to BYPASS OUT on the front panel (See Step 17 to start CYCLE process) NOTE: To display concentration data only, press the upper right corner of the RUN screen once this will hide the chromatogram and display data in large text format. To reveal the chromatogram again, press the upper right corner of the RUN screen again. 27. To halt sampling, press the IDLE command once. 3.2 Column Conditioning Conditions warranting column reconditioning are: a) Start-up after storage / shipment b) Reduced detector response, c) Unstable baseline d) Merging of peaks. Normal column operating temperatures are 45 to 90 C. The maximum PP1 FID column operating temperature is 105 o C when exposed to oxygen bearing gases. Page#20 *** CAUTION *** Never energize heaters of the instrument unless carrier gas flowing.
21 *** CAUTION*** The maximum PP1 FID column operating temperature is 105 o C when exposed to oxygen bearing gases. Do not exceed 210 C of column oven temperature at any time. Temperatures in excess of 210 C can destroy column material. 1. Connect the front jumper tube between SAMPLE IN and BYPASS OUT. 2. Use the,, and keys to navigate and alter the SET value for the Column heater zone to 180 to 200 C. 3. After 8 to 12 hours of stable conditioning temperature, the column temperature may be restored to the original factory setting. (See the Final Test Data shipped with the analyzer) 4. After normal operating temperature is achieved, the front jumper tube may be reconnected between SAMPLE IN and SAMPLE OUT. 5. After a 5-10 minute detector re-equilibration period, samples may be run. Normal operating temperatures vary with specific application. Consult the Final Test Data for special settings, special reconditioning requirements, etc. for your application. 3.3 Detector Conditioning ** CAUTION ** The maximum detector operating temperatures for the FID is 350 o C. The FID does not normally require conditioning treatment, however it does require 8 to 12 hours at normal operating temperature to achieve optimum stable performance. Normal detector operating temperature for the FID is 295 o C, although operating temperatures may vary with the specific application. ** CAUTION ** Do not ignite the flame unless the FID FLAME reading is greater than 90 o C See Section 8 for details concerning the effects of operating parameters (temperature and flow) on FID detector performance. Page#21
22 3.4 Igniting the FID Flame 1. Verify that Carrier, FID H2 and FID Air supply pressures and flows match those listed in the final test report. 2. Verify that the FID FLAME temperature is greater than 90C. 3. Press the PAGE command 4 times to reach the RUN SCREEN. 4. Press the MANUAL command once. 5. Press the IGNITE command once, wait 30 seconds and press the IGNITE command again. 6. Press the ESC command once. 7. Press the PAGE command once. 8. Verify that the FID FLAME MEAS reading is greater than the FID FLAME SET reading, if not, repeat steps 3 through Press the PAGE command 4 times to reach the RUN SCREEN. 10. Press the MANUAL command once. 11. Press the BIAS command once. The screen will display BIAS to indicate that the bias voltage (-140 VDC) has been turned on. 3.5 Sample Analysis Verify that sample is flowing freely through loop - exit flow from the rear SAMPLE OUT port should be 30 to 120 cc/min. Press the ESC or PAGE commands as needed to navigate to the RUN screen If multiple sample runs are desired, press the SINGLE command to toggle to CYCLE (repetitive analysis) mode Press the RUN key to initiate analysis the P1 event program will be loaded automatically and executed. Allow the analyzer to fully execute the event program. Current concentration data will be displayed as an overlay on the RUN screen as peaks are identified and quantified. 3.6 Calibration The Peak Performer 1 chromatograph determines concentration peak area to quantify the amount of contaminants in the sample gas. The direct instrument response (in units of uv-sec) is reported simultaneously as an overlay on the RUN / CHROMATOGRAM SCREEN and in the AREA column on the CALIBRATION DATABASE SCREEN. As the concentration peak area is determined, the analyzer applies the pre-programmed response factor as an inverse proportional factor to generate the reported concentration value. PEAK CONCENTRATION = PEAK AREA RESPONSE / RESPONSE FACTOR Page#22
23 3.6.1 Establishing New Instrument Response Factors Connect a known calibration standard gas (span gas) to the analyzer at the SAMPLE IN port on the front panel. (If span gas connection is made at the rear panel SAMPLE IN port, ensure that the front jumper is connected between SAMPLE OUT and SAMPLE IN on the front panel) Verify that sample is flowing freely through loop - exit flow from the SAMPLE OUT should be 30 to 120 cc/min. Press the ESC or PAGE keys as needed to navigate to the RUN screen Press the SINGLE / CYCLE / RERUN key to toggle to SINGLE mode Press the RUN key to initiate analysis the P1 event program will be loaded automatically and executed. Allow the analyzer to fully execute the event program. Current concentration data will be displayed as an overlay on the RUN screen as peaks are identified and quantified. Press the PAGE key as needed to toggle to the CALIBRATION DATA BASE screen Place the * at the first compound of interest and press the EDIT key use the up, down, left and right arrow keys to enter the span gas concentration in the CONC field. Be certain to use the right arrow key to fully exit the CONC field or all updates will be lost. With the * before the compound name, press the UPDATE key. The analyzer will recalculate the appropriate response factor for the compound based upon the span gas concentration and analyzer area response using the following formula: Page#23 RESPONSE FACTOR = AREA RESPONSE / SPAN GAS CONCENTRATION NOTE: The LED on the analyzer s front panel will change from green to red to remind the user that the current calibration information is stored in volatile (temporary) memory only, and will need to be saved to permanent memory at a later time. Repeat the sequence for each of the compounds shown on the CALIBRATION DATA BASE screen. Repeat analysis of the span gas sample and verify that the analyzer reports data values within normal calibration tolerances (i.e. + / - 5%). 3.7 Shutdown and Transport 1. Shut off H2 supply 2. Allow the temperature zones to cool below 50 C (approximately 2 hours). 3. Allow carrier to flow during cool down time. 4. Shut off carrier after cool down time and plug the CARRIER IN, FID H2, FID AIR ports on the rear of the analyzer. 5. Power off analyzer. 6. Cap the SAMPLE IN, SAMPLE OUT and ACTUATOR IN ports.
24 7. Plug the BYPASS OUT port on the front panel. 8. Ensure that the front jumper tube is connected between SAMPLE IN and SAMPLE OUT. 9. Package the analyzer in a hard cover carrying case or comparable shipping container. If cardboard packaging is used, Peak recommends double boxing of the analyzer using at least 2 of resilient packing material between the inner and outer box walls. 4.0 Peak Performer Operator Interface Figure 10. Software Menu Structure Page#24
 The upper section (3 lines) contains commands related to analyzer set-up. 2) The middle section (5 lines) contains commands related to temperatures zones and detector parameters.")
25 4.1 Set-up Screen The Set-up screen is multi-functional. Different command buttons appear at the bottom line of the screen dependent upon the section containing the asterick cursor ( * ). 1) The upper section (3 lines) contains commands related to analyzer set-up. 2) The middle section (5 lines) contains commands related to temperatures zones and detector parameters. 3) The lower section is reserved for error messages and non-volatile memory updates Set-up Screen Upper Section Figure 11. Main (or Setup) Screen Upper Section Set-up Screen Upper Section Button Functions : : Edit: Page: Moves the cursor * upwards. Moves the cursor * downwards. Allows the user to change the Date, Time, or Protocols. Advances the user to the next screen. Page#25

26 4.1.2 Set-up Screen Middle Section (Power-up) The middle section of the Setup screen is concerns temperature zone and detector function. Figure 12. Screen Commands Upon Power-up NOTE: The heater zones are not energized automatically upon power-up, and the detector electronics are not fully initialized until the ZERO command is invoked Set-up Screen Middle Section Button Functions (Power-up) If both heater zones are de-energized, the following command buttons are available: Zero: : : Edit: Heat: Page: Allows the initialize the detector electronics and establish a consistent baseline signal. Moves the cursor * upwards. Moves the cursor * downwards. Allows the user to energize each heater zone or change heater setpoint temperatures. Energizes all the heater zones. Advances the user to the next screen. Page#26

27 4.1.3 Set-up Screen Middle Section (Normal) The middle section of the Setup screen concerns temperature zone and detector function. Figure 13. Screen Commands After Warm-up Set-up Screen Middle Section Button Functions ( Normal) Zero: : : Edit: Page: Allows the initialize the detector electronics and establish a consistent baseline signal. Moves the cursor * upwards. Moves the cursor * downwards. Allows the user to energize / de-energize each heater zone or change heater set point temperatures. Advances the user to the next screen. Page#27

28 4.1.4 Set-up Screen Lower Section The lower portion of the Setup screen is reserved for error messages and non-volatile memory updates Error Messages on the Set-up Screen Lower Section All error conditions are enunciated by a RED color on front panel LED, and a shift in the ERROR FLAG parameter transmitted through the COM1 and COM2 output ports see Section 6.1 for additional details. Figure 14. Set-up Screen Displaying an Error Message There are eleven individual error conditions that can cause the status LED on the front panel to glow red: Detector Communication Error Temperature Zone - Out of Range Temperature Zone Disabled Detector Zeroing Target Error Vlamp Low Voltage - Out of Range (RCP Analyzers Only) FID Flame Temperature - Out of Range (FID Analyzers Only) Event Program Load Error Stream Selector Program Error Detector Power Disabled System Parameters Corrupted Parameter Change, Update Needed Detector Power Disabled (For PDHID & TCD only) Page#28
 can be cleared at any time by pressing the ACCEPT button.")
29 Clearing Error Messages and on the Set-up Screen Lower Section Figure 15. Typical FID Flame Out Error Message All error messages (except PARAMETER UPDATE) can be cleared at any time by pressing the ACCEPT button. However, if the error condition continues to exist, the error message may re-appear. Accept: : : Page: Allows the user to acknowledge and clear error messages. Moves the cursor * upwards. Moves the cursor * downwards. Advances the user to the next screen Set-up Screen Lower Section Button Functions The PARAMETER CHANGE, UPDATE NEEDED error message can only be cleared when the analyzer is not performing an analysis, i.e. is in IDLE mode. The parameter update action forces a complete re-write of permanent memory and is irreversible. Peak Labs recommends reviewing all parameter screens before performing a parameter update. Page#29


30 Figure 16. Parameter Change Error Message Accept: memory. : : Page: Allows the user to initiate permanent updates to non-volatile Moves the cursor * upwards. Moves the cursor * downwards. Advances the user to the next screen. Pressing the ACCEPT button alters the screen appearance. Figure 17. Parameter Change Prompt Page#30
 Screen The compound (or Channel) information for the ANALOG INTERFACE screen is automatically populated using the information from the ANALYSIS DATABASE")
31 Save: memory. Esc: Allows the user to make changes to permanent non-volatile Aborts updates to non-volatile memory. 4.2 Analog Interface (Trend and Recorder Output) Screen The compound (or Channel) information for the ANALOG INTERFACE screen is automatically populated using the information from the ANALYSIS DATABASE screen. NOTE: The analog outputs are locked if the Port 1 Protocol on the MAIN SCREEN is set to DETECTOR. See Section Analog signals generated from this information appear on the rear panel s green DIN terminal blocks. See Figure 19. Figure 18. Analog Interface Screen Analog Interface Screen Button Function : : Range: Moves the cursor * upwards. Moves the cursor * downwards. Allows the user to select the full scale concentration range associated with the maximum 1.00 VDC signal for each compound. The ranges are user selectable. e.g ppb readings in the analyzer = VDC output scale. Page#31


32 At the end of each run, the analog signal is updated and holds until the next run is completed. As an accessory, Peak can provide standard commercial VDC -> ma converters as needed. In lieu of a specific concentrations range, the RANGE button for the recorder function toggles through choices of raw signal attenuation: X1, X2, X4, X8, X16, X64. This function is similar to the RANGE switch on a chart recorder. This function only affects the recorder output not the individual compound trends. Manset: Temporarily over-rides the signal output with a known output voltage for test purposes. Four MANSET options are available: 0.00 VDC, 0.25 VDC, 0.5 VDC, and 1 VDC. There is not any zero offset or full voltage scale adjustment within the PP1 if this function is a requirement, Peak Labs recommends the use of standard commercial voltage converters attached externally to the analyzer Analog Interface Connections All analog interface connections are made via the rear panel DIN connector. To make a proper connection, strip all wires back approx. 3/8, unscrew the terminal locking screw fully, insert the wire and tighten. A common error is insufficient length of bare wire creating the condition where the terminal contacts only the wire insulation Figure 19. Analog Output Connections NOTE: The analog outputs are locked if the Port 1 Protocol on the MAIN SCREEN is set to DETECTOR. See Section 6.2. Page#32
33 4.2.3 Analog Interface Wiring Breakdown There are 10 total terminal connectors, from the top, the connectors ID s are: Terminals 1-6: Impurity Trends: All channels are mapped to the calibration database All channels are 0 1 VDC All channels signals are updated at the end of run and held All channels are manually scalable on the ANALOG INTERFACE SCREEN e.g. 0 > 1000 = 0 to 1000 ppb = 0 1 VDC scale. Maximum scale is 999,999 Optional converters to provide other current / voltage outputs are available. Please contact your local Peak representative for additional information. Terminal 7: Analog recorder / raw signal 0 1 VDC range Terminal 8: Remote Start Input: The remote start input is activated by shorting the terminal 8 to COMMON GND for at least 100ms. The remote start input must then return to an open state (unshorten). Terminal 9: FID Flame Switch Relay: The FID Flame and General Alarm switch relays are SPST- N.O. and rated for VDC (10VA) Terminal 10 General Alarm Relay: The FID Flame and General Alarm switch relays are SPST-N.O. and rated VDC (10VA) NOTE: The Analog recorder signal is only active when the COM1 setting is set to Viewer. Figure 20. Analog Output Wiring Schematic Channels 1-7 output voltage can be tested manually by pressing the MANSET key to send a temporary signal for diagnostics. Page#33

34 4.3 Calibration Database Screen The Calibration Database screen stores critical information regarding calibration (span) gas concentrations and instrument response, and provides tools to easily update the response factors. Figure 21. Calibration Database Screen Calibration Screen Button Function Update: Allows the analyzer to calculate new RFactor. : Moves the cursor * upwards. : Moves the cursor * downwards. Edit: Allows the user to change concentration data or response factor. Page: Advances the user to the next screen Calibration The Peak Performer 1 chromatograph determines concentration peak area to quantify the amount of contaminants in the sample gas. The direct instrument response (in units of uv-sec) is reported simultaneously as an overlay on the RUN / CHROMATOGRAM SCREEN and in the AREA column on the CALIBRATION DATABASE SCREEN. As the concentration peak area is determined, the analyzer applies the pre-programmed response factor as an inverse proportional factor to generate the reported concentration value. PEAK CONCENTRATION = PEAK AREA RESPONSE / RESPONSE FACTOR Page#34
35 Establishing New Instrument Response Factors Connect a known calibration standard gas (span gas) to the analyzer at the SAMPLE IN port on the front panel. (If span gas connection is made at the rear panel SAMPLE IN port, ensure that the front jumper is connected between SAMPLE OUT and SAMPLE IN on the front panel) Verify that sample is flowing freely through loop - exit flow from the SAMPLE OUT should be 30 to 120 cc/min. Press the ESC or PAGE keys as needed to navigate to the RUN screen Press the SINGLE / CYCLE / RERUN key to toggle to SINGLE mode Press the RUN key to initiate analysis the P1 event program will be loaded automatically and executed. Allow the analyzer to fully execute the event program. Current concentration data will be displayed as an overlay on the RUN screen as peaks are identified and quantified. Press the PAGE key as needed to toggle to the CALIBRATION DATA BASE screen Place the * at the first compound of interest and press the EDIT key use the up, down, left and right arrow keys to enter the span gas concentration in the CONC field. Be certain to use the right arrow key to fully exit the CONC field or all updates will be lost. With the * before the compound name, press the UPDATE key. The analyzer will recalculate the appropriate response factor for the compound based upon the span gas concentration and analyzer area response using the following formula: RESPONSE FACTOR = AREA RESPONSE / SPAN GAS CONCENTRATION NOTE: The LED on the analyzer s front panel will change from green to red to remind the user that the current calibration information is stored in volatile (temporary) memory only, and will need to be saved to permanent memory at a later time. Repeat the sequence for each of the compounds shown on the CALIBRATION DATA BASE screen. Repeat analysis of the span gas sample and verify that the analyzer reports data values within normal calibration tolerances (i.e. + / - 5%). Page#35
 PkCen = The normally expected peak retention time (in seconds), used for assigning the")
36 4.4 Analysis Database Screen The Analysis Database screen stores critical information regarding peak identification and quantification parameters. Figure 22. Analysis Database Screen Analysis Database Parameters Name = The peak identification tag, expressed as 5 alphanumeric characters (A-Z, 0-9) PkCen = The normally expected peak retention time (in seconds), used for assigning the appropriate Name LW = The typical time span measured from the start of the peak s baseline rise to the peak apex PkCen (in seconds). Minimum value is 3, maximum is 35 RW = The typical time span measured from the peak s apex PkCen to the end of the peak s baseline decline (in seconds) Minimum value is 3, maximum is 35 PkWin = Total tolerance window (in seconds) for assignment of a Name to a quantified chromatographic peak. The tolerance window is centered upon the PkCen value PkHgt = A variable for establishing the cross-over point in peak detection modes. Chromatographic peaks higher than this parameter will be quantified using the Variable mode heights, peaks with height less than or equal to PkHgt will be quantified using the ForceB mode. Flt = The convolution filter value expressing the overall peak shape. Flt = 2 is recommended for sharp, narrow peaks such as H2, and Flt = 8 is recommended for broad peaks such as CO. As a general rule, LW and RW values do not change significantly with peak concentration, so calibration peak size is not critical in determining proper LW and RW values. Page#36
37 Left Width (seconds) Right Width (seconds) Peak Performer 1 Users Manual Left Width Right Width Blended Concentration (ppb) Figure 23. Left and Right Peak Width as a Function of Concentration Total peak width (LW + RW) is primarily a function of sample loop unloading. Larger sample loops require a long time period to fully inject. The relative values of LW and RW are dictated by the skew factor of the peak. Peaks need about data points minimum to be well measured - at 5 data points per second, this means total peak width should be greater than 6 seconds. Therefore, it is recommended to use a substantial calibration peak concentration to facilitate easy LW and RW measurements Analysis Screen Button Function : : Edit: Page: Moves the cursor * upwards. Moves the cursor * downwards. Allows the user to enter new peak compound name or analysis parameters. Advances the user to the next screen Page#37

38 Analysis Averaging - When enabled, one, two or four chromatograms are averaged, (data point by data point) to create a composite chromatogram, which is then quantified using normal techniques. Analysis averaging does not average concentration data values. From analysis start, it will take approximately 30 minutes to obtain the best averaged results. 4.5 Event Program Editor Screen The Event Program Editor screen stores critical information regarding preprogrammed instrument actions needed to perform an analysis. Figure 24: Event Editor Screen Event Program Commands The instrument actions can be pre-programmed to create an analysis method or Event Program. The analyzer stores up to 4 distinct Event Programs. V1 (CW) V1 \ (CCW) V2 (CW) V2 \ (CCW) ZERO END HEAT ON HEAT OFF Moves V1 to the Inject position Moves V1 to Load position Moves V2 to the In-line position Moves V2 to the Vent position Invokes the detector ZERO command Ends the Event Program and prepares the analyzer for the next run Not currently in use Not currently in use Page#38

39 4.5.2 Event Editor Screen Button Function : : Moves the cursor * upwards. Moves the cursor * downwards. Load 1: Allows the user to load the event program # 1. Toggle: Page: Allows the user to scroll through event program choices. Advances the user to the next screen 4.6 Stream Selector Program Editor Screen (Purchased Option) Peak offers a dual sample stream option for most analyzers. The selection and timing of sample streams can be pre-programmed on this screen. NOTE: This screen will only appear when the STREAM method of analysis is selected on the RUN screen Stream Selector Commands Figure 25. Stream Selector Sequence Screen The selection of sample streams and appropriate Event Program can be run in a preprogrammed sequence. Stream # Event Prog # Cycles Establishes which sample stream to be utilized for analysis Establishes which Event Program to be utilized for the sample stream Establishes the number of repeat analysis before switching to other stream Page#39

40 4.6.2 Stream Selector Program Editor Screen Button Function : : Edit: Page: Moves the cursor * upwards. Moves the cursor * downwards. Allows the user to chose event program # and # of repetitions. Advances the user to the next screen 4.7 Run / Chromatogram Screen The Run / Chromatogram screen provides the real time display and data processing of sample analysis. The screen displays the running chromatogram, peak markers, and concentration data. The information displayed on this screen is useful for evaluating instrument health, event program validity, and analytical stability, Figure 26. Run / Chromatogram screen in the Idle state, and the mode displayed upon initial power up Page#40


41 Figure 27. Run screen in Single mode, with chromatogram being drawn Figure 28. Run screen in Idle mode at end of run Run Screen Button Functions Run: Idle: Manual: Disp: Single: Loads a standard event program and runs an analysis in the mode selected. Stops the analysis immediately. Opens the Manual Run Screen Opens the Display Screen (Toggle). Starting a run in the will command the PP1 to run one time and return to the idle mode. Page#41
. Starting a run in the Stream mode will configure the PP1 to initiate the Stream Selector Sequence until the Idle key is pressed. Advances the user to the next screen. 4.7.")
42 Cycle: ReRun: Stream: Page: (Toggle). Starting a run in the Cycle mode will configure the PP1 to run continuously until the Idle key is pressed. (Toggle). Starting a run in the ReRun mode will recompute the area and concentration based on the parameters in the analysis data base. (Toggle). Starting a run in the Stream mode will configure the PP1 to initiate the Stream Selector Sequence until the Idle key is pressed. Advances the user to the next screen Continuous Monitoring Analysis Continuous monitoring is intended for on-line analysis or other applications which ReRun analysis is not required. Use the PAGE key to scroll to reach the Run screen. Toggle the Single / Cycle / ReRun key until Cycle appears. (see Figure 28) Press Run to initiate a repetitive analytical cycle By pressing the RUN key, event program 1 (P1) is automatically loaded and the system will begin to collect data in repetitive mode (see Figure 28). To halt the cycle, pressing the IDLE will cause the analysis run to cease immediately. Toggle between the Single, Cycle, Rerun (or optional Stream) to select the next mode of analysis Manual Screen (Sub-Screen of the Run Screen) The Manual sub-screen allows the operator to invoke all the event program commands on demand. Figure 29. Run / Manual screen Page#42
 or OFF. V1: Toggles Valve 1 between CW and CCW positions. V2: Toggles Valve 2 between CW and CCW positions.")
43 Manual Screen Button Functions Zero: Pressing this key will electronically zero the detector. Ignite: Pressing this button applies power to the ignition probe for 20 seconds. Bias: Toggles the negative accelerating voltage within the FID to ON (BIAS-) or OFF. V1: Toggles Valve 1 between CW and CCW positions. V2: Toggles Valve 2 between CW and CCW positions. Esc: Exits from the Manual sub-screen to the Run screen Display Screen (Sub-Screen of the Run Screen) The Display sub-screen allows the operator to adjust the horizontal scale, vertical scale and baseline offset of the chromatogram. These functions mimic those of a standard chart recorder. Figure 30. Run / Display screen Display Screen Button Functions +VOff: -VOff: +Attn: -Attn: Span: Esc: Scrolls the screen up (maximum Voff = 11) without changing the scale. Scrolls the screen down (minimum Voff = 0) without changing the scale. Toggles the attenuation / vertical scaling (max. Attn = 11) up. Toggles the attenuation / vertical scaling (min. Attn = 1) down. Toggles the window view (horizontal scaling) in seconds. Exits from the Display sub-screen to the Run screen. Page#43
44 5.0 Peak View Software The Peak View software has two main capabilities. Primary functions concern acquisition and archiving of compound concentration and acquisition and collection of the chromatogram data. The software also provides the ability to display and print the data from a remote computer platform. Peak View software is written specifically for the Peak Laboratories Peak Performer 1 (PP1) gas analyzer covering communications port protocols and data formats and is not intended for use with other manufacturer s analyzers. 5.1 System Requirements 1.2 GHz, 20 GB, 256 Mb RAM, 1 USB port Windows XP or Windows Vista, Windows 7, Windows 8 USB to DB9 (RS232) Adapter Maker: Gigaware Model # or equivalent DB9 Extension cable, DB9M to DB9F, wired straight-through, 10 feet Optional : USB 4 port self-powered Hub Inland # or equivalent 5.2 Installing the Peak View Software 1) Place Peak View software CD-ROM disk into CD-ROM drive. 2) If Auto run is enabled, follow the installation screen prompts. 3) If the CD-ROM does not automatically launch, select SETUP from CD-ROM disk. 4) The installation software will auto-install the Viewer in a folder under the PC s main drive as the default. The user has options from the installation process to create a new folder and install in a new location. 5.3 Starting the Peak View Software 1) Double-click the Peak View icon on the Desktop or 2) Select START button on the bottom Taskbar. 3) Select PROGRAMS, select PEAK VIEW, and double-click to launch move to Peak View 5.4 COM1 / COM2 Port and Cable Wiring The cable connected from the PC to the PP1 should be a straight-through wired 9 pin M/F cable, attached to the PC s COM port and the PP1 s COM port. (See Section 6 for details on communications protocols.) Page#44

45 5.5 Viewer Software Window The Viewer window shown in Figure 33 shows the main Viewer screen with a RED DOT in the upper right corner. This RED DOT signifies that there is a connection problem with the PC and the PP1. Verifying the following can solve this connection problem. Communication Settings Connection of 9-pin cable between PC and PP1. RS-232 cable plugged into the PP1 s COM 1 port. PP1 is powered off After the connection problem has found and corrected, the RED DOT should be CLICKED to verify if communication between the PC and PP1can be properly established. Figure 31. Viewer main window showing Communications Error The Viewer window shown in Figure 32 shows the viewer screen without the RED DOT. This signifies the communication connection between the PC and the PP1 is function correctly. Page#45


46 Figure 32. Viewer main window showing no Communications Error File Menu on the Viewer Taskbar Figure 33. File Menu on the taskbar Page#46

47 The File menu contains the following commands: Function Open Port Settings Print Exit Description Opens a *.CSV file that was created by the Viewer software. Use this command to open a *.CSV file to view the concentration data. Opens serial communication settings window for setting RS-232 configurations between the Host PC and the PP1. As shown in figure 34. NOTE** Port number is controlled by host computer and cannot exceed Port# 16 Prints all concentration data of selected *.CSV file. Exit Viewer application Communication Setting Window The Communication Settings window is shown in figure 34. This screen displays the serial communication settings used by the PC to communicate to the PP1. The baud rate, data bits, and stop bits settings should match all of the settings in figure 16, baud rate 38400, data bit 8, stop bit 1. The COM port number must match the COM port designated by the PC s terminal. The COM Port number is determined by which COM port the serial cable is plugged into on the PC, not the PP1. Clicking the OK button will configure the COM port to the correct options and save the settings in a file on the computer. Figure 34. Viewer Software Communications Setting screen Page#47

48 Once the *.CSV file is opened, the Viewer window automatically updates and shows concentration data. Figure 35 is an example with consecutive runs. The run of concentration data at 16:33 is displayed in RED to denote that there was a general error in the PP1 during this run. Figure 35. Viewer screen showing concentration data There are eleven individual error conditions that can cause the Viewer Line to appear red: Detector Communication Error Temperature Zone - Out of Range Temperature Zone Disabled Detector Zeroing Target Error Vlamp Low Voltage - Out of Range FID Flame Temperature - Out of Range Event Program Load Error Stream Selector Program Error System Parameters Corrupted Parameter Change, Update Needed Detector Power Page#48


49 Viewer Line Details Window This window is displayed by double clicking on any time-stamp on the Viewer window. The screen provides detailed analytical information about the run selected. Figure 36. Viewer Detail screen showing raw analysis data. The information on the screen is linked to run 16:33 displayed in figure Start Menu on the Viewer Taskbar Figure 37 Start menu on the taskbar Page#49
50 Peak Performer 1 User Manual The Start menu contains the following commands: Function Single Run Cycle Run Stream Run Description Single Run selection commands the PP1 to start a Single Run. Cycle Run option commands the PP1 to start a continuous Cycle Run. Stream Run selection commands the PP1 to start a Stream Selection Run. (This operation only function if the Stream Selection option is installed) Stop Command on the Viewer Taskbar The Stop Command selection instantly sends a command the PP1 to terminate the current run immediately Chrom View Menu and Chromatograph Viewer Window The Chrom View menu selection opens the Chromatograph Viewer window. Two methods can open the Chrom Viewer window. 1) The first method is to select the Chrom View menu selection from the Viewer taskbar and then select a.chm file to display. 2) The second method of opening the Chrom Viewer is double-clicking one of the concentration values displayed in the Viewer window. Using either method, after the chromatogram data is loaded, the display can be adjusted by the Offset, Attenuation, and Span scroll bars. Page#50 Figure 38. Chromatogram Viewer Window
51 Peak Performer 1 User Manual NOTE: Viewer window scaling does not match the analyzer s display scaling. A higher degree of resolution is available in the Viewer window. For instance, Viewer ATTN 8 approximately is equivalent to analyzer display ATTN Chromatogram Files Chromatograms are archived on the host computer as text files, suffixed.chm. The text files can be imported into most common laboratory analysis, spreadsheet and word processor programs as needed. Data points in the chromatogram file are time sequenced at 0.2 seconds per data point. The filename of the chromatogram file is generated by time of day on the host computer, and the file is stored in a folder that corresponds to the date of collection. A corresponding Viewer data file is created and / or updated at the time the chromatogram file is created. As an example, the fourth chromatogram shown in Figure 36 would be archived on the host computer as follows: Main directory Sub-directory Viewer filename Filename C:\ Viewer [(YYYY-MM-DD) of archive creation] csv 0851.chm File Menu on the Chrom Viewer Taskbar Page#51 Figure 39. Baseline Selected

52 Peak Performer 1 User Manual Figure 40. Baseline Deselected The File menu offers the following commands: Function Open Save As BaseLine Print Exit Description Opens a chromatogram file. Use this command to open and load the chromatogram data for display. Save the chromatogram data that is currently displayed. Enables display of compound name and integration baseline information. Prints window. Exit window Viewer Menu on the Chrom Viewer Taskbar The Viewer menu selection returns the user to the original Viewer window. (See Figure 36) Page#52

53 Peak Performer 1 User Manual 6.0 Communication Port Protocol and Formats There are two serial communications ports on the rear of the PP1. COM1 is a multifunctional serial port, COM2 port is a dedicated PLC output port. 6.1 COM1 / COM2 Port and Cable Wiring The cable connected from the PC to the PP1 should be a straight-through wired 9 pin M/F cable, attached to the PC s COM port and the PP1 s COM port. Figure 41. COM Cable Wiring Peak Labs recommends limiting cable lengths to 25 feet maximum. 6.2 Port 1 Protocol There are two COM1 output formats: Peak View and Detector. Proper selection of protocol is determined by the application in use on the host computer COM 1 Port Settings The RS-232 settings for COM 1 port are baud rate, 8 bit data, 1 stop bit, and no parity. These settings are fixed and are not user-selectable. Page#53
54 Peak Performer 1 User Manual Peak View Output (Columns Format in.csv file) The Peak View software stores information in a common text format, Comma Separated Variable (CSV). CSV files can be opened in common spreadsheet applications for further analysis. The column format in the *.CSV files are: A = Data/ Time B = Run Mode C = Analysis Buffer Number and Stream Number D = General Error Alarm E = RCP Lamp Voltage or FID Flame Temperature (NOTE: No values to be measured for TCD or PDD and will show up as 0) F = Compound Name G = Retention Time H = Left Point Offset I = Right Point Offset J = Area K = Response Factor L = Processing Flag- V,F or B Columns F to L are repeated for M to S, T to Z, and AA to AG for the next five compounds listed in the Calibration Data Base Detector Output The detector output format of the COM1 interface currently supports one command from a host computer system. This command remotely starts a RUN. The PP1 system processes the external start command only if the analyzer is in IDLE mode. (Not running a sample). Upon receipt of the external start command, the PP1 performs the following functions: Sets system run mode to SINGLE RUN mode. Loads event program P1. Starts a Single Run. Sends Detector Signal Data stream (i.e. Vout reading) to the COM1 port. At the end of the run, the PP1 sends an End-Of-Data string to identify the end of the data stream. Sets analyzer to IDLE mode and waits for the next start command External Start Command String The External Start Command string format transmitted by host computer must consist of three ASCII characters. Below are four forms of the same command: Form # 1 Form # 2 Start-Of-Text "S" End-Of-Text STX "S" EXT Page#54
55 Peak Performer 1 User Manual Form # 3 ^B S ^C Form # Detector Signal Data String The PP1 Detector Signal Data string format is a decimal number followed by a carriage return (CR) and line feed (LF). An example: The End-Of-Data string format consists of three ASCII characters. The following are four forms of the same command: Form # 1 Start-Of-Text "E" End-Of-Text Form # 2 STX "E" EXT Form # 3 ^B E ^C Form # An example: // Last sample sent to Host ^BE^C // End-Of-Data command to Host from PP1 6.3 Port 2 Protocol There are two COM2 protocol formats, PLC (programmable logic controller) and MODBUS protocols. There are three modes of operation: AUTO, POLL, and MODBUS. PLC protocol can operate in 2 modes, AUTO or POLL. The MODBUS Protocol mode is predefined and not user changeable. Proper selection of protocol is determined by the application in use on the host computer COM 2 Port Settings The RS-232 settings for COM 2 port are 9600 baud rate, 8 bit data, 1 stop bit, and no parity for AUTO and POLL modes. The RS-232 settings for COM 2 port in MODBUS mode are 9600 baud rate, 7 bit data, 1 stop bit, and even parity for Page#55
56 Peak Performer 1 User Manual Three modes of transmission are available: AUTO or POLL or MODBUS: In AUTO mode, the current PLC data string is transmitted at the end of analytical cycle without any request from the host computer. In POLL mode, the PP1 will transmit the latest PLC data string only when prompted by the host computer. This mode is recommended for use in a RS-485 network but can also be used for RS-232 connections. In MODBUS mode, the PP1 will transmit the latest PLC data string only when prompted by the host computer. See MODBUS uses manual for operational details. Selecting the POLL mode on the MAIN SCREEN configures the PP1 to wait for a request before transmitting. The master controller of the RS-485 network must first request data from the PP1 in order for receive the COM2 port output data. The protocol to request data from the PP1 consists of: 1) A start of transmission character 2) Followed by the unit serial number 3) An end of transmission character. or STX character (02 hex) SSSS ETX character (03 hex) The requesting command format follows: <STX>SSSS<ETX>, where SSSS = serial number of unit is used as the RS-485 ID COM 2 Port PLC Output Format The COM 2 port output format consists of unit serial number, date and time stamp, error alarm, stream number, followed by impurity data. This data format is transmitted at the end of every run automatically if the COM 2 mode is set to Auto. This format uses a general protocol envelope. This envelope consists of a start of transmission character followed by data, and end of transmission character. The start of transmission indicator is a STX character (02 hex) and the end of transmission indicator is a ETX character (03 hex). The fields within each record are defined as follows: <STX>SSS,YYYY-MM- DD,HH:MM:SS,E,X,N,AREA,CONC,N,AREA,CONC,..N,AREA,CONC,<ETX> SSS = Serial Number of Unit. This is also used as the RS-485 unit ID YYYY-MM-DD = Date ( ) HH:MM:SS = Time (12:23:44 = 12 hours 23 minutes 44 seconds) E = General Error Alarm ( 0 = No Error, 1 = Error) X = Stream Number N = Name of Impurity (x6) AREA = Are of Impurity (x6) CONC = Concentration of Impurity (x6) Page#56
57 Peak Performer 1 User Manual NOTE: The least significant decimal of the concentration resolution represents 0.1 ppb. (CONC reading of 1 represents a 0.1 ppb concentration level) 6.4 Modbus Protocol and Register Map for Peak Laboratories Devices This section describes the Modbus protocol for Peak Laboratories PP1 analyzer. It is assumed that the reader is familiar with the Modbus protocol and serial communications in general. The following rules define the protocol for information transfer between a Modbus MASTER device and the Modbus SLAVE. The MASTER initiates and controls all information transfer on the communications channel. A SLAVE device never initiates a communications sequence. All communications activity occurs in the form of PACKETS. A packet is a serial string of 7-bit ASCII bytes. All PACKETS transmitted by the MASTER are REQUESTS. All PACKETS transmitted by a SLAVE device are RESPONSES. At most, one SLAVE can respond to a single request from a MASTER. The PP1 does not support broadcast request packets. The PP1 shall only support the ASCII mode Modbus protocol. The PP1 is only a SLAVE device. The PP1 does not conform to all stated requirements according to the MODBUS Application Protocol Specification v1.1b3 and MODBUS over Serial Line Specification and Implementation Guide V Mode of Transmission The PP1 only supports the ASCII mode Modbus protocol. The PP1 analyzer requires the serial communications channel to be configured to 9600 bps, 7 data bits, even parity, and one stop bit Modbus Packet Structure Every Modbus packet consists of four fields: Slave Address Field Function Field Data Field Error Check Field (LRC Checksum) Slave Address Field The slave address field of a Modbus packet is one byte, two ASCII characters, in length and uniquely identifies the slave device involved in the transaction. Valid addresses will be in a range between 1 and 247. A slave device performs the command specified in the packet when it receives a request packet with the slave address field matching its own address. A response packet generated by the slave has the same value in the slave address field. Function Field The function field of a Modbus request packet is one byte in length and tells the addressed slave which function to perform. Similarly, the function field of a response packet tells the master what function the addressed slave has just performed. On page 61 lists the Modbus functions supported by the PP1 when acting as slave, please refer to Table 2: Modbus Functions Supported by the PP1 as Slave. Page#57
58 Peak Performer 1 User Manual Data Field The data field of a Modbus request is variable length, and depends on the function. This field contains information required by the slave device to perform the command specified in a request packet, or data being passed back by the slave device in a response packet. Data in this field is contained in 16 bit registers. Registers are transmitted in the order of high-order byte first, low-order byte second. Example: A 16-bit register contains the value 62BE Hex, four ASCII characters. High order byte = 62 Hex, two ASCII characters Low order byte = BE Hex two ASCII characters This register is transmitted in the order 6 2 B E, four ASCII characters. Error Check Field (LRC Checksum, two ASCII characters) Error Check Field In Modbus ASCII mode, an 8-bit Longitudinal Redundancy Check (LRC) algorithm is used to compute the checksum byte. The checksum field enables the receiving device to determine if a packet is corrupted with transmission errors. The sending device calculates the checksum, 8-bit value, based on every byte in the packet, using the LRC algorithm. The calculated value is inserted in the error check field. The receiving device performs the same calculation, without the error check field, on the entire packet it receives. The resulting value is compared to the error check field. Transmission errors are indicated when the calculated checksum does not equal the checksum stored in the incoming packet. The receiving device ignores a bad packet. To calculate the LRC: 1. Add up all the data bytes in the message (before converting to ASCII and without the initial colon and final CR/LF). 2. Throw away any bits that carry over 8 bits. 3. Make the result negative (by twos complement) to get the LRC byte. 4. Convert from the 8-bit hex value to two ASCII characters Packet Communications: The PP1 analyzer only supports two Modbus functions, Read Holding Registers and Preset Single Register. Function codes 03, 06 respectively. Modbus Function ModBus Description Function Description 03 Read Holding Registers Fetch the current value in one or more holding registers from the PP1. 06 Preset Single Register Write specific values into a single holding register to the PP1. Table 1: Modbus Functions Supported by the PP1 as a Slave Function 03: Read Holding Registers: To read PP1 parameter values, a Master must send the PP1 a Read Holding Registers request packet. The Read Holding Registers request packet specifies a starting Page#58
59 Peak Performer 1 User Manual address and the number of 16-bit registers to read. The Modbus registers are numbered from to This Modbus numbering corresponds to an address map of 0 to The PP1 responds with a packet containing the values of the registers in the range defined in the request. See PP1 address map table to verify address range and content. Read Holding Registers Packet Example: The next example, the PP1 s Modbus slave address is 92 and the master requests to read two parameters from the PP1. These two parameters are requested from Modbus registers and In accordance with the Modbus protocol, holding register is numbered as address 12 when requested. Slave Address: 92 = 5C (Hex) Modbus Function: 03 =03 (Hex) Starting Register: 12 = 000C (Hex) Num of Register: 02 = 0002 (Hex) LRC Checksum : -109 = 93 (Hex) = (ASCII) Request Packet: non-shaded background denotes the DATA field of the packet. Slave Addre ss Modb us Funct ion Starting Register (40013) Num of Registers (2) LRC Check sum 5 C C Response Packet: Slave Address Modbus Function Byte Count Register 1 Address (12) Register2 Address (13) LRC Checksu m 5 C E A D The Master device receives the above data packet in response to the request packet: Modbu Byte Count = 04(Hex) = 4 Modbus Register =4E38(Hex) = Modbus Register = 2A60(Hex) = Function 06: Preset Single Register: Preset a value into a single holding register. Place specific values into a single holding registers in the PP1. There is only one holding register that can be written to the PP1. See PP1 register map below. Preset Single Register Packet Example: In the next example, the PP1 s Modbus slave address is 143 and the master requests to write the value of 3 to Modbus register (40004). In accordance with the Modbus protocol, register is numbered as address 3 when requested. Slave Address: 143 = 8F (Hex) Modbus Function: 06 =06 (Hex) Page#59
60 Peak Performer 1 User Manual Starting Register: 3 = 0003 (Hex) Preset Data: 3 =0002 (Hex) Request Packet: non-shaded background denotes the DATA field of the packet. Slave Address Modbus Function Starting Register (40004) Preset Data(3) LRC Checksu m 8 F Response Packet: Slave Address Modbus Function Starting Register (40004) Preset Data(3) LRC Checksu m 8 F As you can see from the response packet above, the response is the echo of the requested packet Modbus Data Format: The PP1 is capable of exporting all holding registers into the Modbus protocol. The PP1 data available in a contiguous set of Modbus holding registers. The PP1 output registers are located in the Modbus register map from to The actual location is defined in table 3 below. Six Data Formats Used in the PP1 Analyzer: UINT16-16 bit unsigned integer 0 to 65,535 INT16-16 bit signed integer -32,768 to +32,767 UINT32-32 bit unsigned integer 0 to 4,294,967,295 INT32-32 bit signed integer -2,147,483,648 to +2,147,483,647 Boolean - Packed Boolean Format 8CharString 8 character string format Page#60 16-bit Integer Format: Unsigned and signed 16 - bit integer formats are the simplest formats. Each PP1 address corresponds to one Modbus Holding Register. If the format is unsigned, the value range for the output registers is 0 to If the format is signed, the value range is to bit Integer Format: To accommodate values that can reach beyond the 16- bit range, the Modbus Slave provides 32 - bit integer format as an output option. In signed and unsigned 32 - bit integer formats, each PP1 address corresponds to two 16 - bit Modbus Holding Registers. A 32 - bit register represented in 32 - bit integer format is passed via communications as two 16 - bit registers: High - Order Register = value / 65536
61 Peak Performer 1 User Manual Low - Order Register = value modulus Example (Unsigned 32-bit): Value is passed in unsigned 32 bit integer format: = 00BC614E Hex High Order = 00BCHex Low Order = 614EHex Example (Signed 32-bit): Value is passed in signed 32 bit integer format: = FF439EB2 Hex High Order = FF43 Hex Low Order = 9EB2 Hex Packed Boolean Format: Boolean registers are packed into a single Modbus register. The Boolean outputs corresponds to one bit in the single output register of the module. The relationship is left to right: the first input register corresponds to the left - most bit in the 16 - bit output register, etc. Example (Packed Boolean Format): Twelve Boolean registers are linked to a single Modbus register, which is configured for Packed Boolean output format. If the first three are valued False, the next four are True, and the remaining five are valued False, the output register value is: Register: Bin = 1E00 Hex 8CharString Format: The 8CharString or eight-character-string register format is four 16 - bit Modbus Holding Registers that hold a total of eight ASCII characters Broadcast Packets: The purpose of a broadcast request packet is to allow all slave devices to receive the same request command from the master. A broadcast request packet is the same as a normal request packet, except the slave address field is set to zero (0). All Modbus slave devices receive and execute a broadcast request command, but no device will respond. The PP1 does not support broadcast request packets. Exception Responses: If a Modbus master device sends an invalid command to a PP1 or attempts to read an invalid holding register, an exception response is generated. The exception response follows the standard packet format. The high order bit of the function code in an exception response is set to 1. The data field of an exception response contains the exception error code. The table below describes the exception codes supported by the PP1 and the possible causes. Page#61
62 Peak Performer 1 User Manual Return Function Function Description An invalid command is contained in the function field of the request packet. 01 The PP1 only supports Modbus functions 03 and 06. The address referenced in the data field is an invalid address for the 02 specified function. This can also indicate that the registers requested are not within the valid register range of the PP1. The value referenced in the data field is not allowed for the referenced 03 register. 04 The LRC checksum is invalid. Table 2: Exception Codes supported by the PP1 Exception Response Packet: Slave Address Modbus Function Exception Code LRC Checksum 8 F E B PP1 Modbus Registers Map: The PP1 Modbus holding register map defines a set of parameters which are treated as holding registers, having addresses 4XXXX. According to the Modbus protocol, in response to a request for register 4XXXX of a particular slave device, the Modbus master reads register XXXX - 1from the slave. For example, Modbus register corresponds to holding register 53. There are two classes of Modbus registers within the PP1, Modbus Output Registers, and External Control Registers. See Table 3 below. Page#62
63 Peak Performer 1 User Manual PP1 Modbus Holding Registers Map Modbus Register PP1 Description Format Properties Unit serial number UINT16 Read Main controller software version UINT16 Read Detector type (RCP, FID, PDD, TCD) UINT16 Read Run Mode(Idle, Single, Cycle, RR, Stream) UINT16 Read/Write Run Counter UINT16 Read General Alarm Status UINT16 Read FID Flame Out Alarm Detail Status UINT16 Read Heater Status Zone 1 (On/Off) UINT16 Read Heater Set Point Zone 1 UINT16 Read Heater Temperature Zone 1 UINT16 Read Heater Status Zone 2 (On/Off) UINT16 Read Heat Set Point Zone 2 UINT16 Read Heater Temperature Zone 2 UINT16 Read Spare Compound #1 Name 8CharString Read Compound #1 Area Counts UINT32 Read Compound #1 Concentration (PPB/10) UINT32 Read Spare Compound #2 Name 8CharString Read Compound #2 Area Counts UINT32 Read Compound #2 Concentration (PPB/10) UINT32 Read Spare Compound #3 Name 8CharString Read Compound #3 Area Counts UINT32 Read Compound #3 Concentration (PPB/10) UINT32 Read Spare Compound #4 Name 8CharString Read Compound #4 Area Counts UINT32 Read Compound #4 Concentration (PPB/10) UINT32 Read Spare Compound #5 Name 8CharString Read Compound #5 Area Counts UINT32 Read Compound #5 Concentration (PPB/10) UINT32 Read Spare Compound #6 Name 8CharString Read Compound #6 Area Counts UINT32 Read Compound #6 Concentration (PPB/10) UINT32 Read Spare - - Table 3: Modbus Holding Registers Supported by the PP1 Page#63
64 Peak Performer 1 User Manual Detail Alarm Status is in the Packed Boolean Format Bit Number Spares Parameter Change, Update Needed System Parameters Corrupted Stream Selector Program Error Event Program Load Error Detector Power Error Detector High Voltage Error FID Flame Temp. Out of Range Vlamp Low Voltage Out of Range Detector Zeroing Target Error Heater Modulation Error Temperature Zone Disabled Temperature Zone Out of Range Detector Communication Error Setting the PP1 Run Mode: The Run Mode is set via the Preset Single Register command, Function 06. There are four Run Modes that the PP1 can be set to, Idle, Single, Cycle, and Stream. Idle = 0 Single =1 Cycle = 2 Re-Run = 3 Stream = 4 Setting the Run Mode Packet Example: In the next example, the Run Mode is set to CYCLE by sending a 2 in the data field. The PP1 s Modbus slave address is 143 and the master requests to write the value of 3 to Modbus register (40004). In accordance with the Modbus protocol, register is numbered as address 3 when requested. Slave Address: 143 = 8F (Hex) Modbus Function: 06 =06 (Hex) Starting Register: 3 = 0003 (Hex) Preset Data: 3 =0002 (Hex) Request Packet: non-shaded background denotes the DATA field of the packet. Slave Address Modbus Function Starting Register (40004) Preset Data(3) LRC Checksu m 8 F Page#64
65 Peak Performer 1 User Manual 6.5 Trend / Analog Outputs There are seven independent analog outputs on the back of the PP1. The first six are tied to the six impurities as trend outputs and the last channel is a simple recorder output. These trend outputs are provided via VDC screw terminals. Each impurity can be independently scaled by entering the desired range (e.g., 0 > 1000 = 0 to 1000 ppb = 0 1 VDC scale. At the end of each run, the analog trend signal is updated and holds until the end of the next run is completed. As an accessory, Peak can provide standard commercial VDC to ma converters as needed. 6.6 Setting up a RS485 Network The RS-485 specification supports two-wire half-duplex communications (only one unit may transmit at a time), but allows up to 32 users on a party line network. NOTE: The RS-422 specification supports four-wire full-duplex communications (two units may transmit at a time) and also allows up to 32 users on a party line network. The following information is provided to enable the users to install the Peak Performer 1 into a RS-485 network. This system diagram consists of the PP1, RS-232 to RS-485 converter, and master host controller. Figure 42. System configuration diagram with basic connections RS232 to RS485 Converters There are numerous manufacturers of RS232 to RS485 converters and the selection of the converter must be determined by the system engineer / designer to meet unique requirements. Page#65
66 Peak Performer 1 User Manual 7.0 Chromatographic Principles As an analytical system, the PP1 - FID performs four primary functions: Sample injection Component separation Component analysis Integrated microprocessor system control with operator and data interface 7.1 Sample Injection A standard, air-actuated VICI injection valve is used to inject samples. Standard FID analysis methods use stainless steel 5 cc sample loops. 7.2 Carrier Gas Purification Chromatographic instrument detection limit is directly related to carrier gas purity. Improved carrier gas purity enables improved sensitivity. Typical Nitrogen % Carrier Gas Specifications (Pre-Purification) Source Gas Type THC Concentration CO, CO2 Concentration O2 Concentration High Pressure Cylinder or Liquid Dewar N 2 (Ar, He alternative) < 1 ppm < 3 ppm < 3 ppm H2, H2O Concentration < 3 ppm Consequently, the analyzer s minimum detectable quantity (MDQ) would be quite high (> 10 ppm) unless the carrier gas is purified. Peak recommends use of the best quality heated metal getter purifier available for carrier gas purification. This style of purifier typically has a hot catalyst element ahead of the heated getter material for complete removed of methane hydrocarbon (CH4), a common contaminant in commercial nitrogen sources. Hydrogen, Carbon Monoxide, Carbon Dioxide, Hydrocarbons and Moisture carrier gas impurities can be reduced to less than 1 ppb by this type of purifier. Page#66
67 Peak Performer 1 User Manual Gas Purifier Specifications Type Maximum Flowrate Gases Purified THC Concentration (outlet) CO, CO 2 Concentration (outlet) H 2, H 2O Concentration (outlet) Expected Life Heated Reactive Metal Getter >300 cc/min, < 5 L/min N2 (Ar, He alternative) < 1 ppb < 1 ppb < 1 ppb Consult Manufacturer 7.3 Component Separation Component separation is normally performed by isothermal packed analytical columns. Column materials vary by application and are noted in the test report documentation. Contact Peak Laboratories for additional details specific to your application. In general applications, samples are introduced into the instrument through the SAMPLE IN connection. A controlled portion of the sample gas is injected via the pneumatically actuated gas sampling valve into the carrier flow path. The injected sample passes onto the head of the analytical column(s) inside the isothermal column oven and moves through the analytical column, where the separation of the components begins. The analytes of interest are further refined and methanized on the optional Ruthenium catalyst and continue on to the detector for quantification. Page#67
68 Peak Performer 1 User Manual Figure 43. Typical FID plumbing diagram Immediately after injection, the entire contents of the sample loop are moved to the head of the column(s) and component separation begins. Figure 44. Peak Development on the Analytical Column Soon After Injection Page#68
69 Peak Performer 1 User Manual Figure 45. Peak Development Midway on the Analytical Column Figure 46. Peak Development Midway on the Analytical Column Analytes of interest can be allowed to continue on to the detector as long as desired. In some cases, the resulting chromatogram can become quite long in duration. In other circumstances, it is not necessary to quantify all possible peaks, and the remaining balance of the sample is back flushed to vent or detector. Page#69
70 Peak Performer 1 User Manual Figure 47. Peak Development on the Analytical Column After Backflush Figure 48. The Completed Chromatogram 7.4 Flow Venting and Balancing Several problems can arise in the development of the chromatogram: Presence of compounds that may be damaging to the detector Disproportionate peak sizes Length of analysis Several models of Peak analyzers are equipped with one or two valve plumbing arrangements to handle these situations. Often a second valve is used to perform cutting actions at particular times during the chromatogram, redirecting the column effluent towards a safe flow controlled vent outlet. During the cutting action, it is necessary to maintain pure gas flow to the detector. This pure gas flow is provided by an additional branch on the internal carrier gas main line feeding other ports on the valve. Ultra-high purity flow control components can be bulky and expensive. To diminish installed cost of flow control components, Peak has chosen a different method based upon flow restrictors to create a flow divider. A typical flow divider is shown in Figure 50. Page#70

.")
71 Peak Performer 1 User Manual Figure 49. Flow Divider Schematic The gas flow path to the detector is extremely clean and free of moving parts. The gas passing from the main flow limiting restrictor can be split to follow both gas paths. Studying the schematic, it can be seen that the detector flow can be adjusted by changing the amount of gas that is allowed to exit via the excess flow vent; as more gas exits the excess flow vent, less gas is available to flow towards the detector. The controlling needle valves for detector flow rate and column venting are co-mounted in the chassis for convenience. (see Figure 61). The detector flow control needle valve is color-coded red. Differences in DETECTOR flow during normal and venting valve positions can be expressed as shifts in detector baseline. Careful adjustment of the detector flow control needle valve will enable the operator to minimize baseline drift and create a smooth chromatogram. Figure 50. Properly Flow Balanced Detector Baseline Page#71
 Figure 52.")

72 Peak Performer 1 User Manual Figure 51. High FID flow from NV1 (note rise after the V2 CCW command) Figure 52. Low FID flow from NV1 (note drop after the V2 CCW command) Differences in COLUMN flow during normal and venting valve positions will be expressed as shifts in peak retention time compared to a chromatogram without any venting action. Page#72


73 Peak Performer 1 User Manual CH4 RT = 93 sec CH4 RT = 97 sec NV2 Flow = 59 sccm NV2 Flow = 39 sccm NV2 Flow = 79 sccm CH4 RT = 102 sec Figure 53. Peak Shifting as a Result of Improper Vent Needle Valve Flow Comparison of retention times for un-vented versus vented chromatograms will reveal improper adjustment of the vent flow control needle valve. Careful adjustment of the vent needle valve will enable the operator to minimize peak retention drift and create a consistent chromatogram. 7.5 Effects of Temperature and Flow on Analytical Columns The normal chromatogram can be affected by changes in column flow and temperature. Be aware that changes of operating parameters from final test conditions can require parametric adjustments (i.e. peak detection parameters, response factors, valve timing) within the analyzer. Figure 54. Standard chromatogram Page#73
 forward.")

74 Peak Performer 1 User Manual The normal PP1 chromatogram (Figure 55) is affected by changes in column temperature as illustrated in comparison with the chromatogram of Figure 56. In the circumstance of column temperature change, an increase of 30C has shifted the late eluting peak (carbon monoxide) forward. Early eluting peaks such as hydrogen are not significantly affected by changes in column temperature as interaction with column packing is minimal. Figure 55. Effect of 30C Increase in Column Temperature Column flow rate changes can directly affect peak retention times as peaks are pushed down the column faster or slower. Comparison of Figure 57 with Figure 55 shows the decreased peak retention times Figure 56. Effect of 2X Increase in Column Flow Rate Page#74
75 Peak Performer 1 User Manual 7.6 Peak Identification and Quantification A typical chromatographic peak is generated by the detector s electronic signal as a function of time Figure 57. Typical Chromatographic Detector Signal Showing a Peak Chromatographic peaks in the PP1 are measured by establishment of the normal stable detector signal, then determining the added electronic signal that was created by the peak passing through the detector. Since the analyzer is monitoring the detector electronic signal over time, the added signal is measured in real units such as volt-sec. By virtue of a conversion factor (called the Response Factor), the volt-sec signal can be directly related to concentration units. Page#75

.")
76 Peak Performer 1 User Manual Figure 58. Illustration of Measurement of Chromatographic Peak Area Note: The PP1 analyzer supports only area-based concentration determinations. Determinations based upon peak height as not currently available. The first task in quantifying peaks is establishment of the normal stable detector signal ( baseline ). This is accomplished by determining the signal departure and return points for the peak event. The parameters used when defining detector baseline signal and peaks are: Page#76 Figure 59. Typical PP1 Peak Analysis Database
77 Peak Performer 1 User Manual Figure 60. Illustration of Chromatographic Peak Parameters Name = The peak identification tag, expressed as 5 alphanumeric characters (A-Z, 0-9) PkCen = The normally expected peak retention time (in seconds), used for assigning the appropriate Name LW = The typical time span measured from the start of the peak s baseline rise to the peak apex PkCen (in seconds). Minimum value is 3, maximum is 35 RW = The typical time span measured from the peak s apex PkCen to the end of the peak s baseline decline (in seconds) Minimum value is 3, maximum is 35 PkWin = Total tolerance window (in seconds) for assignment of a Name to a quantified chromatographic peak. The tolerance window is centered upon the PkCen value. NOTE: The peak top detection algorithm processes only the data within this window. PkHgt = A variable for establishing the cross-over point in peak detection modes. Chromatographic peaks higher than this parameter will be quantified using the Variable mode heights, peaks with height less than or equal to PkHgt will be quantified using the ForceB mode. Flt = The convolution filter value expressing the overall peak shape. Flt = 2 is recommended for sharp, narrow peaks such as H2, and Flt = 8 is recommended for broad peaks such as CO. For good peak quantification, it is important to consistently determine when the peak begins (the positive increase in detector signal), when the signal maximum occurs, and when the peak ends (the return to stable detector signal). PkCen, LW, and RW are used to establish starting and ending points for mathematical analysis of the baseline. Page#77

78 Peak Performer 1 User Manual All modes of peak are calculation require locating the peak top, usually the point of maximum peak signal. In cases where the detector signal is strong, locating the peak maximum value is straightforward. Often the concentration regime of interest is the opposite case, where it is desirable to detect and extract the smallest possible peak signal. Under these circumstances, it is advantageous to utilize signal processing techniques that magnify signal differences. Mathematical convolution is one such method. Convolution rolls two waveforms together as the product of data matrices, with the resulting new waveform having exaggerated characteristics. Figure 61. Convolution to Enhance Signal Characteristics As seen in Figure 61, it is much simpler to identify the peak maximum on the convolved baseline. Convolution functions work best when the convolving peak (filter) width closely matches the expected chromatographic peak width. Page#78
79 Peak Performer 1 User Manual Chromatographic peak width can vary significantly depending upon column selection, detector characteristics, sample loop size, etc. Consequently, there are several different convolving peak widths available in the PP1 s mathematics package; Flt =1 is the narrowest filter width, Flt =8 is the widest filter width. NOTE: Final determination of the optimum filter width is best performed by reprocessing chromatograms representing typical peaks Peak Quantification : Baseline Mode When the PkHgt variable is set to zero, the Baseline Mode of detector baseline is enabled. In this mode, the normal detector baseline is calculated very simply: Peak start time = [PkCen LW]) Peak end time = [PkCen + RW]) All other possible aspects of peak start and end time determination are disabled and the normal detector baseline is rigidly established only by the Peak Database parameters. Figure 62. Baseline as Established in Baseline Mode Peaks quantified using this method are denoted with an B in the last column of the data report Peak Quantification: Fixed Width Mode The Fixed Width Mode is enabled when the maximum detector signal value at the calculated peak maximum signal is less than the PkHgt parameter value, but is greater than zero. Page#79
80 Peak Performer 1 User Manual The time associated with the peak maximum signal must be within the time regime of interest (= [PkCen +/ ½ PkWin]) for any peak quantification to occur. In Fixed Width Mode, the normal detector baseline is calculated based upon the peak maximum signal time value, rather than the PkCen value. Peak start time = [Peak signal maximum time value LW] Peak end time = [Peak signal maximum time value + RW] Figure 63. Baseline as Established in Fixed Width Mode Peaks are quantified using this method are denoted with an F in the last column of the data report Peak Quantification : Variable Mode If the peak maximum signal value exceeds the PkHgt value, the Variable Mode is enabled for determination of peak start and end points. The time associated with the peak maximum signal is always calculated first for Forced Baseline and Variable modes by using the convolution filter to find the maximum detector signal point. Page#80

81 Peak Performer 1 User Manual Figure 64. Initial parameters for Baseline Determination Initially, the mathematics package makes a trial evaluation of peak area using a fixed percentage of the LW and RW values as initial baseline points, illustrated as the hypothetical baseline between points 2/3 of LW and 2/3/ of RW in Figure 65. The hypothetical calculation of the peak start time is labeled L in Figure 66. Figure 65. Progression of Peak Start Time Calculation After calculating the hypothetical peak area based upon the L and R values, the mathematics package makes another peak area calculation, using a slightly earlier time value. The peak areas of the two calculations are compared, and if the peak area increases by more than +0.5%, the mathematics package repeats the process. The net effect is illustrated in Figure 66, where multiple hypothetical peak start points were evaluated. The final value is represented by point 5, when the change in peak area became less than +0.5%. Page#81

82 Peak Performer 1 User Manual The trial evaluation of peak area continues for the peak ending point, again using a fixed percentage of the LW and RW values as intial baseline points, again illustrated as the hypothetical baseline between points L and R in Figure 67. The first hypothetical calculation of the peak end time is labeled 1 in Figure 67. After calculating the hypothetical peak area, the mathematics package makes another peak area calculation, using a slightly later time value. The peak areas of the two calculations are compared, and if the peak area increases by more than +0.5%, the mathematics package repeats the process. The net effect is illustrated in Figure 67, where multiple hypothetical peak start points were evaluated. The final value is represented by point 6, when the change in peak area became less than +0.5%. Figure 66. Progression of Peak End Time Calculation Using the newly established peak start and end times, the mathematics package determines the normal detector baseline, as illustrated in Figure 68. The signal contribution due to the peak passing through the detector can then be quantified by area calculation using time slices and signal differentials above the newly established baseline. Page#82
83 Peak Performer 1 User Manual Figure 67. Peak Area Calculation The formula for peak area calculation can be expressed as: Peak Area = (½ x [Hgt 1 + Hgt 2] x t 1) + (½ x [Hgt 2 + Hgt 3] x t 2) + (½ x [Hgt 3 + Hgt 4] x t 3) + where: Hgt x = the signal differential between the instantaneous baseline level and the peak signal value t x = the time difference between data points Using a constant value for t x, the peak area calculation simplifies to: Peak Area = t x x [Hgt 1 + Hgt 2 + Hgt 3 + Hgt 4 + ] Peaks quantified using the Variable method are denoted with a V in the last column of the data report. Page#83
84 Peak Performer 1 User Manual 7.7 Chromatographic Stabilization of the Analyzer When Injecting O2 Samples O2 samples present particular challenges for the FID PP1 analyzer due to the extreme reactivity of ~100% O2 with any possible carbon source even at relatively low temperatures via these basic reactions: 2C + O 2 => 2CO C + O 2 => CO 2 Potential carbon sources include residual carbon within stainless steel tubing and valve bodies, polymeric valve components, and column packing materials. CO and CO 2 produced from these sources can be detected in the FID and create a wide variety of symptoms: Unstable detector baseline False positive peaks when measuring pure O 2 samples Difficult small peak quantification Transient peaks in the chromatogram The chromatographic parameters for the FID O2 analyzers are adjusted to minimize this reactivity the 93 HayeSep D columns used for O2 analysis are unique undergoing an extensive set of proprietary processes for stabilizing the material for O2 service. Do not use HayeSep D columns intended for Inert gas sampling in an FID O2 PP1 the detection limit of the analyzer will be severely compromised. Additionally, the analytical cycle time for the FID O2 analysis is longer than normal. The column temperature for FID O2 analyzers is set at 45C to retard the carbon reactions and this creates a longer chromatographic cycle. Page#84
 Figure 68.")

85 Detector Signal (Vout) Peak Performer 1 User Manual FID PP1 Stabilization to O2 Samples O2 Upset - Unvented CH4 Peak At the Start of O2 Sampling After 0.8 Hours of O2 Sampling After 16.5 Hours of O2 Sampling After 19 Hours of O2 Sampling CO2 Peak V1 CCW Time (seconds) Figure 68. A Sequence of O2 Sample Chromatograms Showing Improvements With Additional Injections Figure 69 overlays several O2 chromatograms over a period of ~ 19 hours. The overall chromatogram undergoes a significant shift as more O2 samples are taken: Decreasing magnitude of the O2 upset Improved baseline resolution at the CH4 peak leading edge Improved baseline stability at the CH4 peak trailing edge Improved baseline stability at the CO2 peak retention time Each of these chromatographic changes will directly enhance the lower detection limit of the analyzer by making it easier to clearly define peak start / end points and peak magnitude. These chromatographic improvements occur as the free carbon on the internal surfaces of the analyzer system is consumed. Many of the sources (i.e. polymeric valve seals) do not become carbon-free over time, however the available surface carbon can become greatly diminished with continuous exposure to O2. Free carbon may reside within the main body of materials in the system, and diffusion forces may bring this carbon load to the surface again during idle analyzer times. Consequently, it is not unusual to see these instabilities reappear in a previously clean system after extended periods of inactivity. The new free carbon can again be diminished by continuous exposure to O2. ****CAUTION*** Under certain circumstances, the reduction of the analyzer surface carbon may be accelerated with above-normal operating temperatures Page#85
86 Peak Performer 1 User Manual and continuous exposure to O2. As a general rule, O2 conditioning temperatures are much lower than standard conditioning temperatures the high reactivity of pure O2 with polymers at elevated temperatures can easily destroy the valve seals and column packing materials. If O2 is being sampled, do not exceed 100C for the FID s Column temperature zone, and 325C for the Methanizer temperature zone. To achieve maximum analyzer performance when measuring O2 samples, Peak Labs recommends continuous O2 sample cycling to minimize surface carbon reactions. Page#86
87 Peak Performer 1 User Manual 8.0 Flame Ionization Detector (FID) ** CAUTION** Do not begin detector heating without carrier gas flow. Damage to the detector may result. ** CAUTION *** The maximum Column temperature is 200 o C. ** CAUTION ** The normal FID operating temperatures is 295 o C. Maximum temperature is 350 o C The FID detector does not normally require conditioning treatment, however it does require 8 to 12 hours at normal operating temperature before flame ignition to achieve optimum stable performance. Normal detector operating temperature for the FID is 295 o C, although operating temperatures vary with the specific application. The table below illustrates some typical compounds and detection capabilities of the FID. Detected Compound Hydrogen Carbon Monoxide Carbon Dioxide Methane Other Hydrocarbons Helium Argon Nitrogen Oxygen Typical Detection Limit No Significant Response < 10 ppb < 800 ppt < 500 ppt < 800 ppt No Significant Response No Significant Response No Significant Response No Significant Response 8.1 Flame Ionization Detector Principles Carrier gas containing the compounds from the column passes directly into mixing tee where H2 for combustion and methanization is added. At the heated flame tip with the FID tower, this gas stream is bathed in a cylindrical flow of combustion air, and the H2 / O2 flame is ignited. Within this flame, the following general reactions occur : (reactions are left unbalanced for simplicity) Page#87
88 Peak Performer 1 User Manual H 2 + O 2 => H 2O + Heat and CH 4 + O 2 + Heat => CHO + + H 2O + e - Depending upon operating parameters, this reaction releases electrons until the end reaction products are reached. These electrons are collected and the resulting current measurement is used for quantification. The net result is, in simplest terms, that electrons are released in direct proportion to the number of carbon atoms present. C 3H 8 + O 2 + Heat => 3CHO + + H 2O + 3e - Therefore, instrument response is directly proportional to the number of carbon atoms present in the compound being measured. Unfortunately, the ionization efficiency of the flame is relatively low, and roughly 1 in 10,000 hydrocarbon molecules follows the electron liberating reaction path described. The vast majority of combustion reactions follow the direct net product reaction : 2CH 4 + 4O 2 => 2CO 2 + 4H 2O + Heat This reaction sequence is applicable to any hydrocarbon. It can be seen that the FID is a mass flow type of detector the number of ions created is independent of carrier flow, therefore detector response is the same regardless of carrier flow rate. Figure 69. Standard FID Section Page#88
89 Measured Concentration (ppb) Peak Performer 1 User Manual Normal life of the methanizer is approximately 84 months under continuous use. Replace and dispose of properly in accordance with local and federal regulations. 8.2 Temperature Effects Within The Methanizer and FID Tower The FID Tower is heated indirectly by the methanizer block to roughly 95 C to minimize moisture condensation. It is critical to allow the FID Tower to heat thoroughly before igniting the flame. Failure to do so may trap moisture within the FID Tower and compromise the ceramic insulators. Between the temperatures of 250 C and 325 C, this reaction on the surface of the Ruthenium Oxide catalyst can proceed: CO 2 + 4H 2 => CH 4 and CO + 3H 2 => CH 4 + 2H 2O + H 2O The rate and completion of these reactions is dependent upon temperature and residence time. It is critical to note that the catalyst reaction can halted by the presence of moisture in the gas stream, particularly if the hydrogen for methanization has high moisture content. Above 360 C, CO thermally decomposes on the catalyst surface and methanization is not possible. The Peak Lab FID methanizer has been optimized for methanization of CO 2, since under normal FID chromatographic applications, the CO peak is not chemically distinct. Peak Labs recommends the use of the RCP models for the measurement of CO as the RCP applications provide chemical specificity for CO measurement. Low Level Linearity Measured Concentration as a Function of Blended Concentration - Single Mode Flame Ionization CO CH4 CO2 NMHC Blended Concentration (ppb) Figure 70. FID Linearity - < 100 ppb CO, CH 4, CO 2 and NMHC Page#89
 Figure 71.")
90 Relative Area Response Signal to Noise Ratio Measured Concentration (ppb) Peak Performer 1 User Manual Dynamic Range Measured Concentration as a Function of Blended Concentration - Single Mode Flame Ionization Detector CO CH4 CO2 NMHC Blended Concentration (ppb) Figure 71. FID Response Curve, Showing Linear Range 8.3 Detector Flow Rate Effects Carrier gas flow rate through the FID does not influence the rate of CH 4 ionization. However, the detector response can be influenced by the relative amounts fuel, combustion oxygen, and inert carrier gas present. FID Response With Varying H2 Flow (FID 200 sccm & 55 sccm) 140.0% 120.0% 100.0% 80.0% 60.0% 40.0% 20.0% CH4 CO2 Signal to Noise % Total H2 Flow to Flame Tip (cc/min) Figure 72. FID Response to Varying H 2 Flow Note that the analyzer is relatively insensitive to H 2 flow rate changes between 33 and 43 sccm. Detector signal to noise is roughly maximized in the same regime. Page#90
91 Relative Area Response Signal to Noise Ratio Peak Performer 1 User Manual FID Response With Varying Air Flow 40sccm & 55 sccm) 140.0% 120.0% % 80.0% % 40.0% CH4 CO % 0.0% Signal to Noise Total FID Air Flow (cc/min) Figure 73. FID Response to Varying Air Flow Note that the analyzer is relatively insensitive to Air flow rate above 200 sccm, and detector signal to noise reaches a stable value above 200 sccm. Peak Labs recommends that the analyzer be operated in the flow regions that yield the most stable response and signal to noise characteristics 8.4 Resolving Random Spikes on the FID Baseline There are two primary causes for random baseline spikes appearing on the chromatogram: Figure 74. Chromatograms Showing Random Baseline Spikes Due to Moisture Page#91
92 Peak Performer 1 User Manual Restriction of Water Flow Out of the FID Drain Line Cause: Any restriction or reduction in size (< ¼ inside diameter), or sagging portion of the FID Drain line can create the opportunity for water bubbles to form with the FID Drain Line. These bubbles can create momentary back-pressure within the entire FID as they are forced down the drain line to the exit point. The induced pressure variations will create random, momentary spikes on the FID chromatogram. Corrective Actions: a) Examine the entire FID Drain Line and verify that no reduction in internal diameter occur along it s entire length. b) Examine the FID Drain Line over it s entire length and verify that no horizontal or sagging sections where bubbles can form exists. c) Verify that the exit of the FID Drain Line is not submerged Moisture Trapped Within the FID Tower Cause: The flame within the FID Tower is ignited prematurely (at FID Flame < 90 C), or power was lost and the FID Tower temperature dropped below 100 C while the flame was still lit. Under these circumstances, condensed moisture can become trapped within the FID Tower. Trapped moisture can compromise the electrical insulators inside the FID Tower and create false signal readings. Corrective Action: a) Reduce only the FID H2 pressure to zero to eliminate the FID Flame this eliminates the source of moisture within the FID Tower. Keep all other flows as normally specified. b) Increase the Methanizer temperature to 350 C for 8 to 16 hours to thoroughly heat the FID Tower and drive out trapped moisture. c) After 8 to 16 hours, restore the Methanizer temperature to 295 C, restore FID H2 flow and re-ignite the flame. On occasion, moisture can also become trapped under the FID Tower Cap at the O-ring seal. This moisture can be eliminated by simply removing and restoring the FID Tower Cap the act of removal shifts the O-ring enough that the moisture is ejected. To perform this action: d) Reduce only the FID H2 pressure to zero to eliminate the FID Flame this eliminates the source of moisture within the FID Tower. Keep all other flows as normally specified. e) Remove the analyzer top cover. f) Remove the single retaining screw on the top of the FID Oven Cover. g) Gently pull back any insulation that covers the top of the FID Tower. h) Remove the ¼ hexagonal standoff that retains the FID Tower Cap i) Using a pair of pliers (the cap is roughly 100 C), gently rock and lift the FID Tower Cap approximately ½ until it is completely clear to the FID Tower top surface. Page#92
93 Peak Performer 1 User Manual j) Replace the FID Tower Cap on the FID Tower and rock gently the cap down into position. k) Reinstall the ¼ hexagonal standoff. l) Replace any insulation. m) Reinstall the FID Oven Cover. Vacuum any loose insulation shreds from the instrument. n) Reinstall the analyzer s top cover. Page#93
 5. VALVE 2 (4 PORT) 6. FID H 2 INLET: TO FID BASE 7. COLUMN OVEN WITHOUT COVER 8. FID CONTROLLER OCB ASSEMBLY AND COVER 9.")
94 Peak Performer 1 User Manual 9.0 Analyzer, FID Maintenance and Service Procedures Figure 75. Chassis Overview PEAK PERFORMER 1 FID COMPONENT LAYOUT 1. MCPU PCB ASSEMBLY 2. LCD/ TOUCHSCREEN ASSEMBLY 3. FLOW CONTROL NEEDLE VALVE ASSEMBLY 4. VALVE 1 (10 PORT) 5. VALVE 2 (4 PORT) 6. FID H 2 INLET: TO FID BASE 7. COLUMN OVEN WITHOUT COVER 8. FID CONTROLLER OCB ASSEMBLY AND COVER 9. FID DETECTOR WITH COVER 10. FID AIR INLET: TO FID BASE 11. REAR PANEL PCB ASSEMBLY (INCLUDES MAIN DC POWER SUPPLY) Page#94

95 Peak Performer 1 User Manual 9.1 Peak Performer 1 System Block Diagram Figure 76. PP1 Functional Block and Interconnect Diagram Page#95
96 Peak Performer 1 User Manual 9.2 Monitor Regulator Pressures Carrier supply settings should not vary. Carrier and Actuator Air settings may shift when supply cylinders run low due to regulator creep and should be checked periodically to maintain consistent gas flows and peak retention times. Varying carrier pressures can cause peaks to shift out of set retention times and not be flagged properly. Critical operating parameters are listed on the top page of the Final Test Data shipped with the analyzer. Peak Labs recommends the user create a logbook of critical parameters on a routine basis as an aid to troubleshooting. Suggested parameters for frequent logging are: Analyzer S/N: Date and Time: Carrier Gas Type: Carrier Gas Supply Pressure: Carrier Gas Flow at Front Panel Bypass Out Port: Carrier Gas Flow at NV1 Outlet (V1 CCW): Carrier Gas Flow at NV2 Outlet: (V1 CCW) FID H2 Gas Supply Pressure: FID Air Gas Supply Pressure Actuator Gas Supply Pressure: Sample Gas Type: Sample Gas Flow at Rear Panel Sample Out Port: Column Set point and Measured Temperature: Detector Set point and Measured Temperature: FID Vout Signal (after zeroing): FID Flame Reading: Rfactor for compounds 1, 2, 3 & 4 (from Calibration Database screen) PkCen for compounds 1, 2, 3 & 4 (from Analysis Database screen) Other critical parameters that should be verified occasionally: Actuator Gas Type: Port 1 Protocol Setting Port 2 Protocol Setting Calibration Database Screen Parameters (all) Analog Interface Screen Parameters (all) Analysis Database Screen Parameters (all) Event Program Editor Screen Parameters (for all active Event Programs) Page#96
97 Peak Performer 1 User Manual 9.3 Verifying Valve Integrity (Carrier Blank, Zero Gas) In addition to periodic calibration checks, the integrity of the rotary valve seal must be tested. Determination of valve seal quality is performed by analyzing known purified gas as a sample. 1) Connect the front panel SAMPLE IN port to the front panel BYPASS OUT port. This will begin flow of purified gas through the sample loop. 2) Wait 10 minutes to purge the analyzer completely of any residual gas samples. 3) Initiate a standard sampling run in CYCLE mode. 4) Collect 5 sample runs with Peak Viewer. 5) Average the concentration data of the 5 runs for each peak of interest. 6) Average readings higher than 1 ppb for any compound indicates a loss of valve seal integrity and possibly suggests valve head replacement is necessary. Page#97

98 9.4 Start-up Sequence for Replacement Methanizer 1. Allow the methanizer heater zone to cool to 60ºC 2. Turn off power to analyzer. Unplug the AC power cord. 3. Turn off the FID H2 and FID Air supplies to the analyzer. Leave carrier gas flowing at normal pressures. 4. Remove the PP1 top cover. 5. Locate the FID Module in the rear of the PP chassis. Figure 77. FID Module 6. Remove the FID oven Cover Figure 78. FID Module with cover removed Page#98


99 7. Remove the methanizer insulation and stuffing from the front of the methanizer heater block. Figure 79. FID Module with insulation removed 8. Use a #2 Phillips screwdriver to remove the methanizer cover retaining screw. Remove the cover and expose the methanizer. Figure 80. Removing the retaining screw Page#99


100 9. Vacuum insulation debris from the FID Module area and loosen the methanizer from the block with long-nosed pliers 10. Uncouple the methanizer inlet and outlet 1/16 VICI fittings from the VICI T s. Inlet Figure 81a. Removing inlet 1/16 fittings from the VICI T s Outlet Figure 81b. Removing outlet 1/16 fittings from the VICI T s Page#100
101 11. Remove the methanizer from the methanizer heater block. 12. Install the replacement methanizer into the heater block. 13. Re-install the methanizer block. 14. Connect and fully tighten the 1/16 VICI fittings to the VICI T s 15. Re-install the FID Oven insulation, taking care to not disturb the heater and thermocouple leads. 16. Re-install the FID oven cover, making sure that the heater and thermocouple leads are not stressed and exit through the lower notch in the FID oven cover. 17. Vacuum any loose insulation remaining in the chassis 18. Re-install the PP1 top cover 19. Plug in the AC power cord, re-energize the analyzer, and turn on the Methanizer and Column heater zones. 20. Adjust the Methanizer heater zone temperature to 375ºC 21. Allow the FID FLAME temperature to reach a minimum reading of 85ºC 22. Pressurize the FID H2 supply to normal pressure (typically ~25 psig) 23. Pressurize the FID Air supply to normal pressure (typically~20 psig) 24. Ignite the FID flame. 25. The FID FLAME temperature will increase, allow it to stabilize for 4 to 12 hours. 26. After the stabilization period, lower Methanizer heater zone temperature to 295ºC 27. Allow the Methanizer heater zone temperature to stabilize at 295ºC for at least 15 minutes before running samples. **NOTE: Full re-calibration is recommended after methanizer replacement. Refer to Section 3.6. Page#101
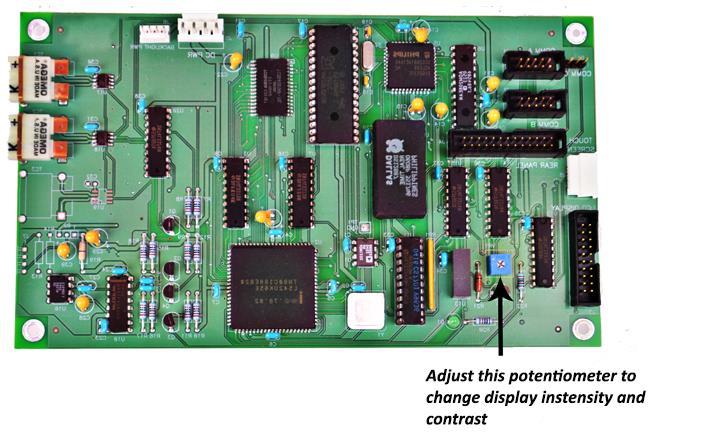

102 Adjusting the LCD Contrast Figure 82a. View of the MCPU Showing the LCD Contrast Potentiometer (MCPU adjustments for software versions 1-3) Figure 82b. View of the MCPU Showing the LCD Contrast Potentiometer (MCPU adjustments for software versions 4 and above) Page#102
103 9.6 ALTERING THE ANALYTICAL RANGE OF THE INSTRUMENT Sample loops are very easy to customize. 1) Determine the desired loop volume. Analytical range is directly proportional to sample loop size 2) Select tubing (tube internal diameter) to use. In general, use the largest ID tube possible to avoid flow restrictions. Guidelines: 0.040" ID for 3/8 cc to 2 cc loops 0.030" ID for 3/16 cc to 1/2 cc loops 0.020" ID for 50 ul to 1/4 cc loops Note: the shortest practical length of tubing for a sample loop is about 8 inches. Note: Do not use tubing less than 0.016" ID as it acts like a flow restrictor, instead of a sample loop 3) The correct length for the loop tubing is calculated as follows: Internal volume (V in cc's) = [ x ID ^ 2 (in inches) ] x L (in inches) x / 4 re-arranging: L (in inches) = x [ V (in cc's)] / [ ID ^ 2 (in inches)] an example for a 1 cc loop: L (inches) = x 1cc / (0.040" ^2) = 49 inches tube length 4) Measure to length, cut, and install VICI fittings 5) Blow the tube out with compressed air to remove any particles Page#103


104 9.7 Testing the Heater Resistance Figure 83. Heater Resistance for VAC AC Service Figure 84. Heater Resistance for VAC AC Service Page # 104


105 9.8 Main DC Power Supply Replacement Main DC Power Supply Replacement Purpose: Replace / upgrade Phihong PSA4531 DC Supply with Power-One MAP DC Power Supply Procedure: Power off analyzer if gas umbilical tubing is used, it is not necessary to cool down the analyzer. Maintain normal gas supplies. Disconnect AC power cord. Remove top cover. Locate the main DC power supply in the right rear portion of the chassis see Figure 1. Figure 85a Main DC Power Supply Location Remove the 4 each 6-32 screws that hold down the plastic protective shield to expose the DC power supply see Figure 84. Page # 105 Figure 85b Main DC Power

106 Figure 86. Main DC Power Supply with Shield Removed Unscrew the 4 each ¼ standoffs that retain the DC power supply to the rear panel circuit board. Disconnect only the two cable assemblies that attach the DC power supply to the rear panel circuit board it is recommended to disconnect the cables at the circuit board connector end. Remove the DC power supply by sliding it under the overlayed cable assemblies do not remove the other cable assemblies see Figure 85. Page # 106


107 Figure 87. Main DC Power Supply Fully Removed Lay the old DC power supply on the workbench aside the new Power-one DC power supply. Orient such that the 6 pin and 2 pin connectors are aligned see Figure 86. Figure 88. Correct Alignment and Cable Transfer from Old to New DC Power Supply Transfer the two cable assemblies from the old power supply to the new supply. Install the new DC Power Supply by reversing the disassembly sequence. After installation and power-up, it may be necessary to re-adjust the contrast on the front panel display (it may be too light or too dark) Page # 107
. Please contact your local representative for details. Figure 89.")
108 9.9 Adjusting the 5 Volt DC Supply *Please Note: Adjustments are not applicable for newer analyzers (Rev L. and above). Please contact your local representative for details. Figure 89. Adjusting the 5 Volt DC Supply Page # 108
Peak Performer 1 RCP (910- Series) User Manual
 User Manual") Peak Performer 1 RCP (910- Series) User Manual Peak Laboratories, LLC www.peaklaboratories.com 650-691-1267 Version 5.0 1/14/14 Page # 1 Forward This manual is a reference guide for the operation of the
Peak Performer 1 RCP (910- Series) User Manual Peak Laboratories, LLC www.peaklaboratories.com 650-691-1267 Version 5.0 1/14/14 Page # 1 Forward This manual is a reference guide for the operation of the
Peak Performer 1 RCP User Manual
 Peak Performer 1 RCP User Manual Peak Laboratories, LLC www.peaklaboratories.com 650-691-1267 Version 3.2 11/20/2008 Page # 1 Forward This manual is a reference guide for the operation of the Peak Performer
OPERATING AND SAFETY INSTRUCTIONS for DIGITAL TEMPERATURE CONTROLS (PLSM SERIES)
") user instructions 711 HULMAN STREET PO BOX 2128 TERRE HAUTE, IN 47802 812-235-6167 FAX 812-234-6975 OPERATING AND SAFETY INSTRUCTIONS for DIGITAL TEMPERATURE CONTROLS (PLSM SERIES) Models: 104A PLSM112;
user instructions 711 HULMAN STREET PO BOX 2128 TERRE HAUTE, IN 47802 812-235-6167 FAX 812-234-6975 OPERATING AND SAFETY INSTRUCTIONS for DIGITAL TEMPERATURE CONTROLS (PLSM SERIES) Models: 104A PLSM112;
Noise Detector ND-1 Operating Manual
 Noise Detector ND-1 Operating Manual SPECTRADYNAMICS, INC 1849 Cherry St. Unit 2 Louisville, CO 80027 Phone: (303) 665-1852 Fax: (303) 604-6088 Table of Contents ND-1 Description...... 3 Safety and Preparation
AEROTRAK PORTABLE AIRBORNE PARTICLE COUNTER MODEL 9110 QUICK START GUIDE
 AEROTRAK PORTABLE AIRBORNE PARTICLE COUNTER MODEL 9110 QUICK START GUIDE Thank you for purchasing a TSI AeroTrak Model 9110 Portable Airborne Particle Counter (particle counter). This guide will help you
AES-402 Automatic Digital Audio Switcher/DA/Digital to Analog Converter
 Broadcast Devices, Inc. AES-402 Automatic Digital Audio Switcher/DA/Digital to Analog Converter Technical Reference Manual Broadcast Devices, Inc. Tel. (914) 737-5032 Fax. (914) 736-6916 World Wide Web:
RD RACK MOUNT DIMMER OWNERS MANUAL VERSION /09/2011
 RD - 122 RACK MOUNT DIMMER OWNERS MANUAL VERSION 1.3 03/09/2011 Page 2 of 14 TABLE OF CONTENTS UNIT DESCRIPTION AND FUNCTIONS 3 POWER REQUIREMENTS 3 INSTALLATION 3 PLACEMENT 3 POWER CONNECTIONS 3 OUTPUT
AES-404 Digital Audio Switcher/DA/Digital to Analog Converter
 Broadcast Devices, Inc. AES-404 Digital Audio Switcher/DA/Digital to Analog Converter Technical Reference Manual Broadcast Devices, Inc. Tel. (914) 737-5032 Fax. (914) 736-6916 World Wide Web: www.broadcast-devices.com
MS2540 Current Loop Receiver with RS485 Communication
 MS2540 Current Loop Receiver with RS485 Communication User Manual Metal Samples Company A Division of Alabama Specialty Products, Inc. 152 Metal Samples Rd., Munford, AL 36268 Phone: (256) 358 4202 Fax:
Flat-Bed Module Recorders
 Flat-Bed Module Recorders Model No. 08376-50 08376-55 08376-60 0115-0192 4/28/00 Table of Contents Introduction...3 Power Requirements...3 Chart Paper Installation...3 Pen Installation...5 Grounding...5
Instruction Manual MODEL RSP SANITARY ELECTRONIC PRESSURE TRANSMITTER
 Instruction Manual Anderson Instrument Co. Inc. 156 Auriesville Road Fultonville, NY 12072 1-800-833-0081 Fax 518-922-8997 www.andinst.com Instrument Model Number Instrument Serial Number MODEL RSP SANITARY
Sentronic PLUS. Electronic Pressure Regulator. Installation Manual
 Sentronic PLUS Electronic Pressure Regulator Electronic Pressure Regulator Sentronic PLUS Sentronic PLUS Electronic Pressure Regulator General Electrical Characteristics Nominal Diameter DN (mm) Voltage
ARS x4 MATRIX SWITCHER Instruction Manual
 ARS-8400 8x4 MATRIX SWITCHER Instruction Manual Thank you for purchasing one of our products. Please read this manual before using this product. When using this product, always follow the instructions
SATRI AMPLIFIER AMP-51R. Owner s Manual
 SATRI AMPLIFIER AMP-51R Owner s Manual contents SAFETY INSTRUCTIONS 4 INTRODUCTION 6 OVERVIEW (FRONT PANEL) 8 OVERVIEW (REAR PANEL) 9 OVERVIEW (REMOTE CONTROL) 1 1 OPERATION 12 TROUBLESHOOTING 13 SPECIFICATION
SPECIFICATION NO NOTE
 NOTE The Model 207-1 is a special version of the standard M-207 Power Supply. It has been altered for a special applications requiring low current operation at high arc voltages in ambient and pressurized
OWNERS MANUAL. Revision /01/ Lightronics Inc. 509 Central Drive Virginia Beach, VA Tel
 OWNERS MANUAL Revision 1.8 09/01/2002 OWNERS MANUAL Page 2 of 12 AR-1202 UNIT DESCRIPTION The AR-1202 consists of a processor and 12 dimmer channels of 2.4KW each. Each dimmer channel is protected by a
Sentronic PLUS Electronic Pressure Regulator. Installation Manual
 Sentronic PLUS Electronic Pressure Regulator Installation Manual Sentronic PLUS ASCO NUMATICS Sentronic PLUS Electronic Pressure Regulator Electrical Characteristics * Max. ripple: 10 % Specifications
Customer Responsibilities. Important Customer Information. Agilent InfinityLab LC Series Site Preparation Checklist
 Agilent Site Preparation InfinityLab Checklist LC Series Thank you for purchasing an Agilent instrument. To get you started and to assure a successful and timely installation, please refer to this specification
Installation and User Guide 458/CTR8 8-Channel Ballast Controller Module
 Installation and User Guide 458/CTR8 8-Channel Ballast Controller Module Helvar Data is subject to change without notice. www.helvar.com i Contents Section Page Introduction 1 Installation 2 1. Attach
Operating Instructions
 CNTX Contrast sensor Operating Instructions CAUTIONS AND WARNINGS SET-UP DISTANCE ADJUSTMENT: As a general rule, the sensor should be fixed at a 15 to 20 angle from directly perpendicular to the target
TABLE OF CONTENTS. Instructions:
 TABLE OF CONTENTS Instructions: 1 Overview 1 2 Main technical parameters 1 3 Display and keyboard 2 3.1 Display Window 2 3.2 Indicator 4 4. Operation 4 4.1 Power 4 4.2 Zero 4 Modified 4 4.3 Modified 4
USER MANUAL FOR THE ANALOGIC GAUGE FIRMWARE VERSION 1.1
 by USER MANUAL FOR THE ANALOGIC GAUGE FIRMWARE VERSION 1.1 www.aeroforcetech.com Made in the USA! WARNING Vehicle operator should focus primary attention to the road while using the Interceptor. The information
Panel cutout required: 1.772" x 3.622" (45mm x 92mm) 1.76" (45mm) 2.45" (62mm) 3.20" (81mm) 3.60" (91mm) 0.59" (15mm) Special Features
 1.76 (45mm) 2.45 (62mm) 3.20 (81mm) 3.60 (91mm) 0.59 (15mm) Special Features") NEMA4X, IP65 Front Bezel Meter with Relays Option RELAY2 RELAY1 24V OUT POWER 4 3 2 1 6 5 2 1 2 1 NO NC COM NO NC COM RTD TC P P RTD 3 4 1 2 5 TC 6 SWITCH Rear View Gasket APM765 Panel Meter Description
NEMA4X, IP65 Front Bezel Meter with Relays Option RELAY2 RELAY1 24V OUT POWER 4 3 2 1 6 5 2 1 2 1 NO NC COM NO NC COM RTD TC P P RTD 3 4 1 2 5 TC 6 SWITCH Rear View Gasket APM765 Panel Meter Description
Quick Operation Guide of LTN7700/7600 Series NVR
 Quick Operation Guide of LTN7700/7600 Series NVR UD.6L0202B0042A02 Thank you for purchasing our product. If there is any question or request, please do not hesitate to contact dealer. This manual is applicable
Micro-DCI 53ML5100 Manual Loader
 Micro-DCI 53ML5100 Manual Loader Two process variable inputs Two manually controlled current outputs Multiple Display Formats: Dual Channel Manual Loader, Single Channel Manual Loader, Manual Loader with
This document is a reference document that shows the menus in the 5500sc, 9610sc and 9611sc analyzers. There are 3 top-level menus:
 Controller menus 5500sc, 9610sc and 9611sc analyzers DOC273.53.80566 Introduction This document is a reference document that shows the menus in the 5500sc, 9610sc and 9611sc analyzers. There are 3 top-level
SPECIFICATION NO Model 207 Automatic GTAW Welding System
 1.0 Introduction The Model 207 is a completely self-contained Gas Tungsten Arc Welding (GTAW) System requiring only input power, inert gas and AMI Welding Head (or manual torch) for operation. Its small
COMPOSITE VIDEO LUMINANCE METER MODEL VLM-40 LUMINANCE MODEL VLM-40 NTSC TECHNICAL INSTRUCTION MANUAL
 COMPOSITE VIDEO METER MODEL VLM- COMPOSITE VIDEO METER MODEL VLM- NTSC TECHNICAL INSTRUCTION MANUAL VLM- NTSC TECHNICAL INSTRUCTION MANUAL INTRODUCTION EASY-TO-USE VIDEO LEVEL METER... SIMULTANEOUS DISPLAY...
AES Channel Digital/Analog Audio Switcher/DA/Digital to Analog Converter
 Broadcast Devices, Inc. AES-408 8 Channel Digital/Analog Audio Switcher/DA/Digital to Analog Converter Technical Reference Manual Broadcast Devices, Inc. Tel. (914) 737-5032 Fax. (914) 736-6916 World Wide
SNG-2150C User s Guide
 SNG-2150C User s Guide Avcom of Virginia SNG-2150C User s Guide 7730 Whitepine Road Revision 001 Richmond, VA 23237 USA GENERAL SAFETY If one or more components of your earth station are connected to 120
Quick Start Operating Instructions
 Table of Contents 1. Introduction 1 2. Instrument Controls & Indicators 2 3. Digital Display and Screens Overview 3 4. Setting the Basic Operating Level 4 5. Calibration 6 A The Calibration Menu: Screen
Customer Responsibilities. Important Customer Information Infinity LC/1260 Infinity LC Site Preparation Checklist
 1290 Site Preparation Infinity LC/1260 Checklist Infinity LC Thank you for purchasing an Agilent instrument. To get you started and to assure a successful and timely installation, please refer to this
USER MANUAL FOR THE ANALOGIC GAUGE FIRMWARE VERSION 1.0
 by USER MANUAL FOR THE ANALOGIC GAUGE FIRMWARE VERSION 1.0 www.aeroforcetech.com Made in the USA! WARNING Vehicle operator should focus primary attention to the road while using the Interceptor. The information
GeniSys Display. Contractor s Tool. Description / Applications. for the GeniSys Advanced Burner Control
 PARTS & ACCESSORIES GeniSys Display or Contractor s Tool for the GeniSys Advanced Burner Control Description / Applications The Beckett GeniSys TM Display is an optional attachment for the GeniSys Primary
MANUAL ENGLISH Core Club Ordercode: D2314
 MANUAL ENGLISH Core Club Ordercode: Highlite International B.V. Vestastraat 2 6468 EX Kerkrade the Netherlands Table of contents Warning... 2 Unpacking Instructions... 2 Safety Instructions... 2 Operating
Kramer Electronics, Ltd. USER MANUAL. Model: VS x 1 Sequential Video Audio Switcher
 Kramer Electronics, Ltd. USER MANUAL Model: VS-120 20 x 1 Sequential Video Audio Switcher Contents Contents 1 Introduction 1 2 Getting Started 1 2.1 Quick Start 2 3 Overview 3 4 Installing the VS-120 in
Weekly Timer. Mounting track 50 cm (1.64 ft) length PFP-50N 1 m (3.28 ft) length PFP-100N
 length PFP-50N 1 m (3.28 ft) length PFP-100N") Weekly Timer 1/4 DIN Size Timer Features Prompted Programming and Large LCD Display 24 hours x 7 days programming using just 5 switches 16 program steps and cycle operation Two independent 15 A control
Weekly Timer 1/4 DIN Size Timer Features Prompted Programming and Large LCD Display 24 hours x 7 days programming using just 5 switches 16 program steps and cycle operation Two independent 15 A control
SCALE & WEIGHT DISPLAYS
 The MICRO SERIES SCALE & WEIGHT DISPLAYS LARGE DIGIT MODELS Mighty-5S DPM MODELS Micro-S & Mighty-1S Mighty-1S Micro-S ELECTRO-NUMERICS, INC. Introduction The Electro-Numerics family of Digital Panel Meters
Model FP 240 Drying and heating chambers Classic.Line with forced convection and program functions
 Model FP 240 Drying and heating chambers Classic.Line with forced convection and program functions A BINDER material test chamber with mechanical convection of the FP series provides reliably short drying
PSM-003. Micro Polarization Controller/Scrambler. User Guide
 PSM-003 Micro Polarization Controller/Scrambler User Guide Version: 1.0 Date: August 23, 2012 General Photonics, Incorporated is located in Chino California. For more information visit the company's website
FOTS100 User Manual. BIOPAC Systems, Inc. Opsens Inc. 42 Aero Camino, Goleta, CA Tel (805) , Fax (805)
 , Fax (805)") FOTS100 User Manual BIOPAC Systems, Inc. 42 Aero Camino, Goleta, CA 93117 Tel (805) 685-0066, Fax (805) 685-0067 WWW.BIOPAC.COM 1 WARRANTY All products manufactured by Opsens inc. are warranted to be free
FOTS100 User Manual BIOPAC Systems, Inc. 42 Aero Camino, Goleta, CA 93117 Tel (805) 685-0066, Fax (805) 685-0067 WWW.BIOPAC.COM 1 WARRANTY All products manufactured by Opsens inc. are warranted to be free
Flash-Point with Closed Cup - Abel Method - ABA 4 (automatic)
") Flash-Point with Closed Cup - Abel Method - ABA 4 (automatic) ISO 1516, ISO 1523, ISO 13736, DIN 51755-1, DIN 53213 (obs.), EN 456 (obs.), EN 924, IP 113 (obs.), IP 170, IP 304-1 (obs.), IP 304-2 (obs.),
Flash-Point with Closed Cup - Abel Method - ABA 4 (automatic) ISO 1516, ISO 1523, ISO 13736, DIN 51755-1, DIN 53213 (obs.), EN 456 (obs.), EN 924, IP 113 (obs.), IP 170, IP 304-1 (obs.), IP 304-2 (obs.),
ORM0022 EHPC210 Universal Controller Operation Manual Revision 1. EHPC210 Universal Controller. Operation Manual
 ORM0022 EHPC210 Universal Controller Operation Manual Revision 1 EHPC210 Universal Controller Operation Manual Associated Documentation... 4 Electrical Interface... 4 Power Supply... 4 Solenoid Outputs...
MG-XV operating instruction. Measuring of norm signals, 4-8-digit. Panel instrument type MG-BV Construction instrument type MG-AV
 MG-XV operating instruction Measuring of norm signals, 4-8-digit Panel instrument type MG-BV Construction instrument type MG-AV Contents 1. Brief description... 3 2. Safety instructions... 3 2.1. Proper
Section C Recorders. DPR mm Digital Strip Chart Recorder
 91-00-01-01 Section C Recorders Contents Product Type Literature No. Overview 40-00-02-02 LeaderLine PC Software 51-52-03-16 SCF Software Configuration Tool 51-52-03-26 SDA Software Data Analysis Tool
Engineered to meet your needs T he oldest name in stud welding,
 Engineered to meet your needs T he oldest name in stud welding, Nelson Stud Welding Inc., continues it s leadership role into the 21st century with the introduction of a full line of new drawn-arc welding
GE Interlogix Fiber Options S700V & S702V. Instruction Manual FIBER-OPTIC VIDEO TRANSMISSION SYSTEM
 g GE Interlogix Fiber Options Instruction Manual S700V & S702V FIBER-OPTIC VIDEO TRANSMISSION SYSTEM Federal Communications Commission and Industry Canada Radio Frequency Interference Statements This equipment
Model 1476-C SuperQuad HR
 Model 1476-C SuperQuad HR Installation and Operating Instructions Table of Contents Page Table of Content... 2 System Description... 3 Features... 3 Installation... 4 Internal Setups... 4 Connections...
OLS Series Light Sources, OPM Series Optical Power Meters, and Related Test Kits User s Guide
 OLS Series Light Sources, OPM Series Optical Power Meters, and Related Test Kits User s Guide Limited Warranty One Year Limited Warranty All Noyes products are warranted against defective material and
HOME THEATER. HDMI Selector Switches. Vanco Part Numbers (5x1) (3x1) Technical Support
 (3x1) Technical Support") HOME THEATER HDMI Selector Switches Vanco Part Numbers 280710 (5x1) 280711 (3x1) Technical Support www.vanco1.com info@vanco1.com 800-626-6445 DEAR CUSTOMER Thank you for purchasing this product. For optimum
HOME THEATER HDMI Selector Switches Vanco Part Numbers 280710 (5x1) 280711 (3x1) Technical Support www.vanco1.com info@vanco1.com 800-626-6445 DEAR CUSTOMER Thank you for purchasing this product. For optimum
TR6102HD HDTV/DVD/COMPONENT VIDEO TO RGBHV TRANSCODER USER S GUIDE
 MANUAL PART NUMBER: 400-0031-003 PRODUCT REVISION: 1 HDTV/DVD/COMPONENT VIDEO TO RGBHV TRANSCODER USER S GUIDE INTRODUCTION Thank you for your purchase of the Transcoder. We are certain that you will find
OTHER FEATURES UNIQUE FEATURES
 OTHER FEATURES H2 Generator + Zero Air Generator All-In-One Automatic Easy refill Cascading available up to 32 units PC Remote Software control via USB or RS232 Remote alarms/management Optional H2 sensor
263 Series LED Bargraph Indicator and Controllers
 263 Series LED Bargraph Process Control Water Treatment High resolution 51 segment LED Bargraph for easy reading Accuracy 1% Red display Vertical or Horizontal mounting & stackable Connection Diagrams
MONITOR POWER Shiloh Road Alpharetta, Georgia (770) FAX (770) Toll Free
 FAX (770) Toll Free") Instruction Manual Model 2099-10xx 10MHz Frequency Source April 2014, Rev. H MENU INTERNAL LEVEL = +10dBm MONITOR POWER 1 2 MODEL 2099 FREQUENCY SOURCE CROSS TECHNOLOGIES INC. ALARM OVEN REMOTE EXECUTE
Instruction Manual Model 2099-10xx 10MHz Frequency Source April 2014, Rev. H MENU INTERNAL LEVEL = +10dBm MONITOR POWER 1 2 MODEL 2099 FREQUENCY SOURCE CROSS TECHNOLOGIES INC. ALARM OVEN REMOTE EXECUTE
TC Mbps - 622Mbps FIBER OPTIC MODE CONVERTER/REPEATER (Rev A0.1) User's Manual
 User's Manual") TC3004 50Mbps - 622Mbps FIBER OPTIC MODE CONVERTER/REPEATER (Rev A0.1) MODEL: S/N: DATE: Notice! Although every effort has been made to insure that this manual is current and accurate as of date of publication,
TC3004 50Mbps - 622Mbps FIBER OPTIC MODE CONVERTER/REPEATER (Rev A0.1) MODEL: S/N: DATE: Notice! Although every effort has been made to insure that this manual is current and accurate as of date of publication,
USER MANUAL. 22" Class Slim HD Widescreen Monitor L215DS
 USER MANUAL 22" Class Slim HD Widescreen Monitor L215DS TABLE OF CONTENTS 1 Getting Started Package Includes Installation 2 Control Panel / Back Panel Control Panel Back Panel 3 On Screen Display 4 Technical
UDC100 Universal Digital Controller. Specification. Overview. Features. Features, continued /99 Page 1 of 4
 UDC100 Universal Digital Controller 51-52-03-29 11/99 Page 1 of 4 Specification Overview The UDC100 Universal Digital Controller is a microprocessor-based 1/4 DIN low cost temperature controller. It combines
MENU EXECUTE Shiloh Road Alpharetta, Georgia (770) FAX (770) Toll Free
 FAX (770) Toll Free") Instruction Manual Model 2016-1250 Downconverter May 2009 Rev A F=2501.750 G=+25.0 MENU MODEL 2016 DOWNCONVERTER CROSS TECHNOLOGIES INC. ALARM REMOTE POWER EXECUTE Data, drawings, and other material contained
Instruction Manual Model 2016-1250 Downconverter May 2009 Rev A F=2501.750 G=+25.0 MENU MODEL 2016 DOWNCONVERTER CROSS TECHNOLOGIES INC. ALARM REMOTE POWER EXECUTE Data, drawings, and other material contained
 I R T Electronics Pty Ltd A.B.N. 35 000 832 575 26 Hotham Parade, ARTARMON N.S.W. 2064 AUSTRALIA National: Phone: (02) 9439 3744 Fax: (02) 9439 7439 International: +61 2 9439 3744 +61 2 9439 7439 Email:
OTM FREQUENCY AGILE 750MHz F.C.C. COMPATIBLE TELEVISION MODULATOR INSTRUCTION MANUAL
 OTM-4000 FREQUENCY AGILE 750MHz F.C.C. COMPATIBLE TELEVISION MODULATOR INSTRUCTION MANUAL Phone: (209) 586-1022 (800) 545-1022 Fax: (209) 586-1026 E-Mail: salessupport@olsontech.com 025-000331 REV B www.olsontech.com
Check our knowledge base at
 USER MANUAL Check our knowledge base at www.paralinx.net/support Copyright 2015 Paralinx LLC All Rights Reserved TABLE OF CONTENTS 1 Important Notice 10 LCD Screen 2 Safety Instructions 11 Indicators 3
Connevans.info. DeafEquipment.co.uk. This product may be purchased from Connevans Limited secure online store at
 Connevans.info Solutions to improve the quality of life Offering you choice Helping you choose This product may be purchased from Connevans Limited secure online store at www.deafequipment.co.uk DeafEquipment.co.uk
EVENT INPUT/OUTPUT MODULE [PUME]
![EVENT INPUT/OUTPUT MODULE [PUME]](/thumbs/96/127716630.jpg "EVENT INPUT/OUTPUT MODULE [PUME]") PUM Series Multi-loop module type Temperature controller DATA SHEET EVENT INPUT/OUTPUT MODULE [] is a digital input/output module used as an auxiliary input/output of control modules. Each module, 30mm
PUM Series Multi-loop module type Temperature controller DATA SHEET EVENT INPUT/OUTPUT MODULE [] is a digital input/output module used as an auxiliary input/output of control modules. Each module, 30mm
Integre4. Audiophile integrated amplifier. v1.2
 Owner s Manual Integre4 Audiophile integrated amplifier www.lab12.gr v1.2 Table of Contents It is yours Features Unpacking and Warnings Installation & Placement Front Panel Rear Panel Connections Remote
User Manual CXE Rev (12) CXX Series. User Manual. Teleste Corporation CXE810. Fibre optic receiver
 CXX Series. User Manual. Teleste Corporation CXE810. Fibre optic receiver") 27.3.2012 1(12) CXX Series User Manual Teleste Corporation CXE810 Fibre optic receiver 27.3.2012 2(12) Contents Introduction... 3 Installation... 3 Housing... 3 Powering... 4 Interfaces... 4 Fibre installation...
27.3.2012 1(12) CXX Series User Manual Teleste Corporation CXE810 Fibre optic receiver 27.3.2012 2(12) Contents Introduction... 3 Installation... 3 Housing... 3 Powering... 4 Interfaces... 4 Fibre installation...
TL-2900 AMMONIA & NITRATE ANALYZER DUAL CHANNEL
 TL-2900 AMMONIA & NITRATE ANALYZER DUAL CHANNEL DATA ACQUISITION SYSTEM V.15.4 INSTRUCTION MANUAL Timberline Instruments, LLC 1880 S. Flatiron Ct., Unit I Boulder, Colorado 80301 Ph: (303) 440-8779 Fx:
USER S GUIDE. 1 Description PROGRAMMABLE 3-RELAY LOGIC MODULE
 1 Description The is a programmable 3 relay logic module that may be used for multiple applications, including simple timing, door mounted sensor inhibiting and advanced relay sequencing. The contains
PC-250. SMD Taped Parts Counter Operator s Manual. ISO 9001:2008 Certified. V-TEK, Incorporated 751 Summit Avenue Mankato, MN USA
 PC-250 SMD Taped Parts Counter Operator s Manual ISO 9001:2008 Certified V-TEK, Incorporated 751 Summit Avenue Mankato, MN 56001 USA (P) 507-387-2039 (F) 507-387-2257 www.vtekusa.com Dear Customer: All
CS x1 RS-232 Computer Controlled Video Switcher. Instruction Manual
 CS-1600 16x1 RS-232 Computer Controlled Video Switcher Instruction Manual Thank you for purchasing one of our products. Please read this manual before using this product. When using this product, always
DCP100 Digital Control Programmer Specifications
 DCP100 Digital Control Programmer Specifications EN01-6028 October 1996 Overview The DCP100 is a microprocessor based 1 /4 DIN programmer/controller for process variable versus time control of temperature,
.Power Distribution Center. PD-1. Instruction Manual
 .Power Distribution Center. PD-1 Instruction Manual www.datavideo-tek.com 1 Contents Warnings and Precautions... 3 Warranty... 4 Standard Warranty... 4 Two Year Warranty... 4 Disposal... 4 Packing List...
USER GUIDE. DM Engineering Multi Station Relay Adapter (MSRA and MSRA-RM) Version DM Engineering
 Version DM Engineering") USER GUIDE DM Engineering Multi Station Relay Adapter (MSRA and MSRA-RM) Version 1.35 DM Engineering 2174 Chandler St. Camarillo, CA 91345-4611 805-987-7881 800-249-0487 www.dmengineering.com Overview:
USER GUIDE DM Engineering Multi Station Relay Adapter (MSRA and MSRA-RM) Version 1.35 DM Engineering 2174 Chandler St. Camarillo, CA 91345-4611 805-987-7881 800-249-0487 www.dmengineering.com Overview:
Safety Information. Camera System. If you back up while looking only at the monitor, you may cause damage or injury. Always back up slowly.
 Table of Contents Introduction...3 Safety Information...4-6 Before Beginning Installation...7 Installation Guide...8 Wiring Camera & Monitor...9-10 Replacement Installation Diagram...11 Clip-On Installation
ST-4000 SIGNAL LEVEL METER
 ST-4000 SIGNAL LEVEL METER Table of Contents Features / Specifications.... 1 Keypad Illustration....... 2 Keypad Controls.... 2 Getting Started: Powering the Meter.... 3 Quick Use Instructions.. 3 Main
ACTIVE IF SPLITTER/COMBINER UHP-IFS
 ACTIVE IF SPLITTER/COMBINER UHP-IFS GENERAL DESCRIPTION AND INSTALLATION GUIDE DOCUMENT RELEASE 2 [UHP.IFS.2.EN] JUNE 2016 CONTENT Acronyms and Abbreviations... 4 Introduction... 5 Required level of qualification...
R1MS-GH3 BEFORE USE... POINTS OF CAUTION INSTRUCTION MANUAL THERMOCOUPLE & DC INPUT MODULE MODEL. (8 points; isolated)
") INSTRUCTION MANUAL THERMOCOUPLE & INPUT MODULE (8 points; isolated) MODEL BEFORE USE... Thank you for choosing M-System. Before use, please check contents of the package you received as outlined below.
INSTRUCTION MANUAL THERMOCOUPLE & INPUT MODULE (8 points; isolated) MODEL BEFORE USE... Thank you for choosing M-System. Before use, please check contents of the package you received as outlined below.
Sentinel I24 Digital Input and Output Configuration
 Application Bulletin: #155 Date: October 19, 2007 Sentinel I24 Digital Input and Output Configuration The Sentinel I24 can communicate with external hardware using digital inputs and outputs. There are
LAUREL ELECTRONICS, INC.
 LAUREL ELECTRONICS, INC. Laureate Digital Panel Meter for Process, Strain & Potentiometer Follower Signals Features Selectable ±0.2, ±2, ±20, ±200, ±300 & ±600 Vdc voltage ranges Selectable ±2, ±20, ±200
Provides an activation of Relay 1 triggered by Input 1. The function also provides an option for reverse-logic on the activation of Input 1.
 USER S GUIDE PROGRAMMABLE 3-RELAY LOGIC MODULE 1 Description The is a programmable 3 relay logic module that may be used for multiple applications, including simple timing, door mounted sensor inhibiting
MASTR II BASE STATION 12/24V POWER SUPPLY 19A149979P1-120 VOLT/60 Hz 19A149979P2-230 VOLT/50 Hz
 Mobile Communications MASTR II BASE STATION 12/24V POWER SUPPLY 19A149979P1-120 VOLT/60 Hz 19A149979P2-230 VOLT/50 Hz CAUTION THESE SERVICING INSTRUCTIONS ARE FOR USE BY QUALI- FIED PERSONNEL ONLY. TO
NGC8206 Start-Up Guide
 NGC8206 Start-Up Guide MEASUREMENT & CONTROL SYSTEMS Intellectual Property & Copyright Notice 2010 by ABB Inc., Totalflow Products ( Owner ), Bartlesville, Oklahoma 74006, U.S.A. All rights reserved. Any
MODEL OTM-4870 FREQUENCY AGILE 870MHz F.C.C. COMPATIBLE TELEVISION MODULATOR
 MODEL OTM-4870 FREQUENCY AGILE 870MHz F.C.C. COMPATIBLE TELEVISION MODULATOR USERS MANUAL Phone: (209) 586-1022 (800) 545-1022 Fax: (209) 586-1026 E-Mail: salessupport@olsontech.com 025-000412 Rev. B www.olsontech.com
TUSKIN Equipment Corporation
 TUSKIN Equipment Corporation TC-101 Liquid Color Metering System Operation & Maintenance Manual Warning: Read instructions carefully before attempting to install, operate or service the Tuskin Metering
ALO 030 MKII. 30 Watt DMX LED scanner. User manual
 ALO 030 MKII 30 Watt DMX LED scanner User manual Safety instructions WARNING! Always keep this device away from moisture and rain! Hazardous electrical shocks may occur! WARNING! Only connect this device
Weighing Scale. 10key&12key User manual
 Weighing Scale 10&12 User manual EXCELL PRECISION CO., LTD. 2014. All rights reserved worldwide. The information contained herein is the property of EXCELL PRECISION CO., LTD. and is supplied without liability
Winmate Communication INC.
 20.1 Military Grade Display Model: R20L100-RKA2ML User s Manual Winmate Communication INC. May, 2011 1 IMPORTANT SAFETY INSTRUCTIONS Please read these instructions carefully before using the product and
AK-PVE4 Operating Instructions. Measuring of norm signals in wall-type units. Performance:
 AK-PVE4 Operating Instructions Measuring of norm signals in wall-type units 1 2 P Performance: Digit heights: 20 mm Colour: red Display range: -999 9999 Wall-type housing: light grey made of ABS-plastic
ABB. Measure IT Uvisor System MFD Multi Flame Detector - Control Unit. Product Data Sheet (Rev. C)
") (Rev. C) Multi fuel / multi flame detector system Two - Systems - In - One Application: - Industrial and large utility boilers - NG, BFG, Oil, Orimulsion and pulverized coal burners Dual channel flame
(Rev. C) Multi fuel / multi flame detector system Two - Systems - In - One Application: - Industrial and large utility boilers - NG, BFG, Oil, Orimulsion and pulverized coal burners Dual channel flame
MENU EXECUTE Shiloh Road Alpharetta, Georgia (770) FAX (770) Toll Free
 FAX (770) Toll Free") Instruction Manual Model 2584-31 Combiner May 2011, Rev. A RF MONITOR GAIN = -15 MENU MODEL 2584 COMBINER CROSS TECHNOLOGIES INC. ALARM REMOTE POWER EXECUTE Data, drawings, and other material contained
Instruction Manual Model 2584-31 Combiner May 2011, Rev. A RF MONITOR GAIN = -15 MENU MODEL 2584 COMBINER CROSS TECHNOLOGIES INC. ALARM REMOTE POWER EXECUTE Data, drawings, and other material contained
OTM-3000-I FREQUENCY AGILE TELEVISION MODULATOR PAL I STANDARD INSTRUCTION MANUAL
 OTM-3000-I FREQUENCY AGILE TELEVISION MODULATOR PAL I STANDARD INSTRUCTION MANUAL Phone: (209) 586-1022 (800) 545-1022 Fax: (209) 586-1026 E-Mail: salessupport@olsontech.com 025-000137 REV B www.olsontech.com
PLL2210MW LED Monitor
 PLL2210MW LED Monitor USER'S GUIDE www.planar.com Content Operation Instructions...1 Safety Precautions...2 First Setup...3 Front View of the Product...4 Rear View of the Product...5 Quick Installation...6
Ambient SO 2 /H 2 S monitor APSA-H370 Instruction Manual
 Ambient SO 2 /H 2 S monitor APSA-H370 Instruction Manual Preface This instruction manual describes the operation of the Ambient SO 2 /H 2 S monitor, APSA-H370. Be sure to read this manual before using
1x12 VGA & Audio over CAT5 Splitter
 SP-9112 1x12 VGA & Audio over CAT5 Splitter User Manual rev: 160322 Made in Taiwan Safety and Notice The SP-9112 1x12 VGA & Audio over CAT5 Splitter has been tested for conformance to safety regulations
A. All equipment and materials used shall be standard components that are regularly manufactured and used in the manufacturer s system.
 SPECTRA MINI SERIES DOME SYSTEM, NTSC/PAL TECHNICAL SPECIFICATIONS SECURITY SYSTEM DIVISION -- 28 ELECTRONIC SAFETY AND SECURITY LEVEL 1 28 20 00 ELECTRONIC SURVEILLANCE LEVEL 2 28 23 00 VIDEO SURVEILLANCE
ivw-fd122 Video Wall Controller MODEL: ivw-fd122 Video Wall Controller Supports 2 x 2 Video Wall Array User Manual Page i Rev. 1.
 MODEL: ivw-fd122 Video Wall Controller Supports 2 x 2 Video Wall Array User Manual Rev. 1.01 Page i Copyright COPYRIGHT NOTICE The information in this document is subject to change without prior notice
Triple RTD. On-board Digital Signal Processor. Linearization RTDs 20 Hz averaged outputs 16-bit precision comparator function.
 Triple RTD SMART INPUT MODULE State-of-the-art Electromagnetic Noise Suppression Circuitry. Ensures signal integrity even in harsh EMC environments. On-board Digital Signal Processor. Linearization RTDs
Commander 384. w w w. p r o l i g h t. c o. u k U S E R M A N U A L
 Commander 384 w w w. p r o l i g h t. c o. u k U S E R M A N U A L 1, Before you begin 1.1: Safety warnings...2 3 1.2: What is included...4 1.3: Unpacking instructions...4 2, Introduction 2.1: Features...4
Model KBF 115 Constant climate chambers with large temperature / humidity range
 Model KBF 115 Constant climate chambers with large temperature / humidity range The BINDER KBF is the specialist for unconditionally reliable stability testing and precise maintenance of constant climate
Standard signal metering in wall-mounting case
 User manual AKV-2VR4C Standard signal metering in wall-mounting case Technical features: Digit height: 20 mm Colour: red Range of display: -999 9999 Wall-mounting case: black, made of ABS-plastic Protection
ACCESSORIES MANUAL PART NUMBER: PRODUCT REVISION: 1 PNP202. Interconnect Box USER'S GUIDE
 MANUAL PART NUMBER: 400-0109-001 PRODUCT REVISION: 1 PNP202 Interconnect Box USER'S GUIDE INTRODUCTION Your purchase of the PNP202 Interconnect Box is greatly appreciated. We are sure you will find it