PG-AMM 2.2. Pinguin Audio-Multi-Meter. Professional multifunctional Audio metering software. Owners Manual
|
|
|
- Shon Rich
- 5 years ago
- Views:
Transcription


1 PG-AMM 2.2 Pinguin Audio-Multi-Meter Professional multifunctional Audio metering software Owners Manual
2 KEY FEATURES Turns every MAC or PC equipped with a reasonable sound card into a professional, eye friendly, standalone audio metering device. 18 different tools, user defined workspaces Made for: Music Mastering (CD, DVD-Video, SACD, Blue Ray) TV and Broadcast (stereo and surround multi-program monitoring)(e.g. in production, ingest or transmission rooms) Cinema ( LEQ (m) weighting filter for surround material) 24 h / 365 day unattended LOGGING of audio quality parameters(itu & EBU R128 loudness parameters, LU, QPPM and TruePeak Post-Analysis with arbitrary Start/Stop times for ANY TV or Radio program item Long list of reference customers (mainly German-, European- and US-broadcasters) PINGUINs R&D department is pioneering loudness monitoring since 25 years partly in cooperation with Germany's broadcaster s Research Institute IRT Standards: VU, QPPM, SPPM + NEW: EBU R128, US A85 New Multi Frequency Correlator PPM 16 Multi Stereo Meter with individual labeling and coloring Support for extended surround formats (up to 16 channels) Supports sound cards up to 192 channels PGAMMWire plugin for VST, RTAS and AU Synchronized Start-Stop function for EBU-Integrated and LEQ-Numeric Wire Mode and EBU Integrated Remote Server Workspaces Loudness Logger and Server Trademarks All trademarks, registered or otherwise, are the property of their respective owners. Microsoft, Windows 2000, Windows XP, Windows Vista and Windows 7 are registered trademarks of Microsoft Corp. ASIO is a trademark of Steinberg Media Technologies GmbH. 24/10/14 PG-AMM 2.2.xxx
3 3 Table of Contents Pinguin Audio Multi Meter Introduction...5 History of Audio Metering...6 About Levels, Scales & Ballistics...7 Levels...7 Scales...7 Ballistics...8 System Requirements...9 PC...9 MAC...9 Installation...10 PC...10 MAC...10 Basic Functions...11 Control Bar...12 Quick Start Guide...16 PPM (peak program meter) for Stereo, 5.1 and 8 Channel Surround Sound...17 Correlation Meter...20 Gonio Meter...20 FFT Analyzer...21 RT(A) Analyzer...24 Spectral View...25 LDN Meter...27 EBU Loudness...28 EBU Integrated...30 LEQ Numeric...32 Surround Locator...33 Multi Frequency Correlator...35 PPM Multi Stereo...35 PG-AMMWire Plugin...36 LDN Logging...37 PG-AMM network logging example...39 LDN Server...40 LDN Viewer...42 PG-AMM Manual - 3 -
4 4 K-System...44 EBU R Using PG-AMM in Audio-Production & -Postproduction...48 Using PG-AMM during stereo mastering...48 Workspace example...51 Disclaimer...52 PG-AMM Manual - 4 -

5 5 Pinguin Audio Multi Meter Introduction Pinguin Audio Multi Meter (PG-AMM) is a very powerful and accurate digital Audio-Metering-System for stereo and surround sound. It runs on a Mac & PC and consists of up to 17 instruments to visualize audio material in various ways. As PG-AMM is based on a modular structure, all instruments can be freely configured and combined according to your metering needs. Besides instruments like peak & vu meter, spectrum analyzer or correlation meter, PG-AMM offers new metering tools to display perceived loudness - and thus goes beyond 'traditional' metering. Metering according to the new EBU Recommendation EBU R-128 is fully integrated. PG-AMM is available in four different versions: Lite, Stereo, Surround & Enterprise with Enterprise being the all-included package containing all instruments available for the Pinguin Metering-System as well as the LdnServer. About this manual Lite Stereo Surround Enterprise Max. instruments PPM Meter X X X PPM 5.1 X X PPM 8 PPM 16 PPM Multi Stereo Correlation X X X X Gonio Meter X X X FFT X X X RTA X X X Spectral View X X LDN Meter X X X X EBU Loudness X X X EBU Integrated LEQ Numeric Multi Frequency Correlator X X X Surround Locator X X LDN Logger PG-AMMWire Plugin X X X X True Peak X X X FFT Snapshots X X X If you are familiar with terms such as dbfs, LU, true peak and K-System, you might directly switch to the Quick Start Guide chapter after installation. If not, we recommend you to read the introduction about About Levels, Scales & Ballistics first. Information on loudness metering according to EBU R-128 is provided, as well as a description of the K-System. X X X X X X PG-AMM Manual - 5 -
6 History of Audio Metering VU Meter The first standardized visual indicator of audio levels was the VU meter, which was developed amongst others by Bell Telephone Laboratories in It was designed to provide an objective measurement of audio levels more or less correlating with perceived loudness of audio material. The ballistics (300 ms integration & return time) of this volume indicator resulted from the mechanical inertia of the meter's design. The scale ranges from -20 db to +3 db. The VU meter is still in use today. 6 Peak Meter As the vu meter reacts too slowly to display peaks of an audio signal, an indicator for peak levels was introduced shortly afterward: the peak program meter (ppm) with a much faster integration time. This meter enabled the audio technician to control the levels more precisely than with a vu meter and prevented him or her from over- or under-driving an audio system. The scale of a peak meter according to DIN standard ranges from -50 db to + 5 db and has an integration time of 10 milliseconds. The combination of peak and vu meter provides a good method to see an averaged level in connection with peak level - and therefore the dynamic range of audio signals. Digital Meters With the arrival of digital audio, more precise metering tools became necessary (and possible). Contrary to an analog audio system, clipping and audible distortion of digital audio occur abruptly after exceeding 0 dbfs (full scale). The ppm's integration time was sufficient to prevent an analog system from being overdriven but it is not short enough to show digital overs reliably. That's why the sample peak program meter (sppm) was introduced. Its attack time is as short as one sample. But the consideration, that even between two samples there can be a digital over which the sppm would not recognize led to the development of a true peak program meter. This peak meter uses over sampling and shows the true peak level. Nowadays, a wide palette of metering tools exists - not only to display peak or averaged levels, but also to allow us to take a look at the spectral content of audio signals. Metering based on human loudness perception is about to become a new standard, at least in broadcasting industry. Loudness Metering A loudness meter shows how loud a signal is based on human perception of loudness. Whereas a peak meter displays the electrical signal strength a loudness meter has to take into consideration all factors that influence the perception of loudness: mainly the interplay of level, frequency and time. This is quite a complex task, and different methods for measuring loudness exist like for example Zwicker's method (around 1960) or Dolby's loudness measuring (LEQ(m)). Pinguin implemented earlier an algorithm of IRT to measure and display perceived loudness which is now completely replaced by an EBU R-128 compliant algorithm. Almost all methods to measure loudness are based on the "equal loudness curves". The indication of a loudness meter can differ considerably from that of a peak or even vu meter. PG-AMM Manual - 6 -
7 7 About Levels, Scales & Ballistics Levels The exact knowledge of all different levels that are shown by the metering instruments is of crucial importance for the meaningful use of the software. Decibels (db) or loudness units (LU) are relative terms. Like percentage, it means one value relative to another value. The use of db or LU on their own is of no significance unless it is known to what absolute values they are relative to. Example: LUFS describes loudness units relative to full scale. The difference between -23 LUFS and -18 LUFS is 5 LU (and not 5 LUFS!). If levels relative to digital full scale (FS) are displayed, it means that the top of the scale always represents (digital) full scale, no matter whether the scale ranges up to 0 or +9, for example. The list below explains different measurement units that are displayed by PG-AMM: dbfs describes signal levels relative to full scale dbtp describes true peak levels relative to full scale LU stands for Loudness Units and describes subjective loudness differences LUFS describes subjective loudness levels relative to full scale LKFS is equivalent to LUFS dbspl describes levels relative to a reference sound pressure level of Pa (hearing threshold) VU volume units (integration & fallback time: 300 ms) RMS averaged signal level (root mean square) Note: when converting audio from analog to digital, always keep in mind that: 0 dbu (unbalanced, reference: V) is equivalent to -18 dbfs. Levels displayed by PG-AMM Instrument / Value db FS db TP VU RMS LU/LU FS LU (EBU- M) LU (EBU- S) LU (EBU- I) PPM x x x x LDN Meter x x x EBU Loudness x x x x EBU Integrated x x x x LEQ x Numeric LU dbs PL x Scales The size of an audio signal is displayed on the meter's scale. The range and resolution (especially in the upper level range) of the scale is of great importance for the readability PG-AMM Manual - 7 -
8 of the measurement's results. Pinguin offers scale ranges up to 144 db, which corresponds to the theoretical dynamic range of 24 bit audio. The user should be aware that smaller display ranges might only cover a portion of the input signal's dynamic range. The position of the 0 db mark is another important aspect. In the analog domain, the 0 db or 100% mark is a reference indication. The technician can do level alignment around 0 db and still have enough headroom (up to 24 db!) for peaks that exceed that level. A digital meter that has the 0 db mark at the top of the scale has no headroom above this mark. Therefore PG-AMM offers the possibility to switch scales so that the 0 db mark no longer represents digital full scale. Examples are the QPPM/SPPM +9 dbfs or the K-System scales within Pinguin's Peak Meter. Using these scales, one can again use the 0 db mark (target level) as orientation. 8 Ballistics Ballistics describe the meter's response characteristics to an input signal (in terms of duration). Integration or attack time describes the duration until the input signal is fully displayed by the meter. Examples: QPPM: 10 ms (according to DIN the input signal is displayed by 90% after 10 ms) SPPM: 1 sample TPPM: less than 1 sample VU meter: 300 ms Return time, fallback time or decay describes the time it takes for the indication to fall back, for example by 20 db, after the signal is removed. The decay time affects the speed of the indicator's movement. PG-AMM lets you choose among fast, normal and slow. PG-AMM Manual - 8 -
9 System Requirements The system requirements depend on the version of PG-AMM you bought. The more instruments you plan to use simultaneously, the more CPU power Pinguin requires. 9 PC Operating System CPU RAM Windows 7 Vista Graphics MAC Windows XP minimum: 2.4 GHz Single Core or 1.6 GHz Dual Core at least 2 GB NVIDIA GeForce ATI Radon We strongly recommend NVIDIA, since some ATI cards have problems with multiple OpenGL windows. Operating System CPU RAM Graphics OS X or higher minimum: 2.4 GHz Single Core or 1.6 GHz Dual Core at least 2 GB NVIDIA GeForce ATI Radon Minimum Intel Graphics Mobile Intel 4 Mobile Intel 4 Series Express Chipset Family Since PG-AMM is using OpenGL for drawing, your Graphic card must support OpenGL 2.0 or better. PG-AMM Manual - 9 -
10 Installation The software CD contains setup files for both Windows and Mac OS X operating systems in directories named according to the respective computer architecture. PC Locate the PC folder on the software CD. The installation procedure is started by double-clicking the respective installer icon: SetPG-AMM-Lite.exe installs Pinguin Audio Multi Meter Lite SetPG-AMM.exe installs Pinguin Audio Multi Meter SetPG-AMM_EP.exe installs the enterprise extension SetLdnServer.exe installs LDN Server application The installation wizard allows to select the language used during the installation process (English, German) and asks the user to confirm or deny the license agreement. If you deny the agreement, no software is installed. MAC Only Stereo, Surround and Enterprise versions. At the end of the automated installation procedure, you have the option to install also the drivers that are required to gain access the USB Hardlock device (HASP). PG-AMM will not run when it cannot access the Hardlock device. Therefore, the HASP drivers have to be installed when you install PG-AMM for the first time. Subsequent updates of PG-AMM do not require the reinstallation of the HASP drivers, so the respective box can be unchecked in the install window. After installation, connect your USB Hard lock device (HASP) to your computer. Locate the MAC folder on the software CD. SetPG-AMM-Lite.dmg installs Pinguin Audio Multi Meter Lite SetPG-AMM.dmg installs Pinguin Audio Multi Meter SetPG-AMM_EP.dmg installs the enterprise extension SetLdnServer.dmg installs LDN Server application Double-click the desired image file. In order to install the software, you have to confirm the license agreement. Then, simply drag and drop the program file to your application folder. Only Stereo, Surround and Enterprise versions. Locate HASP SRM RTE Installer.dmg (within SetPG-AMM.dmg ). This file installs the drivers for the USB Hardlock device (HASP). Double-click it and follow the onscreen instructions. After installation, connect your USB hardlock device (HASP) to your computer. 10 PG-AMM Manual
11 Basic Functions 11 There are some basic functions in PG-AMM that apply to most of the instruments: Right-clicking into the display opens a pop-up menu in all instruments (except EBU Integrated, LEQ Numeric, LDN Logging/Server/Viewer). Display options, scale type, decay times etc. for the corresponding instrument can be set there. See the individual instrument's description for details. clicking into the meter window resets the display hitting the space bar resets all currently opened meters Window options At the top of each meter window, there are four different buttons: 'Quick routing' button Clicking the quick routing button opens a routing matrix. You can set the inputs for the corresponding instrument just like in the Meter Configuration. 'Fold/Unfold' button Minimizes the window size (only the window bar is displayed). Click again to re-open the window. 'Visible' button Press to close the window. To re-open it, select the instrument in the Eye Symbol menu in the Control Bar. 'Enlarge' button Enlarges the window to full screen. Click again to return to original size. All other main program settings are done in the Control Bar. PG-AMM Manual
12 Control Bar 12 Global configurations for the PG-AMM are made in the control bar: adding, storing and recalling workspaces (personalized meter setups), defining an audio device as input source, signal routing & audio settings. The Control bar is always visible in form of a small bar-shaped window. Closing the control bar means closing the application. Find below a description of all elements of the Control Bar from left to right. Eye Symbol: clicking on the eye symbol lets you control the visibility of all instruments in the current workspace. A left click opens a list of all instruments of the current workspace and offers the possibility to check the instruments that are actually to be displayed or to uncheck those you do not want to be visible. A right-click on this button will bring all instruments to front. Note: only instruments of the current workspace are listed to add instruments, go to the Meter Configuration in the Options menu. Workspaces: drop-down menu that displays the currently selected workspace and lets you choose among different workspaces that have been defined. Add/delete workspace: the current meter setup can be saved as workspace by clicking the + icon. A window opens where you can enter the new workspace name and also define a hot key for a quick recall of the respective workspace. Press the - icon to delete the currently selected workspace. Options: the Options button opens the Options dialog window which allows some additional program options and preferences to be viewed and set: All instruments can be switched on or off by selecting All on or All off. The Reset all item resets and restarts all visible instruments. The Reset position menu item rearranges all visible instruments such that the instrument windows overlap. Make sure to save the current meter setup as workspace before using this option if you want to keep the previous instrument layout stored for later use. You can press the CTRL+SHIFT key while starting PG-AMM to reset to default workspace! The Meter Configuration item opens the global signal routing matrix of the PG-AMM. PG-AMM Manual
, whereas the right part of the window contains a list of")
13 13 Meter Configuration Here, instruments are added and removed and the physical audio inputs of the selected audio device are routed to the inputs of the individual instruments. Add and remove instruments The left part of the window contains a list of all instruments available (depending on the version you bought), whereas the right part of the window contains a list of those instruments that are part of the current workspace. To add a new instrument (or another instance) to the current workspace, select the instrument you want to add (on the left side of the window) and press the + button in the lower section of the window. Alternatively, double-click the instrument you want to add. To delete an instrument, click on its ordinal number (in the leftmost column) and press the - button. Manual routing In the uppermost row, all possible inputs (1-8) for PG-AMM are displayed. Locate the row of the instrument you want to route and double-click into the corresponding matrix element. A drop-down list will show up and lets you choose the desired physical input of your audio hardware as input for the corresponding instrument. The color of the matrix will turn to green if routing is OK. If you chose a channel that is not available, the color of the matrix element will turn to red. If routing is not complete, the element will show up in yellow. Automatic routing Alternatively, routing can be done automatically by hitting the Route all (or Route selected if a row was selected before) button. PG-AMM will then route the physical input channels to all the instrument inputs in consecutive order (i.e. physical channel 1 is routed to input 1 of each instrument, channel 2 is routed to input 2 etc.) until all physical inputs are routed. To route one audio channel to all instruments at once, set the channel for one, then right click on that entry. A message box pops up to confirm your decision to set all corresponding instrument inputs to this audio channel. PG-AMM Manual

14 Settings opens the Global Settings window. CPU usage controls the priority of the PG-AMM process and is set to Normal by default. You might choose High if you run many instruments or instances at the same time. You might choose Low if you need to have other applications running at the same time or only have a very limited number of active instruments. Channel order lets you change the default channel number assignment by dragging and dropping a channel onto the desired channel number. Default: 1=Left 2=Right 3=Center 4=LFE 5=Sr_Left 6=Sr_Right Example: your stereo source is connected to inputs 3 and 4 of you audio device, and you want to perform automatic routing ( Route all ). Then you have to change the default settings in a way that inputs 3 and 4 are defined as input for Left(3) and Right(4) of the metering instruments. Katz scales can be set to Normal (logarithmic) or -20 db to max. linear (linear scale from -20 db to full scale) Consecutive overs defines how many overloaded samples (+FS or -FS) are considered a clipped signal which will turn the display color from yellow to red. It can be set from Use hires truepeak can be selected for more accurate oversampling when using true peak metering. Be aware that this increases the CPU load! Settings 14 PG-AMM Manual

15 Bar graph colors opens the Bar Color Settings window. Here you can change the color settings for the bar-graphs of LDN Meter, PPM and RTA/FFT Analyzer for selectable level ranges. The size of the small bar of the PPM can be set here too. 15 Show message log displays the contents of the message log since the last start up of PG-AMM About displays Hardlock (dongle) ID, program version and license features Check for updates tells you whether there is an update of PG-AMM available (Internet connection required!). Remote server: Activate a TCP/IP remote server by pressing this button. Does only work with VEDA hardware. In Wire Mode the first active instance of an EBU-Integrated instrument can the be started/stopped from within the PG-AMMWire plugin. Synchronized start/stop: Starts or stops all active EBU-Integrated and LEQ-Numeric instances simultaneously. Sticky move: lets you move all visible instruments at the same time without changing their relative positions. Collapse audio settings: hides all audio settings. Press again to reveal the audio settings. Audio settings: select the sample rate of the input signal select the audio driver you want to use (e.g. MME, ASIO etc.) select the audio device to be used as input for PG-AMM Inputs: displays the number of audio channels available with the selected audio device. If you are in ASIO mode, this button will open the ASIO driver settings. PG-AMM Manual

16 Quick Start Guide 16 How to get started quickly After installation, PG-AMM starts with a predefined default workspace which contains the following instruments: Goniometer Correlation meter LDN Meter PPM Meter FFT analyzer To get started quickly, do the following: connect the audio source you want to be displayed by PG-AMM to your audio device in the Control Bar, select your audio device, driver (ASIO, Core Audio etc.) & sample rate of the input signal Go to the Meter Configuration in the options menu and route the physical inputs of your audio device to the inputs of the PG-AMM instruments. If routing is OK, inputs will be displayed in green. When routing is done, press OK. turn the meters ON To add other instruments, return to the Meter Configuration. Double-click the desired instrument on the left side of the window to add it to the current workspace. Save your workspace by pressing the add workspace button (+) in the Control Bar. Give it a name and press OK. Note: applying changes in the Meter Configuration will turn all meters off. Select All On in the options menu (Control Bar) to turn them on again. Detailed information about Control Bar and Meter Configuration is provided at page12. Default Workspace PG-AMM Manual

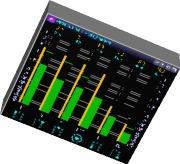
17 PPM (peak program meter) for Stereo, 5.1 and 8 Channel Surround Sound 17 The peak program meter is available for stereo and multi channel metering (Depending on the version you bought). There are always 2 different meters combined on one scale. Modes You can choose among 9 different modes: VU/SPPM QPPM/SPPM +9 dbfs QPPM/SPPM 0 dbfs K-20/SPPM (Wide-range Music) K-14/SPPM ('Pop' Music) K-12/SPPM (Broadcast) K-20 ITU/SPPM (Wide-range Music) K-14 ITU/SPPM ('Pop' Music) K-12 ITU/SPPM (Broadcast) Specifications of the different meters VU: vu meter with an integration and fallback time of 300 ms. SPPM: sample peak program meter with an integration time of 1 sample SPPM +9 dbfs: meter according to EBU's PPM standard of -9 dbfs (digital full scale on this meter is at +9 db; target level is at 0 db) QPPM: quasi peak program meter with an integration time of 10 ms K-20/14/12: meters according to the K-System. (full scale on these meters is at +12, +14 or + 20 db) True Peak: true peak meter with an integration time less than 1 sample (oversampling) Default By default, the ppm starts with a combination of vu and sppm meter. The green bar displays vu, the orange bargraph displays sample peak. The meter is ordered horizontally, peak hold is activated and the display range is from 0 dbfs to -96 dbfs. Decay time is set to norm and true peak is not activated. PG-AMM Manual


18 18 Settings Right-clicking into the meter enables you to change the default settings: select or deselect On to turn the meter on or off. deselecting Horizontal changes to a vertical view of the peak meter. Deselecting Peak hold deactivates the peak-hold function. That means that maximum levels are not permanently shown. The numerical display always shows the maximum level that occurred no matter whether Peak hold is activated or not. Clicking anywhere into the meter resets the meters display. in the Mode menu one of the nine modes can be selected. in the Display Range menu the range of the scale can be switched between -96 db and -144 db. Decay Time can be set to Fast, Norm or Slow. Selecting True Peak turns the SPPM into a true peak meter. Oversampling is used to detect peaks that might occur between samples. An extra range of +3 db is added to the scale in order to display inter-sample peaks up to 3 db above 0 dbfs. True Peak can be activated for any of the nine modes of the meter and remains active until it is deselected. True Peak is only in Stereo, Surround and Enterprise versions available! Examples: Stereo PPM with true peak activated. The green bar represents quasi peak level, the orange bar displays true peak level. PG-AMM Manual

.")
19 PPM for 5.1 surround sound - showing volume units (green) and sample peak level (orange) channel surround PPM in VU/SPPM mode. PG-AMM Manual
. If completely out of phase, the meter will show -1 (180 ). The maximum in and out of phase values are displayed numerically.")

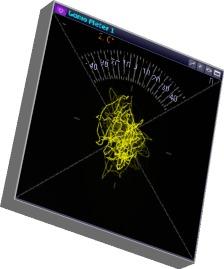
20 Correlation Meter The correlation meter shows the phase correlation between two audio channels. The display ranges from +1 to -1, respectively 0 to 180 phase difference. If both channels are completely in phase, the meter will show +1 (0 ). If completely out of phase, the meter will show -1 (180 ). The maximum in and out of phase values are displayed numerically. Maximum in phase values are shown in green, maximum out of phase values in red. Note that the numerical display is faster than the needle. Settings By right-clicking into the meter you can: turn the correlation meter On and Off. deselect Horizontal to change to a vertical view of the correlation meter. Correlation meter in a horizontal view. 20 Gonio Meter The gonio meter (or stereo meter) displays the stereo amount of a 2-channel signal. Just as the correlation meter, it shows phase differences but in a more precise way. If you get familiar with this instrument, you will be able to see the stereo amount of different frequencies or single instruments in a mix. The display consists of 2 diagonal axes, one for the left (L) signal, the other one for the right (R) one. For a signal only appearing on the left channel, the gonio meter would display a line going from top-left to bottom-right. A signal that is panned completely to the right would form a diagonal line going from right-top to bottom-left. The same signal on the left and right channel (mono) leads to a vertical line. If the signals are completely out of phase (180 ), a horizontal line is displayed. By default, the range between -45 and +45 is labeled. Settings Right-clicking into the meter lets you change the default settings: deselecting Show Degrees turns the labeling and the numerical display off Auto level control automatically adjusts the input level in order to have a good readability even with signals that are at low level. It is turned on by default, deselecting Auto level control turns it off. in the Settings menu you can adjust the line width (0.5-4 mm), persistence (0-500 ms) and line color of the display. PG-AMM Manual

 and analyzes their content.")
21 FFT Analyzer The FFT Analyzer shows the frequency content of an audio signal. The incoming signal is divided into single bands - and their level is displayed. Different types of analysis windows can be chosen, display mode, input mode, display range and decay times can be set. The level is displayed in steps of 0.2 db. At the top right of the analyzer window, the exact level and frequency at the cursor position are displayed. 21 FFT Analysis FFT stands for Fast Fourier Transformation - a mathematical method which divides the audio signal into blocks (windows) and analyzes their content. Pinguin uses a window size of 2048 Samples which leads to a frequency resolution of 21.5 Hz for audio material with a sampling frequency of 44.1 khz. Due to the logarithmic scale of frequency, this leads to a more precise resolution in the upper frequency range than in the lower range, as the resolution stays the same over the complete audio spectrum. Settings Right-clicking into the spectrum window lets you change the default settings and adjust the FFT analyzer according to your needs: select or deselect On to turn the analyzer on or off select or deselect Peak Hold in order to show or not to show maximum levels permanently Input Mode lets you define how the stereo input is handled. The default setting Left + Right makes the analyzer display the sum of the input channels. To only display the left or right input channel, choose Left or Right. Left Right will display the difference of the input channels. the Windowing menu lets you choose among 7 different types of (FFT) analysis windows - from Rectangular to Hamming. Rectangular is most precise as far as level display of short-term audio events are concerned - but not as precise concerning frequency display. If your main focus is more on precise display of frequency, switch to Welch, for example. PG-AMM Manual

22 Display Mode determines how white or pink noise are displayed by the analyzer. In this menu, you can switch to a linear frequency scale, too. Choosing Logarithmic, white noise flat will result in a flat display of white noise. (equal power in any band) Linear, white noise flat switches from the logarithmic to a linear frequency scale with a flat response to white noise. Logarithmic, pink noise flat leads to a flat display of pink noise. Compared to white noise, pink noise has a decrease of power density by 3 db per octave. Thus a well-balanced mix results in a more or less flat curve, if this mode is activated. (see examples below) the Display Range lets you determine the range of the level display. You can choose among -48/-60/-96/-144 db the Decay Time menu lets you choose the decay or fallback time of the level display ( Fast / Medium / Slow ) Snapshots opens the snapshots menu 22 The Snapshots menu Only Stereo, Surround and Enterprise versions. The FFT-Snapshots window lists all your snapshots there you can save them as a (.pgss) file, load other snapshot files, delete them or change the color of the level curve. Date, time, sample rate and windowing mode of the selected snapshot are displayed too. Check or uncheck snapshots in order to display or not to display them. To close the window, press the Close button at the bottom right of the window. Note: A snapshot is made by pressing the S button on the top-left of the analyzer window. You can then choose your snapshot in the drop-down menu just beside the S button in order to display the snapshot curve permanently in the analyzer window. Snapshots are saved temporarily until you quit the application. To save them, use the FFT-Snapshots window. PG-AMM Manual

23 23 Examples FFT analyzer in logarithmic, white noise flat mode: FFT analyzer in logarithmic, pink noise flat mode: PG-AMM Manual

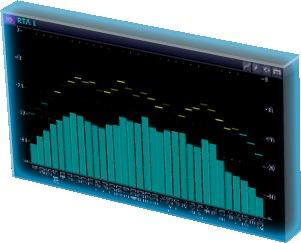
24 RT(A) Analyzer 24 The real time analyzer (RTA) divides the audio spectrum into third-octave bands and displays the level of each of it. Contrary to the FFT analyzer, the RTA uses bandpass filters to divide the audio spectrum into frequency bands. Settings Right-clicking into the RTA lets you change the default settings: select or deselect On to turn the RTA on or off select or deselect Peak Hold to enable or disable the peak-hold function Filter Q lets you choose the quality of the bandpass filters; you can choose between 18 db/octave or 24 db/octave Input Mode just as in the FFT analyzer, you may choose whether you wand the sum, the difference or only one of the input channels to displayed Display Range lets you select a level range up to 144 db to be displayed Decay Time can be switched among Fast, Normal and Slow PG-AMM Manual


25 Spectral View 25 The spectrometer displays three parameters of an audio signal simultaneously: time (xaxis), frequency (y-axis) and level (color). It lets you observe the audio spectrum over a definable period of time. Low levels are represented by a deep blue color, and the higher the levels are, the more the color display changes to light blue, green, yellow and then red with all the graduations that lie between. This instrument is not scalable, but you can zoom in vertically by a factor of 2. Settings Changing the default settings in done by right-clicking into the instrument: select or deselect On to turn the Spectral View on or off if Auto Start/Stop is selected, the measurement will automatically stop when there is no input signal, and the level display will stop moving. When an input signal is detected, the display will automatically start moving and displaying the audio signal. PG-AMM Manual
26 Auto stop time defines how long it takes until the meter stops measuring when there is no active input signal. The Auto stop time can be set among 1 second and 1/16 of a second. Vertical zoom lets you zoom in vertically. x2 doubles the size of the frequency scale. History time defines the period of time that is displayed by the spectrometer. It can be set to 20, 10 or 5 seconds. Shortening the period of time of course leads to a faster movement of the level display as the window size stays the same. Color Spectrum can be switched from linear to extended. The extended setting will stretch the spectrum to make easier to distinguish among the colors. db Range lets you choose the volume range that is displayed by the spectrometer. To display audio material with a large dynamic range may require a wider volume range setting than for material which is less dynamic. You can choose among 4 settings: a range of 144 db, 96 db, 60 db or 48 db. Input Mode lets you choose whether you want the sum ( Left + Right ), the difference ( Left - Right ) or only one of the input channels ( Left or Right ) to be displayed in the Windowing menu, you can change the FFT analysis window (see FFT Analyzer for details) Display Mode defines how the spectrometer displays white noise or pink noise. Logarithmic, white noise flat & Logarithmic, pink noise flat can be chosen. Direction lets you choose whether the display moves from Left to right or Right to left 26 PG-AMM Manual


27 LDN Meter The LDN (loudness) meter displays the perceived loudness of audio signals. The algorithm takes into account all factors that influence the human perception of loudness. The meter displays LU, which stands for Loudness Units. The LDN meter can show momentary or short-term loudness according to EBU R Settings Right-clicking into the meter lets you change the settings for the LDN meter: select or deselect On to turn the LDN meter on or off deselect Horizontal to change to a vertical view of the meter select or deselect Peak Hold in order to show or not to show maximum levels permanently (the numerical display always shows the maximum value that occurred regardless of whether peak hold is activated or not until you reset the meter by left-clicking into it) the ITU RMS window size defines the measurement period, which can be 0.4 seconds or 3.0 seconds. Selecting 0.4 seconds will make the meter display 'momentary loudness', whereas the 3 seconds period results in a display of 'shortterm loudness'. Choosing 'momentary loudness' results in a faster display of the input signal 'short-term loudness' setting makes the meter reacts less fast and results in a smoother movement of the bargraph. The selected window size is always displayed on the left side of the LDN meter. Scale type lets you select three different types of scale: -96 db LUFS, -23 db LU & -24 db LU. -96 db LUFS is a scale relative to full scale it ranges from -96 db to 0 db. -23 db LU is a scale type with a target level of -23 db LUFS represented at the 0 db mark. Thus the scale ranges up to +23 db. The scale type of -24 db LU is very similar, with a target level of -24 db LUFS represented at the 0 db mark - the scale ranges up to + 24 db. select Use decay to activate a fallback time (for better readability when displaying 'momentary loudness') PG-AMM Manual
, loudness range & true peak levels.")
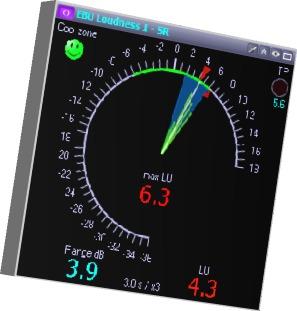
28 EBU Loudness This EBU loudness instrument is an innovative, new instrument developed by PINGUIN. It makes it easy to have an overview about the loudness relations of your material at the first view. EBU Loudness displays loudness (LU), loudness range & true peak levels. Loudness, loudness range and maximum LU values are shown graphically on a kind of tachometer display as well as numerically at the bottom of the instrument, respectively below the middle of the scale ('max. LU'). True peak levels are displayed numerically at the top right of the meter. History time and Ray zoom factor are displayed below the scale. A loudness range can be defined, which is highlighted on the meter's scale. This range is called Cool zone. If the loudness of the input signal is within the 'cool zone', you see a green smiley at the top left of the meter. If the incoming signal is out of this zone, you see an alert in form of a red arrow pointing downwards or a yellow arrow pointing upwards depending on whether the signal's loudness is above or below the defined range. The scale of EBU Loudness meter is always arranged around the target loudness. 28 Settings Right-click into the instrument to change the default settings: select or deselect On to turn the EBU Loudness meter on or off History time lets you choose whether momentary (0.4 Sec.) or short-term loudness (3.0 Sec.) is displayed. If momentary loudness is selected, the meter of course responds more quickly to the input signal. Ray zoom & Ray width determine the settings for the rays which show the db statistics. The rays are arranged around the LU indicator and provide more detailed information about the loudness distribution. In the Ray zoom menu, you can turn the rays off or zoom in up to a factor of 4. Ray width lets you alter the width of the rays, from thin (1) to thick (5). Scale range offers four different scales: 48 db, 60 db, EBU +9 and EBU +18. When in LU mode, the 0 db mark of both the 48 db and the 60 db scale corresponds to a PG-AMM Manual


29 target loudness of -23 db LUFS. They both display levels up to +23 LU. They differ in the range that is shown below the 0 db mark (-25 db respectively -37 db below 0 db). For audio material with a wide dynamic range, you might choose the 60 db scale. The scales of EBU +9 & EBU +18 reach up to +9 respectively +18 LU. They differ in the headroom above 0 and in the range that is displayed by the meter's scale (EBU +9/27 db or EBU +18/54 db). You might choose the +18 scale for program material with a large dynamic range. All scales display the target loudness at the 12 o'clock position. Scale mode lets you switch from LU to LUFS for the 48 db and the 60 db scales. Levels are then shown relative to full scale. The Scale mode menu is only available for the 48 db or 60 db scales. the Settings menu allows you to customize the true Peak threshold, the Cool zone and the Target loudness level: Peak threshold determines at what true peak level the true peak display ( TP, at the top right of the meter) begins to flash red. The threshold can be set between 6 db and 0 db below 0 LKFS (in steps of 0.1 db). The numerical display changes from light blue to red once the threshold has been (reached or?) exceeded. Maximum true peak values are displayed numerically until you reset the meter. The Cool zone is located around the target level and displayed in a green color. Start and End of this loudness range can be set between 1 db and 12 db below, respectively above the target level in steps of one db. Target loudness can be set from -10 db LKFS to -24 db LKFS in steps of one db. The scale of the EBU Loudness meter changes according to this setting, so that the target loudness is always shown in the top middle of the display. When in LU mode, the target level is always represented by the 0 LU mark. Example EBU Loudness meter with a 60 db-scale showing LU target level of -23 LUFS 0 LU History time is set to 3.0 seconds ( shortterm loudness) db statistic rays are turned off loudness is within the cool zone max LU 2.4 LU short-term loudness 0.2 LU loudness range: 11.0 db Note: this is a shortterm loudness range, not to be confused with LRA defined by EBU R-128! true peak: -7.8 dbtp 29 PG-AMM Manual
. The meter's record function allows to do a longtime measurement, even for several days.")
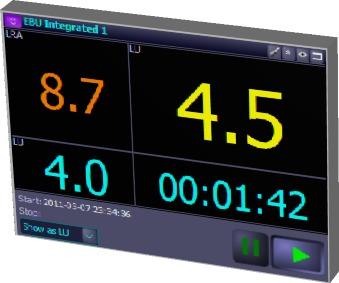
30 EBU Integrated 30 The EBU Integrated is a loudness meter according to EBU R-128 which displays Loudness Range (LRA), integrated (EBU-I) and short-term loudness (EBU-S) numerically. EBU-I and EBU-S values are shown as LU or LUFS (switchable). The meter's record function allows to do a longtime measurement, even for several days. Move the cursor over the display for information about the displayed values. When the meter is turned on, short-term loudness (EBU-S) is always displayed, no matter whether the longtime measurement is running or not. Pressing the play button starts the longtime measurement. Pressing it again will stop the measurement and the LRA and EBU-I values will be displayed in green color. If you wish to interrupt the measurement, press the pause button. Press it again to continue the measurement. During measurement or during an interruption of the measurement, LRA values are displayed in orange, EBU-I values in yellow. When measurement is stopped, these values will be displayed in green color. The duration (hh:mm:ss) of the measurement is displayed at the bottom right of the meter. Date and time of the measurement's beginning and end are shown at the bottom left of the meter. The Loudness Range is displayed in LU. The higher the variation of the loudness measurement is, the larger the LRA value will be. Thus, the LRA value gives an indication on how much dynamic compression has been or has to be applied to the incoming audio signal. Highly-dynamic material might have a LRA value of approximately 20 LU, for example. PG-AMM Manual


31 After a measurement you can use the Show/Print report button at the bottom to show or print a report together with a histogram of the loudness data. 31 You should enter a user or studio name in the settings dialog, since this will be used in printout. PG-AMM Manual
 SPL. Sound pressure levels and full scale level are displayed numerically, as well as the duration (hh:mm:ss) of the measurement.")
32 LEQ Numeric 32 The LEQ Numeric is a meter that allows you to perform loudness measurements using different weighting curves. LEQ expresses the energy equivalent sound level. By default, -20 dbfs RMS is equivalent to 85 db(a) SPL. Sound pressure levels and full scale level are displayed numerically, as well as the duration (hh:mm:ss) of the measurement. When the meter is turned on, the momentary sound pressure level of the input signal is constantly displayed in the top left field of the meter. A long-term measurement is started by pressing the play button. The duration of the measurement is shown in the duration window. Pressing the play button again stops the measurement. The loudness measurement is performed according to the weighting curve displayed in the drop-down menu of the meter. It lets you choose among five different curves: LEQ(flat), LEQ(a), LEQ(m) Dolby DD, LEQ(m) Dolby SR, LEQ(RLB2)ITU. The result of the long-term measurement is displayed in the top right field of the meter. The value is shown in yellow during measurement when measurement is stopped, the value is displayed in green. Pressing play again starts a new measurement, and the duration display starts from zero again. If a long-term measurement has been made, the date and time of it's beginning and ending ( Start and Stop ) are displayed. At the bottom of the LEQ Numeric, you can calibrate the meter. By default, -20 dbfs RMS is equivalent to 85 db(a)/spl. This value can be changed from 40 up to 100 in steps of one db. PG-AMM Manual
 and to see if")
 with the center speaker at 0º.")
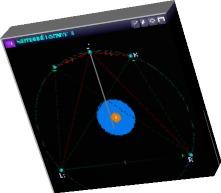
33 Surround Locator The Surround Locator lets you observe the total level in the surround field, its position, as well as phase relationship between audio channels in a 5.1 surround setup. Besides level metering of the individual channels, it is important to get an overview whether your surround mix is well-balanced (level-wise in relation to the listener's position) and to see if there might be some phase problems between the 5 channels. The Surround Locator simplifies this task. The display consists of a circle on which the speakers are arranged (left, right, center, left surround and right surround) with the center speaker at 0º. The middle of the circle represents the listener's position. All speaker positions are connected by lines on which the phase relationship among all channels is shown (in green for values less than 90º, in red for phase shifts greater than 90º). A blue ball represents the total level of the surround mix. The higher the overall level, the larger the ball gets. Its position shows you the level distribution in the surround field. The exact middle of the ball is shown by a small dot. A yellow ball in the middle of the blue ball represents the LFE ('Low frequency effects' or '.1') channel. The size of this ball grows according to the level of the LFE channel. 33 Settings To adjust the Surround Locator to your metering needs, right-click into it: select or deselect On to turn the Surround Locator on or off. the Pentagon menu lets you change the speakers' position. You can choose among 30º/120º, Regular and an user definable setting. Note that the specified angle expresses the angle starting from the center speaker (0º). The user setting can be defined in the Settings menu. deselecting Show correlation lines turns the color display of phase relationship off. deselecting Show correlation positions turns the correlation display off. PG-AMM Manual
 for Front and Rear speakers can be set between 20º and 80º ( Front ) respectively 100º and 150º ( Rear ). Your personal setting is selectable in the Pentagon menu.")
34 the Settings menu lets you define your personal speaker setup ( User pentagon ), a Cool correlation range, LFE accentuation and the brightness of the correlation display. Speaker positions (angles) for Front and Rear speakers can be set between 20º and 80º ( Front ) respectively 100º and 150º ( Rear ). Your personal setting is selectable in the Pentagon menu. Start and End of the Cool correlation range can be defined by entering phase-shift degrees for start (90º - 45º) and end (45º - 0º) of the range. LFE lets you raise the level of the LFE channel by 6 db or 12 db. Display lets you change the brightness of the correlation lines from 0 to 100, with 100 being maximum brightness. If set to zero, the lines completely disappear and only show up in red if phase-shifts greater than 90º occur. 34 PG-AMM Manual


35 Multi Frequency Correlator The new implemented Multi Frequency Correlator is an instrument that shows the phase correlation between two audio channels in 32 third-octave bands. 35 It gives you a very good impression what happens to the phase depending on the frequency. It s well-suited to check reverb units, stereo extender and any kind of compression like mp3 or even to just check what s going wrong with your mix or master. PPM Multi Stereo This instrument provides 8 stereo channels with individual labeling and coloring. Usefully for broadcast stations to measure multiple stereo streams. PG-AMM Manual

36 PG-AMMWire Plugin The wire plugin provides a way to send signals to PG-AMM without using your sound card inputs. It is available as VST, RTAS and AU. It can be inserted in your DAW and send up to 32 channels to PG-AMM This plugin is part of all editions of PG-AMM. 36 Usage: Insert the plugin into the master channel or any other channel in your DAW. You can insert multiple instances. Open the plugin and route the channels you want to send to PG-AMM. Open the settings dialog in PG-AMM, set PG-AMM Wire Mode to Yes and click OK. PG-AMM will now switch to wire mode and change the display in the main bar. The green cable signalizes that you are connected, it s red if no connection could be established or black none of the instruments is switched on. You can see the sample rate the host is running, as well as a display of the routed channels. These channels can now be routed to several instruments. The bar shows also the number of connected plugins. To prevent double routing, the numbers of the output channels in the plugins routing matrix will be colored green for single routing or red if the same channel is routed in an other instance. In wire mode the audio block size in the host should not exceed 512 sample to prevent unnecessary latency in metering. Wire Mode and EBU Integrated Remote Server PG-AMM Manual

 as well as on a remote one.")
37 LDN Logging 37 The LDN Logging instrument enables you to perform a network longtime logging of True Peak, QPPM and ITU Loudness with the Pinguin LDN Server. Measurement is always performed with the sum of the input channels. LDN Logging is the sender, Loudness Server is the receiver. The results of the measurement performed by LDN Logging can be sent over TCP/IP to the Pinguin Loudness Server, who logs the incoming data. The Loudness Server application can be running on the same computer as the LDN Logging (offline logging) as well as on a remote one. In this case, both computers need to have an active network connection. The recorded data can be displayed in the Pinguin LDN Viewer (freeware) who allows you to analyze and to print the logged data. You can choose between two different logger windows in the Settings dialog. Big logger: Simple level bar graphs for input and output signals. Small logger: Yellow, green or red (depending on signal level) LED's light up for each active input channel. Blue means digital zero. Logging is started by pressing the Start logging button. During logging, the window bar color changes to red and an antenna symbol shows up. The server's IP and Port are displayed, as well as log time. LDN Logging can only send data if it can successfully connect to the running Loudness Server application. Therefore, you have to enter the correct TCP/IP address of the Loudness Server to which you want to connect. PG-AMM Manual
 you want to be logged by selecting")
38 38 Settings TCP/IP and logging settings are done in the settings menu. To access it, press the Settings button: enter the Server IP and the corresponding Port of the Pinguin Loudness Server Choose the channels (True Peak, QPPM and ITU) you want to be logged by selecting it in the Logging field (by default, all three are selected). Deselect the channel you do not want to be logged. Enter unique device name in the Client name field. It will appear in the connected Loudness Server during logging, and the log-file will be named according to the name you entered. Your name will also appear in the window bar of the LDN Logging. Log mode lets you choose among 3 different analysis window sizes for the measurement: ~1.0 s log time, EBU, 3.0 s RMS; ~1.0 s log time and 10.0 s RMS; ~1.0 s log time. The first setting (1.0 s log time) leads to a log file which lets you determine LUFS and LRA according to EBU. The second one (3.0 s RMS) is equivalent to EBU-S. To calculate EBU LU and LRA values in the LDN Viewer, ~1.0s log time, EBU must be used! PG-AMM Manual

39 39 PG-AMM network logging example Studio 1 Studio 2 PG-AMM PG-AMM TCP/IP LDN Server PG-AMM Manual
 24 hours a day.")
40 LDN Server 40 The LDN Server application (Pinguin Loudness Server) is a TCP/IP network server. It can receive and log data coming from the LDN Logging instrument, which is the client. LDN Server can log data from up to 8 clients simultaneously (depending on version) 24 hours a day. For each day, a new log file is generated, which can be viewed and analyzed in the built-in viewer application. A Log window displays the history of connections to the server and the server's status with date and time. The Connected clients window displays the client/s that is/are connected to the Loudness Server. If you press the Run button, the server is listening. It is now ready to log incoming data. As soon as a client (LDN Logging) connects to the server, the Client's name is shown in the Connected clients window. A green signal light next to the client's name indicates that data is currently being logged. All actions are listed in the Log (history) window. During logging, a graphical overview for each client displays the incoming data (Peak/QPPM/Loudness). In order to receive data, the server has to be running. This is done by pressing the Run button. Pressing it again deactivates the Loudness Server and all clients are disconnected. The Viewer button opens the built-in LDN Viewer application, which lets you watch, analyze and print the logged data. PG-AMM Manual

41 Settings Pressing the Settings button opens the settings menu. It is only accessible when the Loudness Server is not running. Server IP displays the server's IP address. In the drop down menu, choose Manual if you want to enter the server IP manually or Auto if you want the IP to be automatically assigned. The port number is entered in the TCP/IP port field. You can switch between two different IP settings by selecting the Active field for one of the two settings. Log path defines the folder your log files will be saved to. The path is displayed in the main window of the LDN Server too. By default, log files are saved to the Audio Multi Meter folder within the PG-AMM program folder. Press to select a different destination. If Show horizontal marker is selected, a dashed horizontal line is shown at a definable db position. You can change the position of the marker in the drop down menu (from -15 db to +8 db in steps of one db). Deselect if you don't want the marker to be displayed. you can change the logarithmic scale into a linear scale by deselecting Logarithmic meter scale if +9 db scale is selected, the scale will reach up to +9 db (9 db headroom above 0 db) EBU-I loudness display mode lets you choose whether you want 'LU' or 'LU relative to full scale' (LUFS) to be displayed selecting Auto run server after start will automatically activate the server after the application is started 41 PG-AMM Manual
 generated by the LDN Server.")
42 LDN Viewer 42 The LDN Viewer is needed to display, analyze and print the results of the logging process, done with LDN Logging and LDN Server. It is integrated into the LDN Server application, but is also available separately as a free download. It can open and display the 'Loudness protocol files' (.ldf) generated by the LDN Server. By default, these files can be found within Pinguin's application folder. If you can't find them, check the Log path in the LDN Server's settings menu. To open the viewer, press the Viewer button in the LDN Server. Alternatively, open the standalone Viewer application manually. Operation & Settings At the top left of the viewer, a calendar is displayed. By selecting a day, all log-files that were created on that specific day are displayed in the Clients field. There are two displays for the measurement data, called Plots. They show Peak/QPPM and Loudness on the y-axis and time on the x-axis. Note: if you don't want Peak, QPPM or Loudness to be displayed, simply deselect the corresponding symbol at the top of the plot display window. To display a protocol file in a plot, select the file you want to view and press the Add file to plot button. This can be done for Plot 1 or Plot 2. Alternatively, double-click a protocol file to add it to Plot 1. To remove a file from a plot, select it and press the remove button. PG-AMM Manual
43 When a log file is selected, detailed information about the file is shown below the Clients field: name of the sender, sample rate, loudness window size, log mode, log types, start/end time and duration of the measurement. The two display windows of Plot 1 and Plot 2 enable you to compare different measurement results. By default, a period of 24 hours is displayed on the time axis. When moving the cursor over the display, level and time of the current position are displayed. 43 Toolbar Use the Sync 2 1 or Sync 1 2 buttons to synchronize the display of Plot 2 to Plot 1 or vice versa. Pressing one of the buttons results in both displays showing the same time span (and therefore at the same zoom level). Print preview shows you a preview of the printout in a new window. You can zoom in and out from 10% to 200%. Press the Print button in order to print the measurement results. to directly print the results, press the Print button. Pressing the Zoom to time range button opens a new window in which you can enter Start and Duration of a time range you wish to view. You can apply the settings to plot 1, 2 or Both of them. the Zoom 100% plot 1 and Zoom 100% plot 2 buttons reset the zoom level the default time range of 24 hours is displayed. Same can be done with the middle mouse button. The Zoom tool is selected by default. Make a selection in order to fully zoom into the selected area. Alternatively, use the +/ buttons to zoom in or out horizontally and vertically. Pressing the Shift key while using the Zoom tool will switch to Selection mode The Selection tool lets you select an area you wish to analyze. Maximum true peak, maximum quasi peak, ITU loudness, EBU integrated and loudness range (LRA) as well as the duration of the selected area are displayed at the left of the plot window. Loudness plot average window size is set to OFF by default. It can be set among 8 and 240 seconds. You must reload the current file to display the data with the new Average window size PG-AMM Manual


44 K-System The K-System is a proposal by mastering engineer Bob Katz to put monitor gain and metering into relation. The K-System provides 3 different scales for different kinds of audio productions. The aim is to overcome major loudness differences of music productions that exist today and - at the same time - to encourage a better use of the available dynamic range. 44 Background The transition from analog to digital led to chaos as far as overall loudness consistency of music productions is concerned. As the physical limitations of analog media no longer exist when recording onto a digital medium, engineers around the world are tempted to produce recordings with more and more increasing loudness using heavy compression and limiting as loud always sounds better at first glance. The result led to music and audio productions whose average levels are almost as high as the peak levels by accepting distortion and loss of quality in terms of dynamic range or spaciousness of a recording. In addition, the loudness of recordings varies extremely, which forces the consumer to adjust his listening volume constantly when listening to different CD's, for example. The K-System offers the means to bring the 'loudness race' to an end - for the sake of better sounding recordings with more consistent overall loudness. The K-System offers three distinct meter scales which are intended to be used with different program material - each scale combined with a calibrated monitor gain: K-20 for wide dynamic range material (audiophile music, classical music) K-14 for less dynamic productions like pop & rock music K-12 for program material intended to be broadcast A main characteristic of the scales is that the 0 db mark does not represent full scale. Same as with an analog meter, the 0 db point represents a reference mark (target level). 20, 14 & 12 describes the headroom above the 0 db mark of the corresponding scale. The meters are intended to show both average (e.g. RMS) and sample peak level on one scale. Full scale is at the top of each meter (at +20, +14 or +12 db). Picture: PG-AMM Manual
45 45 Using the scales The use of K-System metering implies that you calibrate your monitor gain to 83 db(c)spl for pink noise showing 0 db on the K-scale. When switching from K-20 to K-14 for example, you will have to attenuate your monitor gain by 6 db in order to have the same sound pressure level at the 0 db position. That means: once your sound system is calibrated according to the K-System, all you have to do is to adjust the monitor gain (for example +/-6 db) when switching to another K-scale. The result is a reproducible monitor level for different styles or kinds of audio productions you work with. As the K-System provides sufficient headroom, you won't have to worry much about digital clipping. It enables you to judge the loudness by your ears, and, to a certain degree, ignore the meter concentrating solely on the music. PG-AMM Manual

46 EBU R The problem of major loudness differences in and among different programs and channels (Radio/TV) led the EBU (European Broadcasting Union) to recommend a new audio-leveling method for broadcast - based on perceived loudness. It is published & described in a document called EBU R-128. Background The PPM-standard that exists today only takes into consideration the (quasi) peak values of audio signals. As these values do not reflect perceived loudness, programs with the same peak level may be considerably different in terms of loudness - due to the sometimes extensive use of compression and limiting. This forces the viewer or listener to adjust the volume or even to mute sound during advertising breaks or at the transition from a movie to a trailer, for example. The aim of the EBU is to introduce a new metering standard - combined with a specified target loudness - that leads to overall consistency of perceived loudness in Radio & TV. The basis of EBU R-128 is a technical document called ITU-R BS which defines the algorithms to measure loudness & true-peak level. Picture: EBU Details EBU R-128 specifies three new parameters to describe program material: Program Loudness Loudness Range True Peak Level In addition, a target level for program loudness and maximum true peak level are defined, which all programs should be normalized to. The actual program loudness (in LUFS) shall be indicated in metadata of the audio file. PG-AMM Manual
47 Program Loudness: Program Loudness describes perceived loudness of a program (movie, trailer, commercial ) in its entirety. Therefore an integrated long-term measurement (EBU-I) is used. A gate is applied so that low-level passages do not affect the result of the measurement - as they would falsify the result. Program Loudness is described in LUFS (loudness units relative to digital full scale). EBU R-128 specifies a target level of -23 LUFS. Deviations of +/- 1 LU are tolerated for programs with levels that are often not predictable (e.g. live programs). Loudness Range: Loudness Range (LRA) describes the variation/distribution of loudness within a program. The measurement excludes extremes (e.g. a single gunshot). LRA is a clue for dynamic compression that has been or has to be made. EBU R-128 does not specify a maximum or minimum LRA, as it may vary depending on the genre of the program. Yet the EBU encourages to use this parameter to adjust the dynamic or loudness range according to the intended use of the material. LRA is described in LU. Highly dynamic material might have a LRA of approximately 20 LU, for example. True Peak Level: True Peak Level is used to describe the 'true peaks' of an audio signal. Contrary to a quasi peak program meter (QPPM) or a sample peak program meter (SPPM), a true peak meter uses oversampling in order to display the inter-sample peaks of a waveform. Usually, 4-times oversampling is applied. EBU R-128 recommends a maximum true peak level of -1 dbtp. Measurement of loudness - the tree time scales Loudness meters that implemented 'EBU Mode' can display loudness in up to three different ways - according to three different time scales (window lengths / integration times): momentary loudness (EBU-M) window length: 0.4 s short-term loudness (EBU-S) window length: 3 s integrated loudness (EBU-I) long-term integrated loudness measurement using a gating function, from beginning to end of a program 47 The following instruments in PG-AMM have implemented 'EBU Mode': LDN Meter (EBU-M & EBU-S) EBU Loudness (EBU-M & EBU-S) EBU Integrated (EBU-I, EBU-S & LRA) Note that the loudness range ( Range ) displayed by EBU Loudness meter does not comply with the specifications of EBU R so do not confuse it with LRA. PG-AMM Manual

48 Using PG-AMM in Audio-Production & - Postproduction Using PG-AMM during stereo mastering The most important measurement tools you possess are your ears. Combined with lots of experience, selected gear & a well balanced mixdown, a great sounding master can be achieved. PG-AMM helps you on that way - and might even reveal problems that you wouldn't have noticed without the metering system. Preparation The first thing to do before starting a (pre-)mastering project might be to set up a workspace containing all instruments you need to control the program material. These are at least: correlation, gonio meter, ppm and fft analyzer. We recommend activating true peak so that you can see whether there are digital overs that one wouldn't notice using a sppm or qppm. For loudness matching, it is very helpful to use a loudness meter, too. This can be the LDN meter or EBU Loudness, for example. Think about a possible target loudness of your mastering project - depending on the style of the material and the client s demand. Besides EBU Loudness meter, using the K-System is a good method for this purpose. 48 A workspace suitable for mastering might look like this: PG-AMM Manual
49 49 Mastering When starting mastering, the first thing to do is usually to listen through the complete audio material that is to be mastered. At this stage, it might be better not to look at PG-AMM (turn your display off, for example) but to have it running in the background. By that you can judge the sound of the material by your ears only - and afterwards be able to see if there are digital overs which you probably have not noticed before. During mastering, pay attention to the lower frequency range that your monitor system might not reproduce. Levels that are musically not relevant (e.g. below 20 Hz) can be attenuated by using a hi-pass filter. The FFT analyzer also reveals DC offset. If your master needs to be compatible to mono playback, make sure the phase correlation is within an acceptable range. Final judgment is made by switching your monitor system to mono (sum of L+R). When performing dynamic compression, take a look at the difference between average and peak level (e.g. VU/sppm). The more compression is applied, the less the difference will be. Keep in mind that too much compression can lead to less punch combined with audible gain changes ('pumping'). The amount of compression depends on the style of the program material, of course. If the mastered signal exceeds 0 dbfs, you will need to apply a peak limiter at the end of your mastering chain. When mastering is done, listen carefully through the whole material again. Besides great sound, there should be no digital overs or musically irrelevant low frequency levels. To make sure this is the case, look at the ppm and the FFT analyzer. Loudness matching If you want different titles to be more or less at the same loudness level, it can be helpful to use LDN meter or EBU Loudness in addition to your ears. If using EBU Loudness, you have the possibility to set a target loudness with a 'cool range' around it. The example shows EBU Loudness with a target loudness of -15 LUFS. You can use the 0 db mark as orientation. This loudness suits well for a quite dynamic pop production. PG-AMM Manual
, and that there's musically irrelevant level below 30 Hz.")
50 50 Problematic audio material The example below shows data reduced audio material with DC offset. FFT analyzer reveals that there are no levels above about 15 khz (data reduced), and that there's musically irrelevant level below 30 Hz. If your client offers you this kind of material, ask him to send you a new file without these problems. If it is not available, you'll have to apply a hi-pass filter at least. PG-AMM Manual

51 Workspace example 51 PG-AMM Manual
Contents. Welcome to LCAST. System Requirements. Compatibility. Installation and Authorization. Loudness Metering. True-Peak Metering
 LCAST User Manual Contents Welcome to LCAST System Requirements Compatibility Installation and Authorization Loudness Metering True-Peak Metering LCAST User Interface Your First Loudness Measurement Presets
Sonoris Meter VST 2.0
 Sonoris Meter VST 2.0 User Manual Introduction 2008 Pieter Stenekes info@sonoris.nl Copyright Sonoris Audio Engineering 2008 www.sonoris.nl 1/11 Thank you for choosing Sonoris Meter! What is it? With this
DRAFT RELEASE FOR BETA EVALUATION ONLY
 IPM-16 In-Picture Audio Metering User Manual DRAFT RELEASE FOR BETA EVALUATION ONLY Ver 0.2 April 2013 1 Contents Introduction...3 In Picture Audio Meter Displays...4 Installation...7 External Audio Board
Version 1.2 User Manual
 Version 1.2 User Manual Last Revised 31 May 2013 Copyright VSonics Limited 2010-13 1 End User License Agreement PLEASE READ THE FOLLOWING LEGAL AGREEMENT CAREFULLY PRIOR TO USING THE VMETERS SOFTWARE PROVIDED
Liquid Mix Plug-in. User Guide FA
 Liquid Mix Plug-in User Guide FA0000-01 1 1. COMPRESSOR SECTION... 3 INPUT LEVEL...3 COMPRESSOR EMULATION SELECT...3 COMPRESSOR ON...3 THRESHOLD...3 RATIO...4 COMPRESSOR GRAPH...4 GAIN REDUCTION METER...5
MAutoPitch. Presets button. Left arrow button. Right arrow button. Randomize button. Save button. Panic button. Settings button
 MAutoPitch Presets button Presets button shows a window with all available presets. A preset can be loaded from the preset window by double-clicking on it, using the arrow buttons or by using a combination
Eventide Inc. One Alsan Way Little Ferry, NJ
 Copyright 2015, Eventide Inc. P/N: 141257, Rev 2 Eventide is a registered trademark of Eventide Inc. AAX and Pro Tools are trademarks of Avid Technology. Names and logos are used with permission. Audio
Level Magic. Copyright Flux All rights reserved. Copyright Jünger Audio GmbH All rights reserved.
 Level Magic Copyright Flux 2015. All rights reserved. Copyright Jünger Audio GmbH 2015. All rights reserved. Level Magic LevelMagic is a comprehensive Real Time and Offline loudness measurement, correction
Abbey Road TG Mastering Chain User Guide
 Abbey Road TG Mastering Chain User Guide CONTENTS Introduction... 3 About the Abbey Road TG Mastering Chain Plugin... 3 Quick Start... 5 Components... 6 The WaveSystem Toolbar... 6 Interface... 7 Modules
SPL Analog Code Plug-ins Manual Classic & Dual-Band De-Essers
 SPL Analog Code Plug-ins Manual Classic & Dual-Band De-Essers Sibilance Removal Manual Classic &Dual-Band De-Essers, Analog Code Plug-ins Model # 1230 Manual version 1.0 3/2012 This user s guide contains
AB-Loudness Match. Manual. by TBProAudio (C) TBProAudio 2018 Page 1 of 9
 TBProAudio 2018 Page 1 of 9") AB-Loudness Match Manual by TBProAudio 2018 (C) TBProAudio 2018 Page 1 of 9 1 Introduction Welcome to AB_LM, a gain control which enables level matched and sample accurate AB comparison of FX chains. We
AB-Loudness Match Manual by TBProAudio 2018 (C) TBProAudio 2018 Page 1 of 9 1 Introduction Welcome to AB_LM, a gain control which enables level matched and sample accurate AB comparison of FX chains. We
Manual for the sound card oscilloscope V1.41 C. Zeitnitz english translation by P. van Gemmeren, K. Grady and C. Zeitnitz
 Manual for the sound card oscilloscope V1.41 C. Zeitnitz english translation by P. van Gemmeren, K. Grady and C. Zeitnitz C. Zeitnitz 12/2012 This Software and all previous versions are NO Freeware! The
LA xlimit. Manual. by tb-software (C) tb-software 2015 Page 1 of 6
 tb-software 2015 Page 1 of 6") LA xlimit Manual by tb-software 2015 (C) tb-software 2015 Page 1 of 6 1 Introduction Welcome to LA xlimit, a look ahead, wideband linked-stereo limiter including ISP (inter sample peak) detection and oversampling.
LA xlimit Manual by tb-software 2015 (C) tb-software 2015 Page 1 of 6 1 Introduction Welcome to LA xlimit, a look ahead, wideband linked-stereo limiter including ISP (inter sample peak) detection and oversampling.
Wireless Studio. User s Guide Version 5.1x Before using this software, please read this manual thoroughly and retain it for future reference.
 4-743-161-12 (1) Wireless Studio User s Guide Version 5.1x Before using this software, please read this manual thoroughly and retain it for future reference. DWR-R01D/R02D/R02DN/R03D 2018 Sony Corporation
PulseCounter Neutron & Gamma Spectrometry Software Manual
 PulseCounter Neutron & Gamma Spectrometry Software Manual MAXIMUS ENERGY CORPORATION Written by Dr. Max I. Fomitchev-Zamilov Web: maximus.energy TABLE OF CONTENTS 0. GENERAL INFORMATION 1. DEFAULT SCREEN
System Requirements SA0314 Spectrum analyzer:
 System Requirements SA0314 Spectrum analyzer: System requirements Windows XP, 7, Vista or 8: 1 GHz or faster 32-bit or 64-bit processor 1 GB RAM 10 MB hard disk space \ 1. Getting Started Insert DVD into
SpectraFoo v4.0 User Manual METRIC HALO Copyright Metric Halo Distribution, Inc. All rights reserved.
 SpectraFoo v4.0 User Manual METRIC HALO Copyright 1998-2005 Metric Halo Distribution, Inc. All rights reserved. 2 SpectraFoo User Manual Congratulations! You are now the owner of the most powerful audio
SR-D8-M, SR-D8-S. (Ver ) SOFTWARE INSTRUCTIONS
 SOFTWARE INSTRUCTIONS") SOFTWARE INSTRUCTIONS active l ine array speak er SYStems SR-D8-M, SR-D8-S (Ver. 1.1.1) Thank you for purchasing TOA's Active Line Array Speaker Systems. Please carefully follow the instructions in this
SOFTWARE INSTRUCTIONS active l ine array speak er SYStems SR-D8-M, SR-D8-S (Ver. 1.1.1) Thank you for purchasing TOA's Active Line Array Speaker Systems. Please carefully follow the instructions in this
Getting Started. Connect green audio output of SpikerBox/SpikerShield using green cable to your headphones input on iphone/ipad.
 Getting Started First thing you should do is to connect your iphone or ipad to SpikerBox with a green smartphone cable. Green cable comes with designators on each end of the cable ( Smartphone and SpikerBox
USB AUDIO INTERFACE I T
 USB AUDIO INTERFACE EN DE FR ES IT JA Contents Introduction...3 Contents in this Operation Manual... 3 Features... 3 Panel Controls and Terminals (Details)...4 Rear Panel... 4 Front Panel... 6 Panel Controls
CLA MixHub. User Guide
 CLA MixHub User Guide Contents Introduction... 3 Components... 4 Views... 4 Channel View... 5 Bucket View... 6 Quick Start... 7 Interface... 9 Channel View Layout..... 9 Bucket View Layout... 10 Using
Getting Started with the LabVIEW Sound and Vibration Toolkit
 1 Getting Started with the LabVIEW Sound and Vibration Toolkit This tutorial is designed to introduce you to some of the sound and vibration analysis capabilities in the industry-leading software tool
NOTICE: This document is for use only at UNSW. No copies can be made of this document without the permission of the authors.
 Brüel & Kjær Pulse Primer University of New South Wales School of Mechanical and Manufacturing Engineering September 2005 Prepared by Michael Skeen and Geoff Lucas NOTICE: This document is for use only
The BAT WAVE ANALYZER project
 The BAT WAVE ANALYZER project Conditions of Use The Bat Wave Analyzer program is free for personal use and can be redistributed provided it is not changed in any way, and no fee is requested. The Bat Wave
Sound Measurement. V2: 10 Nov 2011 WHITE PAPER. IMAGE PROCESSING TECHNIQUES
 www.omnitek.tv IMAGE PROCESSING TECHNIQUES Sound Measurement An important element in the assessment of video for broadcast is the assessment of its audio content. This audio can be delivered in a range
Please feel free to download the Demo application software from analogarts.com to help you follow this seminar.
 Hello, welcome to Analog Arts spectrum analyzer tutorial. Please feel free to download the Demo application software from analogarts.com to help you follow this seminar. For this presentation, we use a
PYROPTIX TM IMAGE PROCESSING SOFTWARE
 Innovative Technologies for Maximum Efficiency PYROPTIX TM IMAGE PROCESSING SOFTWARE V1.0 SOFTWARE GUIDE 2017 Enertechnix Inc. PyrOptix Image Processing Software v1.0 Section Index 1. Software Overview...
Eventide Inc. One Alsan Way Little Ferry, NJ
 Copyright 2017, Eventide Inc. P/N: 141236, Rev 4 Eventide is a registered trademark of Eventide Inc. AAX and Pro Tools are trademarks of Avid Technology. Names and logos are used with permission. Audio
Precision DeEsser Users Guide
 Precision DeEsser Users Guide Metric Halo $Revision: 1670 $ Publication date $Date: 2012-05-01 13:50:00-0400 (Tue, 01 May 2012) $ Copyright 2012 Metric Halo. MH Production Bundle, ChannelStrip 3, Character,
SpectraFoo User's Guide
 S pe c t r a F oo Us e r sgui de SpectraFoo User's Guide Metric Halo $Revision: 1656 $ Publication date $Date: 2012-04-30 13:49:05-0500 (Mon, 30 Apr 2012) $ Copyright 2011 Metric Halo Table of Contents
MDynamicsMB. Overview. Easy screen vs. Edit screen
 MDynamicsMB Overview MDynamicsMB is an advanced multiband dynamic processor with clear sound designed for mastering, however its high performance and zero latency, makes it ideal for any task. It features
USB Mini Spectrum Analyzer User s Guide TSA5G35
 USB Mini Spectrum Analyzer User s Guide TSA5G35 Triarchy Technologies, Corp. Page 1 of 21 USB Mini Spectrum Analyzer User s Guide Copyright Notice Copyright 2011 Triarchy Technologies, Corp. All rights
Voxengo Soniformer User Guide
 Version 3.7 http://www.voxengo.com/product/soniformer/ Contents Introduction 3 Features 3 Compatibility 3 User Interface Elements 4 General Information 4 Envelopes 4 Out/In Gain Change 5 Input 6 Output
Cristina Bachmann, Heiko Bischoff, Marion Bröer, Sabine Pfeifer, Heike Schilling, Benjamin Schütte This PDF provides improved access for
 Cristina Bachmann, Heiko Bischoff, Marion Bröer, Sabine Pfeifer, Heike Schilling, Benjamin Schütte This PDF provides improved access for vision-impaired users. Please note that due to the complexity and
Manual of Operation for WaveNode Model WN-2m. Revision 1.0
 Manual of Operation for WaveNode Model WN-2m. Revision 1.0 TABLE OF CONTENTS 1. Description of Operation 2. Features 3. Installation and Checkout 4. Graphical Menus 5. Information for Software Expansion
FREE TV AUSTRALIA OPERATIONAL PRACTICE OP- 59 Measurement and Management of Loudness in Soundtracks for Television Broadcasting
 Page 1 of 10 1. SCOPE This Operational Practice is recommended by Free TV Australia and refers to the measurement of audio loudness as distinct from audio level. It sets out guidelines for measuring and
DK Meter Audio & Loudness Metering Complete. Safe & Sound
 DK Meter Audio & Metering Complete Safe & Sound DK Meter at a glance Complete Audio & one-box metering Hassle-free Flexibility plug, preset and play High Quality Tools, yet outstanding value for money
CI-218 / CI-303 / CI430
 CI-218 / CI-303 / CI430 Network Camera User Manual English AREC Inc. All Rights Reserved 2017. l www.arec.com All information contained in this document is Proprietary Table of Contents 1. Overview 1.1
SIGNAL PROCESSOR. Operation Manual
 SIGNAL PROCESSOR Operation Manual Using the PDF manual From the Contents on page 2, click on the desired topic to automatically jump to the corresponding page. Click on a link in this manual to jump to
Performing a Sound Level Measurement
 APPENDIX 9 Performing a Sound Level Measurement Due to the many features of the System 824 and the variety of measurements it is capable of performing, there is a great deal of instructive material in
SIGNAL PROCESSOR. Operation Manual
 SIGNAL PROCESSOR Operation Manual Using the PDF manual From the Contents on page 2, click on the desired topic to automatically jump to the corresponding page. Click on a link in this manual to jump to
TF5 / TF3 / TF1 DIGITAL MIXING CONSOLE. TF StageMix User's Guide
 TF5 / TF3 / TF1 DIGITAL MIXING CONSOLE EN Note The software and this document are the exclusive copyrights of Yamaha Corporation. Copying or modifying the software or reproduction of this document, by
Data Sheet SurroundMonitor Series
 Data Sheet Series 1 Overview 2 1 1 2 Remote Display 30010 (optional) 8-channel Multistandard PPM Surround Sound Analyzer Loudness Loudness Leq LRA PPM Dialnorm Vectorscope Correlator RtA Downmix AeS3 Status
VideoMate U3 Digital Terrestrial USB 2.0 TV Box Start Up Guide
 VideoMate U3 Digital Terrestrial USB 2.0 TV Box Start Up Guide Compro Technology, Inc. www.comprousa.com Copyright 2001-2005. Compro Technology, Inc. No part of this document may be copied or reproduced
Operation Manual OPERATION MANUAL ISL. Precision True Peak Limiter NUGEN Audio. Contents
 ISL OPERATION MANUAL ISL Precision True Peak Limiter 2018 NUGEN Audio 1 www.nugenaudio.com Contents Contents Introduction Interface General Layout Compact Mode Input Metering and Adjustment Gain Reduction
«Limiter 6» Modules and parameters description
 «Limiter 6» Modules and parameters description Developed by: Vladislav Goncharov vladgsound.wordpress.com With collaboration of: Dax Liniere www.puzzlefactory.com.au 2011-2012 2 1 Introduction... 3 1.1
Syrah. Flux All 1rights reserved
 Flux 2009. All 1rights reserved - The Creative adaptive-dynamics processor Thank you for using. We hope that you will get good use of the information found in this manual, and to help you getting acquainted
Manual Version Ver 1.0
 The BG-3 & The BG-7 Multiple Test Pattern Generator with Field Programmable ID Option Manual Version Ver 1.0 BURST ELECTRONICS INC CORRALES, NM 87048 USA (505) 898-1455 VOICE (505) 890-8926 Tech Support
Operation manual. VisLM. Standardised Loudness Metering Solution NUGEN Audio
 Operation manual VisLM Standardised Loudness Metering Solution 1 2015 NUGEN Audio www.nugenaudio.com Contents Page Introduction 3 Interface 4 General Layout 4 Loudness meter 6 Loudness History & Distribution
VoiceStrip for PowerCore Manual. Manual VoiceStrip for PowerCore
 VoiceStrip for PowerCore Manual English Manual VoiceStrip for PowerCore SUPPORT AND CONTACT DETAILS TABLE OF CONTENTS TC SUPPORT INTERACTIVE The TC Support Interactive website www.tcsupport.tc is designed
StereoTools Operation Guide
 StereoTools Operation Guide Content copyright 2009 Sonalksis Ltd Contents Introduction... 3 Installation... 4...with the Plug-in Manager 4 Authorisation 4 Operation... 5 Stereo Processing Section 5 Phase
Linrad On-Screen Controls K1JT
 Linrad On-Screen Controls K1JT Main (Startup) Menu A = Weak signal CW B = Normal CW C = Meteor scatter CW D = SSB E = FM F = AM G = QRSS CW H = TX test I = Soundcard test mode J = Analog hardware tune
FCPM-6000RC. Mini-Circuits P.O. Box , Brooklyn, NY (718)
") USB / Ethernet Integrated Frequency Counter & Power Meter 50Ω -30 dbm to +20 dbm, 1 MHz to 6000 MHz The Big Deal Automatically synchronized power & frequency measurements USB and Ethernet control Includes
USB / Ethernet Integrated Frequency Counter & Power Meter 50Ω -30 dbm to +20 dbm, 1 MHz to 6000 MHz The Big Deal Automatically synchronized power & frequency measurements USB and Ethernet control Includes
DVR-431 USB Wireless Receiver User Manual
 DVR-431 USB Wireless Receiver User Manual Thank you for using our wireless USB receiver, please read the following content carefully before using, it will help you make better use of this product. Introduction
spiff manual version 1.0 oeksound spiff adaptive transient processor User Manual
 oeksound spiff adaptive transient processor User Manual 1 of 9 Thank you for using spiff! spiff is an adaptive transient tool that cuts or boosts only the frequencies that make up the transient material,
Mobile DTV Viewer. User Manual. Mobile DTV ATSC-M/H DVB-H 1Seg. Digital TV ATSC DVB-T, DVB-T2 ISDB-T V 4. decontis GmbH Sachsenstr.
 Mobile DTV ATSC-M/H DVB-H 1Seg Digital TV ATSC DVB-T, DVB-T2 ISDB-T V 4 decontis GmbH Sachsenstr. 8 02708 Löbau Germany +49 3585 862915 +49 3585 415629 www.com dvbsam@com 1 Introduction... 5 2 System Requirements...
Eventide Inc. One Alsan Way Little Ferry, NJ
 Copyright 2017, Eventide Inc. P/N: 141237, Rev 4 Eventide is a registered trademark of Eventide Inc. AAX and Pro Tools are trademarks of Avid Technology. Names and logos are used with permission. Audio
Why We Measure Loudness
 Menu Why We Measure Loudness Measuring loudness is key to keeping an audience tuned to your channel. Image: digital.eca.ed.ac.uk It is all very well being able to quantify the volume of a signal, however,
Capstone screen shows live video with sync to force and velocity data. Try it! Download a FREE 60-day trial at pasco.com/capstone
 Capstone screen shows live video with sync to force and velocity data. Try it! Download a FREE 60-day trial at pasco.com/capstone If you use these PSCO USB interfaces in your lab, it s time for PSCO Capstone
May 2006 Edition /A. Getting Started Guide for the VSX Series Version 8.5
 May 2006 Edition 3725-21286-008/A Getting Started Guide for the VSX Series Version 8.5 GETTING STARTED GUIDE FOR THE VSX SERIES Trademark Information Polycom, the Polycom logo design, and ViewStation are
invr User s Guide Rev 1.4 (Aug. 2004)
") Contents Contents... 2 1. Program Installation... 4 2. Overview... 4 3. Top Level Menu... 4 3.1 Display Window... 9 3.1.1 Channel Status Indicator Area... 9 3.1.2. Quick Control Menu... 10 4. Detailed
Contents Contents... 2 1. Program Installation... 4 2. Overview... 4 3. Top Level Menu... 4 3.1 Display Window... 9 3.1.1 Channel Status Indicator Area... 9 3.1.2. Quick Control Menu... 10 4. Detailed
D-901 PC SOFTWARE Version 3
 INSTRUCTION MANUAL D-901 PC SOFTWARE Version 3 Please follow the instructions in this manual to obtain the optimum results from this unit. We also recommend that you keep this manual handy for future reference.
Getting started with Spike Recorder on PC/Mac/Linux
 Getting started with Spike Recorder on PC/Mac/Linux You can connect your SpikerBox to your computer using either the blue laptop cable, or the green smartphone cable. How do I connect SpikerBox to computer
USB Mini Spectrum Analyzer User Manual TSA Program for PC TSA4G1 TSA6G1 TSA8G1
 USB Mini Spectrum Analyzer User Manual TSA Program for PC TSA4G1 TSA6G1 TSA8G1 Triarchy Technologies Corp. Page 1 of 17 USB Mini Spectrum Analyzer User Manual Copyright Notice Copyright 2013 Triarchy Technologies,
C8000. switch over & ducking
 features Automatic or manual Switch Over or Fail Over in case of input level loss. Ducking of a main stereo or surround sound signal by a line level microphone or by a pre recorded announcement / ad input.
DIGISPOT II. User Manual LOGGER. Software
 DIGISPOT II LOGGER Software User Manual September 2002 Version 2.12.xx Copy - Right: R.Barth KG Hamburg I m p r e s s u m This product has been developed by joint efforts of both companies based on the
1 Introduction. 2 Features. Welcome to CS-3301, a channel strip plugin with gate, EQs, compressor, saturation and oversampling.
 MANUAL 2017 1 Introduction Welcome to CS-3301, a channel strip plugin with gate, EQs, compressor, saturation and oversampling. 2 Features CS-3301 offers following features: Noise gate LC/HC and 5 band
Getting Started Guide for the V Series
 product pic here Getting Started Guide for the V Series Version 9.0.6 March 2010 Edition 3725-24476-003/A Trademark Information POLYCOM, the Polycom Triangles logo and the names and marks associated with
C8491 C8000 1/17. digital audio modular processing system. 3G/HD/SD-SDI DSP 4/8/16 audio channels. features. block diagram
 features 4 / 8 / 16 channel LevelMagic2 SDI-DSP with level or loudness (ITU-BS.1770-1/ ITU-BS.1770-2, EBU R128) control 16 channel 3G/HD/SD-SDI de-embedder 16 in 16 de-embedder matrix 16 channel 3G/HD/SD-SDI
MTurboComp. Overview. How to use the compressor. More advanced features. Edit screen. Easy screen vs. Edit screen
 MTurboComp Overview MTurboComp is an extremely powerful dynamics processor. It has been designed to be versatile, so that it can simulate any compressor out there, primarily the vintage ones of course.
BM-A1-E16SHD V2.2. Manual BM-A1-E16SHD. 16 Channel Digital Audio Monitor. User s Guide. Page 1
 BM-A1-E16SHD V2.2 Manual BM-A1-E16SHD 16 Channel Digital Audio Monitor User s Guide Page 1 BEL (Digital Audio) Ltd., has made every effort to ensure the accuracy of information contained within this document,
February 2007 Edition /A. Getting Started Guide for the VSX Series Version 8.5.3
 February 2007 Edition 3725-21286-009/A Getting Started Guide for the VSX Series Version 8.5.3 GETTING STARTED GUIDE FOR THE VSX SERIES Trademark Information Polycom, the Polycom logo design, and ViewStation
TF5 / TF3 / TF1 DIGITAL MIXING CONSOLE. TF Editor User Guide
 TF5 / TF3 / TF1 DIGITAL MIXING CONSOLE EN Special notices Copyrights of the software and this document are the exclusive property of Yamaha Corporation. Copying or modifying the software or reproduction
Using Cubase SE with DSP Factory
 Manual by Ludvig Carlson, Anders Nordmark, Roger Wiklander Quality Control: C. Bachmann, H. Bischoff, S. Pfeifer, C. Schomburg The information in this document is subject to change without notice and does
Neo DynaMaster Full-Featured, Multi-Purpose Stereo Dual Dynamics Processor. Neo DynaMaster. Full-Featured, Multi-Purpose Stereo Dual Dynamics
 Neo DynaMaster Full-Featured, Multi-Purpose Stereo Dual Dynamics Processor with Modelling Engine Developed by Operational Manual The information in this document is subject to change without notice and
ESI Video Viewer User s Guide
 ESI Video Viewer User s Guide 0450-1214 Rev. C For on-line help, visit www.esiusers.com. About ESI ESI (Estech Systems, Inc.) is a privately held corporation based in Plano, Texas. Founded in 1987, ESI
AVTuner PVR Quick Installation Guide
 AVTuner PVR Quick Installation Guide Introducing the AVTuner PVR The AVTuner PVR allows you to watch, record, pause live TV and capture high resolution video on your computer. Features and Benefits Up
MAutoDynamicEq. Now, how is the level measured? Overview. The Band Settings
 MAutoDynamicEq Overview Dynamics processors, such as compressors and expanders, dynamically manipulate the overall level of the audio material. Equalizers change the spectral character of the audio, statically.
DK METER User Manual. DK METER Audio & Loudness Metering Complete
 DK METER User Manual DK METER Audio & Loudness Metering Complete 1 INTRODUCTION... 4 BEFORE YOU BEGIN... 4 ABOUT THIS MANUAL... 4 OTHER IMPORTANT NOTES... 5 QUICK GUIDE... 6 IF YOU JUST WANT TO GET GOING...
DETEXI Basic Configuration
 DETEXI Network Video Management System 5.5 EXPAND YOUR CONCEPTS OF SECURITY DETEXI Basic Configuration SETUP A FUNCTIONING DETEXI NVR / CLIENT It is important to know how to properly setup the DETEXI software
Getting Started Guide for the V Series
 product pic here Getting Started Guide for the V Series Version 8.7 July 2007 Edition 3725-24476-002/A Trademark Information Polycom and the Polycom logo design are registered trademarks of Polycom, Inc.,
DSP Trigger FREE Edition MANUAL
 DSP Trigger FREE Edition MANUAL Table of Contents Introduction 2 Features 2 Getting Started 3 Connecting Your Drum Pad 3 Single Zone 3 Dual Zone 3 Setting up DSP Trigger in your VST Host 3 About latency
User s Guide W-E
 Presto! PVR ISDB User s Guide 518100-02-01-W-E-112307-02 Copyright 2007, NewSoft Technology Corp. All Rights Reserved. No portion of this document may be copied or reproduced in any manner without prior
DVB-T Box, USB Monheim/Germany Tel. +49 (0)9091/ Fax +49 (0)9091/ Hama GmbH & Co KG.
9091/ Fax +49 (0)9091/ Hama GmbH & Co KG.") www.hama.de Hama GmbH & Co KG Postfach 80 86651 Monheim/Germany Tel. +49 (0)9091/502-0 Fax +49 (0)9091/502-274 hama@hama.de www.hama.de 00062776-01.05 DVB-T Box, USB 2.0 00062776 L TV USB receiver User
www.hama.de Hama GmbH & Co KG Postfach 80 86651 Monheim/Germany Tel. +49 (0)9091/502-0 Fax +49 (0)9091/502-274 hama@hama.de www.hama.de 00062776-01.05 DVB-T Box, USB 2.0 00062776 L TV USB receiver User
Introduction To LabVIEW and the DSP Board
 EE-289, DIGITAL SIGNAL PROCESSING LAB November 2005 Introduction To LabVIEW and the DSP Board 1 Overview The purpose of this lab is to familiarize you with the DSP development system by looking at sampling,
2-/4-Channel Cam Viewer E- series for Automatic License Plate Recognition CV7-LP
 2-/4-Channel Cam Viewer E- series for Automatic License Plate Recognition Copyright 2-/4-Channel Cam Viewer E-series for Automatic License Plate Recognition Copyright 2018 by PLANET Technology Corp. All
MDistortionMB. Easy screen vs. Edit screen
 MDistortionMB Easy screen vs. Edit screen The plugin provides 2 user interfaces - an easy screen and an edit screen. Use the Edit button to switch between the two. By default most plugins open on the easy
HEDD Bridge B1 - Dante
 Heinz Electrodynamic Designs HEDD Bridge B1 - Dante User Manual EN Introduction HEDD s modular input card system, which we call the HEDD Bridge, brings versatile digital input connectivity including Dante
WAVES Cobalt Saphira. User Guide
 WAVES Cobalt Saphira TABLE OF CONTENTS Chapter 1 Introduction... 3 1.1 Welcome... 3 1.2 Product Overview... 3 1.3 Components... 5 Chapter 2 Quick Start Guide... 6 Chapter 3 Interface and Controls... 7
Software manual. ChipScan-Scanner 3.0
 Software manual ChipScan-Scanner 3.0 Copyright c Langer EMV-Technik GmbH 2016 Version 1.10 Notice No part of this manual may be reproduced in any form or by any means (including electronic storage and
Voxengo PHA-979 User Guide
 Version 2.6 http://www.voxengo.com/product/pha979/ Contents Introduction 3 Features 3 Compatibility 3 User Interface Elements 5 Delay 5 Phase 5 Output 6 Correlometer 7 Introduction 7 Parameters 7 Credits
USB Mini Spectrum Analyzer User Manual PC program TSA For TSA5G35 TSA4G1 TSA6G1 TSA12G5
 USB Mini Spectrum Analyzer User Manual PC program TSA For TSA5G35 TSA4G1 TSA6G1 TSA12G5 Triarchy Technologies, Corp. Page 1 of 17 USB Mini Spectrum Analyzer User Manual Copyright Notice Copyright 2013
E X P E R I M E N T 1
 E X P E R I M E N T 1 Getting to Know Data Studio Produced by the Physics Staff at Collin College Copyright Collin College Physics Department. All Rights Reserved. University Physics, Exp 1: Getting to
MSO-28 Oscilloscope, Logic Analyzer, Spectrum Analyzer
 Link Instruments Innovative Test & Measurement solutions since 1986 Store Support Oscilloscopes Logic Analyzers Pattern Generators Accessories MSO-28 Oscilloscope, Logic Analyzer, Spectrum Analyzer $ The
Standard Definition. Commercial File Delivery. Technical Specifications
 Standard Definition Commercial File Delivery Technical Specifications (NTSC) May 2015 This document provides technical specifications for those producing standard definition interstitial content (commercial
Easy on the eyes, comes in four flavors (skins) to be pleasant to look at for (almost) everybody.
 to be pleasant to look at for (almost) everybody.") Main features: Painstakingly modeled behaviour and recration of the general ballistics of classic VU meters. adjustable attack and release times Unique Overshoot parameter (1% - 10%) for extra smotheness
Main features: Painstakingly modeled behaviour and recration of the general ballistics of classic VU meters. adjustable attack and release times Unique Overshoot parameter (1% - 10%) for extra smotheness
SigPlay User s Guide
 SigPlay User s Guide . . SigPlay32 User's Guide? Version 3.4 Copyright? 2001 TDT. All rights reserved. No part of this manual may be reproduced or transmitted in any form or by any means, electronic or
VU Meter. User Guide
 VU Meter User Guide Waves VU Meter User Guide Chapter 1 Introduction... 2 Chapter 2 Components... 4 Chapter 3 Controls and Displays... 5 Welcome Thank you for choosing Waves! In order to get the most out
MaxLimit Operation Guide
 MaxLimit Operation Guide Content copyright 2009 Sonalksis Ltd Contents Introduction... 3 Installation... 4...with the Plug-in Manager 4 Authorisation 4 Operation... 5 Input Section 5 Threshold Section
10 in 10 out PCI Digital Recording System with S/PDIF. User Guide
 10 in 10 out PCI Digital Recording System with S/PDIF User Guide Table of Contents Introduction.............................. 3 What s in the Box?.......................... 3 About the Delta 1010 Digital