Audience Insight 2014 Annual Report
|
|
|
- Chad Doyle
- 5 years ago
- Views:
Transcription

1 Audience Insight 2014 Annual Report Profile September 23, September 21, 2014 With Comparisons to the and Seasons
2 A WORD FROM PBS RESEARCH PBS Research is pleased to present you with its full season Annual Report, an important part of our Audience Insight project which was launched six years ago in order to increase understanding of PBS viewer behavior across the public television system. Whether you are a general manager, a marketing or development professional, a programmer, or a PBS staffer, we hope you will find this a useful tool for thinking about the audiences we serve. We can better plan for the future by looking not just at a snap-shot of audience ratings at a single moment in time, but at the longer trend of our performance over the past three seasons. The season was, by many measures, incredibly successful for PBS in primetime. We wrapped with a 1.50 national primetime average household rating, up 5% from the 1.43 during Of the 30 top networks on television, only three were up in household ratings season-over-season. And PBS ranked 5th in primetime, behind only the four major broadcast networks and ahead of every cable network, improving from 8th place in In addition to Downton Abbey, programming events like Ken Burns The Roosevelts were not only ratings juggernauts, but were highly effective at reaching new or lighter viewers and finding a following on digital platforms. And, of the ongoing series, five saw season-over-season growth, benefitting from great content and a scheduling strategy that helps retain audiences. As in prior editions, we provide an overview of the ratings performance of PBS night-by-night, hour-by-hour, and in comparison to other networks with whom we compete for viewer time and attention. We profile the composition of our audience, including the heaviest viewers as well as contributors. This book also goes in-depth on the established series, genres, and special programming. This year we have added several new features, in an effort to make this an even more valuable tool for your local station. Enhancements include: A contributor index for each program showing how well that program performs among PBS contributors. A table of behavioral and attitudinal attributes for each ongoing series, which fuses MRI and Nielsen data to provide a profile of viewers that goes beyond standard demographics to characteristics like civic engagement, arts participation, and investment behavior. Genre-based ratings and delivery information, so you can estimate how many people in different demographic breaks might tune into a given program within a genre the kind of information potential local and national sponsors are often seeking. And several special pages that focus on specific programming events and tactics designed to grow PBS s audience and increase viewer engagement: new scripted drama series, new programs in science, nature, and technology; culturally diverse programming; and of course the pop-out events intended to attract new viewers to our service. PBS Research, and our partners at City Square Associates who assist us in the Audience Insight project, hope you will find the information in this booklet useful and welcome your feedback, questions, and suggestions. Steve McGowan, Vice President, PBS Research Beth Walsh, Senior Director, PBS Research Source: All data contained in this report come from Nielsen s national PeopleMeter sample. Respondent-level data pulled from Nielsen s NPower tool for Live+7. MRI Fusion data rely on the fused datasets from Nielsen s national PeopleMeter sample and MRI s persons 18+ sample of respondents with the 9/23/2013-3/30/2014 and 3/31/2014-9/21/2014 MRI waves averaged together. 1
3 TABLE OF CONTENTS 1 A WORD FROM PBS RESEARCH 2 TABLE OF CONTENTS PART I: SEASON OVERVIEW 4 PBS PRIMETIME RATINGS BY WEEK; PBS PRIMETIME RATINGS BY NIGHT 5 PBS PRIMETIME RATINGS BY HOUR; PBS PRIMETIME RATINGS CHANGE BY HOUR 6 PBS PRIMETIME AUDIENCE COMPOSITION; PBS PRIMETIME AUDIENCE COMPOSITION BY VIEWING SEGMENT 7 THE ROOSEVELTS 8 POP-OUT VIEWERS 9 POP-OUT AUDIENCE COMPOSITION 10 PBS PRIMETIME RATINGS VS. OTHER NETWORKS 11 PBS VIEWER INDEX: BROADCAST AND CABLE 12 PBS PRIMETIME SERIES RANKER PART II: SERIES BY GENRE PART I SEASON OVERVIEW 14 PBS PRIMETIME RATINGS BY GENRE GREAT PERFORMANCES 17 PBS FESTIVAL 18 DRAMA 19 MASTERPIECE 20 NEW SCRIPTED SERIES 21 SCIENCE/NATURE 22 NATURE 23 NOVA 24 SCIENCE, NATURE & TECH LIMITED SERIES 25 HISTORY/PERSONAL HISTORY 26 ANTIQUES ROADSHOW 27 AMERICAN EXPERIENCE 28 AMERICAN MASTERS 29 LIMITED SERIES INNOVATIONS 30 CULTURAL DIVERSITY 31 INDIE FILM 32 INDEPENDENT LENS 33 POV 34 NEWS/PUBLIC AFFAIRS 35 FRONTLINE 36 NEWSHOUR /NEWSHOUR WEEKEND 37 CHARLIE ROSE-THE WEEK/ WASHINGTON WEEK 38 GRAND DASHBOARD 40 PBS PRIMETIME SERIES DUPLICATION 41 GLOSSARY/ UNIVERSE ESTIMATES 3 2 3


4 PBS PRIMETIME RATINGS BY WEEK HOUSEHOLD PBS PRIMETIME RATINGS BY HOUR HOUSEHOLD PLEDGE PERIOD :00PM 9:00PM 10:00PM PRIMETIME AVERAGE PBS PRIMETIME RATINGS BY NIGHT HOUSEHOLD PBS PRIMETIME RATINGS CHANGE BY HOUR HOUSEHOLD AND PERSONS / VS SEASON NOTE: RATINGS SHOWN. COLOR CODING REPRESENTS THE PERCENT CHANGE RELATIVE TO THE SEASON TO CHANGE <-5% -5% to 5% >5% 4 5
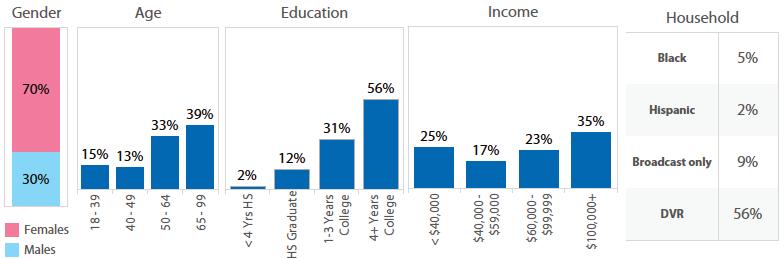
5 THE ROOSEVELTS PBS PRIMETIME AUDIENCE COMPOSITION Highest-Rated PBS Limited Series Seri eries of All Time MEDIAN AGE: 67 MEDIAN AGE: 52 Jan The American Experience "The Kennedys" Aug Nature "Kingdom of the Ice Bear" Jan Cosmos Aug Lewis & Clark: The Journey of The Corps of Discovery Oct Planet Earth Dec The Roosevelts Sep The Scarlet Letter Mar Baseball Aug Frontier House May The Dinosaurs! Oct Vietnam: A Television History Sep Mark Twain Jan Mystery! "The Adventures of Sherlock Holmes" Feb The West Aug Columbus and the Age of Discovery Sep Living Mar Index: Index ex: 385 Source: Nielsen NPower/MRI NPower/M /MRI Fusion Program Ratings ngs Report/ Live+7 Acr Across cross seven episodes, The Roosevelts serv ve ed million total streams, markedly served out-performing out-perfor e ming the previous two Ken Burns mini miniserie miniseries s s - delivering eight times the number of streams str stream s of The Dust Bowl (two episodes) and Prohibition (three episodes). MEDIAN INCOME: $60,100 The Roosevelts Total - 1,850,,416 Source: Google Analytics 6 The Roosevelts Nightly Ratings Persons 18+ and PBS Contributors Ken Ke en Burns S Series eries Digital hip MEDIAN INCOME: $47,200 MEDIAN INCOME: $49,100 Downton Abbey, Series 3 Source: Niels Nielsen sen Television Index (NTI) STREAMS (000) MEDIAN AGE: Roosevelts vs. Other Pop Popular pular Mini-seri Mini-series ries Of all the popular recurring recurrin ng series across s all networks networks, s, The Roosevelts placed behin behind hind Downton and T The he Walking Dead ad Sherlock. but was ahead of Game of Thrones and She erlock. 18,439 13,247 9,180 8,979 6,548 4,055 3,631 BOARDWALK EMPIRE Next 20% of viewers (after the Heavy viewers) who account for 10% of the PBS minutes consumed. Jan-81 DOWNTON ABBEY 4 Top 20% who account for 86% of the PBS minutes consumed. The Living Planet: A Portrait of the Earth TH HE WAL KING DEAD A THE WALKING Top 5% who account for 55% of the PBS minutes consumed. (NOTE: Ultra Heavy are a sub-set of Heavy) ,584 POTENTIAL 8.3 Dec ,743 HEAVY Jan-13 Life on Earth 154,364 ULTRA HEAVY Downton Abbey, Series 4 596,190,19 VIEWERS 18+ ARE DIVIDED INTO THE FOLLOWING SEGMENTS 2 Fro From our merged Nielsen/MRI Fusion self-reported donor sample, The Roosevelts ratings among PBS contributors were, on average, almost four times higher than the national average for all persons 18+. HOMELAND PBS PRIMETIME AUDIENCE COMPOSITION BY VIEWING SEGMENT TRUE DETECTIVE MEDIAN INCOME: $57,820 MEDIAN AGE: 69 HH AA% SHERLOCK 3 MEDIAN INCOME: $50,300 MEDIAN AGE: 65 Date Aug-8 86 Aug ,390 MEDIAN AGE: 49 The Civil War MAD MEN MEDIAN INCOME: $50,700 Title 1 GAM E OF O THRONES THRONES GAME Rank CONTRIBUTOR 258,683 PBS PRIMETIME 336,462 TOTAL PRIMETIME TV VIEWERS The Roose Roosevelts sevel velts ts Po Popular with Contributors PBS Co ont ntributors THE ROOSEVELTS AUDIENCE VS. ALL PRIMETIME VIEWERS 3,184 3,047 3,047 Avera A Average verag verag erage ge Mi M Minu Minut Minute inu nute ute Vi View Viewe wers rs for for or Pop P Po Popular opular ullar ar M Mi Mini-Series ini-ser ni-se ii-ser Se S eries es (0 ((000) (00 00) 0 Most M Mo o t Recent Rec R c ntt Seasons Se Se sons Source: Nielsen NPower Program Ratings Reports/Live+7 7


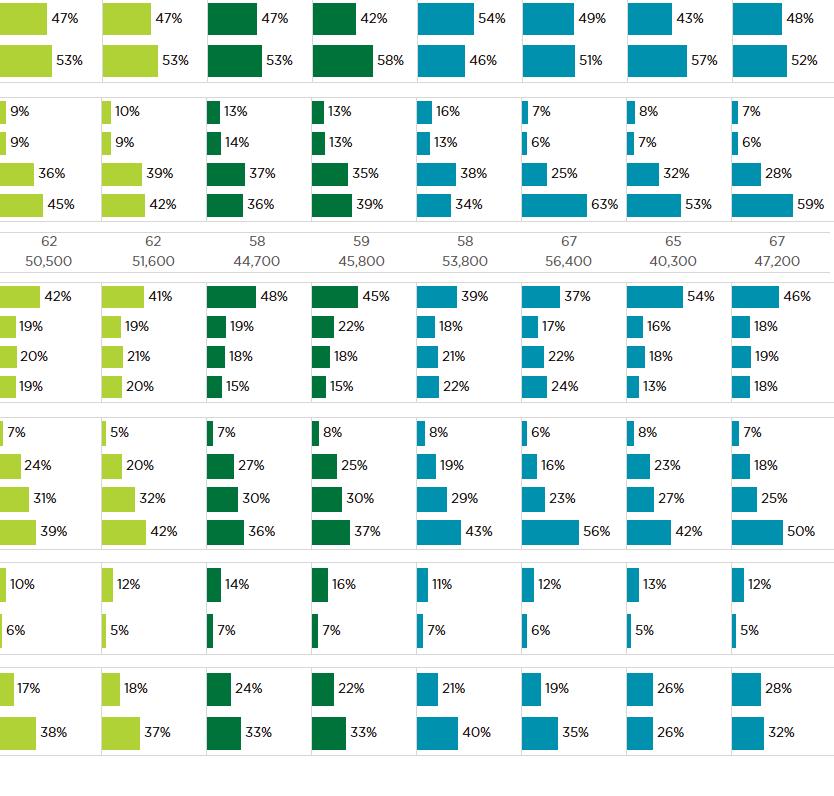
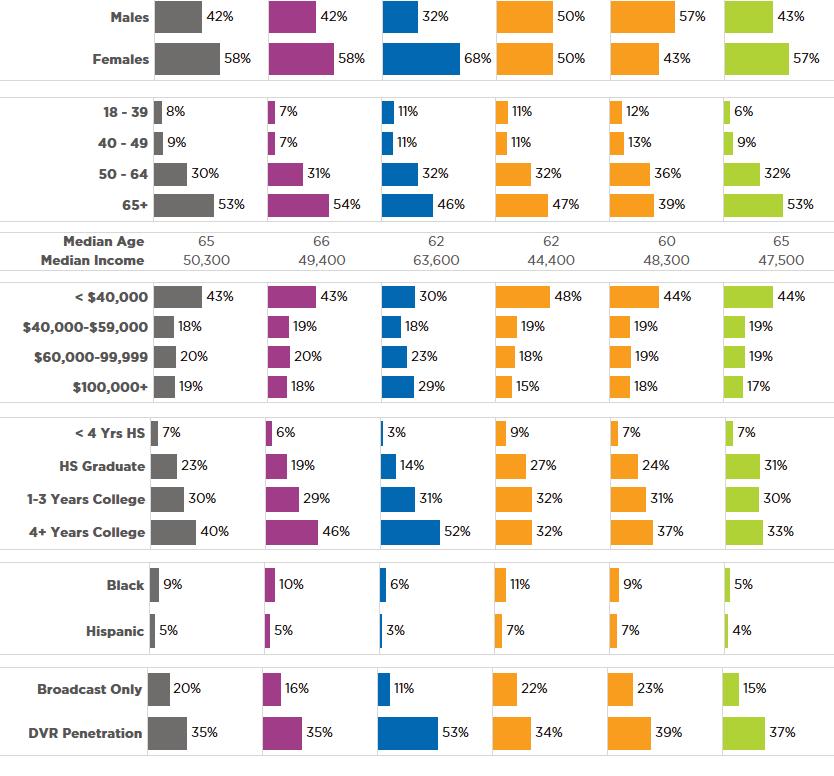
6 POP-OUT VIEWERS FRONTLINE LEAGUE OF DENIAL - 10/18/13 Recent viewer=viewer 18+ who had watched PBS during the four weeks prior to the pop-out. Non-Recent viewer=viewer 18+ who had not watched any PBS during the four weeks prior to the pop-out. POP-OUT AUDIENCE COMPOSITION FRONTLINE LEAGUE OF DENIAL - 10/18/13 DASHBOARD Median Age: 56 Median Income: $61,500 AMERICAN EXPERIENCE JFK - 11/11/13 AMERICAN EXPERIENCE JFK - 11/11/13 Median Age: 65 Median Income: $51,500 DOWNTON ABBEY SEASON 4 PREMIERE - 1/5/14 DOWNTON ABBEY SEASON 4 PREMIERE - 1/5/14 Median Age: 60 Median Income: $70,300 THINK WEDNESDAY - 4/9/14 DASHBOARD THINK WEDNESDAY - 4/9/14 Median Age: 61 Median Income: $45,200 THE ROOSEVELTS - 9/14/14 THE ROOSEVELTS - 9/14/14 Median Age: 65 Median Income: $62,

 are about as likely to be watched by PBS viewers as by any TV viewer.")
7 PBS PRIMETIME RATINGS VS OTHER NETWORKS HOUSEHOLD PBS VIEWER INDEX TOP 30 BROADCAST SERIES HORIZONTAL BAR, SAME NETS AS FACING PAGE, SAME ORDER Only the top 30 networks are shown. Color bars indicate percent change over the previous season s household average audience rating TO CHANGE -24% +21% AVG. PBS INDEX TO HH The PBS Viewer Index is a measure of PBS viewers relative interest in the top series on other broadcast and cable networks. Programs with an index of 100 (shown in shades of grey) are about as likely to be watched by PBS viewers as by any TV viewer. Programs with an index over 100 (shown in shades of green) are more likely to be watched by PBS viewers. Programs with an index under 100 (shown in shades of pink) are less likely to be watched by PBS viewers. The US TV household average audience rating is shown beneath the title of each program. PBS VIEWER INDEX TOP 30 CABLE SERIES What s a Household Rating Point? Each household rating point = 1,158,000 U.S. TV households. The PBS Viewer Index for each top-rated program is arrived at by calculating the program rating among the households that watched PBS and indexing it to the program rating among total US TV households. This calculation is done on a weekly basis for PBS viewers to each broadcast/ cable program. PBS Index = PBS Viewer HH AA% /Total US HH AA%. 11

8 PBS PRIMETIME SERIES * RANKER HOUSEHOLD RATINGS PART II SERIES BY GENRE * PRIMETIME SERIES WITH AT LEAST FOUR NEW EPISODES THIS SEASON, PLUS PBS NEWSHOUR. AVERAGES INCLUDE ORIGINAL BROADCAST EPISODES ONLY. 13
 for primetime on all PBS stations.")

9 PBS PRIMETIME RATINGS BY GENRE HOUSEHOLD The chart below shows the average of ratings for all programs in the arts genre such as PBS Festival, A Capitol Fourth, Craft In America, Great Performances, In Performance at the White House, Live From Lincoln Center, National Memorial Day Concert, and The Mark Twain Prize compared with the ratings (or average audience) for primetime on all PBS stations. The comparison is shown on a household basis and for select demographic breaks. In general, arts programming that has aired on PBS this season has yielded ratings that are lower than the PBS primetime season average. The corresponding delivery numbers--that is, the actual number of households or persons viewing during an average minute--are shown below the ratings chart. PBS PRIMETIME (000) DRAMA INDIE FILM SCIENCE/NATURE WORLD HISTORY EXPLORE INDIE FILM PUBLIC DRAMA AFFAIRS 14 15


10 PUBLIC DRAMA AFFAIRS INDIE FILM EXPLORE HISTORY SCIENCE/NATURE WORLD INDIE DRAMA FILM VERTICAL BAR AA BY HH AND DEMOS 4.9x THREE SEASONS TOP-RATED ORIGINAL BROADCAST EPISODES 3.7x 1.8x 1.8x 1.8x 2.5x #6 #3 #11 #5 #4 Twice as likely to attend dance performances #2 How to Read: Great Performances viewers are 3.7x more likely than all primetime viewers to attend a classical music performance. Great Performances ranked #6 among all PBS series for this same behavior. Fall 2011 Summer 2012 Fall 2014 FALL 2014 FESTIVAL PROGRAMS - PBS CONTRIBUTOR RATINGS ALL VIEWERS 18+ AA% PBS CONTRIBUTORS P18+ AA% 4.0x 5.0x 2.3x 3.8x 3.2x 3.4x 5.1x 3.0x (Index) INDIE DRAMA FILM SCIENCE/NATURE WORLD EXPLORE HISTORY INDIE FILM PUBLIC DRAMA AFFIARS 16 17
 for primetime on")


11 PUBLIC AFFAIRS INDIE FILM HISTORY SCIENCE/NATURE DRAMA DRAMA The chart below shows the average of ratings for all programs in the drama genre such as The Bletchley Circle, Call The Midwife, Last Tango in Halifax, Masterpiece, Murder on the Home Front, and Vicious compared with the ratings (or average audience) for primetime on all PBS stations. The comparison is shown on a household basis and for select demographic breaks. In general, drama VERTICAL programming BAR that has aired on PBS this season has yielded ratings that are higher than AA the RATINGS PBS primetime % BY season HH AND average. DEMO The corresponding delivery PBS AVERAGE numbers--that AND is, the GENERE actual number of households or persons viewing during an average minute--are shown below the ratings chart. PBS PRIMETIME DRAMA (000) VERTICAL BAR AA BY HH AND DEMOS THREE 4.0x SEASONS TOP-RATED ORIGINAL BROADCAST EPISODES 3.4x 1.4x 1.9x 2.3x 1.7x #10 #8 #10 #1 #5 2.8x as likely to ski on vacation (domestic travel) How to Read: Masterpiece viewers are 3.4x more likely than all primetime viewers to attend a classical music performance. Masterpiece ranked #10 among all PBS series for this same behavior P65+ AA% #1 DRAMA SCIENCE/NATURE HISTORY INDIE FILM PUBLIC AFFAIRS 18 19
 Last Tango in Halifax S2 The Bletchley Circle S2 Vicious NEW SCRIPTED SERIES SUNDAY APRIL 13, 2014 MINUTE BY MINUTE HOUSEHOLD RATINGS The minute-by-minute ratings shown below illustrate")


 for primetime on all PBS stations.")

12 PUBLIC DRAMA AFFAIRS INDIE FILM SCIENCE HISTORY/ & NATURE NEWS/PUBLIC SCIENCE/NATURE AFFAIRS INDIE DRAMA FILM SERIES-BY-SERIES COMPARISON Call the Midwife S3 Last Tango in Halifax S1 (ep. 4-6) Last Tango in Halifax S2 The Bletchley Circle S2 Vicious NEW SCRIPTED SERIES SUNDAY APRIL 13, 2014 MINUTE BY MINUTE HOUSEHOLD RATINGS The minute-by-minute ratings shown below illustrate a typical Sunday night, with rising household ratings during Call the Midwife, a drop during the station break, but a nice recovery to very steady ratings throughout Mr. Selfridge. This is followed by another drop during the break that re-set the level for The Bletchley Circle, which was also quite steady. CALL THE MIDWIFE 303 MR. SELFRIDGE 414 BLETCHLEY CIRCLE 201 Fifty-one percent of the households that had watched Call the Midwife also watched Mr. Selfridge, and 37% of the homes that had watched Mr. Selfridge also watched The Bletchley Circle. SCIENCE/NATURE The chart below shows the average of ratings for all programs in the science/ nature genre such as Comet Encounter, Hawking, My Affair, Nature, NOVA, Operation Maneater, Raw to Ready, Sex in the, Skeletons of the Sahara, Super Skyscrapers, and Your Inner Fish compared with the ratings (or average audience) for primetime on all PBS stations. The comparison is shown on a household basis and for select demographic breaks. In general, science/nature programming VERTICAL that has aired BAR on PBS this season has yielded ratings that are higher than the PBS primetime season average. AA RATINGS % BY HH AND DEMO The corresponding delivery PBS numbers--that AVERAGE is, the AND actual GENERE number of households or persons viewing during an average minute--are shown below the ratings chart. PBS PRIMETIME SCIENCE/NATURE (000) INDIE DRAMA FILM NEWS/PUBLIC SCIENCE/NATURE AFFAIRS SCIENCE HISTORY & NATURE INDIE FILM PUBLIC DRAMA AFFIARS 20 21

 TOP-RATED 2013-14 ORIGINAL BROADCAST EPISODES 3.3x 1.5x 2.5x 1.7x 1.")

13 PUBLIC DRAMA AFFAIRS INDIE FILM SCIENCE HISTORY & NATURE NEWS/PUBLIC SCIENCE/NATURE AFFAIRS INDIE DRAMA FILM 22 VERTICAL BAR AA BY HH AND DEMOS THREE SEASONS 4.1x 4.1x TOP-RATED ORIGINAL BROADCAST EPISODES 3.5x 0.9x 2.2x 1.5x 1.4x #8 #13 #6 #12 #11 How to Read: Nature viewers are 3.5x more likely than all primetime viewers to attend a classical music performance. Nature ranked #8 among all PBS series for this same behavior. 2.5x as likely to go birdwatching #2(tied) TOP-RATED ORIGINAL BROADCAST EPISODES 3.3x 1.5x 2.5x 1.7x 1.6x #11 #7 #1 #7 #9(tied) How to Read: NOVA viewers are 3.3x more likely than all primetime viewers to attend a classical music performance. NOVA ranked #11 among all PBS series for this same behavior. 2.1x as likely to bike on vacation (domestic travel) #1 23 INDIE DRAMA FILM NEWS/PUBLIC SCIENCE/NATURE AFFAIRS SCIENCE HISTORY & NATURE INDIE FILM PUBLIC DRAMA AFFAIRS
 35% 33% 32% 32% 32% 31% 30% 29% 28% 27%")


, and The Story of the Jews compared with the ratings (or average audience) for")
14 PUBLIC DRAMA AFFAIRS INDIE FILM SCIENCE HISTORY & NATURE NEWS/PUBLIC SCIENCE/NATURE AFFAIRS INDIE DRAMA FILM NIGHT-BY-NIGHT GENDER COMPOSITION AVG. MALE 18+ COMPOSITION % 51 % 32% SCIENCE, NATURE & TECH LIMITED SERIES WEDNESDAY 10PM PROGRAMS PERCENT NOVA AUDIENCE RETAINED (HOUSEHOLD CUME DELIVERY) 35% 33% 32% 32% 32% 31% 30% 29% 28% 27% 26% The chart below shows the gender skew for individual PBS primetime hours. PBS generally skews female but there are a few hours each week that attract a more male audience -- notably Wednesday nights at 10 pm, when 51% of the audience is male. How to Read: Of the 2.95 million homes that had watched NOVA at 9 pm, 35% of them watched Skeletons of the Sahara at 10 pm. 2,953,000 2,463,000 2,433,000 2,618,000 2,983,000 2,627,000 2,796,000 2,596,000 3,126,000 3,004,000 2,743,000 HISTORY/PERSONAL HISTORY The chart below shows the average of ratings for all programs in the history/personal history genre such as African Americans, American Experience, American Masters, Antiques Roadshow, Genealogy Roadshow, History Detectives Special Investigations, Latino Americans, Nazi Mega Weapons, Pioneers VERTICAL of Television, BAR The Roosevelts, Secrets of (various locations), and The Story of the Jews compared with the ratings (or average audience) for primetime on all PBS stations. The comparison AA is RATINGS shown on a % household BY HH basis AND and DEMO for select demographic breaks. In general, history/personal PBS AVERAGE history programming AND GENERE that has aired on PBS this season has yielded ratings that are higher than the PBS primetime season average. The corresponding delivery numbers--that is, the actual number of households or persons viewing during an average minute--are shown below the ratings chart. PBS PRIMETIME HISTORY (000) INDIE DRAMA FILM NEWS/PUBLIC SCIENCE/NATURE AFFAIRS SCIENCE HISTORY & NATURE INDIE FILM PUBLIC DRAMA AFFAIRS 24 25
 #12 2.")


15 PUBLIC DRAMA AFFAIRS INDIE FILM SCIENCE HISTORY & NATURE NEWS/PUBLIC SCIENCE/NATURE AFFAIRS INDIE DRAMA FILM VERTICAL BAR AA BY HH AND DEMOS THREE 3.5x SEASONS TOP-RATED ORIGINAL BROADCAST EPISODES 2.5x 1.6x 1.7x 1.7x 1.3x #13 #6 #13 #8(tied) #12 2.3x as likely to collect antiques How to Read: Antiques Roadshow viewers are 2.5x more likely than all primetime viewers to attend a classical music performance. Antiques Roadshow ranked #13 among all PBS series for this same behavior P65+ AA% #1 3.9x TOP-RATED ORIGINAL BROADCAST EPISODES 3.4x 1.0x 1.9x 1.8x 1.6x #9 #12 #9 #4 #7(tied) TABLE TOP 10 CABLE 2.6x as likely to NETWORK, read magazines PROGRAM NAME, PBS for relaxation AA and info How to Read: American Experience viewers are 3.4x more likely than all primetime viewers to attend a classical music performance. American Experience ranked #9 among all PBS series for this same behavior. #1 INDIE DRAMA FILM NEWS/PUBLIC SCIENCE/NATURE AFFAIRS SCIENCE HISTORY & NATURE INDIE FILM PUBLIC DRAMA AFFAIRS 26 27

 SECRETS OF... (VARIOUS) SECRETS OF.")

16 PUBLIC DRAMA AFFAIRS INDIE FILM SCIENCE HISTORY & NATURE NEWS/PUBLIC SCIENCE/NATURE AFFAIRS INDIE DRAMA FILM 4.6x TOP-RATED ORIGINAL BROADCAST EPISODES 4.3x 1.6x 2.3x 1.7x 1.3x #2 #5 #4 #6 #13 4.6x as likely to own corporate bonds or debentures How to Read: American Masters viewers are 4.3x more likely than all primetime viewers to attend a classical music performance. American Masters ranked #2 among all PBS series for this same behavior. #1 GENEALOGY HISTORY ROADSHOW DETECTIVES SI HISTORY DETEC- TIVES ( ) SECRETS OF... (VARIOUS) SECRETS OF ORIGINAL BROADCAST EPISODES LIMITED SERIES INNOVATIONS HISTORY DETECTIVES - VIEWER ENGAGEMENT WITH NEW FORMAT HISTORY DETEC- TIVES SI (2014) The new single-topic format for History Detectives Special Investigations marked an improvement over the prior magazine-style format, reaching more total viewers, achieving greater frequency of tune in, and resulting in substantially more total minutes viewed across the four episodes. INDIE DRAMA FILM NEWS/PUBLIC SCIENCE/NATURE AFFAIRS SCIENCE HISTORY & NATURE INDIE FILM PUBLIC DRAMA AFFAIRS 28 29


 for")


17 PUBLIC AFFAIRS INDIE FILM HISTORY SCIENCE/NATURE DRAMA DRAMA EXPLORE NEWS/PUBLIC AFFAIRS INDIE FILM HH AND RACE/ETHNICITY RATINGS AND AUDIENCE COMPOSITION PBS Average African Americans Black household rating was 3x the total US rating. Latino Americans THE STORY OF THE JEWS PBS PRIMETIME CULTURAL DIVERSITY THE STORY OF THE JEWS Hispanic household rating was more than double the total US rating. The Story of the Jews skewed more toward higher income and higher education homes. The chart below shows the average of ratings for all programs in the indie film genre such as Independent Lens and POV compared with the ratings (or average audience) for primetime on all PBS stations. The comparison is shown on a household basis and for select demographic breaks. In general, indie film programming that has aired on PBS this season has yielded ratings that are lower than the PBS primetime season average. The corresponding delivery numbers--that is, the actual number of households or persons viewing during an average minute--are shown below the ratings chart. PBS PRIMETIME INDIE FILM indie FILM (000) INDIE DRAMA FILM NEWS/PUBLIC SCIENCE/NATURE AFFAIRS SCIENCE HISTORY & NATURE INDIE FILM PUBLIC DRAMA AFFAIRS 30 31
 2.1x as likely to read newspapers for relaxation and info How to Read: Independent Lens viewers are 3.")
18 PUBLIC DRAMA AFFAIRS INDIE FILM EXPLORE HISTORY NEWS/PUBLIC SCIENCE/NATURE AFFAIRS INDIE DRAMA FILM 32 VERTICAL BAR AA BY HH AND DEMOS THREE 4.6x SEASONS 4.6x TOP-RATED ORIGINAL BROADCAST EPISODES 3.6x 2.2x 2.3x 1.5x 1.6x #7 #1 #5 #11 #7(tied) 2.1x as likely to read newspapers for relaxation and info How to Read: Independent Lens viewers are 3.6x more likely than all primetime viewers to attend a classical music performance. Independent Lens ranked #7 among all PBS series for this same behavior. #1 TOP-RATED ORIGINAL BROADCAST EPISODES 4.0x 1.8x 2.0x 1.4x 2.6x #3 #4 #8 #13 #3 How to Read: POV viewers are 4.0x more likely than all primetime viewers to attend a classical music performance. POV ranked #3 among all PBS series for this same behavior. 2.6x as likely to take adult education courses #1 33 INDIE DRAMA FILM NEWS/PUBLIC SCIENCE/NATURE AFFAIRS HISTORY EXPLORE INDIE FILM PUBLIC DRAMA AFFAIRS
 for primetime on all PBS stations.")

 4.5x TOP-RATED 2013-14 ORIGINAL BROADCAST EPISODES 3.9x 1.3x 2.4x 1.6x 1.7x #4 #9 #3 #10 #6 2.")
19 PUBLIC DRAMA AFFAIRS INDIE FILM SCIENCE HISTORY & NATURE NEWS/PUBLIC SCIENCE/NATURE AFFAIRS INDIE DRAMA FILM NEWS/PUBLIC AFFAIRS The chart below shows the average of ratings for all programs in the news/public affairs genre such as Charlie Rose - The Week, Frontline, PBS NewsHour, and Washington Week compared with the ratings (or average audience) for primetime on all PBS stations. The comparison is shown on a household basis and for select demographic breaks. In general, news/public affairs programming that has aired on PBS this season has yielded ratings that are lower than the PBS VERTICAL primetime season BAR average. AA RATINGS % BY HH AND DEMO The corresponding delivery numbers--that is, the actual number of households or persons PBS AVERAGE AND GENERE viewing during an average minute--are shown below the ratings chart. PBS PRIMETIME PUBLIC AFFAIRS (000) 4.5x TOP-RATED ORIGINAL BROADCAST EPISODES 3.9x 1.3x 2.4x 1.6x 1.7x #4 #9 #3 #10 #6 2.6x as likely to hike on vacation (domestic travel) How to Read: Frontline viewers are 3.9x more likely than all primetime viewers to attend a classical music performance. Frontline ranked #4 among all PBS series for this same behavior. #1 INDIE DRAMA FILM NEWS/PUBLIC SCIENCE/NATURE AFFAIRS SCIENCE HISTORY & NATURE INDIE FILM PUBLIC DRAMA AFFAIRS 34 35
20 PUBLIC DRAMA AFFAIRS INDIE FILM SCIENCE HISTORY & NATURE NEWS/PUBLIC SCIENCE/NATURE AFFAIRS INDIE DRAMA FILM 36 VERTICAL BAR - PBS NEWSHOUR AA BY HH AND DEMOS THREE SEASONS 8.4x 2.9x 1.2x 1.7x 1.8x 1.6x #10 #11 #12 #3 #9(tied) 2.6x as likely to own exchange traded funds #3 How to Read: PBS NewsHour viewers are 2.9x more likely than all primetime viewers to attend a classical music performance. PBS NewsHour ranked #10 among all PBS series for this same behavior. 6.2x 3.9x 2.0x 2.0x 1.7x 3.2x #5 #2 #7 #8(tied) #1 4.6x 1.3x 2.4x 2.0x 2.8x #1 TBD #10 - MRI #2 FUSION #2 DATA #2 3x as likely to hunt on vacation How to Read: Charlie Rose The Week viewers are 3.9x more likely than all primetime viewers to attend a classical music performance. Charlie Rose The Week ranked #5 among all PBS series for this same behavior. 6.7x #1 2.2x as likely to be political activists How to Read: Washington Week viewers are 4.6x more likely than all primetime viewers to attend a classical music performance. Washington Week ranked #1 among all PBS series for this same behavior. #1 37 INDIE DRAMA FILM NEWS/PUBLIC SCIENCE/NATURE AFFAIRS SCIENCE HISTORY & NATURE INDIE FILM PUBLIC DRAMA AFFAIRS

21 GRAND DASHBOARD 38 39
 tuned for at least 6 minutes during a program or time period. Each household or person is counted only once.")
22 PBS PRIMETIME SERIES DUPLICATION HOUSEHOLD DUPLICATION PERCENT GLOSSARY Rating or AA (Average Audience) -- Percent of all TV households (or persons) watching during an average minute of a program or time period. Cume or Reach Total TV households (or persons) tuned for at least 6 minutes during a program or time period. Each household or person is counted only once. TABLE OF SERIES ON FACING PAGE WITH DUPLICATION PERCENTAGES Live+7 Includes all playback on a DVR within 7 days of the program feed or original time period. Non-Recent 18+ of a program who had not watched any PBS in the previous four weeks. Heavy 18+ are divided into five equal groups according to their time spent viewing PBS. The top 20%, who watch the most PBS, are called Heavy. Prime time rating the prime time rating includes tuning to all PBS stations during an average minute from Monday-Sunday 8-11 PM, (including multi-cast stations and all Live+7 viewing). Rating Point -- Each household rating point represents 1,158,000 households. Universe Estimate (UE) -- the total number of Homes or Persons in a given population MRI ATTITUDE AND BEHAVIOR ICONS - those who attend classical music or opera performances. - a segment classified by MRI through pyschographic statements as Advocates. Members of this segment are likely to have written something that was published, written an article for a magazine or newspaper, contacted media or similar behaviors. - a segment which includes enthusiastic adopters and regular users of technology. In comparison to -phobes, -Splorers and -Gamers. - those who have any type of financial investments totalling over $250, those who participate in any kind of foreign travel, whether for business or vacation. Contributor - those who report having made a contribution to a PBS station in the last 12 months. UNIVERSE ESTIMATES U.S. TV HOUSEHOLDS = 115,800,000 HOW TO READ: To be read across of all the households that watched American Experience, 5% of them also watched Washington Week. Note that all program duplication is calculated on a weekly basis, looking for duplication only when two programs aired within the same feed week. The table above represents the averages of just the weeks in which the two programs aired. 40 Persons in Households Total P2+ 294,659,000 Total ,689,000 P ,560,000 P ,780,000 P ,630,000 P ,880,000 P ,763,000 P ,317,000 P ,585,000 P ,144,000 Media Related Cable and/or ADS 104,410,000 Broadcast Only 11,390,000 DVD Owner 95,000,000 DVR Owner 54,210,000 Videogame Owner 51,450,000 Race of Householder Black (Alone or in combination) 14,860,000 White 88,270,000 Asian 5,230,000 Ethnicity of Householder Hispanic 14,690,000 Non-Hispanic 101,110,000 Education of Householder < 4 Yrs High School 13,350,000 4 Yrs High School 28,910, Yrs College 37,500, Yrs College 36,040,000 Household Income <$40,000 47,610,000 $40,000 - $59,999 19,070,000 $60,000 - $99,999 24,370,000 $100, ,750,000 41


23 Look inside... Audience Insight 2014 The latest on PBS s primetime ratings and rank among other popular networks for the full season Three-year ratings trends for each night of the week and every general audience series Special features on scripted acquisitions in drama, series reaching culturally diverse audiences, and pop-out programming events like Ken Burns The Roosevelts And new this year: A contributor index for every one of the ongoing series, a PBS viewer index to show what else PBS viewers like to watch on TV, and an attitudinal/behavioral profile of viewers on attributes such as arts interest, civic engagement, financial investments, and more! Get access Go to MyPBS for past booklets and presentations. Programming -- Nielsen Reports -- Audience Insights About Audience Insight... Since full-time national Nielsen measurement of PBS began in 2009, PBS Research has led a project called Audience Insight in order to increase insight into viewer behavior across the public television system and cultivate systemwide literacy with respect to audience measurement. Each year since then, PBS Research has published user-friendly reviews of the primetime broadcast season and has presented the results of its special analyses at concurrent sessions during the annual meeting and during webinars thereafter. This booklet is the latest publication of that ongoing project. This Audience Insight work and full time Nielsen measurement generally has informed PBS content, scheduling, and promotion strategy. Local station executives have been able to use the data to shape and share the compelling story of public television s reach, local programmers have been able to use the analysis to inform the decisions they make about how to build and promote their schedules, and development and marketing professionals have drawn on the data and insights to reach prospective contributors more effectively and make the case for PBS to potential local sponsors. For more information contact: Beth Walsh, bwalsh@pbs.org For additional copies contact: Gail Malloy, gmalloy@pbs.org Booklet designed and produced by City Square Associates, Inc., Cambridge, Massachusetts
Audience Insight 2015
 Audience Insight 2015 PBS Research publishes this annual audience review for the most recent complete TV season. Public television professionals from programmers and general managers to marketing and development
Audience Insight 2016 Annual Report
 Audience Insight 2016 Annual Report Profile September 21, 2015 - September 18, 2016 With Comparisons to the 2013-2014 and 2014-2015 Seasons TABLE OF CONTENTS 1 ABOUT THIS BOOK 2 GLOSSARY PART I: PRIMETIME
Audience Insight 2013 Season-to-Date
 Look inside... Audience Insight 2013 The latest on s primetime ratings and rank among other popular networks An up-to-date profile of our audience, overall, series-by-series, segment-by-segment Audience
Television Audience 2010 & 2011
 Television Audience 2010 & 2011 Overview The 51 st edition of Television Audience continues your collection of TV Audience reports. This report continues to include annual trends of population and television
Nielsen Examines TV Viewers to the Political Conventions. September 2008
 Nielsen Examines TV Viewers to the Political Conventions September 8 Nielsen Examines TV Viewers to the Political Conventions, September 8 The 8 presidential race has already proven itself an historic
Syndication April 2006
 1 Syndication 2006 April 2006 Syndicated Network Television Association 2 Syndication 2006 Strong Growth Clutter Advantage Improving Brand ROI Year-long Consistency Delivering Younger Viewers 3 Syndication
Promo Mojo: Season Eight of 'The Walking Dead' Debuts
 Promo Mojo: Season Eight of 'The Walking Dead' Debuts 10.25.2017 In the week ending Oct. 22, the eighth-season return of AMC's The Walking Dead clambered to the top of the Promo Mojo chart, racking up
CABLE NATION: Power of Branded TV Content v. Other Major Media
 TIME: V TV CABLE NATION: Power of Branded TV Content v. Other Major Media Power Of Branded TV Content v. Other Media Digital video has grown but represents only a nominal share of total video time TV dominants
THE CROSSPLATFORM REPORT
 STTE OF THE MEDI THE CROSSPLTFORM REPORT QURTER, 0 UNDERSTNDING THE VIDEO CONSUMER The average merican today has more ways to watch video whenever, however and wherever they choose. While certain segments
Talking Social TV 2. Ed Keller. Beth Rockwood. SVP, Discovery Communications & Chair, CRE Social Media Committee. CEO Keller Fay Group
 Talking Social TV 2 Beth Rockwood SVP, Discovery Communications & Chair, CRE Social Media Committee Ed Keller CEO Keller Fay Group Study Objectives 1 2 3 Investigate the dynamics of TV-related social media
Promo Mojo: TLC Tops Rankings With 'This Is Life Live'
 Promo Mojo: TLC Tops Rankings With 'This Is Life Live' 05.16.2018 For the fourth week in a row, cable networks sweep the Promo Mojo top-five ranker. The new number one: TLC, which racked up 222.8 million
THE SVOD REPORT CHARTING THE GROWTH IN SVOD SERVICES ACROSS THE UK 1 TOTAL TV: AVERAGE DAILY MINUTES
 1 THE SVOD REPORT CHARTING THE GROWTH IN SVOD SERVICES ACROSS THE UK January 219 A lot can change in a year. In 218, England had a football team that the public actually enjoyed watching and the Beast
Promo Mojo: Discovery's 'Gold Rush' Strikes It Rich
 Promo Mojo: Discovery's 'Gold Rush' Strikes It Rich 10.18.2017 With most fall broadcast premieres behind us, cable returned to the top of the Promo Mojo chart, led by the eighth-season debut of Discovery's
Your Audience on America s Movie Network. Testimonial-Brian LaChance, Owner, The Snowman
 Welcome to NCM! 1 Your Audience on America s Movie Network Testimonial-Brian LaChance, Owner, The Snowman 2 Imagine a place where people watch your ad on 50-foot HD screens with no distractions, remotes
Promo Mojo: NBC Closes Out Olympics by Leading for 5th Straight Week
 Promo Mojo: NBC Closes Out Olympics by Leading for 5th Straight Week 02.28.2018 For a record fifth week in a row, NBC grabs the top spot on the Promo Mojo chart with its promos for the 2018 PyeongChang
AUSTRALIAN MULTI-SCREEN REPORT QUARTER
 AUSTRALIAN MULTI-SCREEN REPORT QUARTER 02 Australian viewing trends across multiple screens Since its introduction in Q4 2011, The Australian Multi- Screen Report has tracked the impact of digital technologies,
Local Programs by Design
 Local Programs by Design By Judith and David LeRoy Every week, TRAC reviews program performance in the 56 metered markets. Through the years, we noted that many stations most popular programs were local
Reebok Reaches Light TV Viewers with Google and YouTube
 Reebok Reaches Light TV Viewers with Google and YouTube Online is Complementary to TV in a Cross Media Campaign March 2012 Executive Summary 1 2 3 4 Light TV viewers are not reached effectively on TV but
ThinkNow Media How Streaming Services & Gaming Are Disrupting Traditional Media Consumption Habits Report
 ThinkNow Media How Streaming Services & Gaming Are Disrupting Traditional Media Consumption Habits 2018 Report 1 ThinkNow Media What is it? ThinkNow Media is a nationwide survey that looks at Americans
Promo Mojo: Fox Takes First and Second Place with NFL, '9-1-1'
 Promo Mojo: Fox Takes First and Second Place with NFL, '9-1-1' 10.10.2018 On the strength of 318 million TV ad impressions, a spot for Thursday Night Football tops this week's chart. An announcer notes
TV + Google YouTube. Complementary in a Cross Media Campaign Strategy
 TV + Google YouTube Complementary in a Cross Media Campaign Strategy Executive Summary 1 Light TV viewers are not reached effectively on TV but they are watching online 2 3 4 Light TV viewers are valuable
Promo Mojo: NBC's 'Billboard Music Awards' Puts Broadcast Back on Top
 Promo Mojo: NBC's 'Billboard Music Awards' Puts Broadcast Back on Top 05.23.2018 Following four weeks in a row during which cable networks swept the Promo Mojo top five, a traditional broadcaster, NBC,
First-Time Electronic Data on Out-of-Home and Time-Shifted Television Viewing New Insights About Who, What and When
 First-Time Electronic Data on Out-of-Home and Time-Shifted Television Viewing New Insights About Who, What and When Bob Patchen, vice president, Research Standards and Practices Beth Webb, manager, PPM
KDFC -The Bay Area s Listener Supported Classical Public Radio
 KDFC -The Bay Area s Listener Supported Classical Public Radio Format: Classical Public Radio Non Commercial/Listener Supported + Underwriting/Sponsorship Mission: Classical KDFC provides access to great
ThinkTV FACT PACK NEW ZEALAND JAN TO DEC 2017
 ThinkTV FACT PACK NEW ZEALAND JAN TO DEC 2017 TV Has Changed NEW ZEALAND Today s TV is a sensory experience enjoyed by over 3 million viewers every week. Powered by new technologies to make TV available
NPR Weekend Programs
 NPR Weekend Programs Spring 2011 Reality has a way of eventually getting your attention In This Report Weekend programming is critical to NPR stations. In fact, the level of radio listening on Saturday
australian multi-screen report QUARTER 2, 2012 trends in video viewership beyond conventional television sets
 australian multi-screen report QUARTER 2, trends in video viewership beyond conventional television sets VIDEO CONTENT ACROSS MULTIPLE SCREENS Australians watched more than 104 hours of video per month
AUSTRALIAN MULTI-SCREEN REPORT
 AUSTRALIAN MULTISCREEN REPORT TRENDS IN VIDEO VIEWERSHIP BEYOND CONVENTIONAL TELEVISION SETS QUARTER 2 VIDEO CONTENT ACROSS MULTIPLE SCREENS The latest edition of the Australian MultiScreen Report ( )
Television, Internet and Mobile Usage in the U.S. A2/M2 Three Screen Report
 Television, Internet and Mobile Usage in the U.S. A2/M2 Three Screen Report VOLUME 5 2nd Quarter 2009 Viewership on the Rise as More Video Content Spans All Three Screens 57% of Internet Consumers Use
AMERICA S MOTORCYCLE NEWS SOURCE 2017 MEDIA KIT. Sean Finley O (949)
") AMERICA S MOTORCYCLE NEWS SOURCE 2017 MEDIA KIT Sean Finley sean.finley@digitalthrottle.com O (949) 207-3209 OVERVIEW Cycle News is one of the most respected media outlets in the motorcycle market. The
AMERICA S MOTORCYCLE NEWS SOURCE 2017 MEDIA KIT Sean Finley sean.finley@digitalthrottle.com O (949) 207-3209 OVERVIEW Cycle News is one of the most respected media outlets in the motorcycle market. The
AUSTRALIAN MULTI-SCREEN REPORT QUARTER
 AUSTRALIAN MULTI-SCREEN REPORT QUARTER 02 Australian viewing trends across multiple screens The edition of the Australian Multi-Screen Report provides the latest estimates of technologies present in Australian
Mobile Viewing Trends Emerging Entertainment Technology
 Mobile Viewing Trends Emerging Entertainment Technology New Entertainment Technology (NET) Tracker (October, November, December) Copyright Screen Engine/ASI 2017. Any duplication, reproduction or usage
The Relationship Between Movie theater Attendance and Streaming Behavior. Survey Findings. December 2018
 The Relationship Between Movie theater Attendance and Streaming Behavior Survey Findings Overview I. About this study II. III. IV. Movie theater attendance and streaming consumption Quadrant Analysis:
Cool Off With Premium Video Content: How Viewers are Beating The Heat During Summer Months
 Cool Off With Premium Video Content: How Viewers are Beating The Heat During Summer Months Contents Summer Video Viewing 4 Reach 5-7 Days tuned-in 8 Summer Streaming 9-11 Summer Binging 12 Time spent by
AUSTRALIAN MULTI-SCREEN REPORT QUARTER
 AUSTRALIAN MULTI-SCREEN REPORT QUARTER 03 Australian viewing trends across multiple screens The Australian Multi-Screen Report shows Australian homes have more screens, channel and platform choices and
NETWORK PRIMETIME & OTT PROGRAMMING Flash #5-15 November 2017
 NETWORK PRIMETIME & OTT PROGRAMMING Flash #5-15 November 2017 The 2017-18 primetime season has reached a point where the networks have solidified their winning nights, where the strongest established programs
The Council for Research Excellence
 The Council for Research Excellence Consists of 35+ senior-level research professionals Represents advertisers, agencies, networks, cable companies, and station groups Seeks to advance the knowledge and
TALKING SOCIAL TV 2 April 10, 2014
 TALKING SOCIAL TV 2 April 10, 2014 1 ABOUT THE CRE The Council for Research Excellence is a body of senior research professionals, formed in 2005 to identify important questions about audience measurement
Description of Methodology
 Description of Methodology February 12 th, 2018 Description of Methodology Contents CHAPTER 1 OVERVIEW... 1 METHODOLOGY OUTLINE... 1 HOUSEHOLD MEASUREMENTS... 3 DEMOGRAPHIC MEASUREMENTS... 6 VIDEO ON DEMAND
Video Consumer Mapping Study
 Video Consumer Mapping Study Appendix 1. Additional Findings & Presentation Materials Note: Each section below is hyperlinked to corresponding slides, available in full screen only. The text box on bottom
NIELSEN MUSIC HIGHLIGHTS 1 NIELSEN MUSIC HIGHLIGHTS REPORT
 NIELSEN MUSIC 360 2016 HIGHLIGHTS 1 NIELSEN MUSIC 360-2016 HIGHLIGHTS REPORT NIELSEN MUSIC 360 2016 A LOT HAS HAPPENED IN MUSIC IN THE LAST YEAR. New streaming services debuted, record-breaking albums
The Relationship Between Movie Theatre Attendance and Streaming Behavior. Survey insights. April 24, 2018
 The Relationship Between Movie Theatre Attendance and Streaming Behavior Survey insights April 24, 2018 Overview I. About this study II. III. IV. Movie theatre attendance and streaming consumption Quadrant
Promo Mojo: CBS' 'Total Knock Out' Beats Out Competition to Lead List
 Promo Mojo: CBS' 'Total Knock Out' Beats Out Competition to Lead List 07.11.2018 The promo for CBS's new obstacle-course competition show TKO: Total Knock Out from competition from comedian Kevin Hart
Cable Television Advertising. A Guide for the Radio Marketer
 Cable Television Advertising A Guide for the Radio Marketer Overview Cable Television has seen tremendous advertising revenue growth in recent years. This growth is believed to have impacted radio s revenue
AUSTRALIAN MULTI-SCREEN REPORT QUARTER
 AUSTRALIAN MULTISCREEN REPORT QUARTER 4 TV AND OTHER VIDEO CONTENT ACROSS MULTIPLE SCREENS The latest edition of the Australian MultiScreen Report ( ) shows robust viewing of broadcast television on inhome
Applications. Media Cost x 1,000 Impressions. Avg. Unit Cost Rating (000) CPM = Avg. Unit Cost Rating % Total Schedule Cost CPP = GRPs
 CPM = Avg. Unit Cost Rating % Total Schedule Cost CPP = GRPs") Applications CPM = Media Cost x 1,000 Impressions Avg. Unit Cost Rating (000) CPP = Avg. Unit Cost Rating % Total Schedule Cost = Impressions U.E. Rating x # spots Reach x Frequency HUT = #HH w/ TV sets
Applications CPM = Media Cost x 1,000 Impressions Avg. Unit Cost Rating (000) CPP = Avg. Unit Cost Rating % Total Schedule Cost = Impressions U.E. Rating x # spots Reach x Frequency HUT = #HH w/ TV sets
The Connected Consumer
 The Connected Consumer The target market exceeds 100 M U.S. adults Connected Mainstreamers, 29% Connected Early Adopters, 9% Resistors, 40% Connection Prospects, 8% Non- Committals, 14% PROJECTED MILLIONS
Promo Mojo: CBS' 'Instinct' Takes Top Spot
 Promo Mojo: CBS' 'Instinct' Takes Top Spot 03.21.2018 CBS takes the top spot in this week's Promo Mojo ranking with promos for its new police procedural drama Instinct, which racked up just over 270 million
NIELSEN MUSIC U.S. MUSIC REPORT HIGHLIGHTS
 NIELSEN MUSIC U.S. MUSIC 360 2017 REPORT HIGHLIGHTS 1 INTRODUCTION This year s Music 360 survey reflects the continuing changing nature of the music industry and listener habits. Erin Crawford SVP Nielsen
Media Comparisons 2012 Persons
 Media Comparisons 2012 Persons Television Reaches More People Each Day than Any Other Medium Television 88,3 Internet 73,1 Radio Newspaper Mobile Phone Magazines 27,8 24,8 36,1 58,8 % Reached Yesterday
Description of Methodology
 Description of Methodology November 10 th, 2017 Contents CHAPTER 1 OVERVIEW... 1 METHODOLOGY OUTLINE... 1 HOUSEHOLD MEASUREMENTS... 4 DEMOGRAPHIC MEASUREMENTS... 6 CHAPTER 2 IMPORTING DATA... 9 TUNE INFORMATION...
REACHING THE UN-REACHABLE
 UNITED STATES REACHING THE UN-REACHABLE 5 MYTHS ABOUT THOSE WHO WATCH LITTLE TO NO TV SHIFT HAPPENS. IT S WELL DOCUMENTED. U.S. HOMES IN MILLIONS Cable Telco Satellite We Project MVPDs Will Lose About
MULTIPLE- SCREEN VIEWING: SPORT: THE WORLD CUP AND SPORTS VIEWING 1 ENGLAND V CROATIA (ITV) - WEDNESDAY JULY 11TH 2018
 - WEDNESDAY JULY 11TH 2018") 1 MULTIPLE- SCREEN VIEWING: AN INTRODUCTION TO HOW PEOPLE WATCH TELEVISION ACROSS FOUR SCREENS September 2018 UNDER EMBARGO UNTIL 00.01, SEPTEMBER 25TH 2018 A train journey across the UK is enough to hint
1 MULTIPLE- SCREEN VIEWING: AN INTRODUCTION TO HOW PEOPLE WATCH TELEVISION ACROSS FOUR SCREENS September 2018 UNDER EMBARGO UNTIL 00.01, SEPTEMBER 25TH 2018 A train journey across the UK is enough to hint
STOCK MARKET DOWN, NEW MEDIA UP
 FOR RELEASE: SUNDAY, NOVEMBER 9, 1997, 4:00 P.M. STOCK MARKET DOWN, NEW MEDIA UP FOR FURTHER INFORMATION CONTACT: Andrew Kohut, Director Beth Donovan, Editor Greg Flemming, Survey Director Pew Research
TV EVERYWHERE /OTT CTVE
 TV EVERYWHERE /OTT CTVE CTV Media, Inc 2017 THE WAY YOU WATCH TV IS CHANGING Live Linear TV Set Top Box VOD (in your living room) TV Everywhere Mobile Laptop Tablet OTT : Roku Amazon Fire TV Chromecast,
Promo Mojo: Fox's 'The Gifted' Takes Its Turn at Top
 Promo Mojo: Fox's 'The Gifted' Takes Its Turn at Top 10.04.2017 On the strength of 395.3 million TV ad impressions for promos leading up to its Oct. 2 premiere, Fox's The Gifted, another spin-off from
Promo Mojo: Food Network's 'Wedding Cake Championship' Edges Out World Cup
 Promo Mojo: Food Network's 'Wedding Cake Championship' Edges Out World Cup 06.20.2018 On the strength of 243 million TV ad impressions, a promo for Food Network's Wedding Cake Championship tops our chart.
Contents Penetration of Technology Television is ubiquitous Slide 4 Australians love their TV
 Free TV Today Contents Penetration of Technology Television is ubiquitous Slide 4 Australians love their TV Slide 5 Time Spent with Media Time spent watching TV unchanged Slide 6 The TV set dominates our
 Local TV remains leading source of news even as online grows Television remains the most popular choice for national and international news, despite the growth of online news sources. There has been continued
Exploring Millennials Meaningful Relationship With TV Programming
 ... Committed V I D E O A D V E R T I S I N G B U R E A U - R E P O R T 2 0 1 8... Committed Exploring Millennials Meaningful Relationship With TV Programming Contents 1 TV s High Emotional Stakes 2 Survey
BARB Establishment Survey Quarterly Data Report: Total Network
 BARB Establishment Survey Quarterly Data Report: Total Network Jan 2018 to Mar 2018 BARB ESTABLISHMENT SURVEY OF TV HOMES DATA PERIOD: QUARTERLY Jan - Mar 2018 Page 1 Contents Page Total Network (All Areas)
Contents. DVR Penetration Ethnic Penetration...4. DVR v. Non-DVR Time Spent With DVR Time Spent By Demo...9
 DVR Penetration... 3 Ethnic Penetration...4 DVR v. Non-DVR... 5-6 Contents Time Spent With DVR... 8 Time Spent By Demo...9 Time Spent By Ethnicity...10-11 Playback by Hour... 13 Playback by Genre... 14
Digital Ad. Maximizing TV Stations' Revenues. The Digital Opportunity. A Special Report from Media Group Online, Inc.
 Maximizing TV Stations' Digital Ad The Digital Opportunity TV is an enviable position compared to almost all other traditional media in the digital age: an increasing number of TV households, a 96.5% penetration
PREMIER NEW HIGH-END DEVELOPMENT 30,000+ SF OF RETAIL/RESTAURANT/OFFICE SPACE IN THE TOWN OF LOS GATOS
 MEACHAM/OPPENHEIMER Commercial Brokerage I Investment Sales I Property Management Blossom Hill Road @ Los Gatos Blvd. LOS GATOS, CALIFORNIA Located Across the Street from Whole Foods, Lunardi s, Starbucks,
Welcome from Mickey. It s no secret that video is a go-to strategy for consumer marketers.
 TV Buying Basics Welcome from Mickey It s no secret that video is a go-to strategy for consumer marketers. It s obvious why. Sight, sound, and motion create a powerful brand experience, while digital targeting
Currently, SBS International reaches more than 13 million households in the US through major satellite and cable service providers.
 MEDI KIT Who We re Since its founding in 1992 as the merican Subsidiary of Seoul Broadcasting System, SBS International has introduced SBS programs to audiences throughout the world. Currently, SBS International
THE CONTINUING GROWTH OF ANYTIME, ALL-THE-TIME VIDEO ENTERTAINMENT
 QURTER 2, 2011 THE CONTINUING GROWTH OF NYTIME, LL-THE-TIME VIDEO ENTERTINMENT Timeshifted TV ushered in a new era of consumer control of media, with emerging technologies driving an explosion of content
D PSB Audience Impact. PSB Report 2011 Information pack June 2012
 D PSB Audience Impact PSB Report 2011 Information pack June 2012 Contents Page Background 2 Overview of PSB television 11 Nations and regions news 25 Individual PSB channel summaries 33 Overall satisfaction
NPOWER VIDEO ON DEMAND REPORT GUIDE SUMMER 2013
 NPOWER VIDEO ON DEMAND REPORT GUIDE SUMMER 2013 VIDEO ON DEMAND Today s TV landscape allows networks to distribute their program content on multiple platforms, including traditional TV, on-demand and digital
Funny Factuals & Documentaries. Sponsorship Opportunity
 Funny Factuals & Documentaries Sponsorship Opportunity Sky 1 Channel Insight Sky 1 The home of fresh, feel-good, family entertainment Pillars 1 2 3 Feel-good: Bold, uplifting entertainment that s full
POV: Making Sense of Current Local TV Market Measurement
 March 7, 2012 # 7379 To media agency executives, media directors and all media committees. POV: Making Sense of Current Local TV Market Measurement This document is intended to raise awareness around the
Deutsche Bank Conference June 2005
 Deutsche Bank Conference June 2005 www.hearstargyle.com This presentation includes forward-looking statements. We based these forward-looking statements on our current expectations and projections about
The Real Summer Getaway: Escaping With Premium Video Content
 The Real Summer Getaway: Escaping With Premium Video Content Summer Reading List Summer-y 3-4 Summer Activities: 5-12 Understanding Seasonal Behaviors Summertime TV Programming: 13-16 Highlighting The
2 Television and audio-visual content Recent developments in Scotland
 2 Television and audio-visual content 2 2.1 Recent developments in Scottish Government In October 2011 the Scottish Government published its final progress report on the Scottish Broadcasting Commission
AUSTRALIAN MULTI-SCREEN REPORT QUARTER
 AUSTRALIAN MULTI-SCREEN REPORT QUARTER 04 Australian viewing trends across multiple screens Over its history, the Australian Multi-Screen Report has documented take-up of new consumer technologies and
Survey on the Regulation of Indirect Advertising and Sponsorship in Domestic Free Television Programme Services in Hong Kong.
 Survey on the Regulation of Indirect Advertising and Sponsorship in Domestic Free Television Programme Services in Hong Kong Opinion Survey Executive Summary Prepared for Communications Authority By MVA
Australian. video viewing report
 Australian video viewing report QUARTER 4 2 Introduction W elcome to the Australian Video Viewing Report spanning the year through. This issue builds on the continuing story of how Australians are embracing
2007 Canadian Chinese Media Monitor
 2007 Canadian Chinese Media Monitor METHODOLOGY A total of 1,200 telephone interviews were conducted among Chinese Canadians who are 18 years of age or older. 600 interviews were completed in Vancouver
Overview of Television landscape in New LC1* Markets. *Guj LC1, MP LC1, PHCHP LC1, Raj LC1, UP LC1
 Overview of Television landscape in New LC1* Markets *Guj LC1, MP LC1, PHCHP LC1, Raj LC1, UP LC1 Television Universe New LC1 Vs Existing Markets Content Demographic Composition of the Market TV viewing
BARB Establishment Survey Annual Data Report: Volume 1 Total Network and Appendices
 BARB Establishment Survey Annual Data Report: Volume 1 Total Network and Appendices Apr 2017 to Mar 2018 BARB ESTABLISHMENT SURVEY OF TV HOMES Page 1 DATA PERIOD: ANNUAL Apr 2017 - Mar 2018 Contents Page
TV COVERAGE FUN CUP CHAMPIONSHIP 2017
 TV COVERAGE FUN CUP CHAMPIONSHIP 2017 1 TV COVERAGE FUN CUP CHAMPIONSHIP 2017 OVERVIEW Prepared by FJA TV / CHRIS HARTLEY MEDIA 14 th November 2017 Our 16 th year of coverage of the Funcup Championship
TV Today. Lose Small, Win Smaller. Rating Change Distribution Percent of TV Shows vs , Broadcast Upfronts 1
 Rating Change Distribution Percent of TV Shows 27-28 vs. -, Broadcast Upfronts 1 TV Today Figure 1 27-28 18% 18% 29% 24% 11% Lose Small, Win Smaller 3 out of 4 weekly broadcast shows lost up to 1% of their
Outsells. InStyle. Vogue, Harpers Bazaar, and Elle
 MEDIA KIT 2017 Source: emma Mar 17, Roy Morgan Mar 17 InStyle Outsells Vogue, Harpers Bazaar, and Elle Source: MAT to 23/04/17 Australian Grocery Weighted Scan IRI MarketEdge, based on data definitions
ThinkTV FACT PACK NEW ZEALAND JAN TO DEC 2017
 ThinkTV FACT PACK NEW ZEALAND JAN TO DEC 2017 TV Has Changed NEW ZEALAND Today s TV is a sensory experience enjoyed by over 3 million viewers every week. Powered by new technologies to make TV available
Video over the Internet Can we break the Net? CBS Interactive
 Video over the Internet Can we break the Net? Mark Kortekaas CTO CBS Interactive mkortekaas@cbs.com IP Television From Wikipedia: IPTV (Internet Protocol Television) is a system where a digital television
Jazz in the Newspapers
 Publications and Products/Jazz in the Media/Final/281012 Jazz in the by Esther Briggs A comparative review of newspaper coverage of jazz, classical & world music Jazz Services Ltd 132 Southwark Street
CONNECTING BRANDS WITH CUSTOMERS WHO MATTER MOST. As of April 30, 2018
 CONNECTING BRANDS WITH CUSTOMERS WHO MATTER MOST As of April 30, 2018 CONNECTING BRANDS WITH THE MOST VALUABLE AUDIENCE Strong Audience Base Viewers Loyalty Dominating Viewing Share 75% of Malaysian homes
MEN S LIFESTYLE NETWORK
 MNI MEN S LIFESTYLE NETWORK MAGAZINE MEDIA KIT MEET THE MNI MEN S LIFESTYLE NETWORK Our world-class brands ensure that your message gets in front of the right audience. Iconic brands like Esquire, Forbes,
Syndicated Television: The Daytime Leader
 Syndicated Television: The Daytime Leader Is Growing +2.5% Syndication Day Network Day -5.1% while network day is declining Source: Nielsen W25-54 AA/GAA (000) October-March 2004/05 vs. 2003/04 The Majority
Competition Works. Consumers Win!
 Competition Works. Consumers Win! Competition, Choice and Value Shape Today s Communications Marketplace National Cable & Telecommunications Association 1 Today s Communications Marketplace Intensely competitive,
The Communications Market: Digital Progress Report
 The Communications Market: Digital Progress Report Digital TV, 2009 This is Ofcom s twenty-third Digital Progress Report covering developments in multichannel television. The data are the latest available
Instant Intel: Broadband Only Homes
 Instant Intel: Broadband Only Homes What is A Broadband Only Home? Broadband Only homes are defined as a household with at least one operable TV/monitor that receives video exclusively through a broadband
Nielsen National TV Analytics API Beta Technical Reference
 Nielsen National TV Analytics API Beta Technical Reference Authorization API POST Request URL: https://api.developer.nielsen.com/watchapi/oauth/token Header Name Authorization (required) string Base64
2007 Canadian Chinese Media Monitor
 2007 Canadian Chinese Media Monitor METHODOLOGY A total of 1,200 telephone interviews were conducted among Chinese Canadians who are 18 years of age or older. 600 interviews were completed in Vancouver
Enjoy the spectacular site of balloons gracefully floating across the sky September 23, 24, & 25, 2016
 InTouch Credit Union Plano Balloon Festival September 23, 24, & 25, 2016 Oak Point Park Plano, Texas See thousands of smiling faces awestruck by the vision of hot-air balloons filling the sky with a Kaleidoscope
Local Television Advertising Effectiveness Study. Kathleen Keefe Vice President, Sales March 21, 2008
 Local Television Advertising Effectiveness Study Kathleen Keefe Vice President, Sales March 21, 2008 0 Table Of Contents Objectives And Methodology 2 Executive Summary 6 Viewership And Preferred Media
Ort, Datum Munich, October 2015 German Media Flash Data September 2015
 Ein A company Unternehmen belonging der to ProSiebenSat.1 Media Media AG AG Ort, Datum Munich, October 2015 German Media Flash Data September 2015 German Advertising Market TV expenses increase Mediamix
V I D E O A D V E R T I S I N G B U R E A U - R E P O R T TV Preferred. Understanding YouTube Enthusiasts Affinity For Video Content
 V I D E O A D V E R T I S I N G B U R E A U - R E P O R T 2 0 1 9... TV Preferred Understanding YouTube Enthusiasts Affinity For Video Content 2 Contents 1 Survey Overview 2 YouTube Enthusiasts Are Voracious
SALES DATA REPORT
 SALES DATA REPORT 2013-16 EXECUTIVE SUMMARY AND HEADLINES PUBLISHED NOVEMBER 2017 ANALYSIS AND COMMENTARY BY Contents INTRODUCTION 3 Introduction by Fiona Allan 4 Introduction by David Brownlee 5 HEADLINES