Algorithm User Guide: Colocalization
|
|
|
- Kathleen Summers
- 5 years ago
- Views:
Transcription
1 Algorithm User Guide: Colocalization Use the Aperio algorithms to adjust (tune) the parameters until the quantitative results are sufficiently accurate for the purpose for which you intend to use the algorithm. You will want to test the algorithm on a variety of images so its performance can be evaluated across the full spectrum of expected imaging conditions. To be successful, it is usually necessary to limit the field of application to a particular type of tissue and a specific histological preparation. A more narrowly defined application and consistency in slide preparation generally equates to a higher probability of success in obtaining satisfactory algorithms results. Aperio algorithms provided by Human Tissue Resource Center: Positive Pixel Count Colocalization Color Deconvolution Nuclear Quantification Membrane Quantification Microvessel Analysis Rare Event Detection Cytoplasmic In histology and cytology, a variety of staining methods are used to target different types of tissues and cellular structures and for detection of specific proteins. In an H&E stain, for example, Hematoxylin preferentially stains the nucleus, while Eosin stains both nucleus and cytoplasm. In IHC analyses, different stains mark the presence of one or more proteins within the cell. The colocalization algorithm calculates the contribution of each stain at every pixel location in the image. For IHC, it determines where specific proteins are present and to what extend the proteins are colocalized that is, whether they occur separately or in combination with each other. Detecting and measuring the colocalization of multiple proteins is an important part of larger scientific studies, which seek to determine a correlation between the occurrence of these proteins and the outcome of a specific disease treatment. The colocalization algorithm classifies each pixel as either part of a single stain or representing a combination of stains based on the separated stains intensities. It can also be used for cytoplamic analysis by measuring only the cytoplasmic component of staining. The first 6 input parameters on every macro should NOT be changed. The next 3 parameters (Classifier Neighborhood, Classifier, and Class Lists) are Genie parameters and should be changed. 1
2 1 Algorithm Input Parameters A. Input parameters for Colocalization Algorithm Mark up Image Type There are two types of mark up images Co Localization (used for colocalization analysis) and Deconvolved (used to calibrate stain color vectors). Mode Choose Colocalization mode or Counter stain, Double Label mode. o Double label immunohistochemistry analysis is frequently used to identify cellular and subcellular colocalization of independent antigens, and is a special case of the more general colocalization analysis. In the case of double label analysis, Color 1 represents the counterstain, for which you want information only for where Color 1 occurs by itself, not where it occurs in combination with Color 2 and Color 3. Colors 2 and 3 are used to identify specific protein markers. Color (1) Threshold Intensity threshold (upper limit) for color channel 1. Color (1) Lower Threshold Intensity threshold (lower limit) for color channel 1. Color (2) Threshold Intensity threshold (upper limit) for color channel 2. Color (2) Lower Threshold Intensity threshold (lower limit) for color channel 2. Color (3) Threshold Intensity threshold (upper limit) for color channel 3. Color (3) Lower Threshold Intensity threshold (lower limit) for color channel 3. Color (1) Red Component OD (optical density) for color 1 Red (default is Hematoxylin stain). Color (1) Green Component OD (optical density) for color 1 Green (default is Hematoxylin stain). Color (1) Blue Component OD (optical density) for color 1 Blue (default is Hematoxylin stain). Color (2) Red Component OD (optical density) for color 2 Red (default is Eosin stain). Color (2) Green Component OD (optical density) for color 2 Green (default is Eosin stain). Color (2) Blue Component OD (optical density) for color 2 Blue (default is Eosin stain). Color (3) Red Component OD (optical density) for color 3 Red (default is DAB stain). Color (3) Green Component OD (optical density) for color 3 Green (default is DAB stain). Color (3) Blue Component OD (optical density) for color 3 Blue (default is DAB stain). Clear Area Intensity This is the intensity for a clear area on the slide. This value is always 240 for ScanScope generated images. 2 Algorithm Results A. Understanding the Results As an example of interpreting the results listed below, the color magenta in the mark-up image shows all pixels that contain both Color 1 and Color 2. The intensities listed under Percent (1+2) MAGENTA in the results give the intensity of Color 1 in all areas that contain both Color 1 and Color 2 and the intensity of Color 2 in all areas that contain both Color 1 and Color 2. Note: The first section of the Layer Attributes pane displays the algorithm results; the second portion (labeled Algorithm Inputs ) repeats the input parameters you specified. 2
3 B. Algorithm Output Parameters Percent (1) BLUE Percent of the analyzed area that contains Color 1. Shown in blue in the mark up image. o Intensity (1,1) Intensity of Color 1 in areas consisting of only Color 1. Percent (1+2) MAGENTA Percent of the analyzed area that contains Color 1 and Color 2. Shown in magenta in the mark up image. o Intensity (1, 1+2) Intensity of Color 1 in areas consisting of Color 1 and Color 2. o Intensity (2, 1+2) Intensity of Color 2 in areas consisting of Color 1 and Color 2. Percent (2) RED Percent of the analyzed area that contains Color 2. Shown in red in the mark up image. o Intensity (2,2) Intensity of Color 2 in areas consisting of only Color 2. Percent (2+3) YELLOW Percent of the analyzed area that contains Color 2 and Color 3. Shown in yellow in the mark up image. o Intensity (2, 2+3) Intensity of Color 2 in areas consisting of Color 2 and Color 3. o Intensity (3, 2+3) Intensity of Color 3 in areas consisting of Color 2 and Color 3. Percent (3) GREEN Percent of the analyzed area that contains Color 3. Shown in green in the mark up image. o Intensity (3, 3) Intensity of Color 3 in areas consisting of only Color 3. Percent (1+3) CYAN Percent of the analyzed area that contains Color 1 and Color 3. Shown in cyan in the mark up image. o Intensity (1, 1+3) Intensity of Color 1 in areas consisting of Color 1 and Color 3. o Intensity (3, 1+3) Intensity of Color 3 in areas consisting of Color 1 and Color 3. Percent (1+2+3) BLACK Percent of the analyzed area that contains Color 1, Color 2, and Color 3. Shown in black in the mark up image. o Intensity (1, 1+2+3) Intensity of Color 1 in areas containing Color 1, Color 2, and Color 3. o Intensity (2, 1+2+3) Intensity of Color 2 in areas containing Color 1, Color 2, and Color 3. o Intensity (3, 1+2+3) Intensity of Color 3 in areas containing Color 1, Color 2, and Color 3. Overall Intensity (1) Overall intensity of Color 1 in the analyzed area. Overall Intensity (2) Overall intensity of Color 2 in the analyzed area. Overall Intensity (3) Overall intensity of Color 3 in the analyzed area. Total Stained Area (mm^2) Total area (in mm 2 ) that is stained. Total Analysis Area (mm^2) Total area (in mm 2 ) that was analyzed. Average Red OD Average optical density of Red. Average Green OD Average optical density of Green. Average Blue OD Average optical density of Blue. 3 Color Calibration and Thresholding Using Colocalization A. What Is Color Calibration? By defining the stain color vectors, you are identifying to the Colocalization algorithm which color identifies which stain. The default color vector values are as follows: o Color 1 Hematoxylin o Color 2 Eosin o Color 3 DAB 3
4 The color vector numbers must be changed if different stains are used. The color for each stain is calibrated separately. o If possible, use a separate control slide for each stain you want to analyze. o If this is not possible, look for several areas of the digital slide that are mostly stained with stain of interest and select them by using the ImageScope drawing tools. Pick an area of light staining of only this color. Avoid selecting darker, overstained areas. If you are using only two stains, not three, set the color vector values for the third color to zero. B. Performing Color Calibration Annotate the digital slide. Be sure to annotate an area on the slide stained ONLY by that particular color. Open the Analysis window and click Create. Select Colocalization v9. Choose the appropriate layer and color channel (Color 1 Hem, Color 2 Eosin, Color 3 DAB). Check Selected Annotation Layers. Click Run. Open the Annotations window. Search the results and look for the Average OD (optical density) values for Red, Green, Blue. Type these values into Input parameters corresponding color component for Color 1, 2, or 3. Repeat these steps for the other stains if necessary. C. Thresholding By setting upper and lower stain thresholds, you are selecting feature detection thresholds. For example, if you increase the background lower threshold, you will exclude very dark areas. Change the thresholds to pick up just the range of color you need. Select Deconvolved Color Channel for the color you are working with from the Mark-up Image Type drop down list. Now set the thresholds for that color. Below, we want to quantify cystoplasm cells separately from nuclei. Nuclei are stained with Hematoxylin, while nuclei and cytoplasm are stained with DAB. Running with 1 Deconvolved Color Channel (1) selected and the calibrated OD values results in this mark-up image: 4


5 To maximize the detection of nuclei, change the upper threshold for Color 1 to a lower number (e.g. 200 to 180). [0 = darkest; 255 = lightest] Now more nuclei and less cytoplasm are detected. To minimize picking up background, set the Mark-up Image Type to 3- Deconvolved Color Channel (3). Try reducing the upper threshold to limit the amount of background detected. If you are not using a color, set the unused color thresholds to zero. 4 Colocalization Analysis A. Running Analysis After stain color vectors have been calibrated and staining thresholds set you can run the algorithm in analysis mode to determine the percentages and intensities of stains that occur alone in the image and in combination with other stains. On the Input parameters, select 0 Co-Localization in the Mark-up Image Type drop-down list and select the analysis mode you want to use from the Mode drop-down list. Select Selected Annotation Layer to analyze only selected areas of the image. Check the Generate Markup Image box. Click Run. 5


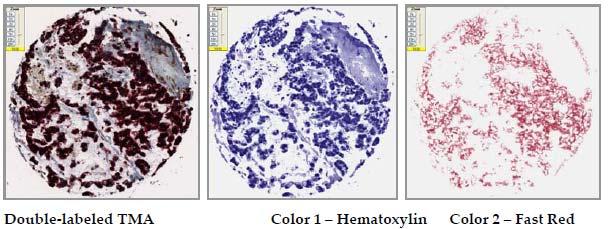
6 Open the Annotations window to view results. B. Cytoplasmic Analysis Example In the following cytoplasmic example, Hematoxylin was used as the counter stain with DAB as the cytoplasmic stain. The objective was to measure only the cytoplasmic component of the DAB staining. Since the DAB stains both cytoplasm and nuclei, this is a difficult task for most algorithms. Colocalization separates the two stains and the cytoplasmic component is identified as the area where DAB only is present, without Hematoxylin staining. Note: This is the green component in the mark-up image. The algorithm reports the percentage of the area that is comprised of cytoplasm along with the intensity of the cytoplasm staining. Using the Color 3 deconvolution selection in the Mark up Image Type drop down list results in a mark up image of just the DAB stain (nuclei and cytoplasm). Using the Color 1 deconvolution selection results in a mark up image of just the Hematoxylin stain (nuclei). 6

, (Color 3), and together (Colors 2+3).")
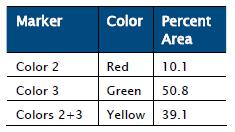
7 Running the algorithm in 0 Colocalization analysis mode results in a mark up image that shows all the combinations of stains present. Note: Nuclei shown in cyan; cytoplasm shown in green. C. Double Labeling Example Double label immunohistochemistry analysis is a special case of the more general colocalization analysis. In the case of double label analysis, Color 1 represents the counterstain, for which you want information only for where Color 1 occurs by itself, not where it occurs in combination with Color 2 and Color 3. Colors 2 and 3 are used to identify specific protein markers. In the following double labeling example, Fast Red and DAB were used as marker stains with Hematoxylin as the counter stain. The Colocalization algorithm separated the stains and reported the percentage of the stained area in which the stains occur separately (Color 2), (Color 3), and together (Colors 2+3). These three states are shown as different colors in the mark up image. The intensity of each stain was also reported for each of the three states. The intensity information provides a measure of the protein concentration, with darker intensity corresponding to more protein. 7

8 8
A Digital Pathology Solution for Immunohistochemistry. Digital IHC. User s Guide
 A Digital Pathology Solution for Immunohistochemistry Digital IHC User s Guide Copyright 2007 2009 Aperio Technologies, Inc. Part Number/Revision: MAN 0099, Revision B Date: September 4, 2009 This document
FIJI/Image J for Quantification Hands on session
 FIJI/Image J for Quantification Hands on session Dr Paul McMillan Biological Optical Microscopy Platform Hands on demonstrations FIJI set up Line Profile Thresholding Area of stain Cell confluence Nuclei
Import and quantification of a micro titer plate image
 BioNumerics Tutorial: Import and quantification of a micro titer plate image 1 Aims BioNumerics can import character type data from TIFF images. This happens by quantification of the color intensity and/or
SEM- EDS Instruction Manual
 SEM- EDS Instruction Manual Double-click on the Spirit icon ( ) on the desktop to start the software program. I. X-ray Functions Access the basic X-ray acquisition, display and analysis functions through
Confocal Application Notes Vol. 2 May 2004
 The Sequential Scan Tool In Sequential Scan mode, images will be recorded in a sequential order instead of acquiring them simultaneously in different channels. Each sequence can be recorded using an individual
How to Optimize Ad-Detective
 How to Optimize Ad-Detective Ad-Detective technology is based upon black level detection. There are several important criteria to consider: 1. Does the video have black frames to detect? Are there any
Deep Neural Networks Scanning for patterns (aka convolutional networks) Bhiksha Raj
 Bhiksha Raj") Deep Neural Networks Scanning for patterns (aka convolutional networks) Bhiksha Raj 1 Story so far MLPs are universal function approximators Boolean functions, classifiers, and regressions MLPs can be
Deep Neural Networks Scanning for patterns (aka convolutional networks) Bhiksha Raj 1 Story so far MLPs are universal function approximators Boolean functions, classifiers, and regressions MLPs can be
Calibrating the timecode signal input
 Chapter 5 Calibrating the timecode signal input Computer hardware can introduce an offset between the timecode signal and the video signal, which causes the timecode and video to be offset when they are
READ THIS FIRST. Morphologi G3. Quick Start Guide. MAN0412 Issue1.1
 READ THIS FIRST Morphologi G3 Quick Start Guide MAN0412 Issue1.1 Malvern Instruments Ltd. 2008 Malvern Instruments makes every effort to ensure that this document is correct. However, due to Malvern Instruments
Electrospray-MS Charge Deconvolutions without Compromise an Enhanced Data Reconstruction Algorithm utilising Variable Peak Modelling
 Electrospray-MS Charge Deconvolutions without Compromise an Enhanced Data Reconstruction Algorithm utilising Variable Peak Modelling Overview A.Ferrige1, S.Ray1, R.Alecio1, S.Ye2 and K.Waddell2 1 PPL,
2. ctifile,s,h, CALDB,,, ACIS CTI ARD file (NONE none CALDB <filename>)
") MIT Kavli Institute Chandra X-Ray Center MEMORANDUM December 13, 2005 To: Jonathan McDowell, SDS Group Leader From: Glenn E. Allen, SDS Subject: Adjusting ACIS Event Data to Compensate for CTI Revision:
MIT Kavli Institute Chandra X-Ray Center MEMORANDUM December 13, 2005 To: Jonathan McDowell, SDS Group Leader From: Glenn E. Allen, SDS Subject: Adjusting ACIS Event Data to Compensate for CTI Revision:
Reconstruction of Ca 2+ dynamics from low frame rate Ca 2+ imaging data CS229 final project. Submitted by: Limor Bursztyn
 Reconstruction of Ca 2+ dynamics from low frame rate Ca 2+ imaging data CS229 final project. Submitted by: Limor Bursztyn Introduction Active neurons communicate by action potential firing (spikes), accompanied
Scout 2.0 Software. Introductory Training
 Scout 2.0 Software Introductory Training Welcome! In this training we will cover: How to analyze scwest chip images in Scout Opening images Detecting peaks Eliminating noise peaks Labeling your peaks of
homework solutions for: Homework #4: Signal-to-Noise Ratio Estimation submitted to: Dr. Joseph Picone ECE 8993 Fundamentals of Speech Recognition
 INSTITUTE FOR SIGNAL AND INFORMATION PROCESSING homework solutions for: Homework #4: Signal-to-Noise Ratio Estimation submitted to: Dr. Joseph Picone ECE 8993 Fundamentals of Speech Recognition May 3,
1. Add Capture Antibody diluted in coating buffer. 4. Add standards, controls and samples to the plate in duplicate.
 Matched antibody pair kits include a capture and biotinylated detector antibody pair and a calibrated protein standard. Kits are available in two sizes, with enough reagents for either 2 or 10 x 96-well
Machine Vision System for Color Sorting Wood Edge-Glued Panel Parts
 Machine Vision System for Color Sorting Wood Edge-Glued Panel Parts Q. Lu, S. Srikanteswara, W. King, T. Drayer, R. Conners, E. Kline* The Bradley Department of Electrical and Computer Eng. *Department
FAQs by Jack C Tutorials about Remote Sensing Science and Geospatial Information Technologies
 C: DIAGNOSTIC PRODUCTS FOR SURFACE REFLECTANCE IMAGES Like Frequently Asked Questions, a question is posed, e.g., C1. How Do I Make a Mask (MK) Raster? Then, an answer is given 1 with comments and opinions.
2. Problem formulation
 Artificial Neural Networks in the Automatic License Plate Recognition. Ascencio López José Ignacio, Ramírez Martínez José María Facultad de Ciencias Universidad Autónoma de Baja California Km. 103 Carretera
Ultra 4K Tool Box. Version Release Note
 Ultra 4K Tool Box Version 2.1.43.0 Release Note This document summarises the enhancements introduced in Version 2.1 of the software for the Omnitek Ultra 4K Tool Box and related products. It also details
Agilent N6467A BroadR-Reach Compliance Test Application. Methods of Implementation
 Agilent N6467A BroadR-Reach Compliance Test Application Methods of Implementation s1 Notices Agilent Technologies, Inc. 2013 No part of this manual may be reproduced in any form or by any means (including
set. Important Note: the system must be calibrated before meaningful quant results can be obtained!
 Quant Initialization Before any quantitative results can be obtained, the detector parameters and the analysis parameters must be set. Important Note: the system must be calibrated before meaningful quant
HBI Database. Version 2 (User Manual)
") HBI Database Version 2 (User Manual) St-Petersburg, Russia 2007 2 1. INTRODUCTION...3 2. RECORDING CONDITIONS...6 2.1. EYE OPENED AND EYE CLOSED CONDITION....6 2.2. VISUAL CONTINUOUS PERFORMANCE TASK...6
HBI Database Version 2 (User Manual) St-Petersburg, Russia 2007 2 1. INTRODUCTION...3 2. RECORDING CONDITIONS...6 2.1. EYE OPENED AND EYE CLOSED CONDITION....6 2.2. VISUAL CONTINUOUS PERFORMANCE TASK...6
NanoTrack Cell and Particle Tracking Primer
 NanoTrack Cell and Particle Tracking Primer The NanoTrack Pnode allows the user to track single cells and particles with nanometer precision at very fast tracking speeds. The speed of the tracking is dependent
VivoSense. User Manual Galvanic Skin Response (GSR) Analysis Module. VivoSense, Inc. Newport Beach, CA, USA Tel. (858) , Fax.
 Analysis Module. VivoSense, Inc. Newport Beach, CA, USA Tel. (858) , Fax.") VivoSense User Manual Galvanic Skin Response (GSR) Analysis VivoSense Version 3.1 VivoSense, Inc. Newport Beach, CA, USA Tel. (858) 876-8486, Fax. (248) 692-0980 Email: info@vivosense.com; Web: www.vivosense.com
VivoSense User Manual Galvanic Skin Response (GSR) Analysis VivoSense Version 3.1 VivoSense, Inc. Newport Beach, CA, USA Tel. (858) 876-8486, Fax. (248) 692-0980 Email: info@vivosense.com; Web: www.vivosense.com
Latest Assessment of Seismic Station Observations (LASSO) Reference Guide and Tutorials
 Reference Guide and Tutorials") Latest Assessment of Seismic Station Observations (LASSO) Reference Guide and Tutorials I. Introduction LASSO is a software tool, developed by Instrumental Software Technologies Inc. in conjunction with
Latest Assessment of Seismic Station Observations (LASSO) Reference Guide and Tutorials I. Introduction LASSO is a software tool, developed by Instrumental Software Technologies Inc. in conjunction with
CHAPTER 2 SUBCHANNEL POWER CONTROL THROUGH WEIGHTING COEFFICIENT METHOD
 CHAPTER 2 SUBCHANNEL POWER CONTROL THROUGH WEIGHTING COEFFICIENT METHOD 2.1 INTRODUCTION MC-CDMA systems transmit data over several orthogonal subcarriers. The capacity of MC-CDMA cellular system is mainly
N T I. Introduction. II. Proposed Adaptive CTI Algorithm. III. Experimental Results. IV. Conclusion. Seo Jeong-Hoon
 An Adaptive Color Transient Improvement Algorithm IEEE Transactions on Consumer Electronics Vol. 49, No. 4, November 2003 Peng Lin, Yeong-Taeg Kim jhseo@dms.sejong.ac.kr 0811136 Seo Jeong-Hoon CONTENTS
COGS 119/219 MATLAB for Experimental Research. Fall 2017 Image Processing in Matlab
 COGS 119/219 MATLAB for Experimental Research Fall 2017 Image Processing in Matlab What is an image? An image is an array, or a matrix of square pixels (picture elements) arranged in rows and columns.
A New Standardized Method for Objectively Measuring Video Quality
 1 A New Standardized Method for Objectively Measuring Video Quality Margaret H Pinson and Stephen Wolf Abstract The National Telecommunications and Information Administration (NTIA) General Model for estimating
Remote Director. Apple 23 LCD Display. Collaborative Soft Proofing using the I. MANUFACTURER INTRODUCTION. SWOP Application Data Sheet
 SWOP Application Data Sheet Remote Director Collaborative Soft Proofing using the Apple 23 LCD Display The SWOP Review Committee has approved the use of off-press proofs as input material to publications.
MultiSpec Tutorial: Visualizing Growing Degree Day (GDD) Images. In this tutorial, the MultiSpec image processing software will be used to:
 Images. In this tutorial, the MultiSpec image processing software will be used to:") MultiSpec Tutorial: Background: This tutorial illustrates how MultiSpec can me used for handling and analysis of general geospatial images. The image data used in this example is not multispectral data
MultiSpec Tutorial: Background: This tutorial illustrates how MultiSpec can me used for handling and analysis of general geospatial images. The image data used in this example is not multispectral data
Getting Started. Connect green audio output of SpikerBox/SpikerShield using green cable to your headphones input on iphone/ipad.
 Getting Started First thing you should do is to connect your iphone or ipad to SpikerBox with a green smartphone cable. Green cable comes with designators on each end of the cable ( Smartphone and SpikerBox
SPP-100 Module for use with the FSSP Operator Manual
 ` Particle Analysis and Display System (PADS): SPP-100 Module for use with the FSSP Operator Manual DOC-0199 A; PADS 2.8.2 SPP-100 Module 2.8.2 2545 Central Avenue Boulder, CO 80301 USA C O P Y R I G H
TMT data acquisition on the LTQ-Orbitrap XL Mass Spectrometer
 TECH TIP # 70 TMT data acquisition on the LTQ-Orbitrap XL Mass Spectrometer Introduction TR0070.0 Successful acquisition of quantitative tandem mass tag (TMT*) data with the Thermo Scientific LTQ-Orbitrap
Table of Contents. 2 Select camera-lens configuration Select camera and lens type Listbox: Select source image... 8
 Table of Contents 1 Starting the program 3 1.1 Installation of the program.......................... 3 1.2 Starting the program.............................. 3 1.3 Control button: Load source image......................
Appendix D. UW DigiScope User s Manual. Willis J. Tompkins and Annie Foong
 Appendix D UW DigiScope User s Manual Willis J. Tompkins and Annie Foong UW DigiScope is a program that gives the user a range of basic functions typical of a digital oscilloscope. Included are such features
Bias, Auto-Bias And getting the most from Your Trifid Camera.
 Bias, Auto-Bias And getting the most from Your Trifid Camera. The imaging chip of the Trifid Camera is read out, one well at a time, by a 16-bit Analog to Digital Converter (ADC). Because it has 16-bits
What s New in Raven May 2006 This document briefly summarizes the new features that have been added to Raven since the release of Raven
 What s New in Raven 1.3 16 May 2006 This document briefly summarizes the new features that have been added to Raven since the release of Raven 1.2.1. Extensible multi-channel audio input device support
Fault Detection And Correction Using MLD For Memory Applications
 Fault Detection And Correction Using MLD For Memory Applications Jayasanthi Sambbandam & G. Jose ECE Dept. Easwari Engineering College, Ramapuram E-mail : shanthisindia@yahoo.com & josejeyamani@gmail.com
LaCie 321 LCD Monitor
 SWOP Application Data Sheet Remote Director Monitor Proofing System using the LaCie 321 LCD Monitor The SWOP Review Committee has approved the use of off-press proofs as input material to publications.
Using Manchester and NRZ Configurable Protocol Decoders
 Using Manchester and NRZ Configurable Protocol Decoders TECHNICAL BRIEF March 14, 2013 Summary Manchester and NRZ encoding schemes serve as building blocks for industrystandard and custom protocols. Here
Vision Sensor Short Manual
 Vision Sensor FQ Short Manual Cat. No. Z306-E1-02A Table of Contents 1. Introduction 1-1 FQ-series Vision Sensors....................................... 4 1-2 Measurement Process.........................................
30 GHz Attenuator Performance and De-Embedment
 30GHz De-Embedment Application Note - Page 1 of 6 Theory of De-Embedment. Due to the need for smaller packages and higher signal integrity a vast majority of todays RF and Microwave components are utilizing
Using the VP300 to Adjust Video Display User Controls
 Using the VP300 to Adjust Video Display User Controls Today's technology has produced extraordinary improvements in video picture quality, making it possible to have Cinema-like quality video right in
Application Note: Using the Turner Designs Model 10-AU Fluorometer to Perform Flow Measurements in Sanitary Sewers by Dye Dilution
 Instrument set-up: Model 10-AU Digital Fluorometer equipped with the 13 mm x 100 mm cuvette holder; and a 10-056/10-056R (546 nm) Excitation Filter, a 10-052/10-052R (>570 nm) Emission Filter, 10-053/10-053R
Remote Director. EIZO ColorEdge CG21. Collaborative Soft Proofing using the I. MANUFACTURER INTRODUCTION. SWOP Application Data Sheet
 SWOP Application Data Sheet Remote Director Collaborative Soft Proofing using the EIZO ColorEdge CG21 The SWOP Review Committee has approved the use of off-press proofs as input material to publications.
Characterization and improvement of unpatterned wafer defect review on SEMs
 Characterization and improvement of unpatterned wafer defect review on SEMs Alan S. Parkes *, Zane Marek ** JEOL USA, Inc. 11 Dearborn Road, Peabody, MA 01960 ABSTRACT Defect Scatter Analysis (DSA) provides
Technical Specifications
 1 Contents INTRODUCTION...3 ABOUT THIS LAB...3 IMPORTANCE OF THE MODULE...3 APPLYING IMAGE ENHANCEMENTS...4 Adjusting Toolbar Enhancement...4 EDITING A LOOKUP TABLE...5 Trace-editing the LUT...6 Comparing
Instrument Recognition in Polyphonic Mixtures Using Spectral Envelopes
 Instrument Recognition in Polyphonic Mixtures Using Spectral Envelopes hello Jay Biernat Third author University of Rochester University of Rochester Affiliation3 words jbiernat@ur.rochester.edu author3@ismir.edu
Thought Technology Ltd Belgrave Avenue, Montreal, QC H4A 2L8 Canada
 Thought Technology Ltd. 2180 Belgrave Avenue, Montreal, QC H4A 2L8 Canada Tel: (800) 361-3651 ٠ (514) 489-8251 Fax: (514) 489-8255 E-mail: _Hmail@thoughttechnology.com Webpage: _Hhttp://www.thoughttechnology.com
Vocoder Reference Test TELECOMMUNICATIONS INDUSTRY ASSOCIATION
 TIA/EIA STANDARD ANSI/TIA/EIA-102.BABC-1999 Approved: March 16, 1999 TIA/EIA-102.BABC Project 25 Vocoder Reference Test TIA/EIA-102.BABC (Upgrade and Revision of TIA/EIA/IS-102.BABC) APRIL 1999 TELECOMMUNICATIONS
CAEN Tools for Discovery
 Viareggio March 28, 2011 Introduction: what is the SiPM? The Silicon PhotoMultiplier (SiPM) consists of a high density (up to ~10 3 /mm 2 ) matrix of diodes connected in parallel on a common Si substrate.
DPX Acquisition Technology for Spectrum Analyzers Fundamentals. Primer
 DPX Acquisition Technology for Spectrum Analyzers Fundamentals Primer Primer Table of Contents A Revolutionary Tool for Signal Discovery, Trigger, Capture and Analysis..........................3 The DPX
HP Indigo Press at a Glance. User Guide
 HP Indigo Press at a Glance User Guide HP Indigo Press at a Glance User Guide Copyright information 2008 Copyright Hewlett-Packard Development Company, L.P. Reproduction, adaptation or translation without
Max Score / Max # Possible - New ABI Gradebook Feature
 Max Score / Max # Possible - New ABI Gradebook Feature OPTIONAL MAX SCORE TOOL (*EGP users: This was the Max Score / Points feature in EGP.) This feature is for teachers who want to enter Raw Scores for
Video compression principles. Color Space Conversion. Sub-sampling of Chrominance Information. Video: moving pictures and the terms frame and
 Video compression principles Video: moving pictures and the terms frame and picture. one approach to compressing a video source is to apply the JPEG algorithm to each frame independently. This approach
SpectraPlotterMap 12 User Guide
 SpectraPlotterMap 12 User Guide 108.01.1609.UG Sep 14, 2016 SpectraPlotterMap version 12, included in Radial Suite Release 8, displays two and three dimensional plots of power spectra generated by the
The Measurement Tools and What They Do
 2 The Measurement Tools The Measurement Tools and What They Do JITTERWIZARD The JitterWizard is a unique capability of the JitterPro package that performs the requisite scope setup chores while simplifying
Application Note. Validation of the EP European Pharmacopoeia Color Scale AN
 Application Note AN 1032.01 Validation of the EP European Pharmacopoeia Color Scale Abstract When a pharmaceutical company asks how they can validate the implementation of HunterLab EZMQC+ER software for
THE JOURNAL OF CELL BIOLOGY
 Supplemental Material Fejtova et al., http://www.jcb.org/cgi/content/full/jcb.200807155/dc1 THE JOURNAL OF CELL BIOLOGY Figure S1. Mitochondrial localization of fusion constructs using TOM20 mitochondrial
In basic science the percentage of authoritative references decreases as bibliographies become shorter
 Jointly published by Akademiai Kiado, Budapest and Kluwer Academic Publishers, Dordrecht Scientometrics, Vol. 60, No. 3 (2004) 295-303 In basic science the percentage of authoritative references decreases
PulseCounter Neutron & Gamma Spectrometry Software Manual
 PulseCounter Neutron & Gamma Spectrometry Software Manual MAXIMUS ENERGY CORPORATION Written by Dr. Max I. Fomitchev-Zamilov Web: maximus.energy TABLE OF CONTENTS 0. GENERAL INFORMATION 1. DEFAULT SCREEN
GBA 327: Module 7D AVP Transcript Title: The Monte Carlo Simulation Using Risk Solver. Title Slide
 GBA 327: Module 7D AVP Transcript Title: The Monte Carlo Simulation Using Risk Solver Title Slide Narrator: Although the use of a data table illustrates how we can apply Monte Carlo simulation to a decision
PowerMonic. FAQs [2/12]
![PowerMonic. FAQs [2/12]](/thumbs/86/94869864.jpg "PowerMonic. FAQs [2/12]") PowerMonic FAQs [2/12] Table of Contents FAQ 1. Why do I need to connect Phase A?... 2 FAQ 2. What is the purpose of the internal battery in a PowerMonic?... 2 FAQ 3. What power does a PowerMonic draw
PowerMonic FAQs [2/12] Table of Contents FAQ 1. Why do I need to connect Phase A?... 2 FAQ 2. What is the purpose of the internal battery in a PowerMonic?... 2 FAQ 3. What power does a PowerMonic draw
For the SIA. Applications of Propagation Delay & Skew tool. Introduction. Theory of Operation. Propagation Delay & Skew Tool
 For the SIA Applications of Propagation Delay & Skew tool Determine signal propagation delay time Detect skewing between channels on rising or falling edges Create histograms of different edge relationships
Introduction to GRIP. The GRIP user interface consists of 4 parts:
 Introduction to GRIP GRIP is a tool for developing computer vision algorithms interactively rather than through trial and error coding. After developing your algorithm you may run GRIP in headless mode
Homework 2 Key-finding algorithm
 Homework 2 Key-finding algorithm Li Su Research Center for IT Innovation, Academia, Taiwan lisu@citi.sinica.edu.tw (You don t need any solid understanding about the musical key before doing this homework,
111 Highland Drive Putnam, CT USA PHONE (860) FAX (860) SM32Pro SDK
 FAX (860) SM32Pro SDK") SM32Pro SDK Spectrometer Operating -Software Development Kit- USER MANUAL For USB 2.0 Multi-channel User Only Table of Contents Warranty and Liability...3 Location of the SDK source code for USB 2.0...4
SM32Pro SDK Spectrometer Operating -Software Development Kit- USER MANUAL For USB 2.0 Multi-channel User Only Table of Contents Warranty and Liability...3 Location of the SDK source code for USB 2.0...4
Subtitle Safe Crop Area SCA
 Subtitle Safe Crop Area SCA BBC, 9 th June 2016 Introduction This document describes a proposal for a Safe Crop Area parameter attribute for inclusion within TTML documents to provide additional information
Optimization of Multi-Channel BCH Error Decoding for Common Cases. Russell Dill Master's Thesis Defense April 20, 2015
 Optimization of Multi-Channel BCH Error Decoding for Common Cases Russell Dill Master's Thesis Defense April 20, 2015 Bose-Chaudhuri-Hocquenghem (BCH) BCH is an Error Correcting Code (ECC) and is used
AEROTRAK PORTABLE AIRBORNE PARTICLE COUNTER MODEL 9110 QUICK START GUIDE
 AEROTRAK PORTABLE AIRBORNE PARTICLE COUNTER MODEL 9110 QUICK START GUIDE Thank you for purchasing a TSI AeroTrak Model 9110 Portable Airborne Particle Counter (particle counter). This guide will help you
Dektak Step by Step Instructions:
 Dektak Step by Step Instructions: Before Using the Equipment SIGN IN THE LOG BOOK Part 1: Setup 1. Turn on the switch at the back of the dektak machine. Then start up the computer. 2. Place the sample
Statistics for Engineers
 Statistics for Engineers ChE 4C3 and 6C3 Kevin Dunn, 2013 kevin.dunn@mcmaster.ca http://learnche.mcmaster.ca/4c3 Overall revision number: 19 (January 2013) 1 Copyright, sharing, and attribution notice
Discovery of frequent episodes in event sequences
 Discovery of frequent episodes in event sequences Andres Kauts, Kait Kasak University of Tartu 2009 MTAT.03.249 Combinatorial Data Mining Algorithms What is sequential data mining Sequencial data mining
A HIGHLY INTERACTIVE SYSTEM FOR PROCESSING LARGE VOLUMES OF ULTRASONIC TESTING DATA. H. L. Grothues, R. H. Peterson, D. R. Hamlin, K. s.
 A HIGHLY INTERACTIVE SYSTEM FOR PROCESSING LARGE VOLUMES OF ULTRASONIC TESTING DATA H. L. Grothues, R. H. Peterson, D. R. Hamlin, K. s. Pickens Southwest Research Institute San Antonio, Texas INTRODUCTION
Rotary Knife Controller
 PCM-22 Rotary Knife Controller Information furnished by EMERSON Motion Control is believed to be accurate and reliable. However, no responsibility is assumed by EMERSON Motion Control for its use. EMERSON
USB Mini Spectrum Analyzer User s Guide TSA5G35
 USB Mini Spectrum Analyzer User s Guide TSA5G35 Triarchy Technologies, Corp. Page 1 of 21 USB Mini Spectrum Analyzer User s Guide Copyright Notice Copyright 2011 Triarchy Technologies, Corp. All rights
Measurements on GSM Base Stations According to Rec
 Measurements on GSM Base Stations According to Rec. 11.20 Application Note 1EF23_0L Subject to change 10 September 96, Josef Wolf / Roland Minihold Products: FSE incl. Option FSE-B7 1 Introduction The
David Castrillo Manager Spain-Portugal
 Digital Pathology Solutions by Hamamatsu Presentación para el Congreso Telepatología en Jerez. Noviembre 2014 David Castrillo +34 667 67 53 37 dcastrillo@hamamatsu.es Manager Spain-Portugal Who is Hamamatsu?
TL-2900 AMMONIA & NITRATE ANALYZER DUAL CHANNEL
 TL-2900 AMMONIA & NITRATE ANALYZER DUAL CHANNEL DATA ACQUISITION SYSTEM V.15.4 INSTRUCTION MANUAL Timberline Instruments, LLC 1880 S. Flatiron Ct., Unit I Boulder, Colorado 80301 Ph: (303) 440-8779 Fx:
Power Consumption Trends in Digital TVs produced since 2003
 Power Consumption Trends in Digital TVs produced since 2003 Prepared by Darrell J. King And Ratcharit Ponoum TIAX LLC 35 Hartwell Avenue Lexington, MA 02421 TIAX Reference No. D0543 for Consumer Electronics
Brain-Computer Interface (BCI)
") Brain-Computer Interface (BCI) Christoph Guger, Günter Edlinger, g.tec Guger Technologies OEG Herbersteinstr. 60, 8020 Graz, Austria, guger@gtec.at This tutorial shows HOW-TO find and extract proper signal
Brain-Computer Interface (BCI) Christoph Guger, Günter Edlinger, g.tec Guger Technologies OEG Herbersteinstr. 60, 8020 Graz, Austria, guger@gtec.at This tutorial shows HOW-TO find and extract proper signal
Interface Practices Subcommittee SCTE STANDARD SCTE Measurement Procedure for Noise Power Ratio
 Interface Practices Subcommittee SCTE STANDARD SCTE 119 2018 Measurement Procedure for Noise Power Ratio NOTICE The Society of Cable Telecommunications Engineers (SCTE) / International Society of Broadband
Introduction & Colour
 Introduction & Colour Eric C. McCreath School of Computer Science The Australian National University ACT 0200 Australia ericm@cs.anu.edu.au Overview Computer Graphics Uses Basic Hardware and Software Colour
Company Software Manual version Issued Date Sony Corporation Projector Calibration Pro Version 0.04 Mar 3rd, 2017
 1 A. Equipment Required B. Corresponding projectors / Functions C. Preparation D. Functions E. Note 1. Equipment Required - Software: Projector Calibration Pro - Sony Projector with LAN port
Logo Guidelines. Contents. About the Identity 2 Logo Variations 4 Minimum Logo Size 5 Logo Clear Space 6 Logo Don ts 7 Brand Architecture
 Logo Guidelines Developed by Haft2 Inc. First Edition August 2011 Contents About the Identity 2 Logo Variations 4 Minimum Logo Size 5 Logo Clear Space 6 Logo Don ts 7 Brand Architecture Explorers Edge
Processing. Electrical Engineering, Department. IIT Kanpur. NPTEL Online - IIT Kanpur
 NPTEL Online - IIT Kanpur Course Name Department Instructor : Digital Video Signal Processing Electrical Engineering, : IIT Kanpur : Prof. Sumana Gupta file:///d /...e%20(ganesh%20rana)/my%20course_ganesh%20rana/prof.%20sumana%20gupta/final%20dvsp/lecture1/main.htm[12/31/2015
Deep Search Cannot Communicate Callsigns
 Deep Search Cannot Communicate Callsigns Klaus von der Heide, DJ5HG There has been some discussion on the validity of QSOs which use the deep search decoder of JT65 [1,2,3,4]. The goal of this paper is
McIDAS-V Tutorial Using HYDRA to Interrogate Hyperspectral Data updated September 2015 (software version 1.5)
") McIDAS-V Tutorial Using HYDRA to Interrogate Hyperspectral Data updated September 2015 (software version 1.5) McIDAS-V is a free, open source, visualization and data analysis software package that is the
McIDAS-V Tutorial Using HYDRA to Interrogate Hyperspectral Data updated September 2015 (software version 1.5) McIDAS-V is a free, open source, visualization and data analysis software package that is the
Nature Neuroscience: doi: /nn Supplementary Figure 1. Ensemble measurements are stable over a month-long timescale.
 Supplementary Figure 1 Ensemble measurements are stable over a month-long timescale. (a) Phase difference of the 30 Hz LFP from 0-30 days (blue) and 31-511 days (red) (n=182 channels from n=21 implants).
The RNA binding protein HuR determines the differential translation of autismassociated. FoxP subfamily members in the developing neocortex
 The RNA binding protein HuR determines the differential translation of autismassociated FoxP subfamily members in the developing neocortex Popovitchenko T 1, Thompson K 1, Viljetic B 1, Jiao X 2, Kontonyiannis
EASY-MCS. Multichannel Scaler. Profiling Counting Rates up to 150 MHz with 15 ppm Time Resolution.
 Multichannel Scaler Profiling Counting Rates up to 150 MHz with 15 ppm Time Resolution. The ideal solution for: Time-resolved single-photon counting Phosphorescence lifetime spectrometry Atmospheric and
Experiments on musical instrument separation using multiplecause
 Experiments on musical instrument separation using multiplecause models J Klingseisen and M D Plumbley* Department of Electronic Engineering King's College London * - Corresponding Author - mark.plumbley@kcl.ac.uk
Multifrequency Eddy Current Inspection of Rivetrows on Aircraft Structures
 ECNDT 2006 - Tu.4.4.1 Multifrequency Eddy Current Inspection of Rivetrows on Aircraft Structures Gerhard SCHEER, Lars FRISCHE, Test Maschinen Technik, Schwarmstedt, Germany Theodor MEIER, Airbus Deutschland,
AMIQ-K2 Program for Transferring Various-Format I/Q Data to AMIQ. Products: AMIQ, SMIQ
 Products: AMIQ, SMIQ AMIQ-K2 Program for Transferring Various-Format I/Q Data to AMIQ The software AMIQ-K2 enables you to read, convert, and transfer various-format I/Q data files to AMIQ format. AMIQ-K2
Digital Audio Design Validation and Debugging Using PGY-I2C
 Digital Audio Design Validation and Debugging Using PGY-I2C Debug the toughest I 2 S challenges, from Protocol Layer to PHY Layer to Audio Content Introduction Today s digital systems from the Digital
We Believe the Possibilities. Case Study
 We Believe the Possibilities. Case Study SA Pathology, Adelaide, South Australia GROSSING Pathologist cut-up of specimen, dictate macro description of specimen, photograph and annotate sections. STAINING
A repetition-based framework for lyric alignment in popular songs
 A repetition-based framework for lyric alignment in popular songs ABSTRACT LUONG Minh Thang and KAN Min Yen Department of Computer Science, School of Computing, National University of Singapore We examine
To show the Video Scopes, click on the down arrow next to View located in the upper- right corner of your playback panel.
 1 FCPX: 3.3 COLOR CORRECTION Color Correcting and Color Grading are usually the last things you do before exporting your video. Color Correcting is the process of achieving the correct, natural color of
Motion Video Compression
 7 Motion Video Compression 7.1 Motion video Motion video contains massive amounts of redundant information. This is because each image has redundant information and also because there are very few changes