Line Information System (LIS) Reference and Training Manual Rev /01/12 Making information accessible, visible, understandable, and actionable.
|
|
|
- Alexandra Horn
- 5 years ago
- Views:
Transcription
")


1 Line Information System (LIS) Reference and Training Manual Rev /01/12 Making information accessible, visible, understandable, and actionable.

2 1 LIS General Features: LIS isn t proprietary; CCR owns and fully controls the code. LIS is built on a robust hardware and software foundation, the same as that used for mission critical applications. The architecture is standard, resulting in low implementation and support cost. Single point of accountability and responsibility for the entire system (including support): Control Engineering Group User friendly interface. Top level screens present limited information with quick, easy access to more detailed information. For example, the line layout page gives a quick overview of the line status including all machines center. To view more detailed information for a particular machine center, simply select that machine center. LIS is a powerful line startup tool. It can be used to validate the performance guaranty for new machines center and new production lines.
3 2 Module 1: Set Up and Data Entry

4 3 D E A B C A B C USLE (Unconstrained System Line Efficiency) (%) Cases Produced Filler Spd. This is the actual real time filler speed expressed in cans or bottles per minute. Note that if two fillers are used in one line that this value will be the sum of the two filler actual real speed. D Plant Total Case Count This is the total case count from all the lines being monitored by LIS since the beginning of the day. E Config. Lines This will allow the user to navigate to the Configuration Plant page. This page is not normally used from day to day. This page is used to setup LIS at startup. This page and other pages accessible through this page are password protected.

5 4 D E A B C This page allows the user to select which line(s) is/are being monitored by the LIS. A check-mark indicates that the selected line will be monitored by LIS. From the CONFIGURATION PLANT page, the user can access individual line configuration pages. This consists of machine configuration within a line as shown in the following: A B C CONFIG MACHINE navigates to configuring line layouts CONFIG MAX SPEED navigates to configuring the machine rated speeds per line CONFIG COUNTERS navigates to configuring the counters The line name / number and any other information in yellow can be edited by the user to reflect the setup of the plant. This information will be set up by the controls engineer and should not normally need to be changed. D E This number reflects the position of the line in the list of lines on the LIS screen. 1 is the leftmost, 2 the next over, etc. This is the actual line name / number of the physical line.
 This allows the user to rename the machines to something other")
6 5 A B C Again, information highlighted in yellow can be edited by the user. A B C Setup the USLE expectations (low and high values). The color code will reflect the selection (green if USLE > =High Value, Yellow if Low Value <USLE < High Value, Red if USLE< =Low Value) This allows the user to rename the machines to something other than the LIS standard. By default, machines will simply be given names like Packer #1. The user can rename them to something more relevant to their plant (for example, Kisters or Hi-Cone ). When a machine is in Production mode, it will be penalized each time it goes down from an Internal Fault (i.e. not in Lack or Backup, but not running). When the machine is in Commission mode, it will NOT be penalized for things like Lack of Cartons (Packers) or Lack of Caps, Lack of Syrup, or Discharge Jam (Fillers). Production and Commission mode are toggled by the checkbox.
 USLE and the threshold for the average maximum speed depend on the filler rating speed.")
7 6 Setting up Filler Speed is critical for USLE, etc Setting up other Machines Speed is important for V-Graph CONFIG MAX SPEED This page allows the user to enter the rated speeds for each machine used. Please be aware of the following items within this page: 1) USLE and the threshold for the average maximum speed depend on the filler rating speed. Filler rating speed value is entered by the user within this page. 2) This page can accommodate different bottle sizes. Quite often the machine rated speeds vary with bottle size. 3) If there is more than one machine running, for example, two labelers, then the rated speed entered is the rated speed sum of the machines. 4) This page is password protected and is not normally changed after installation of the LIS.

8 7 This screen focus on one Line, displays the line KPIs and allows an easy navigations to other line screens.
9 8 A H B D C F E G Note that this page is view only, any changes (other than activating PRE-START ) requires a password. This page allows the user to enter the shift and pause durations. The above example illustrates a schedule for today. In this example, first shift begins at 6:00 AM and will run for 8 hours. The second shift will begin at 2:00 and run for 8 hours. The third shift begins at 10:00 PM and will run for 6 hours. B/C Correct values must be entered within these parameters for the LIS to accurately represent the KPIs. These values can be changed anytime during the day and are active for future scheduling as soon as they are entered.
10 A ENTER START TIME Start time cannot be changed for the current day. To change the start time for the next day, use the Tomorrow s Supervisor screen (next page) B ENTER FIRST SHIFT LENGTH Note that this definition is applicable for 2 nd and 3 rd shifts. These values are entered by the user. It is the length of time per shift. Values can only be changed for events that have not occurred yet. For example, if the length of a shift needs to be reduced from 8 hours to 7 hours, this can be changed as long as 7 hours have not already elapsed on the shift (i.e. at 8:30pm the supervisor can reduce the second shift length from 8 hours to 7 hours, but the cannot be done at 9:30pm because the shift has already lasted for longer than 7 hours). C SECOND SHIFT PAUSE If a non-production period occurs at a beginning of 2 nd or 3 rd shift, the user has an option to pre-schedule a stop and start time in the LIS production time. This is normally done in advance of the anticipated break period. Note that the break or pause period is pre-scheduled only for later in the current day. These break or pause periods are available at the beginning of the 2 nd shift and/or 3 rd shift. Note that it is not possible to schedule a pause longer than its corresponding shift length. D TIME STARTED This records when the shift and pause actually started for today. This information is status only. This information is updated only after it has occurred. E SYSTEM STARTED (SYSTEM STATUS) This displays the current status of the LIS. Status can either be in SYSTEM RUN, SYSTEM STOPPED, or SYSTEM IN PAUSE. F END DATA COLLECTION This push-button allows the user to end the LIS collection before the scheduled stop time. Once this feature has been activated, the LIS will not start until the next scheduled start time (typically the next day). G PRE-START The user has an option to capture case counts before scheduled production time. This is a manual push-button that can be activated before the LIS production time begins. Once activated, case counts (if any) during the time PRE-START was pushed and the beginning of the LIS production time (beginning of first shift) will be included within the first hour and first shift of the LIS production start time. 9 H TOMORROW S SUPERVISOR This is a navigation button that allows the user to arrange the schedule for the next day. These values are copied into today s supervisor screen one minute before the start of the new day. If the new start time for tomorrow is changed to an earlier time, such as when the current day still is running, the current day will be truncated to allow the new start-up time for the next day. An example of this page is shown in the following page:

11 10 The above example illustrates a schedule for tomorrow. These values will be placed in today s supervisor screen one minute before start-up. In the above example, first shift begins at 6:00 AM and will run for 8 hours. Second shift begins at 2:00 PM and runs for 8 hours. At 10:00 PM, the third shift starts and runs for 6 hours.
 the user can input this event simply by pushing the button that corresponds to this event. Note that the filler must be stopped to log this event.")
12 11 C A D B PLANNED DOWN TIME When an event occurs such as one that is listed on this page (flavor change, package change, quality control, sanitation, etc.) the user can input this event simply by pushing the button that corresponds to this event. Note that the filler must be stopped to log this event. The event will stop automatically after the filler starts to run for at least one minute. A B C D These are manual inputs activated by the user. Note that the filler cannot be in run mode to activate planned downtime. Once the planned downtime has been activated, it will automatically deactivate once the filler is running consistently for one minute. This is also a manual input activated by the user. However the MEETINGS push button does not count as planned downtime like the other items (Flavor Change, Package Change, Quality Control, or Sanitation). When Meetings is activated, the production time stops. As with Planned Downtime, the filler cannot be in run mode to activate Meetings. Once Meetings has been activated, it will automatically deactivate once the filler is running consistently for one minute. Once the Planned Downtime, Meetings, etc. has been activated, the Frequency increments. This will reset to 0 at the beginning of the day. Once the Planned Downtime or Meetings has been activated, a timer starts and logs in the Duration. Units are in minutes and will reset to 0 at the beginning of the new day.
 o Logic inside the packer itself sending a bit to LIS indicating that the operator has taken the packer out of")
 and there would be cans at the infeed of the Mead (the Mead")
 the Mead packer would")
13 12 Features about Packers that are Offline (not in use or out of service) o Production Pause PB to take the packer out of service (can be activated only when the machine is not running) o Logic inside the packer itself sending a bit to LIS indicating that the operator has taken the packer out of service At times a plant may choose to run one packer over another. For example the plant may want to run the Hi- Cone/Kister packer over the Mead. In this case the Mead packer would not be backed up (assuming the palletizers are running) and there would be cans at the infeed of the Mead (the Mead would not be in lack). In this example the Mead would be flashing RED and efficiency of the Mead would start to decrease. If the filler were to stop because of a backup, when the logic looks out at the full side, the system finds that (in this case) the Mead packer would be penalized for the filler stopping.

14 13 Choose Config DT Reasons to navigate to Add New Reason to Database screen.

15 14 Adding a New Downtime Reason Downtime Reasons 1. Choose the Mchine Center to which you want to add a reason. 2. Select Add Reason 3. Type in the name of the new downtime reason 4. Type in a Reason Code for the new reason. This number must be larger than Click Add New Downtime Reason Remove a Downtime Reason 1. Choose the equipment from which you want to delete a downtime reason. 2. Select Delete Reason 3. Click the name of the reason from the menu on the right. 4. Type in the correct Reason Code. By default, the reason code will be incorrect, and you will not be able to remove the downtime reason without correcting the code. This is to prevent accidental deletion. Click Delete Downtime Reason Clarification: 1. The machine status display on the Trend is automatic and fix (from the PLC) and their name cannot be changed; the assumption is that the automatic reasons are the most common reason. 2. The operator can choose from a drop-down menu the manual reasons from the machine center downtime and all the manual reasons fall under the Additional DT (reason number bigger than 15). 3. If the PLC program cannot detect an automatic reason (example Pattern Fault), the operation / supervisor can create a manual reason with the reason name Pattern Fault and reason number 9.

16 15 Equipment The equipment is defined as a component of the Machine Center. Example: the Filler is the Machine Center and the Rinser and Capper are equipment. The equipment will be defined for each Plant and Machine Center by the ROEL / SOEL. Adding and deleting Equipment works the same way as managing downtime reasons.

17 16 Changing the Current Flavor Flavors When the flavor being run on the line is switched, the change must be manually recorded in the LIS system. To do this, enter the code for the new flavor in the Current UnitID box and press Enter, Adding or Deleting Flavors To add a flavor, check Add Flavor. Type in the name of the new flavor and give it a code ( UnitID ). Click Add New Item. To remove a flavor, check Delete Flavor. Select the flavor you want to remove from the menu and enter the correct UnitID. Then click Delete Item.
18 17 Primary Packs This screen will only be used by the control engineers. The LIS system will automatically detect the Primary Pack that is currently being run. To see which pack is currently running, check the Current UnitID and match it with the corresponding pack. Adding and Deleting Primary Packs should only be done by the controls engineers. The UnitID box is for information only and is read only.
19 18 Secondary Packaging Managing Secondary Packaging works the same way as managing flavors. When new secondary packages are run, the UnitID must be manually entered.

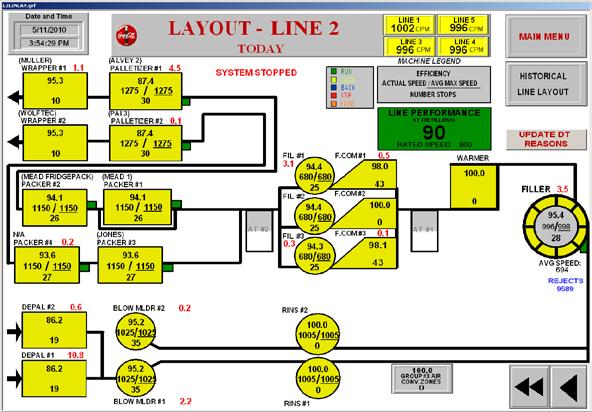
20 19 This is the layout of all of the machines on the line. To enter the TPM Interface, click TPM Interface.
21 20 A C B D E TPM Interface This page is used to manage downtime events recorded by the LIS system. Features of this page: A: Event Listing A list of events that can be chosen to manage. These events are automatically recorded by LIS when a machine goes down for internal reasons (i.e. there is no lack or backup, but the machine is not running). A machine can stop for internal reasons without necessarily stopping the filler. B: Event Search Search for events. There are three types of events: Minor Stop - When a machine stops for less than 10 minutes. Equipment Breakdown - When a machine stops for more than 10 minutes. Process Stop - When a machine stops for more than 10 minutes but it is not a Breakdown (explained in more detail further on). C: Machine Center Section Record information about downtime events as soon as possible. The machine center is the overall machine that failed, and the equipment is the specific part. For example, the Filler machine center has equipment like the rinser, capper, filler, etc. D: Root Cause Section This section is used for Breakdowns and Process Events, and must be completed by the end of the day. E: Sustaining Actions Section This section is used for Breakdowns and Process Events, and is completed on a case-by-case basis.
22 21 1d 1c 1a &1b Managing Downtime Events 1. Event Search a. Enter the desired Start Date, Start Time, End Date and End Time. This is the time period for which downtime events will be displayed. b. Click Get Events c. Choose the type of event that you are looking for (All Events, Minor Stops, Equipment Break Downs, etc.). d. The list of events in the upper data grid will filter to show only the type of events selected.
23 22 2b 2. Event Selection. a. Out of the list of events that appears, choose the event that you want to manage. b. If the event is classified as a Equipment Breakdown (meaning it lasted for at least 10 minutes), the fields at the bottom and the right side will appear and must be filled out. c. If the event is classified as a Minor Stop (it lasted less than 10 minutes), the fields will not appear because additional data is not required. d. If the event is an Equipment Breakdown, enter in the correct information by completing the next steps. Note: After filling in any information in a field, click the blue Update button below the box. The text color of the name of the category will change from red to black, indicating that the information has been submitted.
24 23 3a 3. Breakdowns: Machine Center a. The Machine Center section on the right must be filled out for Equipment Breakdowns. It should be filled out by an operator no later than the end of the shift. b. The machine center that failed will be automatically selected. c. Choose the Equipment on the machine that caused the failure (if applicable, see note) d. Choose a Reason for the Machine Center that failed (a Reason must be selected, and cannot be left as Internal Fault ) e. You can also enter any comments about the failure. Comments are optional.
25 24 4a 4. Breakdowns: Root Cause a. The Root Cause section must be filled out for Equipment Breakdowns. It should be filled out by a supervisor by the end of each day. b. Choose a Failure Factor and leave any comments about actions taken. Comments are optional.
26 25 5a 5. Equipment Breakdowns: Sustaining Actions a. The Sustaining Actions section only needs to be completed on a case-by-case basis. b. In the Sustaining Actions section, chose a Failure Prevention method.
27 26 6a 6. Breakdowns: Failure Prevention Status a. In the Sustaining Actions, chose a Failure Prevention status.

28 27 7a 7. Breakdowns: Re-Application Status a. In the Sustaining Actions section, chose a Re-Application Status.
29 28 8a 8. Equipment Breakdowns a. In the Root Cause and Sustaining Actions sections, enter comments and actions taken. All comments are optional fields.
30 29 9b 9. Equipment Breakdowns: Process Stop a. Some Equipment Breakdowns will actually be Process Stops (see note) b. If a Process Event has occurred, click the pink Convert to Process Event button and fill in all required information. c. You will be prompted to make sure that this is a Process Stop. d. When Process Stops occur, they must be entered by a supervisor by the end of the day. Note: Process Stops are incidents when a machine goes down for more than 10 minutes but is not a Equipment Breakdown. These are usually the result of outside circumstances. For example, human error, a lack of raw materials, quality issues, and other external influences could all cause Process Events. These events are automatically recorded in the system as Equipment Break Downs, so when a Process Stop occurs, it is necessary to manually convert the Equipment Breakdown to a Process Stop for the record.
31 30 10a 10. Process Stops Only: Searching a. After a Equipment Break Down has been converted to a Process Stop, it will disappear from the list at the top of the screen. b. Change the search parameter checkbox to Process Stop to find the event. c. Click Get Events d. Click on the Process Stop to select it.

32 Minor Stops a. When a Minor Stop is selected, the fields and sections at the bottom and right side of the page do not appear. b. There is no information that needs to be filled in for these events. Note: There may be special initiatives where the form on the right side of the screen will appear. In these situations, information about Minor Stops will be collected. However, these will be special circumstances and not the norm.
33 32 12a 12. Unassigned Events: a. Note the red Unassigned label as a search option. b. Searching Unassigned events will bring up a list of Equipment Break Down events that have not been completed. c. The necessary information about Equipment Break Downs must be entered for them to be completed, or they will show up as Unassigned. Remember that comments are optional.
34 33 Module 2: USLE

35 34 USLE (Unconstrained System Line Efficiency) (%) USLE is a comparison of Optimum Process Time to Actual Production Line Time Optimum Process Time = Time it takes to produced sellable actual number of cases without any constraints Production Line Time = When A Production Crew Is Paid To Man a Line. Including Planned lost time (Flavor Change, Package Change, etc.) or Unplanned lost time, Minor stop or speed lost (less Skeleton Crew). *Skeleton crews can be used to conduct cleaning, syrup prep, etc. and this does not reflect upon the USLE. Skeleton crew must be 25% of the normal production crew. ** Is lunch time or meeting time during production counted or not? - If line is down and lunch is not paid out - If plant wide meeting (i.e., quarterly town halls, monthly plant reviews, etc) out. - All else is in.
 = Total number of cases being produced during production time X 100 Total number of cases produced if the filler ran consistently at its rated speed during today s")
36 35 Example: USLE is also a comparison of the actual number of cases produced during production line time, to the theoretical number of cases that could have been produced without any constraints. USLE is defined by: USLE (%) = Total number of cases being produced during production time X 100 Total number of cases produced if the filler ran consistently at its rated speed during today s production time without any rejects USLE values displayed range from 0-120%. A USLE value greater than 100% is possible if the filler has been running faster than the rated speed. Cases produced during pre-start could also result in USLE being greater than 100%.

37 36 In the morning you can take a look at the USLE yesterday (per shift and for the day)

38 37 USLE High and Low limits This is among the most popular screens. It is displaying hourly KPIs such as: - USLE - Line & Planned Downtime - Filler Average Maximum Speed - Cases produced

39 38 USLE for the month will display: - USLE per day - USLE average for the month - Number of days of production

40 39 USLE for the year will display: - USLE per month - USLE average for the year

41 40 USLE Trends The trends detail 1 st shift, 2 nd shift, 3 rd shift and the USLE for the day. Points are plotted hourly. These trends enable the user to look back to see how the line preformed for a particular shift or for the day. Each graph line will show a 1, 2, 3, or D defining 1 st shift 2 nd shift 3 rd shift USLE for the day The graph is defaulted to a 2 hour period. By using the arrows at the bottom of the graph you can scroll forward and back. You can also double click on the trend and choose a different time frame (for example, 16 hrs instead of 2hrs). There are many other parameters that can be changed in the Chart Configuration dialog box.

42 41 Choose the interval to display a table with Per Day, Shift, First Hour and Average USLE.

43 42 This is a standard screen across Coca Cola System and shows USLE Waterfall and various components that influence the USLE. USLE (Optimum Time) = (Production Time Planned DT Break Downs Minor Stops Speed Lost Rejects Lost)
44 43 Module 3: Cases, Containers and Rejects Counters

45 44 This represents the total number of cases or packs for today s production time, shift and current hour. Cases are usually counted at the Filler (with an option for the infeed of the palletizer(s)). Note that a case is defined as 24 containers and a pack can be any number of containers. For example 1 case = 4 packs of 6 containers. You can see in the morning the number of cases produced for the day and by shift.

 - Red = more than 3%")
46 45 Actual= number of cases produced during a particular hour Expected = number of cases produced during a particular hour if the line runs at expected USLE Are We Winning? Cumulative Cases Produced vs. Expected Status represents a color code for how well the line performs in a particular hour (USLE): - Green = above expectation - Yellow = just below expectations (no more than 3% below expectations) - Red = more than 3% below expectations

47 46 This trend is the same as the Counts by Hour bar graph. The advantage is that one can scroll back using the arrows at the bottom of the trend to see yesterday, last week or last month. As with the USLE trend the time scale can be altered to something other than 1 day.
 Filler Disch.")

48 47 Filler Counts Error = Shows the difference between the containers counted by the two sensors at the filler discharge (for the can line there is only one sensor and the Counts Error will be zero) Filler Disch. Palletizer = Difference in containers between Filler and Palletizer Last 10 Min % Rejects Limit = Set up the High Limit for the Last 10 Min % Rejects Last 10 Min % Rejects = Rolling Average for the last 10 Min % Rejects Reset = Will reset the temporary rejects counter The trend will display the hourly average % reject.

49 48 In this screen we can see the type and number of packs produced today. Note that a case is defined as 24 containers and a pack can be any number of containers. For example 1 case = 4 packs of 6 containers.
50 49 Module 4: Machine Centers and Equipment
51 50 E D A B C F LAYOUT TODAY This page gives an overview of the line with the machines that the LIS is monitoring. Each machine has a color code to give its status in real time. A The top number represents the machine efficiency. This is defined as: Availability (MIN) Down Time (MIN) X 100 Availability (MIN) Availability and Down Time are defined below.
52 51 B Average Max Speed (CPM) This is the average maximum speed; this does not include low or stopped speeds. The speed the machine ran at when all conditions up and down stream let the machine run at maximum speed. Example: the rated speed of the machine is 1000 containers / minute (CPM) and in the last hour went through following events: - was stopped for 15 minutes - ran in low speed (500 CPM) for 15 minutes - ran at 1000 CPM for 15 minutes - ran at 900 CPM for 15 minutes The Average Maximum Speed is 950 CPM in the last one hour (we are excluding from the average maximum speed calculation the speed values below the high speed threshold). C D E F Frequency Down This number located at the bottom of each machine represents the number of times the machine stopped for internal reasons. This is a cumulative count for today s production time. Historical Line Layout This allows the user to view the data for a selected time period. The past 2 hours is default. These are navigation buttons for other lines. Note that they also indicate real time actual filler speed and real time filler status. Red numbers above machines indicate the percentage of time that the line was down because of that machine. For example, the Depalletizer was down from internal reasons 12.8% of the time ( = 87.2%, the machine efficiency). However, it is only penalized for 8.2%, because that is the only part of the time that caused the line to stop. Example (using the Line Layout screen): - By looking at the red numbers above machines (and less at the efficiency of the machine) one can determine which machine is dragging down the USLE. - Efficiency of the filler will have a direct impact on the USLE; however, efficiencies of other production machines will have less of an impact on USLE. Suppose the Depalletizer #1 efficiency is 87.2% and the average maximum speed is 15% above the filler speed. Because of the accumulation and the average maximum speed, the depalletizer cause only 8.2% drop of the USLE (and the Depalletizer #1 was stopped for internal reasons 12.8% of the time). - Normally the filler efficiency will be greater than USLE (except when the filler runs above the rated speed). - The sum of the red numbers (from all the machines) is 23.5 %; this is telling us that the machines caused a 23.5% drop of the USLE. The remaining 10.5% ( ) was caused by line / filler speed, Planned Downtime and Rejects.
 Down Time (MIN) X 100 Availability (MIN) B Average Max Speed (BPM) This is the average production speed; this does not include low or stopped speeds.")
53 52 Machine Efficiency A B D E C F G This screen is available for any machine that is chosen from the Line Layout Page the Filler is used here as an example. A Efficiency Formula = Availability (MIN) Down Time (MIN) X 100 Availability (MIN) B Average Max Speed (BPM) This is the average production speed; this does not include low or stopped speeds. The speed the machine ran at when all conditions up and down stream let the machine run in its production speed. C Availability (MIN)
54 53 This is the time in minutes that the machine was available to run was primed (not lacking bottles) and the machine was not backed up. D Down Time (MIN) Time the machine was down for any reason Internal Reason ie. Jam, no shells, operator pushed the stop button, out of film. This excludes lack of bottles or the machine being backed up. In these cases the machine was not able to run due to up or down stream conditions. E Frequency Down The number of times the machine went down for Internal Reason ie. Jam, no shells, operator pushed the stop button, out of film. F MTBF (MIN) - Mean Time between Failures (Minutes) This is the average run time between failures. A failure is a instance were the machine stopped due to internal reasons. This excludes lack of bottles and the machine being backed up. Formula = Availability (MIN) Down Time (MIN) Frequency Down The higher the number the better the machine ran. The lower the number the more attention was needed for this machine. The closer the MTBF (MIN) is to AVAILABILITY (MIN) the better the machine ran. G MTTR (MIN) - Mean Time To Repair (Minutes) This is the average time to repair. A failure is a instance when the machine is stopped due to internal reasons. This excludes lack of bottles and the machine being backed up. Formula = Down Time (MIN) Frequency Down


55 54 The Historical Data screens display the same parameters as the Today screen.


56 55 Machine Efficiency by Hour Trend The Machine Efficiency Trend can help the Continuous Improvement initiatives. Filler was stopped because of an Internal Fault How to Display a Stop description? - Overlap the Red Vertical Line and any Stop event and hit the Event Description Push Button.

57 56 Adjust Trend Duration Will display: - Real time speed - Average Max Speed - Reason for Machine Stop This screen displays the Average Maximum Speed and the Real Time Machine Speed. Also shows the machine status (blue if backup, yellow if lack and Red if stopped for internal reasons).

58 57 HISTO MACHINE STATUS This screen allows the user to view all the line s machine status simultaneously. This trending page captures a machine s run, lack, backup, and internal downtime status displayed in blue color. These trending lines have four levels. They are: 1) Running 2) Stopped because of a lack 3) Stopped because of a backup 4) Stopped internally (machine stop, jam, e-stop, etc.) Sometimes a particular machine will be down for internal reasons long enough to cause the filler to stop. This data will be displayed in a red trending line.
59 58 The previous page illustrates three examples: 1) Sometimes before 2:58 PM the depalletizer was down for internal reasons. This is indicated by the red section of depalletizer trending line. After a short time, at approximately 3:00 PM the depalletizer caused the filler to stop due to lack of bottles. This is shown by the red bar above the depalletizer trending line. Also, the yellow filler trending line shows a lack of bottles during this time. A short time later, this down event at the depalletizer caused machines at the full side to stop due to lack of bottles. This is indicated by the height of each machine s yellow trending line. 2) Beginning at 2:18 PM Wrapper #1 was down for internal reasons. This lasted for a few minutes. Note the red section of Wrapper_1 trending line. A short time after the Wrapper stopped, palletizer #1 and palletizer #2 stopped because of a backup caused by the wrapper. Note the blue sections of these machine s trending lines. Also, shown in this example is that the wrapper was down long enough to stop the filler, thus, there is a red bar above the wrapper trending line. 3) Beginning at approximately 3:20 PM, Filtec #1 stopped for internal reasons. This lasted for approximately 5 minutes. Note the red section of Filtec_1 trending line. During this time Filtec #1 caused a backup at the filler (red bar above Filtec_1 trending line) as well as at the Blow Molders and Depalletizers. Also, note that the Filtec #1 downtime caused lack signals for the machines downstream. Note that this page has a viewing trending range for the past two hours (by Default). It is possible to change this by performing the following steps: 1) Choose the Start Date & Time 2) Select the Interval from a drop down menu 3) Navigate using the Arrows Machine Penalize Logic Machines are charged with stopping the filler based on what condition the filler is in, when that machine is stopped, and if there are other machines stopped at the same time. Condition the Filler is in: If the filler is lacking containers at the infeed, the logic looks at the conditions of the machines that send containers to the filler. Examples: depals and blow molders. If the filler is backed up, the logic looks only at the machines downstream from the filler. Examples are the Filtecs, packers, and palletizers. One Machine Stopped: If only one machine is stopped on the side of the filler that is being examined, that machine will be penalized. The machine will continue to be penalized until the filler restarts. One exception to this is that if that machine restarts and another machine stops, the second machine will start to be penalized. If no machine is down at the time that the filler goes into lack or backup, the machine that stopped within five minutes of the filler stopping is penalized. For example, the labeler may stop and back up the line.
60 But, just before the filler is backed up, the labeler restarts. In this case, the labeler caused the filler to stop even though it recovered before the filler actually stopped. Two Machines Stopped: If more than one machine is stopped on the side of the filler that is being examined, the machine that stopped first will be penalized. That machine will be penalized until either the filler restarts or that machine recovers and a second machine is down. 59
61 60 Module 5: Loss Analysis and The Six Big Losses
62 61 Background Total Productive Maintenance (TPM) was first defined in 1971 by the Japan Institute of Plant Maintenance. TPM is a companywide strategy to increase the effectiveness of production environments, especially through methods for increasing the effectiveness of equipment. TPM aids in identifying equipment-related losses and through continuous improvements methods to reduce losses. A key strategy in TPM is identifying and reducing what we call the six big losses. Looking at the bottleneck machine (filler), we identify six types of waste we refer to as losses, because they reflect lost effectiveness of the equipment. The six big losses reflect lost effectiveness of the equipment. These losses are categorized into three groups: downtime, speed losses, and quality losses. Downtime Breakdowns the amount of time lost at the bottleneck machine due to stops greater than 10 minutes (adjustable) on any machine. The assumption is that the events greater than 10 minutes are caused by a component failure. Minor stops the amount of time lost at the bottleneck machine due to stops less than 10 minutes on any machine. The assumption is that the events less than 10 minutes are caused by an adjustment or a jam. Planned downtime the amount of time lost at the bottleneck machine due to the flavor change, package change, sanitation, etc. Speed losses - is the amount of time lost due to the bottleneck machine running below its rated speed. Quality losses Quality loss in process - is a loss of product during a production run where output is below the acceptable specification (example: low filled bottle). Quality loss on startup - is referring to the period after changeover, when settings need final adjustment to bring the product into specifications. The six big losses analysis provides actionable information or an improvement tool for each loss category. For example: Breakdowns Can be reduced through preventative maintenance. Minor Stops Use line audit to determine the cause of the minor stops and take proper action to address the issues. Speed Loss Audit why the maximum average speed of the filler is below its rated speed. For example, the operator reduced the speed of the filler for a certain flavor because of foaming issues. Planned Downtime Audit the Flavor Change, Package Change, or sanitation period to determine if there can be a reduction on Planned Downtime. Quality Loss in Process Audit the results and cause. Determine a plan to reduce rejects (example: poorly fitted caps are detected and requires maintenance work on the capper)
.")
63 62 A B C H D G E J F I LOSS ANALYSIS TODAY All the data for this page represents production time. This time is defined as the current day that begins with what was programmed into the SUPERVISOR PAGE minus any time set aside for meetings or Not Required For Production (NRFP). A LINE CASES LOST This number represents the number of cases that were not produced (lost opportunity) because the line didn t run at 100% USLE. The higher is the USLE the lower is the Line Cases Lost. Note that this number can be negative. For this situation, the filler was running faster than the rated speed.
64 63 B LINE TIME LOST (%) This number represents the % time lost (the line did not produce) during today s production time. For example, if the time lost was 32.7% and the line was running for 10 hours today, there would be a loss of 3.27 hours of production time with the filler running constantly at its rated speed. Note that this number can be negative. For this situation, the filler was running faster than the rated speed and time was gained. The formula for time lost is simply the sum of losses from breakdowns, minor stops, planned downtime, speed loss and rejects. C LINE REAKDOWN LOSS (%) This number represents the filler stoppage being caused by a machine on the line (including the filler) during today s production time. This can be more than one machine and also can be multiple stoppages. However, a machine must stop long enough to cause the filler to stop in either backup or lack condition and maintain this condition for at least 10 consecutive minutes to begin the breakdown loss. Note that the filler itself can cause breakdown loss providing that the filler stops for more than 10 consecutive minutes. This formula is represented as: Breakdown (%) = 100* Filler Down Time for Today s Production Time Today s Production Time The above filler downtime includes filler down for lack of cans/bottles, internal reasons, and backups that are not considered minor stops. D LINE SPEED LOSS (%) & LINE BALANCE This is the amount of time lost during today s production time, due to the critical machine (normally filler) running below its rated speed. Note that in the above example that the number is positive, suggesting that the filler has been running below its rated speed. The speed loss formula can be represented as: 100* Bottle Output for 100* Bottle Output for Today s Production Time Today s Production Time Speed Loss (%) = - Filler Maximum Average Speed Filler Rated Speed * * Today s Production Time Today s Production Time
65 64 E PLANNED DOWNTIME (%) This is the period of time for today when the user acknowledges a planned downtime and the filler runs for one consecutive minute. Planned downtime can consist of one or more of the following: flavor change, package change, quality control, or sanitation. The formula can be represented as: Total Planned Downtime for Today s Production Time Planned Downtime (%) = 100 * Today s Production Time F FILLER REJECTS (%) This is a loss of product at the filler during production run where output is below the acceptable specification, i.e. a low filled bottle, poorly fitted cap, etc. Note that the rejects is only measured at the filler area. Also, this data does not include rejects that can be reworked such as poorly fitted labels. The formula can be represented as: Filler Rejects (%) = 100 * Number of Rejected Bottles/Cans from Filler during Today s Production Time Number of Bottles/Cans Produced During Production Time + Number of Rejected Bottles/Cans from Filler during Today s Production Time Note that to measure this filler reject data, two bottle counters are required by LIS. On counter is at the filler infeed and the other is at the discharge of the bottle rejecter. G LINE MINOR STOPS (%) This number represents the filler stoppage being caused by a machine on the line (including the filler) during today s production time for less than 10 minutes. This can be more than one machine and also can be multiple stoppages. Also, note that the formula below includes losses that are not allocated with other losses: Minor Stops (%) = 100* Filler Down Time for Today s Production Time Today s Production Time I UNKNOWN (%) Unknown (%) = Output Loss - Breakdowns - Planned Downtime - Speed Loss Reject Loss Minor Stops
66 Output Loss is defined as the actual number of bottles produced during today s production time divided by the number of bottles produced if the filler ran at its rated speed without interruptions during today s production time. Actual Number of Bottles/Cans Produced Output Loss (%) = 100 * Navigation: H During Today s Production Time SPEED LOSS/LINE BALANCE BREAKDOWN & MINOR STOPS Number of Bottles/Cans Produced If the Filler Ran Consistently at its Rated Speed During Today s Production Time By pressing either of these buttons will allow the user to navigate to another page for detailed machine information regarding these losses 65 H PLANNED DOWNTIME By pressing this button the user will navigate to another page to get detailed information as to what type of planned downtime (if any) has occurred. J HISTORICAL DATA This allows the user to view the data for a selected time period. The default time period is the past 2 hours.
67 66 Numeric Example of the Six Big Losses: Suppose the line ran for two hours since startup and that the data is shown as in the LOSS ANALYSIS CAN #1 page shown previously. Also, suppose that the filler rated speed is 900 cans per minute (cpm) and that the actual number of cans produced in these 6 hours and 40 minutes was 242,181 cans. During this time, suppose that the average maximum speed (average speed excluding stops and low speeds) of the filler was 865 cpm. The rated output is the filler rated speed * time or 900 * 400 = 360,000 cans Thus, the output is 242,181 / 360,000 = % - According to the formula, the speed loss is: 100 * [242,181 / (865 * 400) 242,181 / (900 * 400)] =2.77% The positive value represents speed lost, because the filler ran below its rated speed during this time interval. - Suppose that during this time interval, several machines caused the line / filler to stop for more than 10 minutes at one time. Suppose that the total line / filler stop for Breakdowns was 85 minutes. The Breakdown Loss is: 100 * 85 / 400 = % - If there was no planned downtime during this time, then according to the formula, Planned Downtime Loss is: 100 * 0 / 400 = 0% - Suppose that the filler was foaming and 4282 cans were rejected. According to the formula, Reject Loss = 100 * 4,282 / (360, ,282) = 1.175% - Suppose that during this time interval, several machines caused the line / filler to stop for less than 10 minutes at one time. Suppose that the total line / filler stop for Minor Stops was 27 minutes. The Minor Stop Loss is: 100 * 26.8 / 400 = 6.7 %

68 67 This screen displays the Loss Analysis from an historical perspective. We can chose the Start Date & Time and the Interval and all the Parameters in the screen (Speed Loss, Planned Downtime, etc.) will reflect the Date & Time choice.


69 The next two screens show the classical Speed V-Graph for Today and Historical. In this example the average maximum speed of the E. Combiner is too low (just 5.5% higher than the Filler Rated Speed). With yellow we show the rated speed of the machines (or group of machines). 68


70 The next two screens show the Breakdowns & Minor Stops for Today and Historical. From this screens we understand how the machines are penalized for stopping the line / filler. Example: the Depalletizer cause the line to be down 9.9% of the Production Time (equivalent to 9.9% USLE drop) 69

71 70 The next two screens show the a Summary of the Machines Downtime for Today and Historical.
 we eliminate 76% of the reasons for the Line")
72 71 In concept Pareto Chart allows us to focus the attention on the few activities (20%) that matter and take care of 80% of the reasons for the Line Downtime. Example: if we address the issues related to three machines: Depalletizer, Filler and Palletizer (23% of the machines) we eliminate 76% of the reasons for the Line Downtime.

73 72 The Minor Stops Trend by Hour displays the % of Line Minor Stops for the last hour. The Chart is showing the % Line Minor Stops per hour trend and is helpful for Continuous Improvement initiatives focused on reducing the Line Minor Stops.


74 73 The next two screens show the Planned Downtime for Today and Historical; in Just In Time (JIT) approach, the Planned Downtime is becoming a significant part of the total line downtime. It will become increasingly important to find ways to reduce the Planned Downtime in order to maintain / increase the USLE. You can only improve what you can measure, so expect Planned Downtime statistical tools to be added to LIS.
 it will be displayed the following: - Minimum, Maximum and Average duration (in Minutes) - Deviation from the Target (in Minutes) - Total duration and Frequency The objectives are to reduce the")
75 74 This screen will allow us to have a statistical view of the Flavor chances from a historical perspective (we can choose the interval). For each Flavor Chance category (Step 1, Step 3 Cold, etc.) it will be displayed the following: - Minimum, Maximum and Average duration (in Minutes) - Deviation from the Target (in Minutes) - Total duration and Frequency The objectives are to reduce the target and variation among Target, Min and Max.

76 75 The Planned Downtime trend will allow to see the Planned Down from a historical perspective; we can choose the Start Date and Time and the interval and after that navigate using the Arrows. Example: between 2:17 pm and 2:39 pm we had a Three Steps Cold.
77 76 The Theory of Constraints Trend will display the Machine which was the main reason for the Line Downtime (for each day).

78 77 This screen is used for Today s Flavors and the information on this screen will be reset at the beginning of a new production day. To advance to a new Flavor, hit the Flavor Change PB on the Planned Downtime screen or hit the Begin Next Flavor Count on this screen. Until the next LIS upgrade, the Flavor description needs to be enter on this screen; after the upgrade the Flavor description will be entered automatically (the same description as in Add New Flavor Description to Database screen)
79 78 Module 6: Portal Reports Main Menu Reports (Welcome Screen) Fix (Drop-down List) Line_X_TPM1 Line_X_TPM2 Line_X_TPM2 Downtime Line_X_TPM2 Equipment


80 79 Process Steps to the Report Screen
 of the line down time was caused by Labeler #1 - Palletizer #1 was the number three cause for the line downtime; 16% (or 23 minutes) of the line")
 - Internal Faults (Micro Stops) were the number one reason for the Depalletizer #1 stop (12.")
81 80 Historical Machine DT Pareto: - Depalletizer #1 was the number one cause for the line downtime; 40% (or 58 minutes) of the line down time was caused by Depalletizer #1 - Labeler #1 was the number two cause for the line downtime; 18% (or 26 minutes) of the line down time was caused by Labeler #1 - Palletizer #1 was the number three cause for the line downtime; 16% (or 23 minutes) of the line down time was caused by Palletizer #1 - If we focus our attention on the three machines (Depalletizer #1, Labeller #1 and Palletizer #1) which cause 74% of the line downtime. Historical DT Reasons Pareto (Depalletizer #1) - Internal Faults (Micro Stops) were the number one reason for the Depalletizer #1 stop (12.5 minutes or 41% of the total stops) - Clipboard Backup was the number two reason for the Depalletizer #1 stop (6.1 minutes or 19% of the total stops)

82 81 1e 1c 1b 1d 1. Viewing Event Information: a. Events that have been completed can be searched and viewed on this page. b. Searches can be narrowed down by Machine, Flavor, Primary Package, Shift, and Event Type. c. A list of events that match the search criteria will appear. d. Selecting one of these events will bring up the information about that event in the fields at the bottom of the screen. e. To remove the file tree on the left of the screen and make the page full-screen, click this button.

83 82 2b 2c 2d 2e 2. Machine Downtime and Stop Information: a. This screen shows Pareto charts with downtime information and stop frequency for each machine on a line. b. The time period can be adjusted at the top of the screen. c. The large chart on the left shows the 10 machines on the line with the most downtime or stops. d. The first smaller chart always shows the machine with the most downtime. e. Any machine can be chosen for display on the other two charts. Note: The charts show Machine Downtime, not Line Downtime. Machine Downtime shows how long a specific machine stopped during production. Line downtime shows how long the filler stopped during production. All machine downtime does not result in Line Downtime.

84 83 3. Larger Pareto Charts: a. This screen displays the same data as the previous charts.
85 84 4. Exporting Data to Excel a. The data from the Pareto charts can be exported to an Excel document. b. Right-click on the chart. c. Choose Export Data to d. Choose Excel

86 85 5. Exporting Event List Data a. The list of events at the top of the screen can be exported to a CSV. b. Right-click on the grid. c. Choose Export Grid Data d. Choose a file name and save.

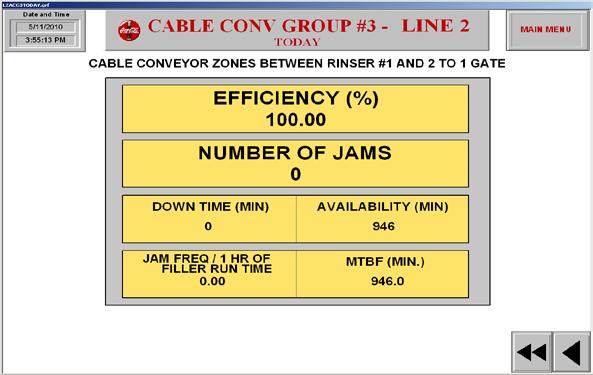
87 86 Appendices: Air Conveyors Jam Screen
PulseCounter Neutron & Gamma Spectrometry Software Manual
 PulseCounter Neutron & Gamma Spectrometry Software Manual MAXIMUS ENERGY CORPORATION Written by Dr. Max I. Fomitchev-Zamilov Web: maximus.energy TABLE OF CONTENTS 0. GENERAL INFORMATION 1. DEFAULT SCREEN
OPERATION MANUAL OF MULTIHEAD WEIGHER
 OPERATION MANUAL OF MULTIHEAD WEIGHER Page 1 of 62 PREFACE Multihead weigher is automatic weighing equipment by using MCU control system to achieve high speed, accuracy and stable performance. Different
Managing Outage Details
 CHAPTER 17 Outages or downtime refers to the time span when the network fails to provide its primary function. This chapter explains how you can create, edit, and delete planned outage. The feature provides
ORM0022 EHPC210 Universal Controller Operation Manual Revision 1. EHPC210 Universal Controller. Operation Manual
 ORM0022 EHPC210 Universal Controller Operation Manual Revision 1 EHPC210 Universal Controller Operation Manual Associated Documentation... 4 Electrical Interface... 4 Power Supply... 4 Solenoid Outputs...
Eagle Business Software
 Rental Table of Contents Introduction... 1 Technical Support... 1 Overview... 2 Getting Started... 5 Inventory Folders for Rental Items... 5 Rental Service Folders... 5 Equipment Inventory Folders...
Cisco Spectrum Expert Software Overview
 CHAPTER 5 If your computer has an 802.11 interface, it should be enabled in order to detect Wi-Fi devices. If you are connected to an AP or ad-hoc network through the 802.11 interface, you will occasionally
Table of Contents. iii
 Rental Table of Contents Introduction... 1 Technical Support... 1 Overview... 2 Getting Started... 3 Inventory Folders for Rental Items... 3 Rental Service Folders... 3 Equipment Inventory Folders...
Printed Documentation
 Printed Documentation Table of Contents INTRODUCTION... 1 Technical Support... 1 Overview... 2 GETTING STARTED... 3 Inventory Folders for Rental Items... 3 Rental Service Folders... 4 Equipment Inventory
PYROPTIX TM IMAGE PROCESSING SOFTWARE
 Innovative Technologies for Maximum Efficiency PYROPTIX TM IMAGE PROCESSING SOFTWARE V1.0 SOFTWARE GUIDE 2017 Enertechnix Inc. PyrOptix Image Processing Software v1.0 Section Index 1. Software Overview...
VISSIM Tutorial. Starting VISSIM and Opening a File CE 474 8/31/06
 VISSIM Tutorial Starting VISSIM and Opening a File Click on the Windows START button, go to the All Programs menu and find the PTV_Vision directory. Start VISSIM by selecting the executable file. The following
welcome to i-guide 09ROVI1204 User i-guide Manual R16.indd 3
 welcome to i-guide Introducing the interactive program guide from Rovi and your cable system. i-guide is intuitive, intelligent and inspiring. It unlocks a world of greater choice, convenience and control
DETEXI Basic Configuration
 DETEXI Network Video Management System 5.5 EXPAND YOUR CONCEPTS OF SECURITY DETEXI Basic Configuration SETUP A FUNCTIONING DETEXI NVR / CLIENT It is important to know how to properly setup the DETEXI software
Getting started with
 Getting started with Electricity consumption monitoring single phase for homes and some smaller light commercial premises OVERVIEW: The OWL Intuition-e electricity monitoring system comprises of three
Getting Started. Connect green audio output of SpikerBox/SpikerShield using green cable to your headphones input on iphone/ipad.
 Getting Started First thing you should do is to connect your iphone or ipad to SpikerBox with a green smartphone cable. Green cable comes with designators on each end of the cable ( Smartphone and SpikerBox
Digital Video Recorder From Waitsfield Cable
 www.waitsfieldcable.com 496-5800 Digital Video Recorder From Waitsfield Cable Pause live television! Rewind and replay programs so you don t miss a beat. Imagine coming home to your own personal library
Software Ver
 - 0 - Software Ver-3.02 CONTENTS 1. INTRODUCTION...- 2-2. MAIN PANEL...- 3-3. SETTING UP TIME AND DAY...- 4-4. CREATING AN IRRIGATION PROGRAM...- 6-4.1 IRRIGATION DAYS AND START TIMES WHEN... - 6-4.2 WATER
Vision Call Statistics User Guide
 The Vision Call Reporting package is a web based near real time statistical tool that enables users to understand the call flow of inbound traffic both in terms of where calls have come from and also how
User Guide Stand-Alone Metering for OptiPlant
 User Guide Stand-Alone Metering for OptiPlant BAS-SVU030A-GB Table of Contents Introduction...4 General Features...5 User Interface...6 Top display area... 6 Bottom display area... 6 Main display area...
Additional instructions Memograph M, RSG45 Advanced Data Manager
 BA01337R/09/en/01.15 71302215 Firmware version ENU000A, V02.00.xx Products Solutions Services Additional instructions Memograph M, RSG45 Advanced Data Manager Option of wastewater + RSB (rain spillway
User interface. Abbreviations / Meanings
 RG66012649 User interface Contents Page Abbreviations / Meanings Abbreviations / meanings... 2 Button Identification... 3 On-screen Indicators... 4 Quick Start... 5 Setting the time and day... 5 Changing
PSC300 Operation Manual
 PSC300 Operation Manual Version 9.10 General information Prior to any attempt to operate this Columbia PSC 300, operator should read and understand the complete operation of the cubing system. It is very
inside i-guidetm user reference manual 09ROVI1204 User i-guide Manual R16.indd 1
 inside i-guidetm user reference manual 09ROVI1204 User i-guide Manual R16.indd 1 4/6/10 12:26:18 PM Copyright 2010 Rovi Corporation. All rights reserved. Rovi and the Rovi logo are trademarks of Rovi Corporation
802DN Series A DeviceNet Limit Switch Parameter List
 802DN Series A DeviceNet Limit Switch Parameter List EDS file Version 2.01 1. Operate Mode 1 (Sensor Output #1) Normally Open Normally Closed 2. Operate Mode 2 (Sensor Output #2) Normally Open Normally
Getting started with Spike Recorder on PC/Mac/Linux
 Getting started with Spike Recorder on PC/Mac/Linux You can connect your SpikerBox to your computer using either the blue laptop cable, or the green smartphone cable. How do I connect SpikerBox to computer
EDL8 Race Dash Manual Engine Management Systems
 Engine Management Systems EDL8 Race Dash Manual Engine Management Systems Page 1 EDL8 Race Dash Page 2 EMS Computers Pty Ltd Unit 9 / 171 Power St Glendenning NSW, 2761 Australia Phone.: +612 9675 1414
2-/4-Channel Cam Viewer E- series for Automatic License Plate Recognition CV7-LP
 2-/4-Channel Cam Viewer E- series for Automatic License Plate Recognition Copyright 2-/4-Channel Cam Viewer E-series for Automatic License Plate Recognition Copyright 2018 by PLANET Technology Corp. All
SpikePac User s Guide
 SpikePac User s Guide Updated: 7/22/2014 SpikePac User's Guide Copyright 2008-2014 Tucker-Davis Technologies, Inc. (TDT). All rights reserved. No part of this manual may be reproduced or transmitted in
D-Lab & D-Lab Control Plan. Measure. Analyse. User Manual
 D-Lab & D-Lab Control Plan. Measure. Analyse User Manual Valid for D-Lab Versions 2.0 and 2.1 September 2011 Contents Contents 1 Initial Steps... 6 1.1 Scope of Supply... 6 1.1.1 Optional Upgrades... 6
WindData Explorer User Manual
 WindData Explorer User Manual Revision History Revision Date Status 1 April 2014 First Edition Contents I Framework 4 1 Introduction 5 2 System Requirements 5 3 System Architecture 5 4 Graphical User Interface
PCASP-X2 Module Manual
 Particle Analysis and Display System (PADS): PCASP-X2 Module Manual DOC-0295 A; PADS 3.5 PCASP-X2 Module 3.5.0 2545 Central Avenue Boulder, CO 80301-5727 USA C O P Y R I G H T 2 0 1 1 D R O P L E T M E
013-RD
 Engineering Note Topic: Product Affected: JAZ-PX Lamp Module Jaz Date Issued: 08/27/2010 Description The Jaz PX lamp is a pulsed, short arc xenon lamp for UV-VIS applications such as absorbance, bioreflectance,
TELEVISION. Star Plans. Interactive Guide and DVR (Digital Video Recorder) Manual ARVIG arvig.net
 Manual ARVIG arvig.net") TELEVISION Star Plans Interactive Guide and DVR (Digital Video Recorder) Manual 888.99.ARVIG arvig.net TABLE OF CONTENTS DVR Remote Control Button Features...3 Arvig Digital TV i-guide Quick Reference
TELEVISION Star Plans Interactive Guide and DVR (Digital Video Recorder) Manual 888.99.ARVIG arvig.net TABLE OF CONTENTS DVR Remote Control Button Features...3 Arvig Digital TV i-guide Quick Reference
Index. - Registration assistant of momit Home 1 - Start of session/registration 2 - Registration of devices. - momit Home App 1.
 Index - Registration assistant of momit Home 1 - Start of session/registration 2 - Registration of devices - momit Home App 1. Start 2. Device 2.1 Control panel a. State of operation b. Temperature b1.
OptoFidelity Video Multimeter User Manual Version 2017Q1.0
 OptoFidelity Video Multimeter User Manual Version 2017Q1.0 OptoFidelity Oy sales@optofidelity.com www.optofidelity.com OptoFidelity 2017 Microsoft and Excel are either registered trademarks or trademarks
Click Here To Start Demo
 Click Here To Start Demo AirLogix Demo Title Screen AirLogix Interactive Demonstrator Version 3.0 Copyright 2005 by Case Engineering inc This is intended as a working active demonstration only. Every attempt
Digital Video User s Guide THE FUTURE NOW SHOWING
 Digital Video User s Guide THE FUTURE NOW SHOWING Welcome The NEW WAY To WATCH Digital TV is different than anything you have seen before. It isn t cable it s better! Digital TV offers great channels,
CytoFLEX Flow Cytometer Quick Start Guide
 Sheath Waste CLASS 1 LASER PRODUCT COMPLIES WITH 21 CFR 1040.10 AND 1040.11 EXCEPT FOR DEVIATIONS PURSUANT TO LASER NOTICE NO. 50 DATED JUNE 24, 2007 MANUFACTURED Sheath B49008AC February 2015 CytoFLEX
Table of Contents. 2 Select camera-lens configuration Select camera and lens type Listbox: Select source image... 8
 Table of Contents 1 Starting the program 3 1.1 Installation of the program.......................... 3 1.2 Starting the program.............................. 3 1.3 Control button: Load source image......................
Digital Video User s Guide THE FUTURE NOW SHOWING
 Digital Video User s Guide THE FUTURE NOW SHOWING Welcome The NEW WAY to WATCH Digital TV is different than anything you have seen before. It isn t cable it s better! Digital TV offers great channels,
TRAINING DOCUMENT LOS ANGELES UNIFIED SCHOOL DISTRICT (LAUSD) BELL SCHEDULING SYSTEM
 BELL SCHEDULING SYSTEM") Introduction TRAINING DOCUMENT LOS ANGELES UNIFIED SCHOOL DISTRICT (LAUSD) BELL SCHEDULING SYSTEM Prepared by CMCI Version 4 4/23/2017 This document is intended to be a comprehensive guide towards describing
Introduction TRAINING DOCUMENT LOS ANGELES UNIFIED SCHOOL DISTRICT (LAUSD) BELL SCHEDULING SYSTEM Prepared by CMCI Version 4 4/23/2017 This document is intended to be a comprehensive guide towards describing
Application Note 11 - Totalization
 Application Note 11 - Totalization Using the TrendView Recorders for Totalization The totalization function is normally associated with flow monitoring applications, where the input to the recorder would
TL-2900 AMMONIA & NITRATE ANALYZER DUAL CHANNEL
 TL-2900 AMMONIA & NITRATE ANALYZER DUAL CHANNEL DATA ACQUISITION SYSTEM V.15.4 INSTRUCTION MANUAL Timberline Instruments, LLC 1880 S. Flatiron Ct., Unit I Boulder, Colorado 80301 Ph: (303) 440-8779 Fx:
Digital Video User s Guide THE FUTURE NOW SHOWING
 Digital Video User s Guide THE FUTURE NOW SHOWING TV Welcome The NEW WAY to WATCH Digital TV is different than anything you have seen before. It isn t cable it s better! Digital TV offers great channels,
TV User s Guide THE FUTURE NOW SHOWING. New and Improved Movies On Demand Screen!
 TV User s Guide THE FUTURE NOW SHOWING New and Improved Movies On Demand Screen! Welcome The NEW WAY to WATCH Endeavor Digital TV is different than anything you have seen before. It isn t cable it s better!
Modbus for SKF IMx and Analyst
 User manual Modbus for SKF IMx and SKF @ptitude Analyst Part No. 32342700-EN Revision A WARNING! - Read this manual before using this product. Failure to follow the instructions and safety precautions
Model VF110-E Touch Screen Control Panel Users Manual
 A.F.I. Publication: 1910817 Issue: 1 Date: August 2017 Model VF110-E Touch Screen Control Panel Users Manual ALL-FILL, Inc. 418 Creamery Way Exton, PA. 19341 USA (610) 524-7350 FAX (610) 524-7346 www.all-fill.com
Getting Started Guide for the V Series
 product pic here Getting Started Guide for the V Series Version 9.0.6 March 2010 Edition 3725-24476-003/A Trademark Information POLYCOM, the Polycom Triangles logo and the names and marks associated with
Thought Technology Ltd Belgrave Avenue, Montreal, QC H4A 2L8 Canada
 Thought Technology Ltd. 2180 Belgrave Avenue, Montreal, QC H4A 2L8 Canada Tel: (800) 361-3651 ٠ (514) 489-8251 Fax: (514) 489-8255 E-mail: _Hmail@thoughttechnology.com Webpage: _Hhttp://www.thoughttechnology.com
ViewCommander-NVR. Version 6. User Guide
 ViewCommander-NVR Version 6 User Guide The information in this manual is subject to change without notice. Internet Video & Imaging, Inc. assumes no responsibility or liability for any errors, inaccuracies,
Pre-processing of revolution speed data in ArtemiS SUITE 1
 03/18 in ArtemiS SUITE 1 Introduction 1 TTL logic 2 Sources of error in pulse data acquisition 3 Processing of trigger signals 5 Revolution speed acquisition with complex pulse patterns 7 Introduction
Synergy SIS Attendance Administrator Guide
 Synergy SIS Attendance Administrator Guide Edupoint Educational Systems, LLC 1955 South Val Vista Road, Ste 210 Mesa, AZ 85204 Phone (877) 899-9111 Fax (800) 338-7646 Volume 01, Edition 01, Revision 04
1 OVERVIEW 2 WHAT IS THE CORRECT TIME ANYWAY? Application Note 3 Transmitting Time of Day using XDS Packets 2.1 UTC AND TIMEZONES
 1 OVERVIEW This application note describes how to properly encode Time of Day information using EIA-608-B Extended Data Services (XDS) packets. In the United States, the Public Broadcasting System (PBS)
Rack-Mount Receiver Analyzer 101
 Rack-Mount Receiver Analyzer 101 A Decade s Worth of Innovation No part of this document may be circulated, quoted, or reproduced for distribution without prior written approval from Quasonix, Inc. Copyright
ViewCommander- NVR Version 3. User s Guide
 ViewCommander- NVR Version 3 User s Guide The information in this manual is subject to change without notice. Internet Video & Imaging, Inc. assumes no responsibility or liability for any errors, inaccuracies,
Getting Started Guide for the V Series
 product pic here Getting Started Guide for the V Series Version 8.7 July 2007 Edition 3725-24476-002/A Trademark Information Polycom and the Polycom logo design are registered trademarks of Polycom, Inc.,
Technical Note. Manufacturer: Elan g! DVR 7.0 OVERVIEW SUPPORTED FEATURES
 Technical Note Manufacturer: Elan g! DVR 7.0 Minimum Core Module Version: Version 7.0, 6.7 Document Revision Date: 09/16/2014 OVERVIEW Important: This document refers to Version 7.0/6.7 DVR. Please see
MSC+ Controller. Operation Manual
 MSC+ Controller Operation Manual Contents Introduction... 1 Controls and Indicators...1 Programming the Controller... 3 Definitions...3 Programming Checklist...3 Power-Up the Controller...4 Clock Status
Processor time 9 Used memory 9. Lost video frames 11 Storage buffer 11 Received rate 11
 Processor time 9 Used memory 9 Lost video frames 11 Storage buffer 11 Received rate 11 2 3 After you ve completed the installation and configuration, run AXIS Installation Verifier from the main menu icon
With Export all setting information (preferences, user setttings) can be exported into a text file.
 can be exported into a text file.") Release Notes 1 Release Notes What s new in release 1.6 Version 1.6 contains many new functions that make it easier to work with the program and more powerful for users. 1. Preferences Export Menu: Info
Release Notes 1 Release Notes What s new in release 1.6 Version 1.6 contains many new functions that make it easier to work with the program and more powerful for users. 1. Preferences Export Menu: Info
Getting started with
 PART NO. CMA11 3 MADE IN CHINA 1. Measuring CAT II 2. Max. voltage 250V ~ 3. Max. current 71 Amp Getting started with Electricity consumption & Solar PV generation monitoring single phase, for homes fitted
Operation/Users Manual
 Operation/Users Manual 48-1-21 Please forward any suggestions or errors to: jillas@daumar.es 6- OPERATION MANUAL FOR MACHINE 48 VERSION 48-1-21 This document is made up of the following sections: COMPULSORY
 Your remote control holds the key to navigating through the features of i-guide. Words appearing in ALL CAPS refer to a specific button on the remote. Note that all remotes may not have all of the buttons.
The software concept. Try yourself and experience how your processes are significantly simplified. You need. weqube.
 You need. weqube. weqube is the smart camera which combines numerous features on a powerful platform. Thanks to the intelligent, modular software concept weqube adjusts to your situation time and time
Software Quick Manual
 XX113-30-00 Workstation and NVR Quick Manual Vicon Industries Inc. does not warrant that the functions contained in this equipment will meet your requirements or that the operation will be entirely error
Grid Interactive Advanced Features Self-Supply Mode
 Grid Interactive Advanced Features Self-Supply Mode CHILICON POWER MICROINVERTERS AND CP-100 CORTEX GATEWAY SYSTEM OVERVIEW Chilicon Power Advanced Inverter functions Power Factor Control: -0.8 to +0.8
icontrol Integrated Control System Operator s Card
 icontrol Integrated Control System Operator s Card WARNING: Allow only qualified personnel to operate this equipment. Follow the safety instructions in this document and all other related documentation.
My XDS Receiver- Affiliate Scheduler
 My XDS Receiver- Affiliate Scheduler The XDS distribution system represents a marked departure from the architecture and feature set of previous generations of satellite receivers. Unlike its predecessors,
CA Outbound Dialer Module. Operation Manual v1.1
 CA Outbound Dialer Module Operation Manual v1.1 Poltys, Inc. 3300 N. Main Street, Suite D, Anderson, SC 29621-4128 +1 (864) 642-6103 www.poltys.com 2013, Poltys Inc. All rights reserved. The information
InPlace User Guide for Faculty of Arts, Education and Social Sciences Staff
 InPlace User Guide for Faculty of Arts, Education and Social Sciences Staff Page 1 of 56 Contents Accessing InPlace... 4 Main Menu... 5 Home... 5 My Details... 5 Help... 6 Alert Notifications... 7 Placement
Training Note TR-06RD. Schedules. Schedule types
 Schedules General operation of the DT80 data loggers centres on scheduling. Schedules determine when various processes are to occur, and can be triggered by the real time clock, by digital or counter events,
Configuring and Troubleshooting Set-Top Boxes
 Diagnose RF Tuner Issues, page 1 Protect End-User Privacy, page 4 Apply Services to Device, page 5 View Video Recordings, page 6 View VOD Programs, page 6 View PDL Programs, page 7 View Hard Disk Information,
Optical Technologies Micro Motion Absolute, Technology Overview & Programming
 Optical Technologies Micro Motion Absolute, Technology Overview & Programming TN-1003 REV 180531 THE CHALLENGE When an incremental encoder is turned on, the device needs to report accurate location information
ExtIO Plugin User Guide
 Overview The SDRplay Radio combines together the Mirics flexible tuner front-end and USB Bridge to produce a SDR platform capable of being used for a wide range of worldwide radio and TV standards. This
Installation / Set-up of Autoread Camera System to DS1000/DS1200 Inserters
 Installation / Set-up of Autoread Camera System to DS1000/DS1200 Inserters Written By: Colin Langridge Issue: Draft Date: 03 rd July 2008 1 Date: 29 th July 2008 2 Date: 20 th August 2008 3 Date: 02 nd
Instructions for DataMark PDF Temperature Logger
 Instructions for DataMark PDF Temperature Logger DataMark provides a convenient way to obtain high accuracy temperature data in transit. The unit is a self contained temperature logger that plugs directly
Blueline, Linefree, Accuracy Ratio, & Moving Absolute Mean Ratio Charts
 INTRODUCTION This instruction manual describes for users of the Excel Standard Celeration Template(s) the features of each page or worksheet in the template, allowing the user to set up and generate charts
Short Manual. ZX2 Short Manual.doc Page 1 of 12
 Short Manual ZX2 Short Manual.doc Page 1 of 12 1 Safety precautions and correct use Please refer to the full ZX2 user manual for the detailed explanations of the safety precautions and the correct use.
Compressed Air Management Systems SIGMA AIR MANAGER Pressure flexibility Switching losses Control losses next.
 Compressed Air Management Systems SIGMA AIR MANAGER Pressure flexibility Switching losses Control losses next.generation Sigma Air Manager Integrated performance for maximum energy savings An orchestra
CI-218 / CI-303 / CI430
 CI-218 / CI-303 / CI430 Network Camera User Manual English AREC Inc. All Rights Reserved 2017. l www.arec.com All information contained in this document is Proprietary Table of Contents 1. Overview 1.1
Packet Voice Impairment Test (PVIT) on the Sage 930A-L3, 930i, and 935AT
 on the Sage 930A-L3, 930i, and 935AT") Packet Voice Impairment Test (PVIT) on the Sage 930A-L3, 930i, and 935AT The Sage Packet Voice Impairment Test (PVIT) provides detailed diagnostic information about events that impact voice clarity over
Packet Voice Impairment Test (PVIT) on the Sage 930A-L3, 930i, and 935AT The Sage Packet Voice Impairment Test (PVIT) provides detailed diagnostic information about events that impact voice clarity over
Welcome to W light up your life
 USER GUIDE 1 Welcome to light up your life Dear Vision Communications Customer, Thank you for choosing LightWave TV from Vision. LightWave TV will open a whole new world of TV entertainment for you and
OWL micro+ WIRELESS ELECTRICITY MONITOR
 COS T NOW TARIFF 3A SENDER 30 25 20 15 10 5 0 SETTING UP YOUR OWL Index of pages 2. Setting up date and time 3. Tariff setting 4. To set up a single tariff 5. To set up a two tiered time tariff 6. To set
SPP-100 Module for use with the FSSP Operator Manual
 ` Particle Analysis and Display System (PADS): SPP-100 Module for use with the FSSP Operator Manual DOC-0199 A; PADS 2.8.2 SPP-100 Module 2.8.2 2545 Central Avenue Boulder, CO 80301 USA C O P Y R I G H
Matrox PowerStream Plus
 Matrox PowerStream Plus User Guide 20246-301-0100 2016.12.01 Contents 1 About this user guide...5 1.1 Using this guide... 5 1.2 More information... 5 2 Matrox PowerStream Plus software...6 2.1 Before you
Software Quick Manual
 XX177-24-00 Virtual Matrix Display Controller Quick Manual Vicon Industries Inc. does not warrant that the functions contained in this equipment will meet your requirements or that the operation will be
Tutorial FITMASTER Tutorial
 Tutorial 2.20 FITMASTER Tutorial HEKA Elektronik Phone +49 (0) 6325 / 95 53-0 Dr. Schulze GmbH Fax +49 (0) 6325 / 95 53-50 Wiesenstrasse 71 Web Site www.heka.com D-67466 Lambrecht/Pfalz Email sales@heka.com
MAutoPitch. Presets button. Left arrow button. Right arrow button. Randomize button. Save button. Panic button. Settings button
 MAutoPitch Presets button Presets button shows a window with all available presets. A preset can be loaded from the preset window by double-clicking on it, using the arrow buttons or by using a combination
Chapter 23 Dimmer monitoring
 Chapter 23 Dimmer monitoring ETC consoles may be connected to ETC Sensor dimming systems via the ETCLink communication protocol. In this configuration, the console operates a dimmer monitoring system that
BioGraph Infiniti Physiology Suite
 Thought Technology Ltd. 2180 Belgrave Avenue, Montreal, QC H4A 2L8 Canada Tel: (800) 361-3651 ٠ (514) 489-8251 Fax: (514) 489-8255 E-mail: mail@thoughttechnology.com Webpage: http://www.thoughttechnology.com
Dimming actuators GDA-4K KNX GDA-8K KNX
 Dimming actuators GDA-4K KNX GDA-8K KNX GDA-4K KNX 108394 GDA-8K KNX 108395 Updated: May-17 (Subject to changes) Page 1 of 67 Contents 1 FUNCTIONAL CHARACTERISTICS... 4 1.1 OPERATION... 5 2 TECHNICAL DATA...
LED control gear Compact dimming. Uconverter LCAI 2x38 W 0500 K013 one4all ECO series. Ordering data
 Product description Dimmable built-in for LED Constant current (with 2 adjustable output channels) Designed for outdoor and street luminaire Output power 2 x 38 W Suitable for mains voltage peaks (burst/surge)
READ THIS FIRST. Morphologi G3. Quick Start Guide. MAN0412 Issue1.1
 READ THIS FIRST Morphologi G3 Quick Start Guide MAN0412 Issue1.1 Malvern Instruments Ltd. 2008 Malvern Instruments makes every effort to ensure that this document is correct. However, due to Malvern Instruments
Tyler SIS Student 360 Mobile
 Tyler SIS Student 360 Mobile Overview Tyler SIS Student 360 Mobile is a mobile phone app version of the Tyler SIS Student 360 Parent Portal available on both ios and Android. It can be downloaded from
Connecting You to the World YADTEL TV. User Guide
 Connecting You to the World YADTEL TV User Guide 1 Channel Guide Press GUIDE on the remote OR Press MENU and select the Guide option and press OK. Once you are in the Guide, pressing GUIDE again will change
Quick Start Guide Building and Scheduling a Show
 Quick Start Guide Building and Scheduling a Show www.lightorama.com You have created or bought and installed your sequences and want to use them to build a show and schedule that show to run at certain
Digital Compass. Package Contents. Hardware Overview. Basic Operation. Article: CNS-DC3 Quick Guide v1.0
 Digital Compass Article: CNS-DC3 Quick Guide v1.0 Package Contents 1. CANYON CNS-DC3 Main Unit 2. Documentation CD 3. User Quick Guide Hardware Overview [SR] Button [M] Button [L/R] Button [S/S] Button
User s Guide. Dimensions 4000 Series Control System. Topics at a Glance
 User s Guide Dimensions 4000 Series Control System Topics at a Glance Installation...See Installation Guide Quick Start Configuration...11 User Interface...8 Initial Setup...19 Scheduling...63 Scene Recording...54
Housing Inventory Setup Guide
 The following guide should allow users with residential programs to become more familiar with the inventory setup and maintenance functions within the PA HMIS/Client Track system. This guide will walk
IP LIVE PRODUCTION UNIT NXL-IP55
 IP LIVE PRODUCTION UNIT NXL-IP55 OPERATION MANUAL 1st Edition (Revised 2) [English] Table of Contents Overview...3 Features... 3 Transmittable Signals... 3 Supported Networks... 3 System Configuration
StrataSync. DSAM 24 Hour POP Report
 DSAM 24 Hour POP Report Thursday, January 28, 2016 Page 1 of 19 Table of Contents... 1... 1 Table of Contents... 2 Introduction... 3 POP Test Configuration Location File, Channel Plan, Limit Plan... 4