MANOVA COM 631/731 Spring 2017 M. DANIELS. From Jeffres & Neuendorf (2015) Film and TV Usage National Survey
|
|
|
- Claude Jackson
- 5 years ago
- Views:
Transcription
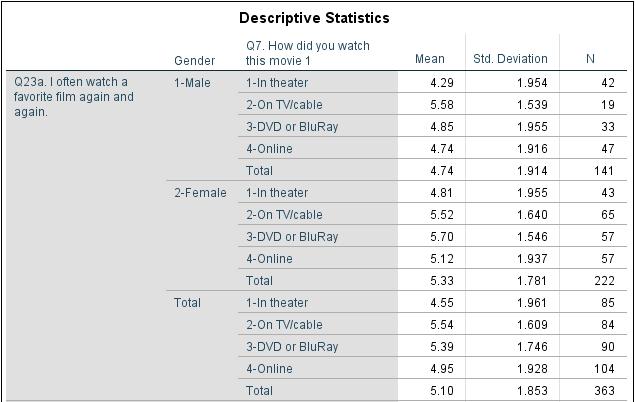
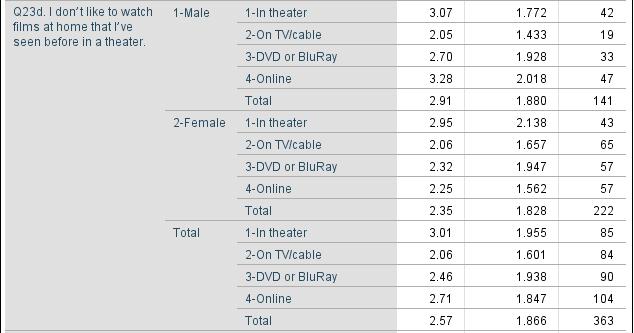
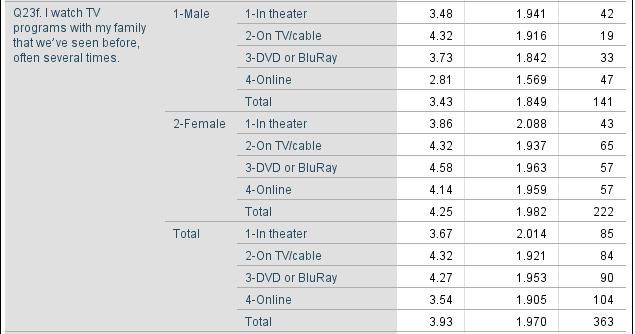
1 1 MANOVA COM 631/731 Spring 2017 M. DANIELS I. MODEL From Jeffres & Neuendorf (2015) Film and TV Usage National Survey INDEPENDENT VARIABLES DEPENDENT VARIABLES X1: GENDER Q23a. I often watch a favorite film again and again. Q23d. I don t like to watch films at home that I ve seen before in a theater. X2: Q7. How did you watch this movie 1 INTERACTION OF X1 AND X2: Q23f. I watch TV programs with my family that we ve seen before, often several times. Q23l. I like playing/listening to a movie I'm familiar with as background while I do other things.
2 2 Independent Variables: Q7. How did you watch this movie 1? Nominal (4 Categories) 1 = In a theater, 2 = On TV/cable, 3= DVD/Blu-ray, 4 = Online Gender - Nominal (2 Categories) 1= Male, 2= Female Dependent Variables: (all measured on a 1-7 response scale, where 1=not like me at all and 7=very much like me) Q23a. I often watch a favorite film again and again. Q23d. I don t like to watch films at home that I ve seen before in a theater. Q23f. I watch TV programs with my family that we ve seen before, often several times. Q23l. I like playing/listening to a movie I'm familiar with as background while I do other things.


3 3 II. RUNNING SPSS ANALYZE > GENERAL LINEAR MODEL > MULTIVARIATE > ADD DEPENDENT AND ( FIXED FACTOR ) INDEPENDENT VARIABLES BY CLICKING THE ARROW (from left boxes to right boxes)

4 4 MODEL > FULL FACTORIAL > CONTINUE PLOTS > FACTORS > MOVE IV S INTO RIGHT BOXES USING ARROW KEYS > HORIZONTAL AXIS > SEPARATE LINES
5 5 > ONCE IV S ARE IN THE BOXES, ADD TO CREATE A GRAPH SHOWING THE INTERACTION OF THE IVS > MAKE SURE THE INTERACTION SHOWS IN THE PLOTS BOX AND THEN CLICK CONTINUE
6 6 >POST HOC > MOVE OVER EDUCATION (Not gender because it has only two groups) > CONTINUE EQUAL VARIANCES ASSUMED SCHEFFE TUKEY S-b ANY OTHER POST HOC TESTS YOU WISH

7 7 > OPTIONS > HIGHLIGHT ALL IVs AND THE INTERACTION IN THE LEFT DISPLAY > CONTINUE ARROW TO MOVE IVs TO THE RIGHT BOX DESCRIPTIVE STATISTICS ESTIMATES OF EFFECT SIZE OBSERVED POWER HOMOGENEITY TESTS

8 > CLICK OK TO RUN MANOVA!!! (OR PASTE TO SAVE SYNTAX AND THEN RUN) 8

9 9 III. SPSS OUTPUT CORRELATIONS /VARIABLES=Q23a Q23d Q23f Q23l /PRINT=TWOTAIL NOSIG /MISSING=PAIRWISE. Correlations
 /PRINT=DESCRIPTIVE ETASQ OPOWER HOMOGENEITY /CRITERIA=ALPHA(.05) /DESIGN= Gender Q7 Gender*Q7.")
10 10 GLM Q23a Q23d Q23f Q23l BY Gender Q7 /METHOD=SSTYPE(3) /INTERCEPT=INCLUDE /POSTHOC=Q7(BTUKEY SCHEFFE) /PLOT=PROFILE(Gender*Q7) /EMMEANS=TABLES(Gender) /EMMEANS=TABLES(Q7) /EMMEANS=TABLES(Gender*Q7) /PRINT=DESCRIPTIVE ETASQ OPOWER HOMOGENEITY /CRITERIA=ALPHA(.05) /DESIGN= Gender Q7 Gender*Q General Linear Model
11 11
12 12
13 13
14 14
15 15
16 16

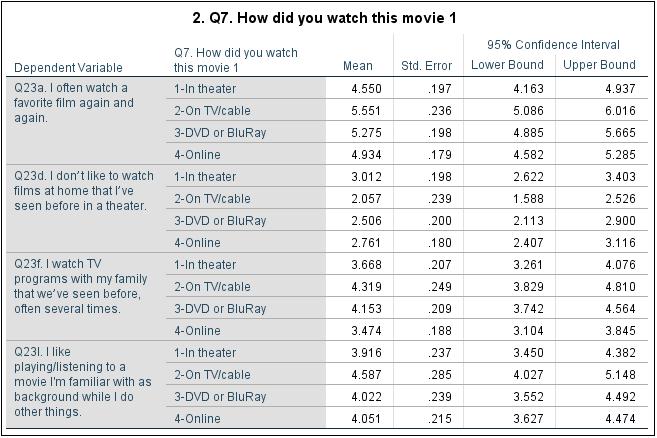
17 Estimated Marginal Means 17
18 18


19 19 Post Hoc Tests Q7. How did you watch this movie 1
20 Homogeneous Subsets 20
21 21
22 22
23 23

24 24 Profile Plots Q23a. I often watch a favorite film again and again.

25 Q23d. I don t like to watch films at home that I ve seen before in a theater. 25

26 Q23f. I watch TV programs with my family that we ve seen before, often several times. 26

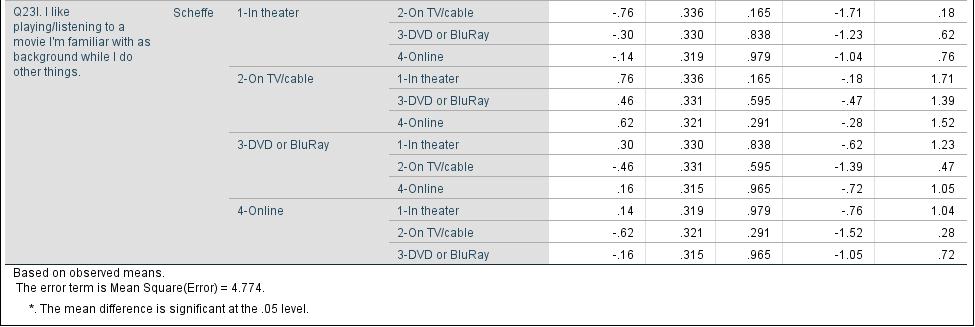
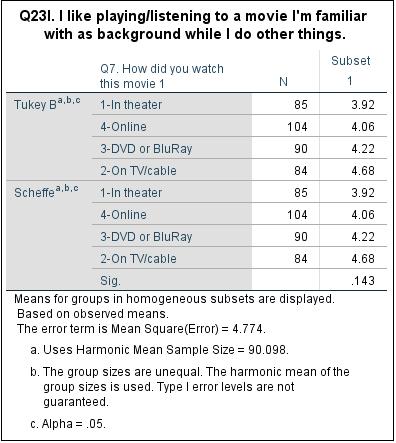
27 Q23l. I like playing/listening to a movie I'm familiar with as background while I do other things. 27
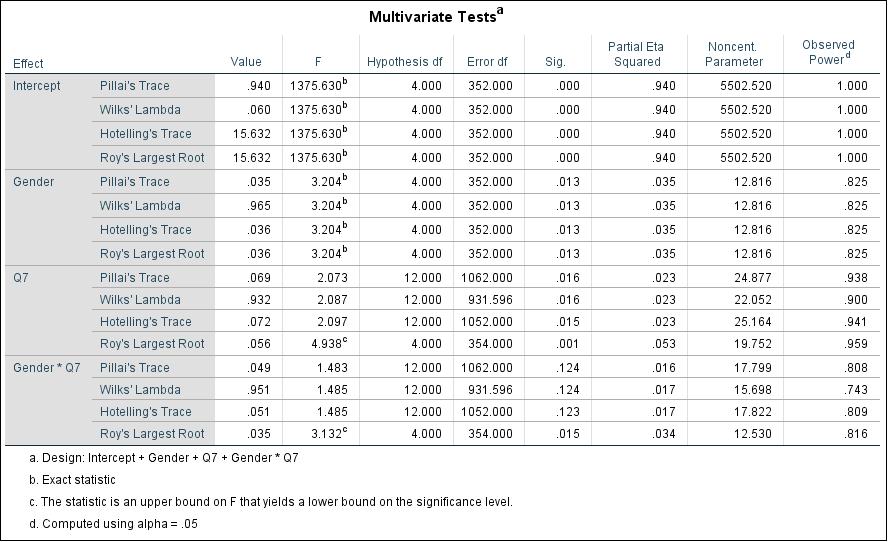
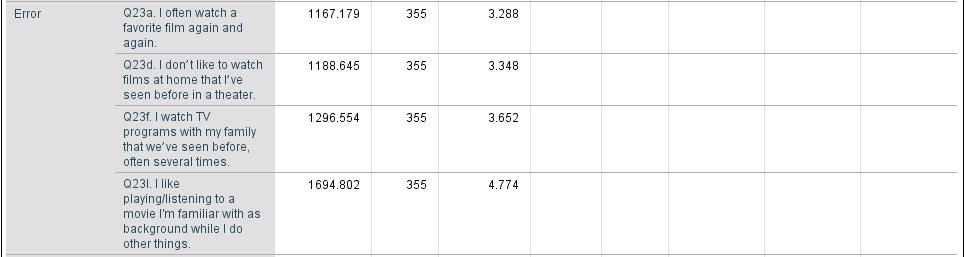
28 28 IV. TABLING Table 1: Multivariate Statistics for MANOVA Effect Value F-Value Sig. Observed Power Main Effect: Pillai s Trace b Gender Wilks b Lambda Hotelling s b Trace Roy s b Largest Root Main Effect: Pillai s Trace Q7. How Wilks did you watch this Lambda Hotelling s movie 1? Trace Roy s c Largest Root Interaction: Pillai s Trace Gender Wilks X Q7. How did you Lambda Hotelling s Trace watch this Roy s c movie 1? Largest Root b. Exact Statistic c. The statistic is an upper bound on F that yields a lower bound on the significance level. d. Computed using alpha =.05
29 29 Table 2. Two-factor ANOVA Predicting Q23a. I often watch a favorite film again and again From Gender and Q7. How did you watch this movie 1? Mean n Sum of Squares df Mean Square F Sig. Partial eta 2 Main Effect: Gender Female Male Main Effect: Q7. How did you watch this movie 1? 1- In theater On TV/cable 3- DVD or Blu-ray 4- Online Interaction: Gender X Q7. How did you watch this movie 1? Error
30 30 Table 3. Two-factor ANOVA predicting Q23d. I don t like to watch films at home that I ve seen before in a theater From Gender and Q7. How did you watch this movie 1? Mean n Sum of Squares df Mean Square F Sig. Partial eta 2 Main Effect: Gender Female Male Main Effect: Q7. How did you watch this movie 1? 1- In theater On TV/cable 3- DVD or Bluray Online Interaction: Gender X Q7. How did you watch this movie 1? Error
31 31 Table 4. Two-factor ANOVA predicting Q23f. I watch TV programs with my family that we ve seen before, often several times from Gender and Q7. How did you watch this movie 1? Mean n Sum of Squares df Mean Square F Sig. Partial eta 2 Main Effect: Gender Female Male Main Effect: Q7. How did you watch this movie 1? 1- In theater On TV/cable 3- DVD or Bluray Online Interaction: Gender X Q7. How did you watch this movie 1? Error
32 32 Table 5. Two-factor ANOVA predicting Q23l. I like playing/listening to a movie I'm familiar with as background while I do other things from Gender and Q7. How did you watch this movie 1? Mean n Sum of Squares df Mean Square F Sig. Partial eta 2 Main Effect: Gender Female Male Main Effect: Q7. How did you watch this movie 1? 1- In theater On TV/cable 3- DVD or Bluray Online Interaction: Gender X Q7. How did you watch this movie 1? Error
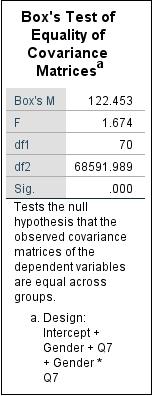
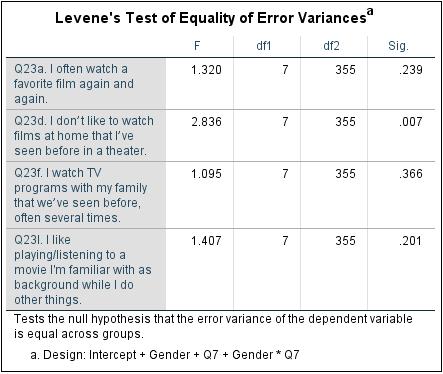
33 33 V. WRITEUP OF RESULTS Writeup of MANOVA Four dependent variables were selected from the Jeffres and Neuendorf (2015) Film and TV Usage National Survey, all of which have significant intercorrelations at p <.001. The variables are as follows, with all measured using a 1-7 response scale (1= not like me at all ; 7= very much like me ): Q23a. I often watch a favorite film again and again. Q23d. I don t like to watch films at home that I ve seen before in a theater. Q23f. I watch TV programs with my family that we ve seen before, often several times. Q23l. I like playing/listening to a movie I'm familiar with as background while I do other things. Independent variables chosen were Gender and Q7. How did you watch this movie 1? (1 = In a theater, 2 = On TV/Cable, 3 = DVD/Blu-ray, 4 = Online). The factorial design is 2 x 4. Assumptions Box s M tested for homoscedasticity. It specifically tests the null hypothesis that the observed covariance matrices of the dependent variables are equal across groups. It is ideal for Box s M to be non-significant to reject the null. For this set of variables Box s M is significant, p <.001. Multivariate Tests The multivariate tests in Table 1 indicate that the variable Gender has a significant main effect on the set of dependent variables; Pillai s Trace, Wilks Lambda, Hotelling s Trace, and Roy s Largest Root are all p <.05. Table 1 also shows that Q7. How did you watch this movie 1? has a significant main effect on the set of dependent variables; Pillai s Trace, Wilks
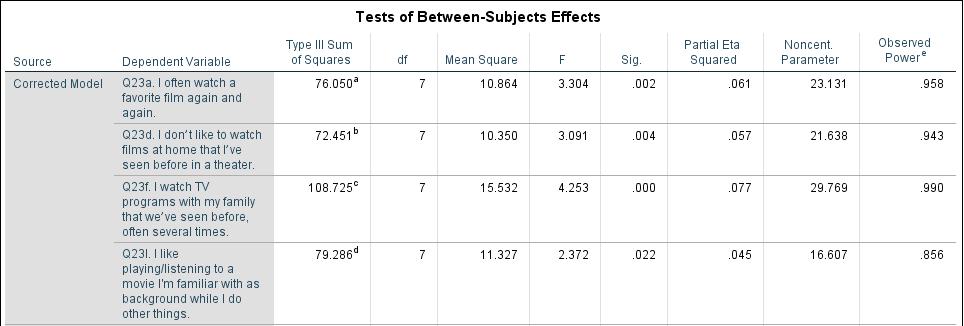
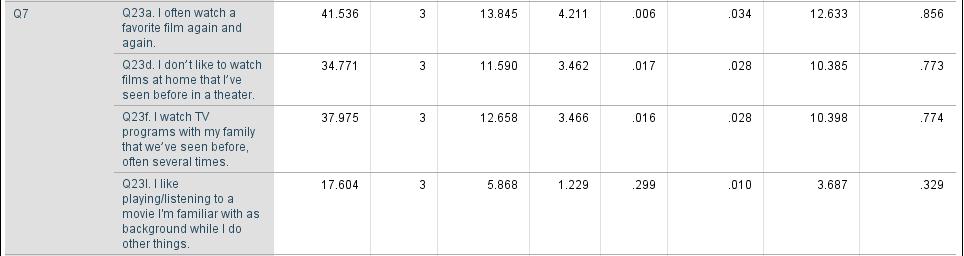
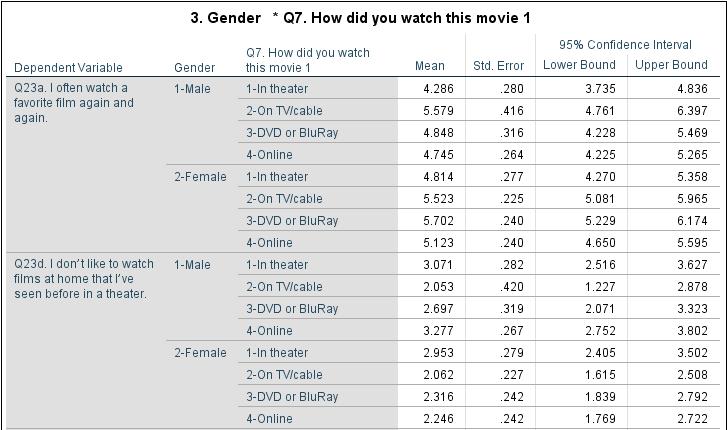
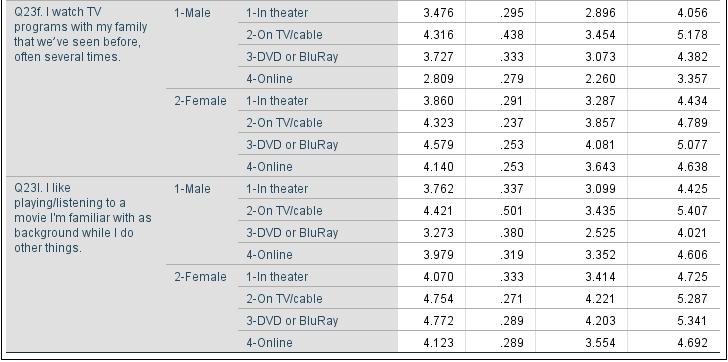
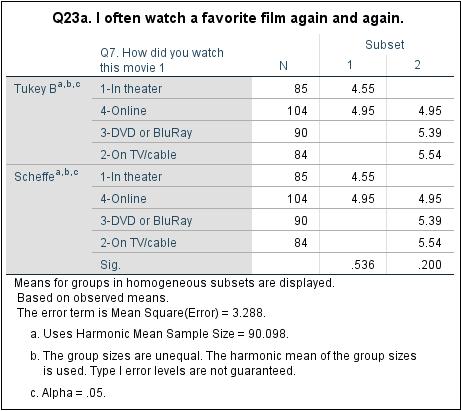
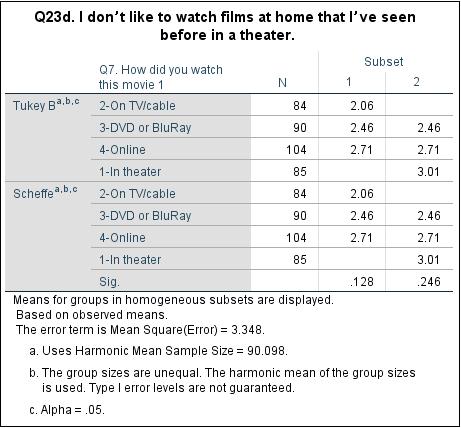
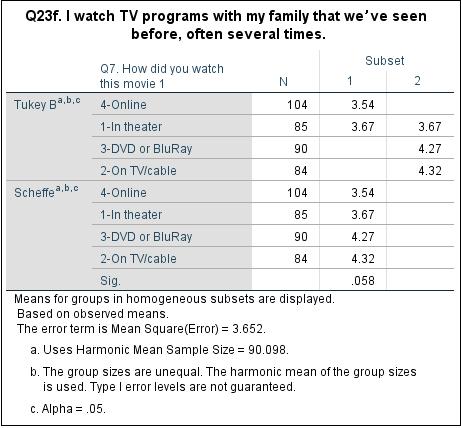
34 34 Lambda, Hotelling s Trace, and Roy s Largest Root are all p <.05. The interaction effect test only indicates a significant result with Roy s Largest Root at p <.05. A series of four ANOVAs were conducted to further examine the significance of the main effects and interaction effect for each of the four dependent variables individually. ANOVAS Table 2 shows the ANOVA predicting Q23a. I often watch a favorite film again and again." The table indicates both main effects of Gender and Q7. How did you watch this movie 1? are significant at p <.05. The interaction is not significant. The main effect of Gender shows that females are higher in watching a favorite film again and again than males. The main effect of Q7. How did you watch this movie 1? shows people who prefer to watch films on TV/cable are the highest on watching a favorite film again and again, with those who prefer to watch via DVD/BluRay second highest. Post hocs indicate that these two groups means are significantly higher than the means for the other two groups. Table 3 shows the ANOVA predicting Q23d. I don t like to watch films at home that I ve seen before in a theater. The table indicates that the main effect for Q7. How did you watch this movie 1? is significant at p <.05. The main effect for Gender and the interaction are both non-significant. The main effect of Q7. How did you watch this movie 1? shows people who responded In a theater are highest in disfavor of watching a film at home that they have seen before in a theater. Post hocs indicate that this group s mean is significantly higher than the mean for the group that prefers to watch films on TV/cable. Table 4 shows the ANOVA predicting Q23f. I watch TV programs with my family that we ve seen before, often several times. The table indicates both main effects of Gender and Q7. How did you watch this movie 1? are significant at p <.05. The interaction is not significant. The main effect of Gender shows that females are higher in watching TV programs
35 35 with their family that they have seen before, often several times than males. The main effect of Q7. How did you watch this movie 1? shows people who responded On TV/cable are highest in repeatedly watching TV programs that they have seen before with their family. However, post hocs indicate that this group s mean is not significantly higher than any other single group. Tables 5 shows the ANOVA predicting Q23l. I like playing/listening to a movie I'm familiar with as background while I do other things. The table indicates that the main effect of Gender is significant at p <.05. The main effect of Q7. How did you watch this movie 1? and the interaction effect are both non-significant. The main effect of Gender shows that males are higher in favor of playing/listening to a movie they are familiar with as background while they do things than females.
I. Model. Q29a. I love the options at my fingertips today, watching videos on my phone, texting, and streaming films. Main Effect X1: Gender
 1 Hopewell, Sonoyta & Walker, Krista COM 631/731 Multivariate Statistical Methods Dr. Kim Neuendorf Film & TV National Survey dataset (2014) by Jeffres & Neuendorf MANOVA Class Presentation I. Model INDEPENDENT
MANOVA/MANCOVA Paul and Kaila
 I. Model MANOVA/MANCOVA Paul and Kaila From the Music and Film Experiment (Neuendorf et al.) Covariates (ONLY IN MANCOVA) X1 Music Condition Y1 E20 Contempt Y2 E21 Anticipation X2 Instrument Interaction
1. Model. Discriminant Analysis COM 631. Spring Devin Kelly. Dataset: Film and TV Usage National Survey 2015 (Jeffres & Neuendorf) Q23a. Q23b.
 Q23a. Q23b.") 1 Discriminant Analysis COM 631 Spring 2016 Devin Kelly 1. Model Dataset: Film and TV Usage National Survey 2015 (Jeffres & Neuendorf) Q23a. Q23b. Q23c. DF1 Q23d. Q23e. Q23f. Q23g. Q23h. DF2 DF3 CultClass
1 Discriminant Analysis COM 631 Spring 2016 Devin Kelly 1. Model Dataset: Film and TV Usage National Survey 2015 (Jeffres & Neuendorf) Q23a. Q23b. Q23c. DF1 Q23d. Q23e. Q23f. Q23g. Q23h. DF2 DF3 CultClass
TWO-FACTOR ANOVA Kim Neuendorf 4/9/18 COM 631/731 I. MODEL
 1 TWO-FACTOR ANOVA Kim Neuendorf 4/9/18 COM 631/731 I. MODEL Using the Humor and Public Opinion Data, a two-factor ANOVA was run, using the full factorial model: MAIN EFFECT: Political Philosophy (3 groups)
SECTION I. THE MODEL. Discriminant Analysis Presentation~ REVISION Marcy Saxton and Jenn Stoneking DF1 DF2 DF3
 Discriminant Analysis Presentation~ REVISION Marcy Saxton and Jenn Stoneking COM 631/731--Multivariate Statistical Methods Instructor: Prof. Kim Neuendorf (k.neuendorf@csuohio.edu) Cleveland State University,
DV: Liking Cartoon Comedy
 1 Stepwise Multiple Regression Model Rikki Price Com 631/731 March 24, 2016 I. MODEL Block 1 Block 2 DV: Liking Cartoon Comedy 2 Block Stepwise Block 1 = Demographics: Item: Age (G2) Item: Political Philosophy
Discriminant Analysis. DFs
 Discriminant Analysis Chichang Xiong Kelly Kinahan COM 631 March 27, 2013 I. Model Using the Humor and Public Opinion Data Set (Neuendorf & Skalski, 2010) IVs: C44 reverse coded C17 C22 C23 C27 reverse
Problem Points Score USE YOUR TIME WISELY USE CLOSEST DF AVAILABLE IN TABLE SHOW YOUR WORK TO RECEIVE PARTIAL CREDIT
 Stat 514 EXAM I Stat 514 Name (6 pts) Problem Points Score 1 32 2 30 3 32 USE YOUR TIME WISELY USE CLOSEST DF AVAILABLE IN TABLE SHOW YOUR WORK TO RECEIVE PARTIAL CREDIT WRITE LEGIBLY. ANYTHING UNREADABLE
GLM Example: One-Way Analysis of Covariance
 Understanding Design and Analysis of Research Experiments An animal scientist is interested in determining the effects of four different feed plans on hogs. Twenty four hogs of a breed were chosen and
More About Regression
 Regression Line for the Sample Chapter 14 More About Regression is spoken as y-hat, and it is also referred to either as predicted y or estimated y. b 0 is the intercept of the straight line. The intercept
Repeated measures ANOVA
 Repeated measures ANOVA Pronoun interpretation in direct and indirect speech 07-05-2013 1 Franziska Köder Seminar in Methodology and Statistics, May 23, 2013 24-10-2012 2 Overview 1. Experimental design
Tutorial 0: Uncertainty in Power and Sample Size Estimation. Acknowledgements:
 Tutorial 0: Uncertainty in Power and Sample Size Estimation Anna E. Barón, Keith E. Muller, Sarah M. Kreidler, and Deborah H. Glueck Acknowledgements: The project was supported in large part by the National
Mixed Effects Models Yan Wang, Bristol-Myers Squibb, Wallingford, CT
 PharmaSUG 2016 - Paper PO06 Mixed Effects Models Yan Wang, Bristol-Myers Squibb, Wallingford, CT ABSTRACT The MIXED procedure has been commonly used at the Bristol-Myers Squibb Company for quality of life
The Influence of Visual Metaphor Advertising Types on Recall and Attitude According to Congruity-Incongruity
 Volume 118 No. 19 2018, 2435-2449 ISSN: 1311-8080 (printed version); ISSN: 1314-3395 (on-line version) url: http://www.ijpam.eu ijpam.eu The Influence of Visual Metaphor Advertising Types on Recall and
(Week 13) A05. Data Analysis Methods for CRM. Electronic Commerce Marketing
 A05. Data Analysis Methods for CRM. Electronic Commerce Marketing") (Week 13) A05. Data Analysis Methods for CRM Electronic Commerce Marketing Course Code: 166186-01 Course Name: Electronic Commerce Marketing Period: Autumn 2015 Lecturer: Prof. Dr. Sync Sangwon Lee Department:
(Week 13) A05. Data Analysis Methods for CRM Electronic Commerce Marketing Course Code: 166186-01 Course Name: Electronic Commerce Marketing Period: Autumn 2015 Lecturer: Prof. Dr. Sync Sangwon Lee Department:
COMP Test on Psychology 320 Check on Mastery of Prerequisites
 COMP Test on Psychology 320 Check on Mastery of Prerequisites This test is designed to provide you and your instructor with information on your mastery of the basic content of Psychology 320. The results
Identifying the Importance of Types of Music Information among Music Students
 Identifying the Importance of Types of Music Information among Music Students Norliya Ahmad Kassim Faculty of Information Management, Universiti Teknologi MARA (UiTM), Selangor, MALAYSIA Email: norliya@salam.uitm.edu.my
A Citation Analysis of Articles Published in the Top-Ranking Tourism Journals ( )
") University of Massachusetts Amherst ScholarWorks@UMass Amherst Tourism Travel and Research Association: Advancing Tourism Research Globally 2012 ttra International Conference A Citation Analysis of Articles
University of Massachusetts Amherst ScholarWorks@UMass Amherst Tourism Travel and Research Association: Advancing Tourism Research Globally 2012 ttra International Conference A Citation Analysis of Articles
Latin Square Design. Design of Experiments - Montgomery Section 4-2
 Latin Square Design Design of Experiments - Montgomery Section 4-2 Latin Square Design Can be used when goal is to block on two nuisance factors Constructed so blocking factors orthogonal to treatment
Effect of sense of Humour on Positive Capacities: An Empirical Inquiry into Psychological Aspects
 Global Journal of Finance and Management. ISSN 0975-6477 Volume 6, Number 4 (2014), pp. 385-390 Research India Publications http://www.ripublication.com Effect of sense of Humour on Positive Capacities:
To Link this Article: Vol. 7, No.1, January 2018, Pg. 1-11
 Identifying the Importance of Types of Music Information among Music Students Norliya Ahmad Kassim, Kasmarini Baharuddin, Nurul Hidayah Ishak, Nor Zaina Zaharah Mohamad Ariff, Siti Zahrah Buyong To Link
TI-Inspire manual 1. Real old version. This version works well but is not as convenient entering letter
 TI-Inspire manual 1 Newest version Older version Real old version This version works well but is not as convenient entering letter Instructions TI-Inspire manual 1 General Introduction Ti-Inspire for statistics
RANDOMIZED COMPLETE BLOCK DESIGN (RCBD) Probably the most used and useful of the experimental designs.
 Probably the most used and useful of the experimental designs.") Description of the Design RANDOMIZED COMPLETE BLOCK DESIGN (RCBD) Probably the most used and useful of the experimental designs. Takes advantage of grouping similar experimental units into blocks or replicates.
Description of the Design RANDOMIZED COMPLETE BLOCK DESIGN (RCBD) Probably the most used and useful of the experimental designs. Takes advantage of grouping similar experimental units into blocks or replicates.
N12/5/MATSD/SP2/ENG/TZ0/XX. mathematical STUDIES. Wednesday 7 November 2012 (morning) 1 hour 30 minutes. instructions to candidates
 1 hour 30 minutes. instructions to candidates") 88127402 mathematical STUDIES STANDARD level Paper 2 Wednesday 7 November 2012 (morning) 1 hour 30 minutes instructions to candidates Do not open this examination paper until instructed to do so. A graphic
88127402 mathematical STUDIES STANDARD level Paper 2 Wednesday 7 November 2012 (morning) 1 hour 30 minutes instructions to candidates Do not open this examination paper until instructed to do so. A graphic
Statistical Consulting Topics. RCBD with a covariate
 Statistical Consulting Topics RCBD with a covariate Goal: to determine the optimal level of feed additive to maximize the average daily gain of steers. VARIABLES Y = Average Daily Gain of steers for 160
UNIVERSITY OF MASSACHUSETTS Department of Biostatistics and Epidemiology BioEpi 540W - Introduction to Biostatistics Fall 2002
 1 UNIVERSITY OF MASSACHUSETTS Department of Biostatistics and Epidemiology BioEpi 540W - Introduction to Biostatistics Fall 2002 Exercises Unit 2 Descriptive Statistics Tables and Graphs Due: Monday September
Relationships Between Quantitative Variables
 Chapter 5 Relationships Between Quantitative Variables Three Tools we will use Scatterplot, a two-dimensional graph of data values Correlation, a statistic that measures the strength and direction of a
MATH& 146 Lesson 11. Section 1.6 Categorical Data
 MATH& 146 Lesson 11 Section 1.6 Categorical Data 1 Frequency The first step to organizing categorical data is to count the number of data values there are in each category of interest. We can organize
Relationships. Between Quantitative Variables. Chapter 5. Copyright 2006 Brooks/Cole, a division of Thomson Learning, Inc.
 Relationships Chapter 5 Between Quantitative Variables Copyright 2006 Brooks/Cole, a division of Thomson Learning, Inc. Three Tools we will use Scatterplot, a two-dimensional graph of data values Correlation,
A STATISTICAL VIEW ON THE EXPRESSIVE TIMING OF PIANO ROLLED CHORDS
 A STATISTICAL VIEW ON THE EXPRESSIVE TIMING OF PIANO ROLLED CHORDS Mutian Fu 1 Guangyu Xia 2 Roger Dannenberg 2 Larry Wasserman 2 1 School of Music, Carnegie Mellon University, USA 2 School of Computer
RCBD with Sampling Pooling Experimental and Sampling Error
 RCBD with Sampling Pooling Experimental and Sampling Error As we had with the CRD with sampling, we will have a source of variation for sampling error. Calculation of the Experimental Error df is done
Algebra I Module 2 Lessons 1 19
 Eureka Math 2015 2016 Algebra I Module 2 Lessons 1 19 Eureka Math, Published by the non-profit Great Minds. Copyright 2015 Great Minds. No part of this work may be reproduced, distributed, modified, sold,
Frequencies. Chapter 2. Descriptive statistics and charts
 An analyst usually does not concentrate on each individual data values but would like to have a whole picture of how the variables distributed. In this chapter, we will introduce some tools to tabulate
Sociology 7704: Regression Models for Categorical Data Instructor: Natasha Sarkisian
 OLS Regression Assumptions Sociology 7704: Regression Models for Categorical Data Instructor: Natasha Sarkisian A1. All independent variables are quantitative or dichotomous, and the dependent variable
Why t? TEACHER NOTES MATH NSPIRED. Math Objectives. Vocabulary. About the Lesson
 Math Objectives Students will recognize that when the population standard deviation is unknown, it must be estimated from the sample in order to calculate a standardized test statistic. Students will recognize
Block Block Block
 Advanced Biostatistics Quiz 3 Name March 16, 2005 9 or 10 Total Points Directions: Thoroughly, clearly and neatly answer the following two problems in the space given, showing all relevant calculations.
Moving on from MSTAT. March The University of Reading Statistical Services Centre Biometrics Advisory and Support Service to DFID
 Moving on from MSTAT March 2000 The University of Reading Statistical Services Centre Biometrics Advisory and Support Service to DFID Contents 1. Introduction 3 2. Moving from MSTAT to Genstat 4 2.1 Analysis
How to present your paper in correct APA style
 APA STYLE (6 th edition) 1 How to present your paper in correct APA style Julie F. Pallant This document provides a brief overview of how to prepare a journal article or research paper following the guidelines
Model II ANOVA: Variance Components
 Model II ANOVA: Variance Components Model II MS A = s 2 + ns 2 A MS A MS W = ns 2 A (MS A MS W )/n = ns 2 A /n = s2 A Usually Expressed: s 2 A /(s2 A + s2 W ) x 100 Assumptions of ANOVA Random Sampling
For these items, -1=opposed to my values, 0= neutral and 7=of supreme importance.
 1 Factor Analysis Jeff Spicer F1 F2 F3 F4 F9 F12 F17 F23 F24 F25 F26 F27 F29 F30 F35 F37 F42 F50 Factor 1 Factor 2 Factor 3 Factor 4 For these items, -1=opposed to my values, 0= neutral and 7=of supreme
DEMOGRAPHIC DIFFERENCES IN WORKPLACE GOSSIPING BEHAVIOUR IN ORGANIZATIONS - AN EMPIRICAL STUDY ON EMPLOYEES IN SMES
 DEMOGRAPHIC DIFFERENCES IN WORKPLACE GOSSIPING BEHAVIOUR IN ORGANIZATIONS - AN EMPIRICAL STUDY ON EMPLOYEES IN SMES Dr.Vijayalakshmi Kanteti, Professor & Principal, St Xaviers P.G.College, Gopanpally,
What is Statistics? 13.1 What is Statistics? Statistics
 13.1 What is Statistics? What is Statistics? The collection of all outcomes, responses, measurements, or counts that are of interest. A portion or subset of the population. Statistics Is the science of
Subject-specific observed profiles of change from baseline vs week trt=10000u
 Mean of age 1 The MEANS Procedure Analysis Variable : age N Mean Std Dev Minimum Maximum ƒƒƒƒƒƒƒƒƒƒƒƒƒƒƒƒƒƒƒƒƒƒƒƒƒƒƒƒƒƒƒƒƒƒƒƒƒƒƒƒƒƒƒƒƒƒƒƒƒƒƒƒƒƒƒƒƒƒƒƒƒƒƒƒƒƒƒ 109 55.5321101 12.1255537 26.0000000 83.0000000
K3. Why did the certain ethnic mother put her baby in a crib with 20-foot high legs? So she could hear it if it fell out of bed.
 Factor Analysis 1 COM 531, Spring 2009 K. Neuendorf MODEL: From Group Humor Data Set-- Responses to jokes: K1 K2 F1. F2. F3. F4. F5 K29 F6 K30 K31 For all items K1-K31, 0=not funny at all, 10=extremely
WEB APPENDIX. Managing Innovation Sequences Over Iterated Offerings: Developing and Testing a Relative Innovation, Comfort, and Stimulation
 WEB APPENDIX Managing Innovation Sequences Over Iterated Offerings: Developing and Testing a Relative Innovation, Comfort, and Stimulation Framework of Consumer Responses Timothy B. Heath Subimal Chatterjee
Chapter 27. Inferences for Regression. Remembering Regression. An Example: Body Fat and Waist Size. Remembering Regression (cont.)
") Chapter 27 Inferences for Regression Copyright 2007 Pearson Education, Inc. Publishing as Pearson Addison-Wesley Slide 27-1 Copyright 2007 Pearson Education, Inc. Publishing as Pearson Addison-Wesley An
Chapter 27 Inferences for Regression Copyright 2007 Pearson Education, Inc. Publishing as Pearson Addison-Wesley Slide 27-1 Copyright 2007 Pearson Education, Inc. Publishing as Pearson Addison-Wesley An
YOUR NAME ALL CAPITAL LETTERS
 THE TITLE OF THE THESIS IN 12-POINT CAPITAL LETTERS, CENTERED, SINGLE SPACED, 2-INCH FORM TOP MARGIN by YOUR NAME ALL CAPITAL LETTERS A THESIS Submitted to the Graduate Faculty of Pacific University Vision
Acoustic Echo Canceling: Echo Equality Index
 Acoustic Echo Canceling: Echo Equality Index Mengran Du, University of Maryalnd Dr. Bogdan Kosanovic, Texas Instruments Industry Sponsored Projects In Research and Engineering (INSPIRE) Maryland Engineering
CREATE NEW VALUE. High Speed Multi Tester for Blu-ray TM (BD-R, RE and ROM)
") High Speed Multi Tester for Blu-ray TM (BD-R, RE and ROM) Contents About PULSTEC BD (SL/DL), (TL/QL) New measurement items for (i-mlse, R-SER ) Write strategy Adjustment based on Specifications Write and
High Speed Multi Tester for Blu-ray TM (BD-R, RE and ROM) Contents About PULSTEC BD (SL/DL), (TL/QL) New measurement items for (i-mlse, R-SER ) Write strategy Adjustment based on Specifications Write and
Perceptions and predictions of expertise in advanced musical learners
 Perceptions and predictions of expertise in advanced musical learners 1 Introduction The nature of expertise The concept of expertise in popular thought has been related to notions of talent, skill, specialisation,
K3. Why did the certain ethnic mother put her baby in a crib with 20-foot high legs? So she could hear it if it fell out of bed.
 Factor Analysis 1 COM 531, Spring 2008 K. Neuendorf MODEL: From Group Humor Data Set-- Responses to jokes: K1 K2 F1. F2. F3. F4. F5 K29 F6 K30 K31 For all items K1-K31, 0=not funny at all, 10=extremely
Bootstrap Methods in Regression Questions Have you had a chance to try any of this? Any of the review questions?
 ICPSR Blalock Lectures, 2003 Bootstrap Resampling Robert Stine Lecture 3 Bootstrap Methods in Regression Questions Have you had a chance to try any of this? Any of the review questions? Getting class notes
in the Howard County Public School System and Rocketship Education
 Technical Appendix May 2016 DREAMBOX LEARNING ACHIEVEMENT GROWTH in the Howard County Public School System and Rocketship Education Abstract In this technical appendix, we present analyses of the relationship
Resampling Statistics. Conventional Statistics. Resampling Statistics
 Resampling Statistics Introduction to Resampling Probability Modeling Resample add-in Bootstrapping values, vectors, matrices R boot package Conclusions Conventional Statistics Assumptions of conventional
Mixed models in R using the lme4 package Part 2: Longitudinal data, modeling interactions
 Mixed models in R using the lme4 package Part 2: Longitudinal data, modeling interactions Douglas Bates 2011-03-16 Contents 1 sleepstudy 1 2 Random slopes 3 3 Conditional means 6 4 Conclusions 9 5 Other
The interaction of cartoonist s gender and formal features of cartoons*
 The interaction of cartoonist s gender and formal features of cartoons* ANDREA C. SAMSON and OSWALD HUBER Abstract The present study investigates gender di erences in the use of formal features of cartoons,
NAA ENHANCING THE QUALITY OF MARKING PROJECT: THE EFFECT OF SAMPLE SIZE ON INCREASED PRECISION IN DETECTING ERRANT MARKING
 NAA ENHANCING THE QUALITY OF MARKING PROJECT: THE EFFECT OF SAMPLE SIZE ON INCREASED PRECISION IN DETECTING ERRANT MARKING Mudhaffar Al-Bayatti and Ben Jones February 00 This report was commissioned by
Abstract. Keywords Movie theaters, home viewing technology, audiences, uses and gratifications, planned behavior, theatrical distribution
 Alec Tefertiller alect@ksu.edu Assistant professor. Kansas State University in Manhattan, Kansas, USA. Submitted January 23, 2017 Approved May 22, 2017 Abstract 2017 Communication & Society ISSN 0214-0039
Trufan: Role Of Fandom As An Influence On Attitude
 Trufan: Role Of Fandom As An Influence On Attitude Dr Stephen Dann, Echo Base, Hoth Advertising Marketing and Public Relations, Queensland University Technology, Brisbane, Australia Abstract Stars Wars
hprints , version 1-1 Oct 2008
 Author manuscript, published in "Scientometrics 74, 3 (2008) 439-451" 1 On the ratio of citable versus non-citable items in economics journals Tove Faber Frandsen 1 tff@db.dk Royal School of Library and
abc Mark Scheme Statistics 3311 General Certificate of Secondary Education Higher Tier 2007 examination - June series
 abc General Certificate of Secondary Education Statistics 3311 Higher Tier Mark Scheme 2007 examination - June series Mark schemes are prepared by the Principal Examiner and considered, together with the
K-Pop Idol Industry Minhyung Lee
 K-Pop Idol Industry 20100663 Minhyung Lee 1. K-Pop Idol History 2. Idol Industry Factor 3. Regression Analysis 4. Result & Interpretation K-Pop Idol History (1990s) Turning point of Korean Music history
Perceptual dimensions of short audio clips and corresponding timbre features
 Perceptual dimensions of short audio clips and corresponding timbre features Jason Musil, Budr El-Nusairi, Daniel Müllensiefen Department of Psychology, Goldsmiths, University of London Question How do
ECONOMICS 351* -- INTRODUCTORY ECONOMETRICS. Queen's University Department of Economics. ECONOMICS 351* -- Winter Term 2005 INTRODUCTORY ECONOMETRICS
 Queen's University Department of Economics ECONOMICS 351* -- Winter Term 2005 INTRODUCTORY ECONOMETRICS Winter Term 2005 Instructor: Web Site: Mike Abbott Office: Room A521 Mackintosh-Corry Hall or Room
Despite the widespread adoption of stalking legislation, there is no definitive antistalking
 THE INFLUENCE OF PRIOR RELATIONSHIP ON PERCEPTIONS OF STALKING IN THE UNITED KINGDOM AND AUSTRALIA ADRIAN J. SCOTT Edith Cowan University REBECCA LLOYD JEFF GAVIN University of Bath Research in the United
PROC GLM AND PROC MIXED CODES FOR TREND ANALYSES FOR ROW-COLUMN DESIGNED EXPERIMENTS
 PROC GLM AND PROC MIXED CODES FOR TREND ANALYSES FOR ROW-COLUMN DESIGNED EXPERIMENTS BU-1491-M June,2000 Walter T. Federer Dept. of Biometrics Cornell University Ithaca, NY 14853 wtfl@cornell.edu and Russell
Best Pat-Tricks on Model Diagnostics What are they? Why use them? What good do they do?
 Best Pat-Tricks on Model Diagnostics What are they? Why use them? What good do they do? Before we get started feel free to download the presentation and file(s) being used for today s webinar. http://www.statease.com/webinar.html
STAT 113: Statistics and Society Ellen Gundlach, Purdue University. (Chapters refer to Moore and Notz, Statistics: Concepts and Controversies, 8e)
") STAT 113: Statistics and Society Ellen Gundlach, Purdue University (Chapters refer to Moore and Notz, Statistics: Concepts and Controversies, 8e) Learning Objectives for Exam 1: Unit 1, Part 1: Population
STAT 113: Statistics and Society Ellen Gundlach, Purdue University (Chapters refer to Moore and Notz, Statistics: Concepts and Controversies, 8e) Learning Objectives for Exam 1: Unit 1, Part 1: Population
Release Year Prediction for Songs
 Release Year Prediction for Songs [CSE 258 Assignment 2] Ruyu Tan University of California San Diego PID: A53099216 rut003@ucsd.edu Jiaying Liu University of California San Diego PID: A53107720 jil672@ucsd.edu
Open access press vs traditional university presses on Amazon
 Open access press vs traditional university presses on Amazon Rory McGreal (PhD),* Edward Acqua** * Professor & Assoc. VP, Research at Athabasca University. ** Analyst, Institutional Studies section of
Interlingual Sarcasm: Prosodic Production of Sarcasm by Dutch Learners of English
 Universiteit Utrecht Department of Modern Languages Bachelor s Thesis Interlingual Sarcasm: Prosodic Production of Sarcasm by Dutch Learners of English Name: Diantha de Jong Student Number: 3769615 Address:
Blueline, Linefree, Accuracy Ratio, & Moving Absolute Mean Ratio Charts
 INTRODUCTION This instruction manual describes for users of the Excel Standard Celeration Template(s) the features of each page or worksheet in the template, allowing the user to set up and generate charts
2012, the Author. This is the final version of a paper published in Participations: Journal of Audience and Reception Studios.
 2012, the Author. This is the final version of a paper published in Participations: Journal of Audience and Reception Studios. Reproduced in accordance with the publisher s self- archiving policy. Redfern,
Setting Energy Efficiency Requirements Using Multivariate Regression
 Setting Energy Efficiency Requirements Using Multivariate Regression Matt Malinowski, ICF, Presenter Dan Baldewicz, ICF EEDAL 2017 Irvine, CA September 13, 2017 About ICF ICF (NASDAQ:ICFI) is a global
The Time Series Forecasting System Charles Hallahan, Economic Research Service/USDA, Washington, DC
 INTRODUCTION The Time Series Forecasting System Charles Hallahan, Economic Research Service/USDA, Washington, DC The Time Series Forecasting System (TSFS) is a component of SAS/ETS that provides a menu-based
Linear mixed models and when implied assumptions not appropriate
 Mixed Models Lecture Notes By Dr. Hanford page 94 Generalized Linear Mixed Models (GLMM) GLMMs are based on GLM, extended to include random effects, random coefficients and covariance patterns. GLMMs are
Effect of Compact Disc Materials on Listeners Song Liking
 University of Redlands InSPIRe @ Redlands Undergraduate Honors Theses Theses, Dissertations & Honors Projects 2015 Effect of Compact Disc Materials on Listeners Song Liking Vanessa A. Labarga University
Supplemental Information. Dynamic Theta Networks in the Human Medial. Temporal Lobe Support Episodic Memory
 Current Biology, Volume 29 Supplemental Information Dynamic Theta Networks in the Human Medial Temporal Lobe Support Episodic Memory Ethan A. Solomon, Joel M. Stein, Sandhitsu Das, Richard Gorniak, Michael
Supplemental Information. Form and Function in Human Song. Samuel A. Mehr, Manvir Singh, Hunter York, Luke Glowacki, and Max M.
 Current Biology, Volume 28 Supplemental Information Form and Function in Human Song Samuel A. Mehr, Manvir Singh, Hunter York, Luke Glowacki, and Max M. Krasnow 1.00 1 2 2 250 3 Human Development Index
MATH 214 (NOTES) Math 214 Al Nosedal. Department of Mathematics Indiana University of Pennsylvania. MATH 214 (NOTES) p. 1/3
 Math 214 Al Nosedal. Department of Mathematics Indiana University of Pennsylvania. MATH 214 (NOTES) p. 1/3") MATH 214 (NOTES) Math 214 Al Nosedal Department of Mathematics Indiana University of Pennsylvania MATH 214 (NOTES) p. 1/3 CHAPTER 1 DATA AND STATISTICS MATH 214 (NOTES) p. 2/3 Definitions. Statistics is
MATH 214 (NOTES) Math 214 Al Nosedal Department of Mathematics Indiana University of Pennsylvania MATH 214 (NOTES) p. 1/3 CHAPTER 1 DATA AND STATISTICS MATH 214 (NOTES) p. 2/3 Definitions. Statistics is
Estimation of inter-rater reliability
 Estimation of inter-rater reliability January 2013 Note: This report is best printed in colour so that the graphs are clear. Vikas Dhawan & Tom Bramley ARD Research Division Cambridge Assessment Ofqual/13/5260
The Criteria and Variables Affecting the Selection of Quality Book Ideally Suited for Translation: The Perspectives of King Saud University Staff
 International Journal of Comparative Literature Translation Studies ISSN 2202-9451 Vol. 3 No. 2; April 2015 Australian International Academic Centre, Australia Flourishing Creativity Literacy The Criteria
The Relationship Between Movie Theatre Attendance and Streaming Behavior. Survey insights. April 24, 2018
 The Relationship Between Movie Theatre Attendance and Streaming Behavior Survey insights April 24, 2018 Overview I. About this study II. III. IV. Movie theatre attendance and streaming consumption Quadrant
CONCLUSION The annual increase for optical scanner cost may be due partly to inflation and partly to special demands by the State.
 Report on a Survey of Changes in Total Annual Expenditures for Florida Counties Before and After Purchase of Touch Screens and A Comparison of Total Annual Expenditures for Touch Screens and Optical Scanners.
Supplementary Figures Supplementary Figure 1 Comparison of among-replicate variance in invasion dynamics
 1 Supplementary Figures Supplementary Figure 1 Comparison of among-replicate variance in invasion dynamics Scaled posterior probability densities for among-replicate variances in invasion speed (nine replicates
Channel Repertoires: Using Peoplemeter Data in Beijing. Elaine J. Yuan and James G. Webster. Northwestern University
 OPERATIONALIZING CHANNEL REPERTOIRE 1 Channel Repertoires: Using Peoplemeter Data in Beijing Elaine J. Yuan and James G. Webster Northwestern University This research was made possible, in part, by the
Learning Skills Centre
 Learning Skills Centre ** The LSC recommends the use of the FormatEase CD-ROM, available at the UNBC Bookstore, as an aid to formatting and automatic referencing. American Psychological Association (APA)
CS229 Project Report Polyphonic Piano Transcription
 CS229 Project Report Polyphonic Piano Transcription Mohammad Sadegh Ebrahimi Stanford University Jean-Baptiste Boin Stanford University sadegh@stanford.edu jbboin@stanford.edu 1. Introduction In this project
The Relationship Between Movie theater Attendance and Streaming Behavior. Survey Findings. December 2018
 The Relationship Between Movie theater Attendance and Streaming Behavior Survey Findings Overview I. About this study II. III. IV. Movie theater attendance and streaming consumption Quadrant Analysis:
Improving music composition through peer feedback: experiment and preliminary results
 Improving music composition through peer feedback: experiment and preliminary results Daniel Martín and Benjamin Frantz and François Pachet Sony CSL Paris {daniel.martin,pachet}@csl.sony.fr Abstract To
Visible Vibrations (originally Chladni Patterns) - Adding Memory Buttons. Joshua Gutwill. August 2002
 - Adding Memory Buttons. Joshua Gutwill. August 2002") (originally Chladni Patterns) - Adding Memory Buttons Joshua Gutwill August 2002 Keywords: 1 (originally Chladni Patterns) Adding Memory Buttons
(originally Chladni Patterns) - Adding Memory Buttons Joshua Gutwill August 2002 Keywords: 1 (originally Chladni Patterns) Adding Memory Buttons
The Influence of Open Access on Monograph Sales
 The Influence of Open Access on Monograph Sales The experience at Amsterdam University Press Ronald Snijder Published in LOGOS 25/3, 2014, page 13 23 DOI: 10.1163/1878 Ronald Snijder has been involved
Klee or Kid? The subjective experience of drawings from children and Paul Klee Pronk, T.
 UvA-DARE (Digital Academic Repository) Klee or Kid? The subjective experience of drawings from children and Paul Klee Pronk, T. Link to publication Citation for published version (APA): Pronk, T. (Author).
Preservice Elementary Classroom Teachers Attitudes Toward Music in the School Curriculum and Teaching Music
 Research & Issues in Music Education Volume 8 Number 1 Research & Issues in Music Education, v.8, 2010 Article 4 2010 Preservice Elementary Classroom Teachers Attitudes Toward Music in the School Curriculum
THE CROSSPLATFORM REPORT
 STTE OF THE MEDI THE CROSSPLTFORM REPORT QURTER, 0 UNDERSTNDING THE VIDEO CONSUMER The average merican today has more ways to watch video whenever, however and wherever they choose. While certain segments
Histograms and Frequency Polygons are statistical graphs used to illustrate frequency distributions.
 Number of Families II. Statistical Graphs section 3.2 Histograms and Frequency Polygons are statistical graphs used to illustrate frequency distributions. Example: Construct a histogram for the frequency
Sample APA Paper for Students Interested in Learning APA Style 6 th Edition. Jeffrey H. Kahn. Illinois State University
 Running head: SAMPLE FOR STUDENTS 1 Sample APA Paper for Students Interested in Learning APA Style 6 th Edition Jeffrey H. Kahn Illinois State University Author Note Jeffrey H. Kahn, Department of Psychology,
A Close Look at African Americans in Theater in the Past, Present, and Future Alexandra Daniels. Class of 2017
 A Close Look at African Americans in Theater in the Past, Present, and Future Alexandra Daniels. Class of 2017 Executive Summary: African Americans have a long-standing and troublesome relationship with
Review of the Technology-Utilization Level of String Instrument Teachers
 Review of the Technology-Utilization Level of String Instrument Teachers Didem Döğer Güzel Sanatlar Lisesi, Ministry of National Education, Diyarbakır, Turkey didemdoger@hotmail.com Ilgım Kılıç Başkent
Proceedings of the Third International DERIVE/TI-92 Conference
 Description of the TI-92 Plus Module Doing Advanced Mathematics with the TI-92 Plus Module Carl Leinbach Gettysburg College Bert Waits Ohio State University leinbach@cs.gettysburg.edu waitsb@math.ohio-state.edu