OT BioLab+ UserManual v1.0 for software version 1.0.*.*
|
|
|
- Melissa Cummings
- 5 years ago
- Views:
Transcription

1 OT BioLab+ UserManual v1.0 for software version 1.0.*.* 1
2 Sommario 1 Introduction OT BioLab+ installation Driver installation EMG-USB drivers DUE PRO drivers Main Interface Settings & Privacy Acquisition Setup Signal Acquisition Real Time Processing Move Track To Activation Map Activation Map EEG ARV Bar ARV Chart Differential FFT Trapezoidal Feedback Signal Review File extension Reviewing a signal Signal export Signal Processing Absolute value Amplitude Band Pass EEG Calibration
3 10.5 Convolution Conduction velocity estimation Data approximation Decomposition > Decomponi Decomposition > Extract Motor Units Decomposition > Mean firing rate Derivative Envelope FFT Filtering Frequency Activation Map Max Min and Mean PSD Quality controller buffer/ramp Sum Time shift Matlab codes OTComm PC Requirements Problem solving OT BioLab Light
4 1 Introduction OT BioLab+ is an acquisition and processing tool developed by OT Bioelettronica. It is a freeware software downloadable at in the Download section. Tutorials are available at in the Tutorial section. OT BioLab+ allows to acquire, review and process bioelectrical signals detected using the OT Bioelettronica devices listed below: EMG-USB2+: surface and intramuscular electromyographic amplifier, up to 256 channels. Each input can acquire signals with a different acquisition mode. QUATTROCENTO: surface and intramuscular electromyographic amplifier, up to 400 channels. Using OT BioLab+ it is also possible to review and process any kind of signals stored in txt format. OT BioLab+ has been designed for.net Framework 4.0, Windows 10 operating both with 64 bit. 4
, click Next to continue. Now, the license agreement window appears (see Fig. 2.1). Read carefully the license condition and click Next to continue.")
5 2 OT BioLab+ installation OT BioLab+ installation procedure requires few minutes and allows to install the software and preinstall the drivers for EMG-USB, QUATTRO and DUEPRO. Extract and run the OT BioLab+ setup file. The start-up window will appear (see Fig. 2.1), click Next to continue. Now, the license agreement window appears (see Fig. 2.1). Read carefully the license condition and click Next to continue. FIG OT BioLab+ license agreement window. The next step require to choose which drivers (depending on which device you own) (see Fig. 2.2). Again, click Next to proceed. 5


6 Fig OT BioLab+ Custom installation. It is possible to create a desktop shortcut (see Fig. 2.3). Fig Desktop Shortcut. 6
7 Now the software is ready to be installed (see Fig.2.4). Fig OT BioLab+ installation window. 7
8 3 Driver installation Drivers installation depends on how many drivers you choose to install. 3.1 EMG-USB drivers The installation of EMG-USB drivers can be completed just clicking Next on Fig 3.1. After some seconds drivers will be installed and you will reach Fig 3.2. Fig EMG-USB drivers installation window. 8

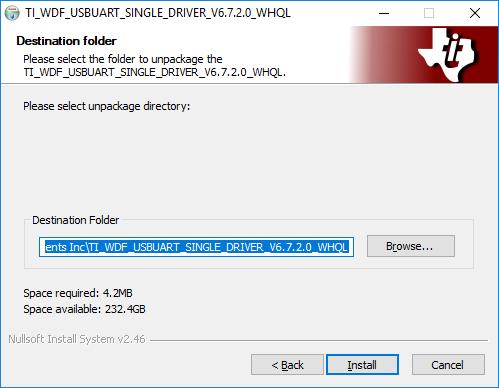
9 Fig EMG-USB drivers installed. 3.2 DUE PRO drivers In order to use Due Pro, some steps are required. These windows open automatically during installation. 1. Install FTDI CDM Drivers 2. Click Next. 3. Accept agreement 9


10 4. FTDI CDM drivers installed. 5. Install Texas Instrument drivers. Click Next. 10

11 6. Accept agreement. 7. Install 11
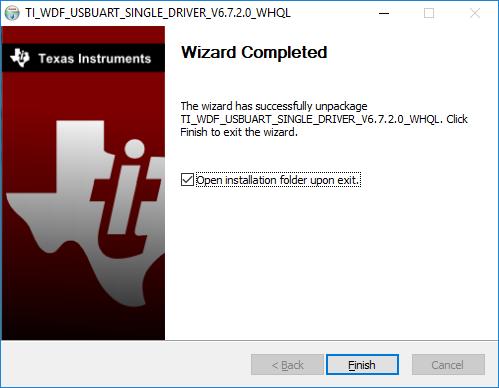
12 8. Open installation folder. 12

13 9. Run Setup.exe and click Next 10. Accept the agreement 13


14 11. Install 12. Texas instrument drivers installed. 14

15 13. Install Virtual Com port drivers Install 15
\stmicroelectronics\software\virtual")
16 16. Open the folder C:\Program Files (x86) 17. Go to C:\Program Files (x86)\stmicroelectronics\software\virtual comport driver 16
17 18. Choose the right folder. If you have Windows 10, then choose Windows 8 folder. 19. Choose the file depending on your operative system. If your operative system is 64 bits, choose dpinst_amd64.exe, otherwise choose dpinst_x86.exe 20. Run it 17
18 21. Driver installed. 18
.")
19 4 Main Interface Running OT BioLab+ you will meet the main interface, shown in Figure 4.1. File tool strip drop down list let open, import or save files (Figure 4.2). Subject tool strip drop down list let you manage subject database, adding new subjects or editing them. 19


20 Tool let you edit settings, language and theme of the interface. View let you change positioning of toolbar or see the abstract of the opened file. Acquisition let you control the acquisition process. 5 Settings & Privacy Settings form let you control some accessories parameters, like default saving folder, Setup style, Font, Privacy or device settings. Privacy let you choose which info you want to share with OT Bioelettronica. Info requested are only for statistical reason, in order to improve OT BioLab performance. No acquired data will ever be shared with OT Bioelettronica. 6 Acquisition Setup In order to setup your acquisition, choose your device and sampling frequency. Then fill the form with Adapters, Electrodes and Parameters you want for you acquisition. When you finish the setup, click on Setup complete to save it. 20

21 Fig OT BioLab+ Acquisition Setup Editor TreeView. You can choose between TreeView Setup and Grid Setup. In order to choose it, look in the Settings form. 7 Signal Acquisition In order to start an acquisition, click on Acquisition > Start Visualization or click on the Play button on the toolbar from the main interface. After pressing start visualization, 3 forms are visible: 1. Main: main interface, where acquired signals are always visible. 2. Channel List Real Time: a resume list that shows which signals are available and where. 21

22 3. Performances: a chart that keeps the user informed of performances required by the acquisition. If it grows too high, there is the risk of acquisition fail and data loss. Fig OT BioLab+ Signal Acquisition Interface. Clicking on Acquisition > Start Recording, a file start being filled with data acquired. Clicking Acquisition > Stop Visualization, acquisition will be stopped without saving. Clicking Acquisition > Stop Recording acquisition will be stopped and saving process will start. When saving, choose the subject that performed the experiment selecting it from the subject database and then save it where you prefer. At the end of saving process, acquisition will restart automatically. 8 Real Time Processing One of the most important improvements of OT BioLab+ is the introduction of Real Time Processing. They can be called from the Real Time Channel List right clicking on the signal of interest and choosing the processing you prefer. 22


23 8.1 Move Track To... This processing let you clone the track on another form in order to have a copy of the signal and see it better. 8.2 Activation Map This processing is available only for matrices 32 or 64 channels and let you see an activation map in order to identify the zone that is more active. A real time barycentre is shown on it. Colour of the map depends on the amplitude of the ARV of signal acquired. Refresh epochs are 1Hz, 2Hz or 4Hz. 23


24 8.3 Activation Map EEG Colour of the map depends on the amplitude of the ARV of signal acquired. The refresh rate is 1Hz and. 8.4 ARV Bar This processing shows the bar chart whose value is the amplitude of ARV computed on an epoch of 62.5 ms. The refresh rate is 16 Hz. 24

25 8.5 ARV Chart This processing shows a chart with the value of amplitude of ARV computed of an epoch of 62.5 ms. The refresh rate is 16 Hz. 8.6 Differential This processing is available only for matrices 32 or 64 channels. This processing will ask confirm about which is the matrix used for recording and will ask the direction of differential. Then it will compute the number of groups to plot (depending on matrix and direction) and will fill it with the difference between the correct signals. 25


26 8.7 FFT This processing can be applied only to a single signal and shows the FFT over the last second acquired. 26

27 8.8 Trapezoidal Feedback Trapezoidal feedback let you perform experiments when you have to follow a path. Though the Settings button you can access to settings of the path. You can record the MVC using the start MVC or writing it on your own. A timer is implemented to help you performing MVC. Clicking on Start Protocol the yellow dot start moving on the screen leaving a blue drift, so that it is possibile to see the requested path and the performed path. Refresh rate is 16 Hz. 9 Signal Review OT BioLab+ allows to open and review different file types. There are two methods to load a file: using the Open function under the File menu or from the Menu toolbar, or using the Import function under the same menu and toolbar. The Open method simply open a new file and, in case other signals are currently opened, they will be closed (if they are not saved a prompt will ask the user if the user want to save them). The Import method keep the currently opened signals and adds the new ones under them. 27
28 The Import function can be particularly useful, for example, when signals recorded using more μemg-s devices have to be managed. 9.1 File extension OT BioLab+ can manage different kind of files: otb+: files created by OT BioLab+ containing acquired signals, setup details, subject information, processing data and workspace. otb: files created by OT BioLab containing acquired signals, setup details, subject information, processing data and workspace. brx: files generated by bruxoff and containing two EMG signals and one ECG signal. emg: files generated by μemg or μemg-s and containing a single EMG channel. frc: files generated by P-ForceMet and containing a single force channel. bio: files generated by foremg and containing 4 EMG signals. txt: any text file containing data can be opened. To open it, OT BioLab require some details regarding the format. For this reason a Text File Information window appears asking the user to choose the decimal separator, the columns delimiter, the time column or at least the time increment between subsequent lines. When all the information are inserted it is possible to open the data. All files, once opened, can be processed, manipulated and saved as.otb+ file. 9.2 Reviewing a signal When opening a signal in Review Mode, OT BioLab+ displays a window similar to Fig.9.1. The tracks are displayed in the same way as for Visualization Mode and the same options to manage the tracks are available during the review (refer to Tracks options section). 28

29 FIG Screenshot during signal review showing an example of signals. Epochs In Review Mode, the signals are segmented in epochs. The epoch size can be defined by the user in the Set Epoch field, in the toolbar. The epoch segmentation is necessary for several processing plug-in. The signals can be selected in two ways: a left click on the Sensor name area selects the entire signals, a drag through the desired epoch while pressing the left mouse button selects a group of subsequent epochs. Edit Toolbar When more signals have been detected from a single sensor, they are grouped together by creating a multiple track. In Review Mode, it is possible to group and ungroup signals as desired. To ungroup signals select a multiple tracks and then press the minus green button on the Edit toolbar or select Edit ->Ungroup Selected Tracks from the main menu bar. All the signals related to the original sensor will be spitted in single tracks and moved under the last signal, in the bottom part of the OT BioLab+ Review window. The name of single tracks will be assigned automatically by keeping the enumeration of sensor channels. 29
30 To group together two or more signals select the desired signals and then press the plus green button on the Edit toolbar or select Edit ->Group Selected Tracks from the main menu bar. The new multiple track generated will be moved under the last signal, in the bottom part of the OT BioLab+ Review window. A given track can be deleted if desired, by selecting the track an pressing the Delete red button on the Edit toolbar or selecting Edit ->Delete Selected Tracks from the main menu bar. Even if the track and related signals are no longer displayed, in any case, the originally acquired data is preserved in the otb+ file. View Toolbar The View toolbar and the View menu include several options for the review of signals. The available functions are: Zoom In: increases the time view resolution by reducing the time window displayed. This function it is also accessible by using the mouse scroll wheel together with the CTRL button. Zoom Out: decreases the time view resolution by enlarging the time window displayed. This function is also accessible by using the mouse scroll wheel together with the CTRL button. Zoom to Selection: expand the time selection to fit the full screen. Fit in Window: fits the entire signals to the full screen. Subject Toolbar Every signal acquired has to be stored together with subject details. For each subject it is possible to create a record containing all the related data. The records are collected into a database. OT BioLab give the user the possibility to manage different databases. This feature can be useful for privacy aspects when more user use the same PC but they don t want to share the subjects information. By default one database is created by OT BioLab during installation in a folder managed by the O.S. that the user can t access directly. If the user do not need more than one database no operation are required, automatically the default database is used and all the operation are performed on it. Alternatively, under Subjects -> 30

31 Manage Database it is possible to create a new database or select an existing one. The database created by the user can be saved everywhere on the hard drive or external memory devices with the desired filename. The extension, by default is.otdb. When a user database is selected, OT BioLab keep memory of the database even when the software is restarted. In case file.otd is removed, renamed or moved from the originally folder, by default the software switch to the default database. FIG Subject Editor window. It allows to add a new subject to the database or edit the information related to an existing subject. Subjects can be add to the database at the end of a recording, but it is also possible to insert new subjects at any time. In particular, it is possible to add new subjects to the database or find and edit the subjects record. Pressing the Add New Subject button in the Subject toolbar, the Subject Editor window appears (see Fig. 9.2). All the 31
32 information related to a subject can be typed, few of them are compulsory, and then, pressing the OK button, the subject is added to the database. In case some information related to one subject has to be modified, it is possible to search the subject into the database, and then edit any desired field. The Find/Edit Subject button on the Subject toolbar open the search window. Any parameter of a subject can be used to find its record into the database. 9.3 Signal export It is possible to export the signals acquired using OT BioLab to use them with different software (e.g. Matlab, Excel, LabView...). Two are the methods to export the signals: Selected signal(s) or Raw data set. Using the option Selected signal(s) it is possible to export single or multiple traks, the result of a processing or a subgroup of signals acquired. The export can be done using different file type: Binary, CSV or Matlab files. Refer to the following paragraph for further details. The Raw data set option allows to export the entire data set related to an acquisition. All the signals originally acquired and for the entire acquisition time are exported together regardless of any applied selection. The signals are exported in binary format. Export binary data To use this option, during review, choose File->Export->Raw data setfrom the main menu bar. The signals exported are saved as a.sig file. All the signals originally acquired and for the entire acquisition time are exported together regardless of any applied selection. The.sig file exportedis a binary file structured as a number of row equal to the number of channels acquired (i.e. number of rows occupied by sensors in the setup used during the acquisition) and a number of columns that depends on the signals duration. The sample values are signed short in the range The following formula can be used to obtain the signals amplitude x at the input of the amplifier, given each binary value N in the.sig file: 32
33 where: x = N V AD ADRES Gain [mv]; VAD is thea/d converter input range in volts ADRES is the A/D converter resolution Gain is the gain used during the acquisition for the corresponding channel 1000 allow to obtain the result in mv. For example, when using EMG-USB, EMG-USB2 and MEBA, the A/D converter input range (VAD) is 5 V, the resolution (ADRES) is 12 bits and the Gain for each sensor can be find in the abstract file. Note that the gain for AUX channels is 0.5 V/V since the inputs accept -5 5V dynamics, but the A/D converter input range is 0 5V. Export CSV data Single channels, subgroups of acquired channels or processing results can be exported in CSV (comma separated value) format. To export a.csv file select the desired tracks, choose File->Export->Selected signal(s)->as CSV file... from the main menu toolbar. An error will occur if track with different sampling frequency are selected to be exported together. After the filename and the position has been selected the Export Settings window is displayed (see Fig. 9.3) where it is possible to select the type of header and decimal separator. FIG Export Settings window. It allows to set the exporting options. The data is exported with signals amplitude estimated by OT BioLab representing the input signals at the amplifier inputs, taking into account the gain used during the acquisition. By default the time columns is added and the measurement units are indicated in the file header. Note that it is not possible to export simultaneously different tracks if they has been acquired with different sample frequencies. Export Matlab Files 33
34 Single channels, subgroups of acquired channels or processing results can be exported in as a Matlab file. To export a.mat file select the desired tracks, choose File->Export- >Selected signal(s)->as MAT file... from the main menu toolbar. An error will occur if track with different sampling frequency are selected to be exported together. The.mat file exported can be open using Matlab. After the file has been open different variables will be added to the workspace: Data: an N-by-M matrix containing the exported data, N is the number of samples exported, M is the number of channels exported; Description: an M row vector containing the description of each channel exported; OTBFile: is the path and filename of the.otb file where the data has been exported; SamplingFrequency: is the value in Hz; Time: is an N row vector containing the time instant for each sample of the exported data. After the file loading the Matlab command plot(time, Data(:,1)) will produce a graph of the first channel exported versus the time. 10 Signal Processing OT BioLab allows to process any kind of signals managed by the software itself (refer to the File Extension section). The processing tools are available in Review Mode. Processing functions are accessible under the Processing menu or with right click on channel list. There are processing plugins that can be only applied to single tracks and other processing can be applied both to a single tracks or to a multiple tracks (refer to Track Options section). All the processing tools do not change the recorded signals but generate new tracks under the last existing track. 34
35 10.1 Absolute value The plugin, when applied, simply rectify the signals Amplitude This processing tool use two standard amplitude estimators to generate two new single tracks containing the results. The estimators are the Average Rectified Value (ARV) and the Root Mean Square (RMS). The two tracks generated are added under the last existing track. In both cases a value for every epoch is calculated and displayed as a point in the middle of each epoch. When the zoom is set to display more epochs, the points are connected each other by displaying a line between each adjacent points. The estimation of ARV (AARV) is obtained for the epoch i using the following formula: Where: A ARV (i) = 1000 N N x K K=1 [μv]; - N is the number of samples per epoch - xk is the amplitude of the signal at the input of the amplifier in mv allows to obtain the result in μv. The estimation of RMS (ARMS) is obtained for the epoch i using the following formula: A RMS (i) = N x K 2 N K=1 [μv]; Where: - N is the number of samples per epoch. - xk is the amplitude of the signal at the input of the amplifier in mv allow to obtain the result in μv Band Pass EEG This processing will extract from one signal 5 signals whit 5 eeg bands (see Fig 10.1). 35

36 FIG Band Pass EEG parameters Calibration This processing plugin can be used to calibrate a signal acquired for example using a load cell to obtain the trace directly expressed in the correct measurement unit and with the correct scale. Morover it is possible to remove an offset to obtain the correct zero level Convolution This processing performs convolution between two signals in order to recognize the highest cross correlation between them. Once it recognize it, it will shift in time the second signal in order to align them Conduction velocity estimation This tool has been designed for the estimation of conduction velocity (CV) from single differential signals detected by an electrode array. It is possible to use three different plug-ins to estimate the CV. The first plug-in that appears in the dropdown menu under CV Estimation is named Conduction velocity Phase Delay (3 signals) and it requires three single differential 36
37 signals to estimate a CV value. The three signals must be three single tracks selected by the user. The tracks can be grouped or ungrouped. In case the user needs to use the free selection on tracks it is recommended to group tracks to optimize the selection. The algorithm calculates two double differential signals from the three single differential signals and then estimates the delay between the two signals obtained in a least square sense in the frequency domain. For further details on the delay estimation refer to: McGill K.C., Dorfman L.J. High-resolution alignment of sampled waveforms. IEEE Trans Biomed Eng, BME-31: , 1984 Once the delay is estimated, CV is obtained dividing the distance between electrodes by the delay obtained. The indication of the Inter Electrodic Distance (IED) is first of all searched in the sensor name field of the signals, in case it is not found it is asked to the user. The track containing the results is added under the last existing track. A value for every epoch is calculated and displayed as a point in the middle of each epochs. When the zoom is set to display more epochs, the points are connected each other by displaying a line between each adjacent points. The second plug-in that it is implemented is based on a different algorithm and is named Multichannel Conduction Velocity. With this plug-in it is possible to select and use different channels (three or more) to estimate the CV. Also in this case the tracks can be groped or ungrouped. In case the user needs to use the free selection on tracks it is recommended to group tracks to optimize the selection (see Fig.10.2). 37

38 FIG Multichannel CV plugin used on grouped signals. This multichannel algorithm estimates the CV in the frequency domain. The algorithm is described in the paper: Assessment of average muscle fiber conduction velocity from surface EMG signals during fatiguing dynamic contractions. D.Farina et al, IEEE Trans Biomed Eng Aug;51(8): and it provides an estimation of the CV from a set of EMG signals in a time interval in which the mean square error (mse) between aligned signals is minimized. The minimization of the mse function is performed in the frequency domain, without limitation in the time resolution and with an iterative computationally efficient procedure. The algorithm that is implemented in OT Biolab uses a rectangular window with an amplitude of unity. This choice was adopted in order to minimize the computational time of the algorithm. The CV is calculated for epochs as for the previous algorithm. The track containing the results is added under the last existing track. The value for every epoch is displayed as a point in the middle of each epoch. The third plug-in is named Windowed conduction velocity and it allows to calculate the CV at the center of a free selection. The signal is windowed in time domain by a Gaussian function. The algorithm used is the same of the Multichannel CV, so three or more signals can be selected. In this case it is necessary to group the tracks in which the user calculates the CV. Using the free selection the plug-in calculates the CV at the center of the selected time interval as reported in Fig When this plug- 38
. FIG. 10.4. Example of a windowed CV calculated with a Gaussian function (sigma of 30 ms). 10.7 Data approximation OT BioLab can provide different type of data approximation.")
39 in is selected a window will appear to select the desired sigma in milliseconds of the Gaussian window. The calculated value is reported in a new track at the center of the selected interval (see Fig. 10.4). FIG Example of a windowed CV calculated with a Gaussian function (sigma of 30 ms) Data approximation OT BioLab can provide different type of data approximation. In particular, three different tools are grouped under the Data Approximation menu voice: average, linear and parabolic. The three approximations can be applied at any kind of single track but they are intended to be applied on processing results based on epochs: amplitude, frequency or conduction velocity estimation results. When running a data approximation on a track, the software calculates the polynomial curve with the desired grade best fitting the data set, minimizing the square error. The polynomial curve obtained is superimposed to the track containing the data set and drown in red. The identified coefficients are indicated in the sensor name Decomposition > Decomponi The plugin, when applied, decompose the grouped signals. In Settings form you can set parameters of decomposition algorithm. The result is a grouped signals with a spike when the motor unit fires. 39

40 FIG Decomponi parameter setting Decomposition > Extract Motor Units This plugin shows the template of the decomposed motor units. In order to use this plugin, proceed as follows: 1. Select signals and decomposition. 2. Run Decomposition > Extract Motor Units 40

41 FIG Motor Unit extraction result Decomposition > Mean firing rate This plugin can be applied to decomposed signals. This plugin draws a curve showing the firing rate of motor units during acquisition Derivative Performs derivative of a signal Envelope Extract the envelope from a single track and normalize it with respect to the envelope maximum peak. The tool has been designed for EMG signals, the resulting signal is obtained by rectifying the desired signal and applying a II order Butterworth low pass filter with 5 Hz corner frequency to the rectified signal. 41
 for selecting the number of samples that will be used to obtain an averaged FFT to reduce the noise in the estimated power spectrum. A minimum of 256 samples for the averaged FFT is required.")
42 10.13 FFT The FFT can be estimated from single tracks on the desired number of epochs. After selecting the track a window will appear (Fig. 10.7) for selecting the number of samples that will be used to obtain an averaged FFT to reduce the noise in the estimated power spectrum. A minimum of 256 samples for the averaged FFT is required. The maximum number of samples is equal to the length of the data. From this menu the user can select the window functions to apply to the time domain data for estimating the FFT (rectangular, hanning, hamming, blackman). Samples used to obtain the averaged FFT can be overlapped (50 % of overlap - Welch s method) or no overlapped (Barlett s method) selecting the options that appears on the bottom-right of the window menu. After selecting these options a new window will display the result of the algorithm (Fig. 10.8). Details about the FFT algorithm can be found at After the FFT has been estimated, keeping the left mouse button pressed a rectangular window can be drawn to indicate the area that the user want to zoom in. When a right click on the FFT zoom out will be performed. FIG window menu for selecting number of samples. 42
43 FIG FFT spectrum obtained averaging 1024 samples is shown Filtering This processing tool can be applied both to single tracks and multiple tracks. When running it, a request of filter type and corner frequencies is displayed. It is possible to choose between different type of filters: - Low pass - Band pass - High pass - Stop band Moreover, the corner frequencies are differently asked depending on the filter type selected. The signals generated by the filtering process are added as single or multiple track in the review window leaving unaltered the starting signals. All filter types are II order Butterworth filters. 43
44 10.15 Frequency This processing tool uses two standard frequency estimators to generate two new single tracks containing the results. The estimators are the Mean Frequency (MNF) and Median Frequency (MDF). The two tracks generated are added under the last existing track. In both cases a value for every epoch is calculated and displayed as a point in the middle of each epochs. When the zoom is set to display more epochs, the points are connected each other by displaying a line between each adjacent points. The estimation of MNF (fmnf) is obtained for the epoch i using the following formula: f MNF (i) = n k=0 n k=0 I k I k f k [Hz]; Where: - n is the number of frequency bins in the spectrum - fk is the frequency of spectrum at bin k of n - Ik is the Intensity of spectrum at bin k of n The estimation of MDF (fmdf) is obtained bycomparing the total signal spectrum intensity divided by two with the cumulative intensity (i.e. all the intensity values for frequencies lower and including the focal intensity). The lowest frequency retrieving the cumulative intensity bigger than the half total intensity is fmdf Activation Map Maps plugin allows show in a 2D plot the matrix signals of 64 electrodes or 32 electrodes with different colour scales. The maps plugin has been designed to process data acquired as MONOPOLAR signals. After selecting the matrix type a new window will appear with the visualization of the colour map. On the left side of this window, different options are available in order to change the visualization of the map depending on the type of analysis that is chosen (see Fig. 10.9). 44

45 Fig Visualization of the colour map and of the menu with different options that can be modified From the menu map different mode of visualization can be selected: Monopolar, Horizontal differential and Vertical differential. With the Monopolar mode, the plot is generated from the original signals without additional processing. The Horizontal differential mode allows to perform the difference between contiguous electrodes of the monopolar signals from left to right of the matrix rows. The Vertical differential allows to perform the difference between contiguous electrodes of the monopolar signals from top to bottom columns of the matrix. The maps can be displayed with two different options: ARV or RAW data. Choosing the ARV option, the software estimate, for each signal, the average squared values over the epoch selected in the OT BioLab main window (e.g. 0.5 s in Fig. 10.9). A cursor bar in the top of the visualization window can be moved to select the colour map at a certain time. A Play button in the left side of this bar can be used to start an automatic display of the maps during the acquisition time or to stop it. In the RAW option, the instant values over the acquisition time are used to generate each map. With this option it is possible to display the acquired data by showing the propagation of the action potential along the muscle fibers. 45
46 Three different colour bars are available: Jet, from blue to red, Heat, from black-redwhite and Bone, a modified grey scale with a blue colour. Four different rotation angle can be chosen: 0, 90, 180 and 270 degrees with respect to the orientation that is reported in the left-bottom side with a picture of the selected matrix. The minimum and the maximum value of the colour range is reported in μv and can be changed in the menu. These values are also updated and reported in the right side of the colour bar. The minimum and the maximum value can be changed only when the check box of the autorange is un-checked Max Min and Mean This processing computes max, min and mean value of the selected signal PSD The power spectral density (PSD) can be estimated from single or multiple tracks on the desired number of epochs. As in the FFT plugin, after selecting the track a window will appear for selecting the number of samples that will be used to obtain an averaged FFT to reduce the noise (see FFT plugin for details), the window functions and the method (Welch or Barlett method). After selecting options of this menu two plots will show the PSD of the signal in two different units: db/hz and mv2/hz. As an example in Fig a PSD signal is shown in logarithmic scale. 46

47 Fig Example of a PSD spectrum obtained averaging 1024 samples of an EMG channel, the plot is reported in logarithmic scale Quality controller buffer/ramp This two plugins can be applied only on signals acquired with devices that provide ramp or buffer. They show the ramp or the buffer recorded during acquisition Sum This processing tool can be applied to a multiple track or to, at least, a pair of single tracks. Simply it calculates, sample by sample, the sum between signals. When applied to a multiple track it calculates the sum between all channels associated to the sensor selected and retrieve a new single track containing the sum. Typical application is the use with signals from an electrode array; the processing calculates the signals virtually obtained with multiple inter-electrodic distance. 47
48 10.21 Time shift This processing will shift the signal in time. When you run this processing, it will ask you how many samples you want to shift the signal. If the number is negative, it will move the beginning of the signal forward in time, delaying it. If it will be positive, it will remove the first part of the signal. 11 Matlab codes In the installer there are some examples file for Matlab coding. They are available under the path C:\Program Files\OT BioLab+\MatlabCodes. This folder is protected by Windows, then you will have to copy files under another path in order to edit them. 12 OTComm All the communication is managed by the library OTComm.dll. It is possible to use it also without using OT BioLab+. Some examples are available under Matlab codes. Documentation for OTComm.dll is available in C:\Program Files\OT BioLab+\Documentation. In order to use OTComm, you just need to import OTComm.dll in your project. It is available in the folder C:\Program Files\OT BioLab+. 13 PC Requirements Operative system: Windows 10 Processor: Intel i3 2nd generation. Port: USB2.0 and Ethernet Hard Disk: 500 MBytes for software installation Minimum RAM: 2 GBytes 48
49 The minimal PC requirements listed allows the proper acquisition of all 256 channels of EMG-USB2 equipment (with max sampling frequency Hz) and a visualization of 16 channels simultaneously. The increaseof the number of visualized channels can produce a visualization latency or an intermittent visualization. 14 Problem solving A problem for the visualization of sensors in the Setup Editor can occur in case the old version of the software has not been disinstalled before the installation of the new software. 15 OT BioLab Light OT BioLab Light has been developed in order to let the user acquire using directly from a socket without visualizing data in OT BioLab+. Using OT Biolab Light, you can just configure roughly the acquisition and start it. Then you will be able to connect using another software that will read the data coming from a socket. Data can be read also from another computer available in the same network. OT BioLab Light can be used with this devices: EMG-USB2+ QUATTROCENTO OT BioLab Light creates a socket on the localhost on the port Interface is shown in Figure If you want to use Quattrocento, you have to set parameters. Clicking on Edit the Figure 15.2 will appear. You can set the refresh frequency on the main interface. Refresh frequency is the frequency of data available on the socket for the reading. In order to see data, you just need to open the socket and send the start command. When you open the socket, you will receive 8 bytes. They are OTBioLab written in ASCII code. 49


50 Fig OT BioLab Light interface. Fig OT BioLab Light interface. 50
51 Detailed command and answers are: starttx: this command starts the communication with the socket. stoptx: this command stops the communication with the socket. Data are provided as short in little endian. An example of communication is shown in the Matlab Codes folder. 51
OT BioLab UserManual v3.3 for software version
 OT BioLab UserManual v3.3 for software version 2.0.6479.0 1 Sommario 1 Introduction... 4 2 OT BioLab installation... 5 3 Driver installation... 8 3.1 EMG-USB drivers... 8 3.2 DUE PRO drivers... 9 4 Signal
NanoGiant Oscilloscope/Function-Generator Program. Getting Started
 Getting Started Page 1 of 17 NanoGiant Oscilloscope/Function-Generator Program Getting Started This NanoGiant Oscilloscope program gives you a small impression of the capabilities of the NanoGiant multi-purpose
PS User Guide Series Seismic-Data Display
 PS User Guide Series 2015 Seismic-Data Display Prepared By Choon B. Park, Ph.D. January 2015 Table of Contents Page 1. File 2 2. Data 2 2.1 Resample 3 3. Edit 4 3.1 Export Data 4 3.2 Cut/Append Records
SigPlay User s Guide
 SigPlay User s Guide . . SigPlay32 User's Guide? Version 3.4 Copyright? 2001 TDT. All rights reserved. No part of this manual may be reproduced or transmitted in any form or by any means, electronic or
A Matlab toolbox for. Characterisation Of Recorded Underwater Sound (CHORUS) USER S GUIDE
 USER S GUIDE") Centre for Marine Science and Technology A Matlab toolbox for Characterisation Of Recorded Underwater Sound (CHORUS) USER S GUIDE Version 5.0b Prepared for: Centre for Marine Science and Technology Prepared
Centre for Marine Science and Technology A Matlab toolbox for Characterisation Of Recorded Underwater Sound (CHORUS) USER S GUIDE Version 5.0b Prepared for: Centre for Marine Science and Technology Prepared
Getting Started. Connect green audio output of SpikerBox/SpikerShield using green cable to your headphones input on iphone/ipad.
 Getting Started First thing you should do is to connect your iphone or ipad to SpikerBox with a green smartphone cable. Green cable comes with designators on each end of the cable ( Smartphone and SpikerBox
NENS 230 Assignment #2 Data Import, Manipulation, and Basic Plotting
 NENS 230 Assignment #2 Data Import, Manipulation, and Basic Plotting Compound Action Potential Due: Tuesday, October 6th, 2015 Goals Become comfortable reading data into Matlab from several common formats
PulseCounter Neutron & Gamma Spectrometry Software Manual
 PulseCounter Neutron & Gamma Spectrometry Software Manual MAXIMUS ENERGY CORPORATION Written by Dr. Max I. Fomitchev-Zamilov Web: maximus.energy TABLE OF CONTENTS 0. GENERAL INFORMATION 1. DEFAULT SCREEN
Tutorial 3 Normalize step-cycles, average waveform amplitude and the Layout program
 Tutorial 3 Normalize step-cycles, average waveform amplitude and the Layout program Step cycles are defined usually by choosing a recorded ENG waveform that shows long lasting, continuos, consistently
EDL8 Race Dash Manual Engine Management Systems
 Engine Management Systems EDL8 Race Dash Manual Engine Management Systems Page 1 EDL8 Race Dash Page 2 EMS Computers Pty Ltd Unit 9 / 171 Power St Glendenning NSW, 2761 Australia Phone.: +612 9675 1414
Getting started with Spike Recorder on PC/Mac/Linux
 Getting started with Spike Recorder on PC/Mac/Linux You can connect your SpikerBox to your computer using either the blue laptop cable, or the green smartphone cable. How do I connect SpikerBox to computer
Getting Started with the LabVIEW Sound and Vibration Toolkit
 1 Getting Started with the LabVIEW Sound and Vibration Toolkit This tutorial is designed to introduce you to some of the sound and vibration analysis capabilities in the industry-leading software tool
Reference. TDS7000 Series Digital Phosphor Oscilloscopes
 Reference TDS7000 Series Digital Phosphor Oscilloscopes 07-070-00 0707000 To Use the Front Panel You can use the dedicated, front-panel knobs and buttons to do the most common operations. Turn INTENSITY
Import and quantification of a micro titer plate image
 BioNumerics Tutorial: Import and quantification of a micro titer plate image 1 Aims BioNumerics can import character type data from TIFF images. This happens by quantification of the color intensity and/or
Heart Rate Variability Preparing Data for Analysis Using AcqKnowledge
 APPLICATION NOTE 42 Aero Camino, Goleta, CA 93117 Tel (805) 685-0066 Fax (805) 685-0067 info@biopac.com www.biopac.com 01.06.2016 Application Note 233 Heart Rate Variability Preparing Data for Analysis
The most sensitive microelectrode array system for in vitro extracellular electrophysiology. Mobius Tutorial AMPLIFIER TYPE MED-A64MD1/MED-A64HE1
 The most sensitive microelectrode array system for in vitro extracellular electrophysiology Mobius Tutorial AMPLIFIER TYPE MED-A64MD1/MED-A64HE1 Information in this document is subject to change without
Analyzing and Saving a Signal
 Analyzing and Saving a Signal Approximate Time You can complete this exercise in approximately 45 minutes. Background LabVIEW includes a set of Express VIs that help you analyze signals. This chapter teaches
The BAT WAVE ANALYZER project
 The BAT WAVE ANALYZER project Conditions of Use The Bat Wave Analyzer program is free for personal use and can be redistributed provided it is not changed in any way, and no fee is requested. The Bat Wave
Brain-Computer Interface (BCI)
") Brain-Computer Interface (BCI) Christoph Guger, Günter Edlinger, g.tec Guger Technologies OEG Herbersteinstr. 60, 8020 Graz, Austria, guger@gtec.at This tutorial shows HOW-TO find and extract proper signal
Brain-Computer Interface (BCI) Christoph Guger, Günter Edlinger, g.tec Guger Technologies OEG Herbersteinstr. 60, 8020 Graz, Austria, guger@gtec.at This tutorial shows HOW-TO find and extract proper signal
Common Spatial Patterns 3 class BCI V Copyright 2012 g.tec medical engineering GmbH
 g.tec medical engineering GmbH Sierningstrasse 14, A-4521 Schiedlberg Austria - Europe Tel.: (43)-7251-22240-0 Fax: (43)-7251-22240-39 office@gtec.at, http://www.gtec.at Common Spatial Patterns 3 class
ME EN 363 ELEMENTARY INSTRUMENTATION Lab: Basic Lab Instruments and Data Acquisition
 ME EN 363 ELEMENTARY INSTRUMENTATION Lab: Basic Lab Instruments and Data Acquisition INTRODUCTION Many sensors produce continuous voltage signals. In this lab, you will learn about some common methods
Operating Instructions
 Operating Instructions HAEFELY TEST AG KIT Measurement Software Version 1.0 KIT / En Date Version Responsable Changes / Reasons February 2015 1.0 Initial version WARNING Introduction i Before operating
USB Mini Spectrum Analyzer User s Guide TSA5G35
 USB Mini Spectrum Analyzer User s Guide TSA5G35 Triarchy Technologies, Corp. Page 1 of 21 USB Mini Spectrum Analyzer User s Guide Copyright Notice Copyright 2011 Triarchy Technologies, Corp. All rights
Processing data with Mestrelab Mnova
 Processing data with Mestrelab Mnova This exercise has three parts: a 1D 1 H spectrum to baseline correct, integrate, peak-pick, and plot; a 2D spectrum to plot with a 1 H spectrum as a projection; and
Lab experience 1: Introduction to LabView
 Lab experience 1: Introduction to LabView LabView is software for the real-time acquisition, processing and visualization of measured data. A LabView program is called a Virtual Instrument (VI) because
Manual of Operation for WaveNode Model WN-2m. Revision 1.0
 Manual of Operation for WaveNode Model WN-2m. Revision 1.0 TABLE OF CONTENTS 1. Description of Operation 2. Features 3. Installation and Checkout 4. Graphical Menus 5. Information for Software Expansion
TL-2900 AMMONIA & NITRATE ANALYZER DUAL CHANNEL
 TL-2900 AMMONIA & NITRATE ANALYZER DUAL CHANNEL DATA ACQUISITION SYSTEM V.15.4 INSTRUCTION MANUAL Timberline Instruments, LLC 1880 S. Flatiron Ct., Unit I Boulder, Colorado 80301 Ph: (303) 440-8779 Fx:
NOTICE: This document is for use only at UNSW. No copies can be made of this document without the permission of the authors.
 Brüel & Kjær Pulse Primer University of New South Wales School of Mechanical and Manufacturing Engineering September 2005 Prepared by Michael Skeen and Geoff Lucas NOTICE: This document is for use only
A low noise multi electrode array system for in vitro electrophysiology. Mobius Tutorial AMPLIFIER TYPE SU-MED640
 A low noise multi electrode array system for in vitro electrophysiology Mobius Tutorial AMPLIFIER TYPE SU-MED640 Information in this document is subject to change without notice.no part of this document
Analysis of AP/axon classes and PSP on the basis of AP amplitude
 Analysis of AP/axon classes and PSP on the basis of AP amplitude In this analysis manual, we aim to measure and analyze AP amplitudes recorded with a suction electrode and synaptic potentials recorded
E X P E R I M E N T 1
 E X P E R I M E N T 1 Getting to Know Data Studio Produced by the Physics Staff at Collin College Copyright Collin College Physics Department. All Rights Reserved. University Physics, Exp 1: Getting to
Quick Reference Manual
 Quick Reference Manual V1.0 1 Contents 1.0 PRODUCT INTRODUCTION...3 2.0 SYSTEM REQUIREMENTS...5 3.0 INSTALLING PDF-D FLEXRAY PROTOCOL ANALYSIS SOFTWARE...5 4.0 CONNECTING TO AN OSCILLOSCOPE...6 5.0 CONFIGURE
MIE 402: WORKSHOP ON DATA ACQUISITION AND SIGNAL PROCESSING Spring 2003
 MIE 402: WORKSHOP ON DATA ACQUISITION AND SIGNAL PROCESSING Spring 2003 OBJECTIVE To become familiar with state-of-the-art digital data acquisition hardware and software. To explore common data acquisition
Oscilloscopes, logic analyzers ScopeLogicDAQ
 Oscilloscopes, logic analyzers ScopeLogicDAQ ScopeLogicDAQ 2.0 is a comprehensive measurement system used for data acquisition. The device includes a twochannel digital oscilloscope and a logic analyser
Common Spatial Patterns 2 class BCI V Copyright 2012 g.tec medical engineering GmbH
 g.tec medical engineering GmbH Sierningstrasse 14, A-4521 Schiedlberg Austria - Europe Tel.: (43)-7251-22240-0 Fax: (43)-7251-22240-39 office@gtec.at, http://www.gtec.at Common Spatial Patterns 2 class
HBI Database. Version 2 (User Manual)
") HBI Database Version 2 (User Manual) St-Petersburg, Russia 2007 2 1. INTRODUCTION...3 2. RECORDING CONDITIONS...6 2.1. EYE OPENED AND EYE CLOSED CONDITION....6 2.2. VISUAL CONTINUOUS PERFORMANCE TASK...6
HBI Database Version 2 (User Manual) St-Petersburg, Russia 2007 2 1. INTRODUCTION...3 2. RECORDING CONDITIONS...6 2.1. EYE OPENED AND EYE CLOSED CONDITION....6 2.2. VISUAL CONTINUOUS PERFORMANCE TASK...6
USB Mini Spectrum Analyzer User Manual PC program TSA For TSA5G35 TSA4G1 TSA6G1 TSA12G5
 USB Mini Spectrum Analyzer User Manual PC program TSA For TSA5G35 TSA4G1 TSA6G1 TSA12G5 Triarchy Technologies, Corp. Page 1 of 17 USB Mini Spectrum Analyzer User Manual Copyright Notice Copyright 2013
PicoScope 6 Training Manual
 PicoScope 6 Training Manual DO226 PicoScope 6 Training Manual r2.docx Copyright 2014 Pico Technology CONTENTS 1 Quick guide to PicoScope 6... 1 1.1 The PicoScope way... 1 1.2 Signal view... 2 1.3 Timebase...
System Requirements SA0314 Spectrum analyzer:
 System Requirements SA0314 Spectrum analyzer: System requirements Windows XP, 7, Vista or 8: 1 GHz or faster 32-bit or 64-bit processor 1 GB RAM 10 MB hard disk space \ 1. Getting Started Insert DVD into
Please feel free to download the Demo application software from analogarts.com to help you follow this seminar.
 Hello, welcome to Analog Arts spectrum analyzer tutorial. Please feel free to download the Demo application software from analogarts.com to help you follow this seminar. For this presentation, we use a
PHY221 Lab 1 Discovering Motion: Introduction to Logger Pro and the Motion Detector; Motion with Constant Velocity
 PHY221 Lab 1 Discovering Motion: Introduction to Logger Pro and the Motion Detector; Motion with Constant Velocity Print Your Name Print Your Partners' Names Instructions August 31, 2016 Before lab, read
medlab One Channel ECG OEM Module EG 01000
 medlab One Channel ECG OEM Module EG 01000 Technical Manual Copyright Medlab 2012 Version 2.4 11.06.2012 1 Version 2.4 11.06.2012 Revision: 2.0 Completely revised the document 03.10.2007 2.1 Corrected
PicoScope 6 PC Oscilloscope Software
 PicoScope 6 PC Oscilloscope Software User's Guide -5 Table of Contents I Table of Contents 1 Welcome...1 2 Version 6.0...2 update 3 Introduction...3...4 1 Legal statement...5 2 Contact information...5
EAN-Performance and Latency
 EAN-Performance and Latency PN: EAN-Performance-and-Latency 6/4/2018 SightLine Applications, Inc. Contact: Web: sightlineapplications.com Sales: sales@sightlineapplications.com Support: support@sightlineapplications.com
Linrad On-Screen Controls K1JT
 Linrad On-Screen Controls K1JT Main (Startup) Menu A = Weak signal CW B = Normal CW C = Meteor scatter CW D = SSB E = FM F = AM G = QRSS CW H = TX test I = Soundcard test mode J = Analog hardware tune
Capstone screen shows live video with sync to force and velocity data. Try it! Download a FREE 60-day trial at pasco.com/capstone
 Capstone screen shows live video with sync to force and velocity data. Try it! Download a FREE 60-day trial at pasco.com/capstone If you use these PSCO USB interfaces in your lab, it s time for PSCO Capstone
Quick-Start for READ30
 Quick-Start for READ30 The program READ30 was written for the purpose of reading and configuring the digital pressure-transmitter of the series 30. The two features are divided into the following parts:
USB Mini Spectrum Analyzer User Manual TSA Program for PC TSA4G1 TSA6G1 TSA8G1
 USB Mini Spectrum Analyzer User Manual TSA Program for PC TSA4G1 TSA6G1 TSA8G1 Triarchy Technologies Corp. Page 1 of 17 USB Mini Spectrum Analyzer User Manual Copyright Notice Copyright 2013 Triarchy Technologies,
MAutoPitch. Presets button. Left arrow button. Right arrow button. Randomize button. Save button. Panic button. Settings button
 MAutoPitch Presets button Presets button shows a window with all available presets. A preset can be loaded from the preset window by double-clicking on it, using the arrow buttons or by using a combination
TV Character Generator
 TV Character Generator TV CHARACTER GENERATOR There are many ways to show the results of a microcontroller process in a visual manner, ranging from very simple and cheap, such as lighting an LED, to much
Transmitter Interface Program
 Transmitter Interface Program Operational Manual Version 3.0.4 1 Overview The transmitter interface software allows you to adjust configuration settings of your Max solid state transmitters. The following
The Measurement Tools and What They Do
 2 The Measurement Tools The Measurement Tools and What They Do JITTERWIZARD The JitterWizard is a unique capability of the JitterPro package that performs the requisite scope setup chores while simplifying
Thought Technology Ltd Belgrave Avenue, Montreal, QC H4A 2L8 Canada
 Thought Technology Ltd. 2180 Belgrave Avenue, Montreal, QC H4A 2L8 Canada Tel: (800) 361-3651 ٠ (514) 489-8251 Fax: (514) 489-8255 E-mail: _Hmail@thoughttechnology.com Webpage: _Hhttp://www.thoughttechnology.com
Spectrum Analyser Basics
 Hands-On Learning Spectrum Analyser Basics Peter D. Hiscocks Syscomp Electronic Design Limited Email: phiscock@ee.ryerson.ca June 28, 2014 Introduction Figure 1: GUI Startup Screen In a previous exercise,
KRAMER ELECTRONICS LTD. USER MANUAL
 KRAMER ELECTRONICS LTD. USER MANUAL MODEL: Projection Curved Screen Blend Guide How to blend projection images on a curved screen using the Warp Generator version K-1.4 Introduction The guide describes
2. AN INTROSPECTION OF THE MORPHING PROCESS
 1. INTRODUCTION Voice morphing means the transition of one speech signal into another. Like image morphing, speech morphing aims to preserve the shared characteristics of the starting and final signals,
ECE 4220 Real Time Embedded Systems Final Project Spectrum Analyzer
 ECE 4220 Real Time Embedded Systems Final Project Spectrum Analyzer by: Matt Mazzola 12222670 Abstract The design of a spectrum analyzer on an embedded device is presented. The device achieves minimum
THE BERGEN EEG-fMRI TOOLBOX. Gradient fmri Artifatcs Remover Plugin for EEGLAB 1- INTRODUCTION
 THE BERGEN EEG-fMRI TOOLBOX Gradient fmri Artifatcs Remover Plugin for EEGLAB 1- INTRODUCTION This EEG toolbox is developed by researchers from the Bergen fmri Group (Department of Biological and Medical
B I O E N / Biological Signals & Data Acquisition
 B I O E N 4 6 8 / 5 6 8 Lectures 1-2 Analog to Conversion Binary numbers Biological Signals & Data Acquisition In order to extract the information that may be crucial to understand a particular biological
SIGVIEW v2.6 User Manual
 SIGVIEW v2.6 User Manual Copyright 1998-2012 SignalLab SIGVIEW v2.6 User Manual 3 Table of Contents Part I Introduction... 6 1 General... 7 2 Basic... concepts 8 Part II Basic... signal operations 10 1
Lesson 1 EMG 1 Electromyography: Motor Unit Recruitment
 Physiology Lessons for use with the Biopac Science Lab MP40 Lesson 1 EMG 1 Electromyography: Motor Unit Recruitment PC running Windows XP or Mac OS X 10.3-10.4 Lesson Revision 1.20.2006 BIOPAC Systems,
LAB 1: Plotting a GM Plateau and Introduction to Statistical Distribution. A. Plotting a GM Plateau. This lab will have two sections, A and B.
 LAB 1: Plotting a GM Plateau and Introduction to Statistical Distribution This lab will have two sections, A and B. Students are supposed to write separate lab reports on section A and B, and submit the
SISII User Guide SISII. Sound Editor STC-S521. User Guide
 SISII SISII Sound Editor STC-S521 Note to Customer NOTE TO CUSTOMER Thank you for choosing our product. We hope you will find STC software useful as it will help you to resolve your tasks. Before getting
Topic: Instructional David G. Thomas December 23, 2015
 Procedure to Setup a 3ɸ Linear Motor This is a guide to configure a 3ɸ linear motor using either analog or digital encoder feedback with an Elmo Gold Line drive. Topic: Instructional David G. Thomas December
Laboratory 5: DSP - Digital Signal Processing
 Laboratory 5: DSP - Digital Signal Processing OBJECTIVES - Familiarize the students with Digital Signal Processing using software tools on the treatment of audio signals. - To study the time domain and
MTL Software. Overview
 MTL Software Overview MTL Windows Control software requires a 2350 controller and together - offer a highly integrated solution to the needs of mechanical tensile, compression and fatigue testing. MTL
EASY-MCS. Multichannel Scaler. Profiling Counting Rates up to 150 MHz with 15 ppm Time Resolution.
 Multichannel Scaler Profiling Counting Rates up to 150 MHz with 15 ppm Time Resolution. The ideal solution for: Time-resolved single-photon counting Phosphorescence lifetime spectrometry Atmospheric and
NanoTrack Cell and Particle Tracking Primer
 NanoTrack Cell and Particle Tracking Primer The NanoTrack Pnode allows the user to track single cells and particles with nanometer precision at very fast tracking speeds. The speed of the tracking is dependent
Guide to Analysing Full Spectrum/Frequency Division Bat Calls with Audacity (v.2.0.5) by Thomas Foxley
 by Thomas Foxley") Guide to Analysing Full Spectrum/Frequency Division Bat Calls with Audacity (v.2.0.5) by Thomas Foxley Contents Getting Started Setting Up the Sound File Noise Removal Finding All the Bat Calls Call Analysis
Guide to Analysing Full Spectrum/Frequency Division Bat Calls with Audacity (v.2.0.5) by Thomas Foxley Contents Getting Started Setting Up the Sound File Noise Removal Finding All the Bat Calls Call Analysis
127566, Россия, Москва, Алтуфьевское шоссе, дом 48, корпус 1 Телефон: +7 (499) (800) (бесплатно на территории России)
 (800) (бесплатно на территории России)") 127566, Россия, Москва, Алтуфьевское шоссе, дом 48, корпус 1 Телефон: +7 (499) 322-99-34 +7 (800) 200-74-93 (бесплатно на территории России) E-mail: info@awt.ru, web:www.awt.ru Contents 1 Introduction...2
127566, Россия, Москва, Алтуфьевское шоссе, дом 48, корпус 1 Телефон: +7 (499) 322-99-34 +7 (800) 200-74-93 (бесплатно на территории России) E-mail: info@awt.ru, web:www.awt.ru Contents 1 Introduction...2
Analyzing Modulated Signals with the V93000 Signal Analyzer Tool. Joe Kelly, Verigy, Inc.
 Analyzing Modulated Signals with the V93000 Signal Analyzer Tool Joe Kelly, Verigy, Inc. Abstract The Signal Analyzer Tool contained within the SmarTest software on the V93000 is a versatile graphical
For the SIA. Applications of Propagation Delay & Skew tool. Introduction. Theory of Operation. Propagation Delay & Skew Tool
 For the SIA Applications of Propagation Delay & Skew tool Determine signal propagation delay time Detect skewing between channels on rising or falling edges Create histograms of different edge relationships
DIGITAL PERSONAL STUDIO Version 1.30 Addendum
 DIGITAL PERSONAL STUDIO Version 1.30 Addendum Contents V1.30 FEATURES...1 AK.SYS TRACKVIEW...2 INSTALLING AK.SYS TRACKVIEW...2 USING AK.SYS TRACKVIEW...3 METERS...4 IN / OUT TIMES...5 TIMECODE DISPLAY...5
LeCroy Digital Oscilloscopes
 LeCroy Digital Oscilloscopes Get the Complete Picture Quick Reference Guide QUICKSTART TO SIGNAL VIEWING Quickly display a signal View with Analog Persistence 1. Connect your signal. When you use a probe,
Oscilloscope Reference Manual CS300
 Oscilloscope Reference Manual CS300 Cleverscope Models: CS320 CS328 CS320A CS328A CS320AE CS328AE CS320A-XS CS320-XSE v 2.11.2 16 Jul 2015 Cleverscope CS300 Reference Manual v2.11 Page 2 www.cleverscope.com
imso-104 Manual Revised August 5, 2011
 imso-104 Manual Revised August 5, 2011 Section 1 Getting Started SAFETY 1.10 Quickstart Guide 1.20 SAFETY 1.30 Compatibility 1.31 Hardware 1.32 Software Section 2 How it works 2.10 Menus 2.20 Analog Channel
SpikePac User s Guide
 SpikePac User s Guide Updated: 7/22/2014 SpikePac User's Guide Copyright 2008-2014 Tucker-Davis Technologies, Inc. (TDT). All rights reserved. No part of this manual may be reproduced or transmitted in
ez-analyst version 5.1.x
 USER S MANUAL ez-analyst version 5.1.x Real-Time Vibration and Acoustic Analysis Software *372165D-01* 372165D-01 1086-0922 rev 15.1 IOtech 25971 Cannon Road Cleveland, OH 44146-1833 (440) 439-4091 Fax:
Field Test 2. Installation and operation manual OPDAQ Installation and operation manual
 Field Test 2 Installation and operation manual OPDAQ 17.08.25 Installation and operation manual January 2016 How to get copies of OpDAQ technical publications: 53, St-Germain Ouest Rimouski, Québec Canada
What s New in Raven May 2006 This document briefly summarizes the new features that have been added to Raven since the release of Raven
 What s New in Raven 1.3 16 May 2006 This document briefly summarizes the new features that have been added to Raven since the release of Raven 1.2.1. Extensible multi-channel audio input device support
DAC Express Release 3.4 (VT9801B)
") DAC Express Release 3.4 (VT9801B) DAC Express 3.4 Highlights n Display Wizard for fast test setups n 48-channel high performance remote strain measurement unit (EX1629) n Combine multi-channel analog,
DAC Express Release 3.4 (VT9801B) DAC Express 3.4 Highlights n Display Wizard for fast test setups n 48-channel high performance remote strain measurement unit (EX1629) n Combine multi-channel analog,
Pre-processing of revolution speed data in ArtemiS SUITE 1
 03/18 in ArtemiS SUITE 1 Introduction 1 TTL logic 2 Sources of error in pulse data acquisition 3 Processing of trigger signals 5 Revolution speed acquisition with complex pulse patterns 7 Introduction
Portable in vivo Recording System
 Portable in vivo Recording System 16 or 32 channel version Pre- and filter amplifier included USB 2.0 data transfer Adapters for commercially available probes Real-time signal detection and feedback Flexible
Patchmaster. Elektronik. The Pulse generator. February 2013
 Patchmaster The Pulse generator Elektronik Telly Galiatsatos, BS 1987: Graduated at Queens College, NY Computer Science 1987-2007: Instrutech Corporation IT Engineering Support Software Engineer, Sales
Connection for filtered air
 BeamWatch Non-contact, Focus Spot Size and Position monitor for high power YAG, Diode and Fiber lasers Instantly measure focus spot size Dynamically measure focal plane location during start-up From 1kW
User's Guide SISII. Sound Editor STC-S521. User s Guide
 User's Guide SISII Sound Editor STC-S521 User s Guide ABSTRACT Thank you for purchasing SIS II Sound Editor! We hope that our software will improve the quality of your tasks accomplishment. IKARLab. Before
Spectrometer. CCS Series Operation Manual
 Spectrometer CCS Series Operation Manual 2014 Version: 2.02 Date: 21-Mar-2014 Copyright Contents Foreword 3 1 General Information 4 1.1 1.2 1.3 Safety Ordering Codes and Accessories Requirements 2 Installation
iworx Sample Lab Experiment HM-3: The Electrogastrogram (EGG) and the Growling Stomach
 and the Growling Stomach") Experiment HM-3: The Electrogastrogram (EGG) and the Growling Stomach Background Do you ever wonder why your stomach growls, that funny sound it makes when you are really hungry? Stomach growling is the
Experiment HM-3: The Electrogastrogram (EGG) and the Growling Stomach Background Do you ever wonder why your stomach growls, that funny sound it makes when you are really hungry? Stomach growling is the
Spectrometer. CCS Series Spectrometer Operation Manual
 Spectrometer CCS Series Spectrometer Operation Manual 2017 Version: 2.03 Date: 30-May-2017 Copyright Contents Foreword 3 1 General Information 4 1.1 Safety 1.2 Ordering Codes and Accessories 1.3 Requirements
Logic Analyzer Auto Run / Stop Channels / trigger / Measuring Tools Axis control panel Status Display
 Logic Analyzer The graphical user interface of the Logic Analyzer fits well into the overall design of the Red Pitaya applications providing the same operating concept. The Logic Analyzer user interface
Oscilloscope Reference Manual CS300
 Oscilloscope Reference Manual CS300 Cleverscope Models: CS320 CS328 CS320A CS328A CS320AE CS328AE CS320A-XS CS320-XSE v 2.12.0 31 May 2016 Cleverscope CS300 Reference Manual v2.11 Page 2 www.cleverscope.com
MSO-28 Oscilloscope, Logic Analyzer, Spectrum Analyzer
 Link Instruments Innovative Test & Measurement solutions since 1986 Store Support Oscilloscopes Logic Analyzers Pattern Generators Accessories MSO-28 Oscilloscope, Logic Analyzer, Spectrum Analyzer $ The
Introduction To LabVIEW and the DSP Board
 EE-289, DIGITAL SIGNAL PROCESSING LAB November 2005 Introduction To LabVIEW and the DSP Board 1 Overview The purpose of this lab is to familiarize you with the DSP development system by looking at sampling,
Statement SmartLCT User s Manual Welcome to use the product from Xi an NovaStar Tech Co., Ltd. (hereinafter referred to as NovaStar ). It is our great
. It is our great") LED Display Configuration Software SmartLCT User s Manual Software Version: V3.0 Rev3.0.0 NS110100239 Statement SmartLCT User s Manual Welcome to use the product from Xi an NovaStar Tech Co., Ltd. (hereinafter
LED Display Configuration Software SmartLCT User s Manual Software Version: V3.0 Rev3.0.0 NS110100239 Statement SmartLCT User s Manual Welcome to use the product from Xi an NovaStar Tech Co., Ltd. (hereinafter
Standard Operating Procedure of nanoir2-s
 Standard Operating Procedure of nanoir2-s The Anasys nanoir2 system is the AFM-based nanoscale infrared (IR) spectrometer, which has a patented technique based on photothermal induced resonance (PTIR),
PRELIMINARY INFORMATION. Professional Signal Generation and Monitoring Options for RIFEforLIFE Research Equipment
 Integrated Component Options Professional Signal Generation and Monitoring Options for RIFEforLIFE Research Equipment PRELIMINARY INFORMATION SquareGENpro is the latest and most versatile of the frequency
Central Software Suite
 630 Komas Drive Suite 200 Salt Lake City UT 84108 USA P +1 801.582.5533 F +1 801.582.1509 www.blackrockmicro.com Central Software Suite Instructions for Use Revision 4.00 / LB-0574 Central Software Suite
Motion Amplification
 Motion Amplification User s Manual Version 2.0 Revised 06/9/2017 RDI Technologies 10325 Technology Dr Knoxville, TN 37932 www.rdi-technologies.com All Rights Reserved Contents 1 Using the camera... 4 1.1
TracQ Basic. Spectroscopy Software v6.5. User's Manual
 S TracQ Basic Spectroscopy Software v6.5 User's Manual Family of Brands ILX Lightwave New Focus Ophir Corion Richardson Gratings Spectra-Physics MTRACQBASIC6.5, Rev B 2 TABLE OF CONTENTS 1 SAFETY INFORMATION...
D-Lab & D-Lab Control Plan. Measure. Analyse. User Manual
 D-Lab & D-Lab Control Plan. Measure. Analyse User Manual Valid for D-Lab Versions 2.0 and 2.1 September 2011 Contents Contents 1 Initial Steps... 6 1.1 Scope of Supply... 6 1.1.1 Optional Upgrades... 6