Supporting Information for Effectiveness of Global, Low-Degree Polynomial Transformations for GCxGC Data Alignment
|
|
|
- Griffin Welch
- 5 years ago
- Views:
Transcription
1 Supporting Information for Effectiveness of Global, Low-Degree Polynomial Transformations for GCxGC Data Alignment Davis W. Rempe, * Stephen E. Reichenbach, * Qingping Tao, Chiara Cordero, Wayne E. Rathbun, Cláudia Alcaraz Zini # * University of Nebraska Lincoln, Lincoln NE , USA GC Image, LLC, Lincoln NE , USA Università degli Studi di Torino, I Torino, Italy Honeywell UOP, 25 E. Algonquin Rd. Des Plaines, IL , USA # Universidade Federal do Rio Grande do Sul, Porto Alegre-RS, Brazil ABSTRACT: This document provides supplemental information for Effectiveness of Global, Low-Degree Polynomial Transformations for GCxGC Data Alignment, submitted to Analytical Chemistry. Due to space constraints and for brevity of presentation, that paper presents results for only a few examples. This supplement provides additional results. For a general description of the samples, instrumentation, system settings, data preprocessing, alignment algorithms, and evaluation methodology, refer to the body of the paper. Instrumentation for Diesel Sample Runs. For the analysis of the diesel sample, all run conditions were in accordance with UOP 990, with a modulation period of 8 s and sampling with a flame ionization detector (FID) at 200 Hz. Diesel sample runs used a LECO GCxGC FID system equipped with an Agilent 6890 GC and LECO GCxGC accessories (modulator and secondary oven). Instrumentation for Wine Sample Runs. Wine samples (750 ml each) were protected from direct light and stored in a cool place. After opening the bottles, smaller volumes of each wine were placed in 200 ml screw-capped dark glass flasks and were frozen (-18 C) in order to avoid loss of volatiles until chromatographic analyses. Headspace microextraction (HS-SPME) was performed with one ml of wine, 0.3 g of sodium chloride at 55 C (± 0.9), and a DVB/CAR/PDMS fiber (Supelco, Bellefonte, PA) in 20 ml headspace screw-capped glass vials. SPME fibers were previously conditioned according to manufacturer s instructions. The system employed for GC GC was an Agilent 6890N (Agilent Technologies, Palo Alto, CA) with a time-offlight mass spectrometric detector (TOFMS) equipped with a CombiPAL autosampler (CTC Analytics, Zwingen, Switzerland), a secondary oven for the second chromatographic column, and a quadjet cryogenic modulator (two cold and two hot) where cold jets were supported by nitrogen gas cooled with liquid nitrogen. Desorption took place at 250 C, in the injection port, where the fiber was kept for five (5) minutes. Other parameters employed were: modulation period of 7 s, oven temperature offset of 10 C, transfer line temperature of 300 C, detector temperature 240 C, ionization energy of 70 ev, detector of voltage 1500 V, mass range 45 to 450 m/z, and data acquisition rate of 100 Hz. Carrier gas was helium (purity 5.0, White Martins, Pinhais, Brazil) and its linear velocity was 1.0 ml min-1. Stationary phase of the first dimension column ( 1 D) was a DB-WAX (30 m 0.25 mm 0.25 μm) and a DB-17ms (1.70 m 0.18 mm 0.18 μm) in the second dimension ( 2 D). Instrumentation for Cocoa Sample Runs. For the analysis of the volatile fraction of cocoa samples, headspace solid-phase micro-extraction (HS-SPME) was performed on 1.00 g of cocoa nibs finely milled with liquid nitrogen at 45 C (± 0.9) for 40 minutes. A DVB/CAR/PDMS fiber (Supelco, Bellefonte, PA) was used in 20 ml headspace screw-capped glass vials. The GCx2GC-MS/FID runs with reverse-inject differential flow modulation used an Agilent 7890B GC unit coupled to an Agilent 5977A fast quadrupole MS detector (Agilent, Little Falls, DE) operating in EI mode at 70 ev, and a fast FID. The GC transfer line was set at 270 C. A scan range of m/z with a scanning rate of 20,000 amu/s was used, and the spectra generation frequency was 35 Hz. The FID base temperature was 280 C, with H2 flow of 40 ml/min, air flow of 240 ml/min, and make-up (N2) of 450 ml/min, at a sampling frequency of 150 Hz. The system was equipped with reverse-inject differential flow consisting of one CFT plate connected to a three-way solenoid valve that receives a controlled supply of carrier gas (helium) from an auxiliary electronic pressure control module (EPC). Pulse time was set at 200 ms and modulation period of 3 s. The 1 D used a SolGel-Wax column (100% polyethylene glycol)(30 m 0.25 mm dc, 0.25 μm df) from SGE Analytical Science (Ringwood, Australia) coupled with a 2 D OV1701 column (86% polydimethylsiloxane, 7% phenyl, 7% cyanopropyl) (5 m 0.25 mm dc, 0.25 μm df) from Mega (Legnano, Milan, Italy). Cocoa volatiles extracted by HS-SPME were thermally desorbed into the GC split/splitless injector port in split mode, with split ratio 1:20, and injector temperature 250 C. The carrier gas was helium at a constant flow of 0.3 ml/min in the 1 D and 20 ml/min in the 2 D. The temperature program went from 50 C (0.5 min) to 250 C at 2 C/min (5 min). Connection between the 2 D column and the two parallel detectors was by a three-way unpurged splitter (G3181B, Agilent, Little Falls, DE). The deactivated capillary to the MS detector was 0.17 m long with 0.1 mm dc, and to the FID detector was 1.3 m long with 0.45 mm dc. Split ratio was 25:75 (MS:FID). S-1
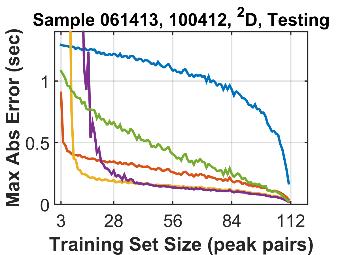
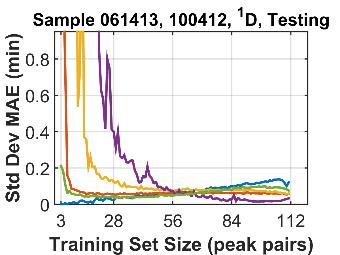
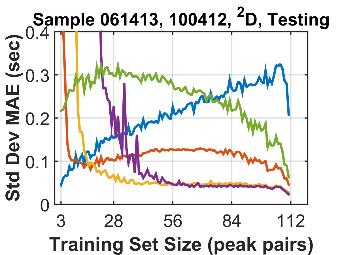
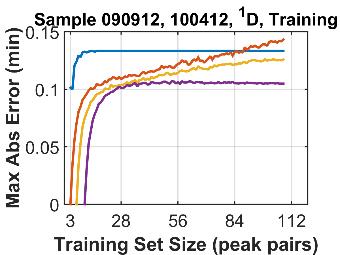
2 The GCxGC-MS runs with thermal modulation used an Agilent 6890 unit coupled to an Agilent 5975C MS detector (Agilent, Little Falls, DE) operating in EI mode at 70eV. The GC transfer line was set at 270 C with scan range m/z and a scanning rate of 12,500 amu/s. The spectra generation frequency was 29 Hz. The system was equipped with a two-stage KT 2004 loop-type thermal modulator (Zoex Corporation, Houston, TX) cooled with liquid nitrogen. The hot jet pulse time was set at 250 ms and used a modulation period of 3 s. The fused silica capillary loop dimensions were 1.0 x 0.1 mm (inner diameter). The 1 D used a SolGel-Wax column (100% polyethylene glycol)(30 m 0.25 mm dc, 0.25 μm df) from SGE Analytical Science (Ringwood, Australia) coupled with a 2 D OV1701 column (86% polydimethylsiloxane, 7% phenyl, 7% cyanopropyl) (1 m 0.1 mm dc c, 0.10 μm df) from Mega (Legnano, Milan, Italy). Cocoa volatiles extracted by HS-SPME were thermally desorbed into the GC split/splitless injector port in split mode, with split ratio 1:20, and injector temperature 250 C. The carrier gas was helium at a constant flow of 1.8 ml/min. Temperature program was from 40 C (1 min) to 200 C at 3 C/min and to 250 C at 10 C/min (5 min). Additional Results for Time-Varied Data. Figure S1 shows the results for the alignment of two additional pairs of consecutive replicate diesel sample runs, along with additional training-set plots for the chromatogram pair presented in the paper. The misalignment between consecutive replicate runs indicates a benchmark for the lower bound of alignment performance due to systemic noise. Chromatogram pair 18 and 19 were discussed in the paper. For consecutive replicate diesel sample runs 17 and 18, the 1 D misalignment is about min, and the 2 D is about s. For replicate runs 19 and 20 the 1 D misalignment averages min, and the 2 D is about s. These 1 D values are less than the modulator sampling noise level for the diesel sample chromatograms (calculated in the paper). The 2 D misalignments are in line with the benchmark used in the paper. Figure S4 shows the performance of the global and local algorithms for the alignment of all six pairings of diesel sample chromatograms acquired over various periods of time. (Testing-set figures for pairing and are presented in the paper.) In each test, every method offers significant improvements in alignment for both chromatographic dimensions. In the 1 D, the initial misalignment of the chromatogram pairs ranges from about 0.07 min to over 0.83 min, many times greater than the benchmark. The third-degree polynomial tends to reach around 0.06 min whereas the affine and second-degree polynomial reach just under 0.07 min. The local algorithm averages just under 0.08 min. In the 2 D, the initial misalignment ranges from 0.06 s to about 0.44 s. The third-degree polynomial reaches the lowest RMSE in all but one of the results from Figure S4, averaging about 0.02 s. The second-degree polynomial is about the same. The affine and local methods still improve the initial misalignment, but only get to about 0.03 and 0.04 s, respectively. These results are consistent with those presented in the paper. Additional Results for Sample-Varied Data. Figure S2 shows the results for alignment of two additional pairs of consecutive replicate wine sample runs, along with additional training-set figures for the pair presented in the paper. The 2011 pair is discussed in the paper. For the 1 D, the benchmarks from both additional pairs are less than the modulation sampling noise level of min, like the one presented in the paper. In the 2 D, the benchmark for both pairs is just over s, right around the benchmark used in the paper of s. Figure S5 shows the cross-validation performance of the alignment methods for all three pairs of chromatograms from different wine samples run in a very short period of time. The 2011, 2012 pair is discussed in the paper. In the 1 D, the initial misalignments are just barely greater than the benchmark RMSE. Because of this, no method is able to improve on the initial misalignment in either test. The initial misalignment between pairs in the 2 D is around 0.02 s, also just above the benchmark value. So, there is little improvement on the alignment from any method. These results are in line with those found in the paper. Table S1 summarizes the results of all three cross-validation experiments run on the wine chromatograms. It shows the minimum testing set RMSE reached for all alignment methods in both dimensions along with the average initial misalignment. The cells marked red are RMSE values greater than the average initial misalignment for that experiment. Figure S6 visualizes the wine alignment results by plotting the minimum RMSE reached by each method against the average initial misalignment. The red dot-dashed line shows the RMSE benchmarks. The black dashed line shows the identity function where the initial misalignment and minimum RMSE would be equal. A point above this line indicates that a method s resulting alignment is worse than it initially was, and one below offers an improvement. Each alignment method is represented by a different colored point. Between the two dimensions, several points from the third-degree polynomial and local method slightly worsen the initial misalignment (as shown in data points above the dashed line). When the points fall under the identity function, it is not by much, showing negligible improvement on the wine chromatogram alignment. These data support the idea that if two chromatograms have only a small initial misalignment, it may be better not to perform any alignment operation at all. Additional Results for Instrument-Varied Data. Figure S3 shows the results for the alignment of two additional pairs of consecutive replicate cocoa sample runs, along with additional training-set figures for the pair presented in the paper. The top row aligns replicate sample runs performed on a flow modulation platform, and the bottom two rows were performed on a thermal modulation platform. The Thermal 2, 3 pair is discussed in the paper. For the other pairs in the 1 D, the benchmarks are about min and min, respectively. These are consistent with the min benchmark used in the paper. For the 2 D, the average initial misalignment are about 0.03 s and s, respectively, right around the paper benchmark of S-2
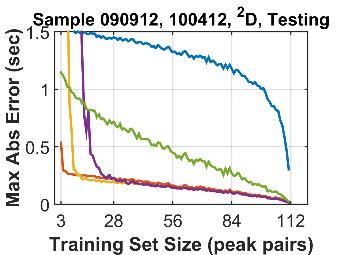
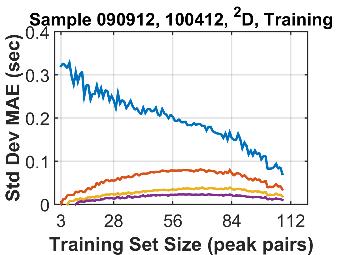
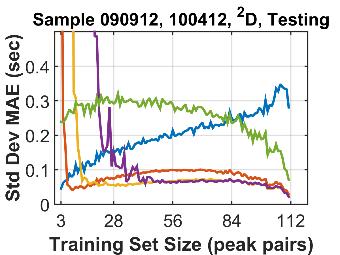
3 s. All methods did improve the alignment of the replicate flow-modulated chromatograms, indicating that there was a systematic misalignment between them. This is due to a small phase-roll affected by the alignment algorithms. Figure S7 shows the cross-validation performance of the alignment methods on all six pairs of chromatograms acquired on different modulation platforms. The Flow 2, Thermal 1 pair is discussed in the paper, but additional trainingset plots are presented here. All methods significantly improved alignment in both dimensions. In the 1 D, the initial misalignments are consistently around 23.2 min, well above the benchmark. Across these six experiments, the affine transformation is able to reach about 0.48 min, the local algorithm from Gros et al. is about 0.51 min, and the second and third-degree polynomials reach about 0.53 min. As observed in the paper, the higher-degree polynomials might require more peak-pairs for maximal performance. In the 2 D, the initial misalignment is around 0.5 s. The second-degree polynomial reaches a minimum RMSE of about s on average, the third-degree polynomial and local algorithm are both around s, and the affine transformation averages around s. These values are consistent with the example presented in the paper. All are effective, achieving between about 96% and 99% improvement. Maximum Alignment Error. All figures presented so far have shown the root-mean-square-error (RMSE) with respect to retention times of matched peaks in a chromatogram pair. This metric indicates average-case performance of an alignment method, but the worst-case scenario must also be considered. Figures S8, S9, and S10 show the average maximum absolute alignment error (MAE) across all trials run for each training set size. The standard deviation of this MAE is also shown. Figure S8 is for the diesel runs, Figure S9 is for the wine runs, and Figure S10 is for the cocoa runs. Across all experiments, behavior in both chromatographic dimensions is similar. If the training set has enough peak pairs, all methods reach a similar MAE for the testing set. The number of peak-pairs required to reach this convergent value differs between the different alignment methods. The local method from Gros et al. and the affine transformation require a much smaller training set than the second and third-degree polynomials in order to reach a lower MAE. This is consistent with the corresponding RMSE behavior. For the diesel runs in the 2 D, the local algorithm tends to have a higher standard deviation than the other methods, but this trend does not hold in the wine and cocoa experiments. Sample Chromatograms. Figures S11 through S14 show examples of the sample chromatograms and peaks used for alignment experiments. Figure S11 shows a diesel sample chromatogram acquired on June 14, All diesel chromatograms, including the replicate runs, look very similar to this one. The yellow circles show the 112 peaks that correspond across all diesel chromatograms and were used as alignment points. Figure S12 shows a wine sample chromatogram acquired from the second run of the 2011 vintage sample. Because misalignment is so minimal between wine chromatograms, they all look nearly identical to Figure S12. The yellow circles show the 78 peaks used for alignment of the wine chromatograms. Figures S13 and S14 show a cocoa sample chromatogram acquired on a system using a thermal and flow modulator, respectively. The two other thermal modulated chromatograms used in experiments look very similar to S13, and the one other flow modulator chromatogram resembles Figure S14. The yellow circles show the 33 peaks used for alignment of cocoa sample chromatogram pairs. S-3


4 Figure S1. Cross-validation retention-time RMSE results as a function of training set size for consecutive replicate runs of a diesel sample. From left to right, the RMSE is shown for the 1 D with the training set, 1 D with the testing set, 2 D with the training set, and 2 D with the testing set. The performance of the local algorithm from Gros et al. is only shown in the testing plots because it is guaranteed to perfectly align the training set. The top row is for chromatograms from diesel runs #17 and #18, the middle row is for runs #18 and #19, and the bottom row is for runs #19 and #20. S-4


5 Figure S2. Cross-validation retention-time RMSE results as a function of training set size for consecutive replicate runs of the various wine samples. The names correspond to the vintage year of the wine sample. The top row is for chromatograms from vintage year 2011, runs #1 and #2. The middle row is for chromatograms from vintage year 2012, runs #1 and #2. The bottom row is for chromatograms from vintage year 2013, runs #1 and #2. Figure S3. Cross-validation retention-time RMSE results as a function of training set size for consecutive replicate runs of a cocoa sample using different modulation platforms. The top row is for chromatograms from runs #1 and #2 using a flow modulator. The middle row is for chromatograms from runs #1 and #2 using a thermal modulator. The bottom row is for chromatograms from runs #2 and #3 using a thermal modulator. S-5


6 Figure S4. Cross-validation retention-time RMSE results as a function of training set size for chromatograms produced from the same diesel sample. From left to right, the RMSE is shown for the 1 D with the training set, 1 D with the testing set, 2 D with the training set, and 2 D with the testing set. The names of the samples correspond to the acquisition date (i.e. for the top row January 20, 2011 and September 9, 2012). Each row is for a different chromatogram pair. S-6

. The black dashed line shows the identity function where the initial misalignment and minimum RMSE would be equal.")
 and 2 D (sec) for Wine Chromatograms None (Avg.) Affine Poly2 Poly3 Gros et al.")

7 Figure S5. Cross-validation retention-time RMSE results as a function of training set size for alignment of two different wine sample chromatograms. The names correspond to the vintage year of the wine sample. For example, the top row is for chromatograms from the second runs of the 2011 and 2013 samples. Figure S6. Minimum testing-set RMSE reached by the alignment methods on the wine sample chromatograms relative to the average initial misalignment. The red dot-dashed line shows the benchmark RMSE values (0.034 min and sec). The black dashed line shows the identity function where the initial misalignment and minimum RMSE would be equal. A point above this line indicates that a method s resulting alignment is worse than it initially was, and one below offers an improvement. Minimum RMSE Reached by Alignment Methods in the 1 D (min) and 2 D (sec) for Wine Chromatograms None (Avg.) Affine Poly2 Poly3 Gros et al. Chromatograms 1 D 2 D 1 D 2 D 1 D 2 D 1 D 2 D 1 D 2 D Average Table S1. Minimum testing-set RMSE reached by each alignment method in both the first and second chromatographic dimensions for all three experiments run with the non-replicate chromatograms from the wine samples. The None columns are the average initial misalignments, not the minimum. The red boxes indicate where the initial misalignment was made worse by a method. On average, no method was able to improve upon the initial alignment significantly in either dimension. S-7
8 Figure S7. Cross-validation retention-time RMSE results as a function of training set size for chromatograms produced from the same cocoa sample but using two different modulation platforms. Each row is a pair of chromatograms from two different runs. For example the top row is for chromatograms from run #1 on the flow modulator, and run #1 on the thermal modulator. S-8


9 A. Runs and B. Runs and C. Runs and Figure S8. Maximum absolute error as a function of the training set size for alignment of GCxGC diesel sample chromatograms. Columns from left to right are for 1 D with the training set, for 1 D with the testing set, for 2 D with the training set, and for 2 D with the testing set. Sets of rows with maximum absolute error on the top row of each set and the standard deviation of maximum absolute error on the bottom row of each set are for: A. Runs and , B. Runs and , C. Runs and , D. Runs and , E. Runs and , and F. Runs and S-9


10 D. Runs and E. Runs and F. Runs and Figure S8 continued. S-10


11 A. Samples 2011, 2012, Runs #2. B. Samples 2011, 2013, Runs #2. C. Samples 2012, 2013, Runs #2. Figure S9. Maximum absolute error as a function of the training set size for alignment of GCxGC wine sample. Columns from left to right are for 1 D with the training set, for 1 D with the testing set, for 2 D with the training set, and for 2 D with the testing set. Sets of rows with maximum absolute error on the top row of each set and the standard deviation of maximum absolute error on the bottom row of each set are for: A. Samples 2011, 2012, Runs #2, B. Samples 2011, 2012, Runs #2, and C. Samples 2012, 2013, Runs #2. S-11

12 A. Runs #1 and #1. B. Runs #1 and #2. C. Runs #1 and #3. Figure S10. Maximum absolute error as a function of the training set size for alignment of GCxGC cocoa sample chromatograms with different modulation platforms. Columns from left to right are for 1 D with the training set, for 1 D with the testing set, for 2 D with the training set, and for 2 D with the testing set. Sets of rows with maximum absolute error on the top row of each set and the standard deviation of maximum absolute error on the bottom row of each set are for: A. Runs #1 and #1, B. Runs #1 and #2, C. Runs #1 and #3, D. Runs #2 and #1, E. Runs #2 and #2, and D. Runs #2 and #3. S-12


13 D. Runs #2 and #1. E. Runs #2 and #2. F. Runs #2 and #3. Figure S10 continued. S-13

14 Figure S11. Diesel chromatogram Closed yellow circles represent peaks that were matched across all diesel chromatograms (112 peaks) and used as alignment points. S-14

15 Figure S12. Wine chromatogram MC2011R2. Closed yellow circles represent peaks that were matched across all wine chromatograms (78 peaks) and used as alignment points. S-15

16 Figure S13. Cocoa sample chromatogram Thermal 1. Closed yellow circles represent peaks that were matched across all cocoa chromatograms (33 peaks) and used as alignment points. S-16

17 Figure S14. Cocoa sample chromatogram Flow 1. Closed yellow circles represent peaks that were matched across all cocoa chromatograms (33 peaks) and used as alignment points. S-17
GC/LC-MS: data acquisition rate and peak reconstruction
 GC/LC-MS: data acquisition rate and peak reconstruction Nyquist (Shannon-Kotelnikov-Whittaker) theorem Signal sampling does not involve any loss of information as long as the sampling frequency is at least
GCxGC Comprehensive Two-Dimensional Gas Chromatography
 GCxGC Comprehensive Two-Dimensional Gas Chromatography Delivering the Right Results GCxGC Comprehensive Two-Dimensional Gas Chromatography Take your chromatography to the next level LECO comprehensive
GCxGC Comprehensive Two-Dimensional Gas Chromatography
 GCxGC Comprehensive Two-Dimensional Gas Chromatography Delivering the Right Results LECO s GCxGC Comprehensive Two-Dimensional Gas Chromatography Take your chromatography to the next level LECO comprehensive
Staying Connected in GC
 Staying Connected in GC Daron Decker / Eric Pavlich Chromatography Technical Specialists Page 1 Leaks (Oxygen) Damages GC Columns Repair of the GC column is impossible Replacements means re-calibration
HPLC Tips and Tricks. Tiziana Ladisa Sales Support Specialist for Chromatography Italy Thermo Fisher Scientific, Rodano (MI)
") HPLC Tips and Tricks Tiziana Ladisa Sales Support Specialist for Chromatography Italy Thermo Fisher Scientific, Rodano (MI) The world leader in serving science Overview Thermo Scientific UltiMate 3000
HPLC Tips and Tricks Tiziana Ladisa Sales Support Specialist for Chromatography Italy Thermo Fisher Scientific, Rodano (MI) The world leader in serving science Overview Thermo Scientific UltiMate 3000
Customer Responsibilities. Important Customer Information Infinity LC/1260 Infinity LC Site Preparation Checklist
 1290 Site Preparation Infinity LC/1260 Checklist Infinity LC Thank you for purchasing an Agilent instrument. To get you started and to assure a successful and timely installation, please refer to this
Liquid Chromatography- Mass Spectrometer Manual
 Liquid Chromatography- Mass Spectrometer Manual Joshua Willis, Elizabeth Sattely Department of Chemical Engineering Stanford University November 6, 2014 Abstract This manual will explain the LC/MS, its
AIM INTRODUCTION SIMPLIFIED WORKFLOW
 CD-R PATENT PROTECTION: BRAND CHARACTERIZATION TO IDENTIFY COUNTERFEIT GOODS USING SIMPLIFIED MASS SPECTROMETRY James Morphet and Eleanor Riches Waters Corporation, Manchester, UK AIM To provide an easy-to-use
BitWise (V2.1 and later) includes features for determining AP240 settings and measuring the Single Ion Area.
 includes features for determining AP240 settings and measuring the Single Ion Area.") BitWise. Instructions for New Features in ToF-AMS DAQ V2.1 Prepared by Joel Kimmel University of Colorado at Boulder & Aerodyne Research Inc. Last Revised 15-Jun-07 BitWise (V2.1 and later) includes features
BitWise. Instructions for New Features in ToF-AMS DAQ V2.1 Prepared by Joel Kimmel University of Colorado at Boulder & Aerodyne Research Inc. Last Revised 15-Jun-07 BitWise (V2.1 and later) includes features
UNITY 2 TM. Version 1.0. February 2008
 UNITY 2 TM ULTRA 50:50 Operators Manual Version 1.0 February 2008 1. Loading tubes onto ULTRA 50:50...3 1.1. DiffLok analytical end caps for sample tubes...3 1.2. Capping tubes with DiffLok caps...3 1.3.
Customer Responsibilities. Important Customer Information. Agilent InfinityLab LC Series Site Preparation Checklist
 Agilent Site Preparation InfinityLab Checklist LC Series Thank you for purchasing an Agilent instrument. To get you started and to assure a successful and timely installation, please refer to this specification
PAL LSI - Robust and Reliable Sample Handling
 PAL LSI - Robust and Reliable Sample Handling PAL LSI: Enhanced productivity due to innovative technology Large Sample Capacity: 162 x 2 ml-vials can be stored on one tray holder. The standard length PAL
Bruce Quimby. Agilent Technologies October 28, For Forensic Use. Page 1
 Bruce Quimby Application Scientist Agilent Technologies October 28, 2009 Page 1 Tools For Improving GC/MS Analysis Retention Time Locking (RTL) Method Translation Synchronous SIM/Scan Column effluent split
Detailed Design Report
 Detailed Design Report Chapter 4 MAX IV Injector 4.6. Acceleration MAX IV Facility CHAPTER 4.6. ACCELERATION 1(10) 4.6. Acceleration 4.6. Acceleration...2 4.6.1. RF Units... 2 4.6.2. Accelerator Units...
Agilent 7000 Series Triple Quadrupole GC/MS System
 Agilent 7000 Series Triple Quadrupole GC/MS System Concepts Guide The Big Picture Agilent Technologies Notices Agilent Technologies, Inc. 2011 No part of this manual may be reproduced in any form or by
Achieving More Efficient Data Review with OpenLAB CDS
 Achieving More Efficient Data Review with OpenLAB CDS Technical Note Introduction Separations have enjoyed major advances that have significantly reduced chromatographic run times. Ultra high performance
Waters GCT GCMS Training Manual (Nominal Mass GCMS version) 02/06/2012 S.V.
 02/06/2012 S.V.") 1234 Hach Hall 515-294-5805 www.cif.iastate.edu Waters GCT GCMS Training Manual (Nominal Mass GCMS version) 02/06/2012 S.V. Location: Contact: 1238 Hach Hall Steve Veysey, 1234 Hach Hall; Kamel Harrata,
1234 Hach Hall 515-294-5805 www.cif.iastate.edu Waters GCT GCMS Training Manual (Nominal Mass GCMS version) 02/06/2012 S.V. Location: Contact: 1238 Hach Hall Steve Veysey, 1234 Hach Hall; Kamel Harrata,
PAL LSI - Robust and Reliable Sample Handling
 PAL LSI - Robust and Reliable Sample Handling The PAL System, ingeniously reliable, flexible and productive PAL LSI: Innovative features giving real benefits Easy maintenance and adaptation: The different
New Filling Pattern for SLS-FEMTO
 SLS-TME-TA-2009-0317 July 14, 2009 New Filling Pattern for SLS-FEMTO Natalia Prado de Abreu, Paul Beaud, Gerhard Ingold and Andreas Streun Paul Scherrer Institut, CH-5232 Villigen PSI, Switzerland A new
Assay Creosote Extraction of Selected Posts from the 1958 Cooperative Test After 50 Years of Exposure as a Ground Contact Preservative
 Assay Creosote Extraction of Selected from the 1958 Cooperative Test After 50 Years of Exposure as a Ground Contact Preservative David A. Webb Creosote Council Valencia, Pennsylvania Stacy A. McKinney
RGA13, 12/10/17 Ultra High Resolution 20mm Quadrupole with Dual Zone operation
 RGA13, 12/10/17 Ultra High Resolution 20mm Quadrupole with Dual Zone operation The DLS-20 Hiden s 20mm Triple Filter Quadrupole By comparison, 6mm Triple Filter Quadrupole Quadrupole High resolution Quadrupoles
Durham Magneto Optics Ltd. NanoMOKE 3 Wafer Mapper. Specifications
 Durham Magneto Optics Ltd NanoMOKE 3 Wafer Mapper Specifications Overview The NanoMOKE 3 Wafer Mapper is an ultrahigh sensitivity Kerr effect magnetometer specially configured for measuring magnetic hysteresis
ICS-3000 System Installation Qualification
 IC System IQ ICS-3000 System Installation Qualification 2006 Dionex Corporation Document No. 065080 Revision 02 September 2006 Doc. 065080-02 2006, Dionex Corporation All rights reserved worldwide. Printed
Speed Performance Reliability. Medicinal Chemistry Natural Products Peptides & Polymers Organic Synthesis Purifications
 Automated Flash Chromatography Systems Medicinal Chemistry Natural Products Peptides & Polymers Organic Synthesis Purifications Speed Performance Reliability CombiFlash Rf - Making Fl Improve Your Productivity
Software Operation Manual
 Varian, Inc. 2700 Mitchell Drive Walnut Creek, CA 94598-1675/USA 4000 GC/MS Version 6 Software Operation Manual Varian, Inc. 2004-2009 Printed in U.S.A. 03-914999-00:Rev. 8 Trademark Acknowledgments Microsoft,
How Quadrupole Size Affects Research
 Quadrupole Size Comparison APPLICATION NOTE NOTE How Quadrupole Size Affects Research Mass Spectrometry is one of the most widely used analytical techniques and the most common mass analyzer is the quadrupole.
Instrument Control and Data Acquisition with Chromeleon
 Technical Note 67 Instrument Control and Data Acquisition with Chromeleon Introduction Laboratories generally have a combination of chromatography devices from different manufacturers and, therefore, face
If you have questions or problems in providing anything described as Customer
 Agilent Site Preparation 1260 Infinity Checklist Purification Solution Thank you for purchasing Agilent 1260 Infinity Purification Solution. To get you started and to assure a successful and timely installation,
1995 Metric CSJ SPECIAL SPECIFICATION ITEM 6031 SINGLE MODE FIBER OPTIC VIDEO TRANSMISSION EQUIPMENT
 1995 Metric CSJ 0508-01-258 SPECIAL SPECIFICATION ITEM 6031 SINGLE MODE FIBER OPTIC VIDEO TRANSMISSION EQUIPMENT 1.0 Description This Item shall govern for the furnishing and installation of color Single
TMT data acquisition on the LTQ-Orbitrap XL Mass Spectrometer
 TECH TIP # 70 TMT data acquisition on the LTQ-Orbitrap XL Mass Spectrometer Introduction TR0070.0 Successful acquisition of quantitative tandem mass tag (TMT*) data with the Thermo Scientific LTQ-Orbitrap
m RSC Chromatographie Integration Methods Second Edition CHROMATOGRAPHY MONOGRAPHS Norman Dyson Dyson Instruments Ltd., UK
 m RSC CHROMATOGRAPHY MONOGRAPHS Chromatographie Integration Methods Second Edition Norman Dyson Dyson Instruments Ltd., UK THE ROYAL SOCIETY OF CHEMISTRY Chapter 1 Measurements and Models The Basic Measurements
3 cerl. 3-1 cerl Overview. 3-2 High-brightness DC Photocathode Gun and Gun Test Beamline
 3 cerl 3-1 cerl Overview As described before, the aim of the cerl in the R&D program includes the development of critical components for the ERL, as well as the construction of a test accelerator. The
Commissioning the TAMUTRAP RFQ cooler/buncher. E. Bennett, R. Burch, B. Fenker, M. Mehlman, D. Melconian, and P.D. Shidling
 Commissioning the TAMUTRAP RFQ cooler/buncher E. Bennett, R. Burch, B. Fenker, M. Mehlman, D. Melconian, and P.D. Shidling In order to efficiently load ions into a Penning trap, the ion beam should be
MODE FIELD DIAMETER AND EFFECTIVE AREA MEASUREMENT OF DISPERSION COMPENSATION OPTICAL DEVICES
 MODE FIELD DIAMETER AND EFFECTIVE AREA MEASUREMENT OF DISPERSION COMPENSATION OPTICAL DEVICES Hale R. Farley, Jeffrey L. Guttman, Razvan Chirita and Carmen D. Pâlsan Photon inc. 6860 Santa Teresa Blvd
OTHER FEATURES UNIQUE FEATURES
 OTHER FEATURES H2 Generator + Zero Air Generator All-In-One Automatic Easy refill Cascading available up to 32 units PC Remote Software control via USB or RS232 Remote alarms/management Optional H2 sensor
1.2 Universiti Teknologi Brunei (UTB) reserves the right to award the tender in part or in full.
 reserves the right to award the tender in part or in full.") TENDER SPECIFICATIONS FOR THE SUPPLY, DELIVERY, INSTALLATION AND COMMISSIONING OF ONE UNIT OF VARIABLE PRESSURE ENVIRONMENTAL SCANNING ELECTRON MICROSCOPE (SEM) CUM ENERGY DISPERSIVE SPECTROSCOPY (EDS)
TENDER SPECIFICATIONS FOR THE SUPPLY, DELIVERY, INSTALLATION AND COMMISSIONING OF ONE UNIT OF VARIABLE PRESSURE ENVIRONMENTAL SCANNING ELECTRON MICROSCOPE (SEM) CUM ENERGY DISPERSIVE SPECTROSCOPY (EDS)
Operating pressure should be 6000 psi or better suitable for both analytical and semi-preparative applications
 S. No. NIPER-G/PUR/GLOBAL/2018/01 Technical Specification for Analytical HPLC with PDA & Fluorescence detector Fully automated analytical high performance liquid chromatography system with single point
Release Notes for LAS AF version 1.8.0
 October 1 st, 2007 Release Notes for LAS AF version 1.8.0 1. General Information A new structure of the online help is being implemented. The focus is on the description of the dialogs of the LAS AF. Configuration
arxiv:hep-ex/ v1 27 Nov 2003
 arxiv:hep-ex/0311058v1 27 Nov 2003 THE ATLAS TRANSITION RADIATION TRACKER V. A. MITSOU European Laboratory for Particle Physics (CERN), EP Division, CH-1211 Geneva 23, Switzerland E-mail: Vasiliki.Mitsou@cern.ch
2. AN INTROSPECTION OF THE MORPHING PROCESS
 1. INTRODUCTION Voice morphing means the transition of one speech signal into another. Like image morphing, speech morphing aims to preserve the shared characteristics of the starting and final signals,
EDDY CURRENT IMAGE PROCESSING FOR CRACK SIZE CHARACTERIZATION
 EDDY CURRENT MAGE PROCESSNG FOR CRACK SZE CHARACTERZATON R.O. McCary General Electric Co., Corporate Research and Development P. 0. Box 8 Schenectady, N. Y. 12309 NTRODUCTON Estimation of crack length
MTI-2100 FOTONIC SENSOR. High resolution, non-contact. measurement of vibration. and displacement
 A worldwide leader in precision measurement solutions MTI-2100 FOTONIC SENSOR High resolution, non-contact measurement of vibration and displacement MTI-2100 Fotonic TM Sensor Unmatched Resolution and
On Figure of Merit in PAM4 Optical Transmitter Evaluation, Particularly TDECQ
 On Figure of Merit in PAM4 Optical Transmitter Evaluation, Particularly TDECQ Pavel Zivny, Tektronix V1.0 On Figure of Merit in PAM4 Optical Transmitter Evaluation, Particularly TDECQ A brief presentation
Electrospray-MS Charge Deconvolutions without Compromise an Enhanced Data Reconstruction Algorithm utilising Variable Peak Modelling
 Electrospray-MS Charge Deconvolutions without Compromise an Enhanced Data Reconstruction Algorithm utilising Variable Peak Modelling Overview A.Ferrige1, S.Ray1, R.Alecio1, S.Ye2 and K.Waddell2 1 PPL,
PACS. Dark Current of Ge:Ga detectors from FM-ILT. J. Schreiber 1, U. Klaas 1, H. Dannerbauer 1, M. Nielbock 1, J. Bouwman 1.
 PACS Test Analysis Report FM-ILT Page 1 Dark Current of Ge:Ga detectors from FM-ILT J. Schreiber 1, U. Klaas 1, H. Dannerbauer 1, M. Nielbock 1, J. Bouwman 1 1 Max-Planck-Institut für Astronomie, Königstuhl
TL-2900 AMMONIA & NITRATE ANALYZER DUAL CHANNEL
 TL-2900 AMMONIA & NITRATE ANALYZER DUAL CHANNEL DATA ACQUISITION SYSTEM V.15.4 INSTRUCTION MANUAL Timberline Instruments, LLC 1880 S. Flatiron Ct., Unit I Boulder, Colorado 80301 Ph: (303) 440-8779 Fx:
SPECIAL SPECIFICATION 1987 Single Mode Fiber Optic Video Transmission Equipment
 1993 Specifications CSJ 0027-12-086, etc. SPECIAL SPECIFICATION 1987 Single Mode Fiber Optic Video Transmission Equipment 1. Description. This Item shall govern for the furnishing and installation of color
CAEN Tools for Discovery
 Viareggio March 28, 2011 Introduction: what is the SiPM? The Silicon PhotoMultiplier (SiPM) consists of a high density (up to ~10 3 /mm 2 ) matrix of diodes connected in parallel on a common Si substrate.
WELDING CONTROL UNIT: TE 450 USER MANUAL
 j WELDING CONTROL UNIT: TE 450 USER MANUAL RELEASE SOFTWARE No. 1.50 DOCUMENT NUMBER: MAN 4097 EDITION: MARCH 1998 This page is left blank intentionally. 2 / 34 TABLE OF CONTENTS SUBJECTS PAGE WELDING
Operation Manual for the Refractive Index detector VE-3580
 Operation Manual for the Refractive Index detector VE-3580 October 2012 (MAN0446-1.0) (Version 4.3) Page 1 of 32 pages Table of Contents Table of Contents... 3 Notices, Warnings and Definitions... 5 Figures...
Process Transmitter RMA 422
 Technical Information TI 072R/24/ae Process Transmitter RMA 422 Multi-functional 1-2 channel top hat DIN rail unit with loop power supply, alarm set point monitoring, mathematics function and 1-2 analog
LadyBug Technologies, LLC LB5908A True-RMS Power Sensor
 LadyBug Technologies, LLC LB5908A True-RMS Power Sensor LB5908ARev8 LadyBug Technologies www.ladybug-tech.com Telephone: 707-546-1050 Page 1 LB5908A Data Sheet Key PowerSensor+ TM Specifications Frequency
Agilent N7744A 4-Channel Optical Multiport Power Meter N7745A 8-Channel Optical Multiport Power Meter. Fully compliant to LXI Class C specification
 Agilent N7744A 4-Channel Optical Multiport Power Meter N7745A 8-Channel Optical Multiport Power Meter Fully compliant to LXI Class C specification General Information Up to 8 power meter channels in a
THE NEW LASER FAMILY FOR FINE WELDING FROM FIBER LASERS TO PULSED YAG LASERS
 FOCUS ON FINE SOLUTIONS THE NEW LASER FAMILY FOR FINE WELDING FROM FIBER LASERS TO PULSED YAG LASERS Welding lasers from ROFIN ROFIN s laser sources for welding satisfy all criteria for the optimized laser
FRACTION COLLECTOR. Microcomputer Controlled CHF122SC
 FRACTION COLLECTOR Microcomputer Controlled CHF122SC From open column to HPLC liquid chromatography and general liquid samplings, the Super Fraction Collector, model CHF122SC has a wide range of uses.
Vasudevan Agilent 1100 Series HPLC w/ DAD & FLD Detector (nonbuffer
 Vasudevan Agilent 1100 Series HPLC w/ DAD & FLD Detector (nonbuffer solvents) Updated November 14, 2017 Instrument instructions can be found at: http://academic.bowdoin.edu/chemistry/resources/instructions.shtml
Keysight Technologies Power Sensor Modules Optical Heads Return Loss Modules. Data Sheet
 Keysight Technologies Power Sensor Modules Optical Heads Return Loss Modules Data Sheet 02 Keysight Power Sensor Modules - Optical Heads - Return Loss Modules - Data Sheet Optical power measurement modules
SPECIFICATION NO Model 207 Automatic GTAW Welding System
 1.0 Introduction The Model 207 is a completely self-contained Gas Tungsten Arc Welding (GTAW) System requiring only input power, inert gas and AMI Welding Head (or manual torch) for operation. Its small
Adaptive decoding of convolutional codes
 Adv. Radio Sci., 5, 29 214, 27 www.adv-radio-sci.net/5/29/27/ Author(s) 27. This work is licensed under a Creative Commons License. Advances in Radio Science Adaptive decoding of convolutional codes K.
White Paper. Uniform Luminance Technology. What s inside? What is non-uniformity and noise in LCDs? Why is it a problem? How is it solved?
 White Paper Uniform Luminance Technology What s inside? What is non-uniformity and noise in LCDs? Why is it a problem? How is it solved? Tom Kimpe Manager Technology & Innovation Group Barco Medical Imaging
Design, Fabrication and Testing of Gun-Collector Test Module for 6 MW Peak, 24 kw Average Power, S-Band Klystron
 Available online www.ejaet.com European Journal of Advances in Engineering and Technology, 2014, 1(1): 11-15 Research Article ISSN: 2394-658X Design, Fabrication and Testing of Gun-Collector Test Module
potentiostat/galvanostat
 potentiostat/galvanostat Rev. 12-2012 potentiostat/galvanostat A battery-powered, handheld instrument which allows the application of most of the relevant voltammetric and amperometric techniques. The
Switching Solutions for Multi-Channel High Speed Serial Port Testing
 Switching Solutions for Multi-Channel High Speed Serial Port Testing Application Note by Robert Waldeck VP Business Development, ASCOR Switching The instruments used in High Speed Serial Port testing are
INSTRUCTION MANUAL COMMANDER BDH MIG
 INSTRUCTION MANUAL COMMANDER BDH MIG Valid from 0327 50173001A Version 1.0 CONTENTS INTRODUCTION... 0-1 1. PRIMARY OPERATIONAL FUNCTIONS... 1-1 Reading and setting... 1-1 Programmes... 1-2 Trigger function...
Sodern recent development in the design and verification of the passive polarization scramblers for space applications
 Sodern recent development in the design and verification of the passive polarization scramblers for space applications M. Richert, G. Dubroca, D. Genestier, K. Ravel, M. Forget, J. Caron and J.L. Bézy
SHF Communication Technologies AG,
 SHF Communication Technologies AG, Wilhelm-von-Siemens-Str. 23 D 12277 Berlin Marienfelde Germany Phone ++49 30 / 772 05 10 Fax ++49 30 / 753 10 78 E-Mail: mail@shf.biz Web: http://www.shf.biz Datasheet
NMR. picospin. Maintenance Guide
 NMR picospin Maintenance Guide 269-302600 Revision A January 2013 2013 Thermo Fisher Scientific Inc. All rights reserved. For U.S. Technical Support, please contact: Thermo Fisher Scientific 5225 Verona
FAST MOBILITY PARTICLE SIZER SPECTROMETER MODEL 3091
 FAST MOBILITY PARTICLE SIZER SPECTROMETER MODEL 3091 MEASURES SIZE DISTRIBUTION AND NUMBER CONCENTRATION OF RAPIDLY CHANGING SUBMICROMETER AEROSOL PARTICLES IN REAL-TIME UNDERSTANDING, ACCELERATED IDEAL
Experience with the Cornell ERL Injector SRF Cryomodule during High Beam Current Operation
 Experience with the Cornell ERL Injector SRF Cryomodule during High Beam Current Operation Matthias Liepe Assistant Professor of Physics Cornell University Experience with the Cornell ERL Injector SRF
Roots pumps with a pumping speed of 280 to 840 m 3 /h: Okta 500 DUO DN1 DN B A
 3.1 Vacuum generation / / Convection cooled OktaLine Okta 500 with a pumping speed of 280 to 840 m 3 /h: High-performance Roots pump with a pumping speed of 280 to 840 m 3 /h With 3-phase motor, IE2 No
JUMO extherm-at Type , explosion-proof surface-mounted thermostat for zones 1, 2, 21, and 22
 Data Sheet 605055 Page 1/8 Type 605055, explosion-proof surface-mounted thermostat for zones 1, 2, 21, and 22 Special features Single thermostat with capillary or rigid thermowell and double thermostat
Detection and demodulation of non-cooperative burst signal Feng Yue 1, Wu Guangzhi 1, Tao Min 1
 International Conference on Applied Science and Engineering Innovation (ASEI 2015) Detection and demodulation of non-cooperative burst signal Feng Yue 1, Wu Guangzhi 1, Tao Min 1 1 China Satellite Maritime
SPECIAL SPECIFICATION 1291 Fiber Optic Video Data Transmission Equipment
 1993 Specifications CSJ 0500-01-117 SPECIAL SPECIFICATION 1291 Fiber Optic Video Data Transmission Equipment 1. Description. This Item shall govern for the furnishing and installation of Fiber Optic Video
Advanced Test Equipment Rentals ATEC (2832)
") E stablished 1981 Advanced Test Equipment Rentals www.atecorp.com 800-404-ATEC (2832) Technical Datasheet Scalar Network Analyzer Model 8003-10 MHz to 40 GHz The Giga-tronics Model 8003 Precision Scalar
E stablished 1981 Advanced Test Equipment Rentals www.atecorp.com 800-404-ATEC (2832) Technical Datasheet Scalar Network Analyzer Model 8003-10 MHz to 40 GHz The Giga-tronics Model 8003 Precision Scalar
Service. Nu Instruments Service & Upgrades. ICP-MS, GD-MS, IRMS, Noble Gas.
 Service Nu Instruments Service & Upgrades ICP-MS, GD-MS, IRMS, Noble Gas www.nu-ins.com Nu Instruments Maintenance Contract Options Nu Instruments provides a range of post-warranty service solutions to
Broadcast Television Measurements
 Broadcast Television Measurements Data Sheet Broadcast Transmitter Testing with the Agilent 85724A and 8590E-Series Spectrum Analyzers RF and Video Measurements... at the Touch of a Button Installing,
Application Note AN-708 Vibration Measurements with the Vibration Synchronization Module
 Application Note AN-708 Vibration Measurements with the Vibration Synchronization Module Introduction The vibration module allows complete analysis of cyclical events using low-speed cameras. This is accomplished
Tutorial: Trak design of an electron injector for a coupled-cavity linear accelerator
 Tutorial: Trak design of an electron injector for a coupled-cavity linear accelerator Stanley Humphries, Copyright 2012 Field Precision PO Box 13595, Albuquerque, NM 87192 U.S.A. Telephone: +1-505-220-3975
GC Accessories. Accessories. Prep and Load Platform. PAL is a registered trademark of CTC Analytics AG Switzerland
 PAL Accessory Part Number Accessories Description Combi-xt GC-xt Prep and Load Platform GC PAL and PAL-xt product line accessory catalogue 2010 / 2011 1 PAL is a registered trademark of CTC Analytics AG
MTS/T-BERD 8000 Platform
 Key Features New optical design for field applications 50% reduction in size and weight for true OSNR measurements in ROADM networks Full spectral range of 1250 to 1650 nm for DWDM and CWDM testing High-resolution
Ecoline S series. Precision solutions for quality production. Innovations for a better world.
 Ecoline S series. Precision solutions for quality production. Innovations for a better world. Precision solutions for quality production. Die casting with confidence. The Ecoline S is a series of cold-chamber
Sealed Linear Encoders with Single-Field Scanning
 Linear Encoders Angle Encoders Sealed Linear Encoders with Single-Field Scanning Rotary Encoders 3-D Touch Probes Digital Readouts Controls HEIDENHAIN linear encoders are used as position measuring systems
Agilent 86120B, 86120C, 86122A Multi-Wavelength Meters Technical Specifications
 Agilent 86120B, 86120C, 86122A Multi-Wavelength Meters Technical Specifications March 2006 Agilent multi-wavelength meters are Michelson interferometer-based instruments that measure wavelength and optical
Online Process Control using Modular Fluid Delivery and Fast Process Gas Chromatography: From the Sample Point to the DCS Connection
 Falcon Analytical makers of the... Online Process Control using Modular Fluid Delivery and Fast Process Gas Chromatography: From the Sample Point to the DCS Connection John Crandall, President Ned Roques,
MTS/T-BERD 8000 Platform Optical Spectrum Analyzer Modules
 COMMUNICATIONS TEST & MEASUREMENT SOLUTIONS MTS/T-BERD 8000 Platform Optical Spectrum Analyzer Modules MTS/T-BERD platform Applications Provisioning and maintenance of ROADM networks Commissioning of DWDM
Accessories EXP1 - cards to 19 rack extending the number of 1Vpp outputs to 3 at one-input cards
 BREAK-TW-V.4/4, BREAK--V.4/4 BOX DIN RACK IP56 Optoconverters are designed to transfer videosignal and or data. I FM modulation I AGC optical loss I Universal for MM and SM fibres I Up to 3 independent
ISC0904: 1k x 1k 18µm N-on-P ROIC. Specification January 13, 2012
 ISC0904 1k x 1k 18µm N-on-P ROIC Specification January 13, 2012 This presentation contains content that is proprietary to FLIR Systems. Information is subject to change without notice. 1 Version 1.00 January
SPECIAL SPECIFICATION 6911 Fiber Optic Video Data Transmission Equipment
 2004 Specifications CSJ 3256-02-079 & 3256-03-082 SPECIAL SPECIFICATION 6911 Fiber Optic Video Data Transmission Equipment 1. Description. Furnish and install Fiber Optic Video Data Transmission Equipment
SECTION 4 TABLE OF CONTENTS
 Contents Introduction LC, SC and ST Series...4-2 Markets and Applications...4-2 International Standard Documents Compliance...4-2 LC Series Features and Benefits...4-3 LC Standard... 4-4 to 4-5 LC for
Iterative Direct DPD White Paper
 Iterative Direct DPD White Paper Products: ı ı R&S FSW-K18D R&S FPS-K18D Digital pre-distortion (DPD) is a common method to linearize the output signal of a power amplifier (PA), which is being operated
Nature Neuroscience: doi: /nn Supplementary Figure 1. Ensemble measurements are stable over a month-long timescale.
 Supplementary Figure 1 Ensemble measurements are stable over a month-long timescale. (a) Phase difference of the 30 Hz LFP from 0-30 days (blue) and 31-511 days (red) (n=182 channels from n=21 implants).
OPTICAL POWER METER WITH SMART DETECTOR HEAD
 OPTICAL POWER METER WITH SMART DETECTOR HEAD Features Fast response (over 1000 readouts/s) Wavelengths: 440 to 900 nm for visible (VIS) and 800 to 1700 nm for infrared (IR) NIST traceable Built-in attenuator
Supplemental Material for Gamma-band Synchronization in the Macaque Hippocampus and Memory Formation
 Supplemental Material for Gamma-band Synchronization in the Macaque Hippocampus and Memory Formation Michael J. Jutras, Pascal Fries, Elizabeth A. Buffalo * *To whom correspondence should be addressed.
Agilent High Capacity RV Pumps & Roots Pumping Systems
 Agilent High Capacity RV Pumps & Roots Pumping Systems 2-3 MS-Series Rotary Vane Pumps 4-5 RPS-Series Roots Pumping Systems and RPK-Series Roots Pumping Kits 6-7 Typical Applications 8-15 Pump Models MS-Series
SPECIFICATION NO NOTE
 NOTE The Model 207-1 is a special version of the standard M-207 Power Supply. It has been altered for a special applications requiring low current operation at high arc voltages in ambient and pressurized
M1 OSCILLOSCOPE TOOLS
 Calibrating a National Instruments 1 Digitizer System for use with M1 Oscilloscope Tools ASA Application Note 11-02 Introduction In ASA s experience of providing value-added functionality/software to oscilloscopes/digitizers
STATUS OF THE SWISSFEL C-BAND LINEAR ACCELERATOR
 Proceedings of FEL213, New York, NY, USA STATUS OF THE SWISSFEL C-BAND LINEAR ACCELERATOR F. Loehl, J. Alex, H. Blumer, M. Bopp, H. Braun, A. Citterio, U. Ellenberger, H. Fitze, H. Joehri, T. Kleeb, L.
ECE 4220 Real Time Embedded Systems Final Project Spectrum Analyzer
 ECE 4220 Real Time Embedded Systems Final Project Spectrum Analyzer by: Matt Mazzola 12222670 Abstract The design of a spectrum analyzer on an embedded device is presented. The device achieves minimum
Results of the June 2000 NICMOS+NCS EMI Test
 Results of the June 2 NICMOS+NCS EMI Test S. T. Holfeltz & Torsten Böker September 28, 2 ABSTRACT We summarize the findings of the NICMOS+NCS EMI Tests conducted at Goddard Space Flight Center in June
A New 4MW LHCD System for EAST
 1 EXW/P7-29 A New 4MW LHCD System for EAST Jiafang SHAN 1), Yong YANG 1), Fukun LIU 1), Lianmin ZHAO 1) and LHCD Team 1) 1) Institute of Plasma Physics, Chinese Academy of Sciences, Hefei, China E-mail