CSE Data Visualization. Graphical Perception. Jeffrey Heer University of Washington
|
|
|
- Audrey Edwards
- 5 years ago
- Views:
Transcription


1 CSE Data Visualization Graphical Perception Jeffrey Heer University of Washington
2 Design Principles [Mackinlay 86] Expressiveness A set of facts is expressible in a visual language if the sentences (i.e. the visualizations) in the language express all the facts in the set of data, and only the facts in the data. Effectiveness A visualization is more effective than another visualization if the information conveyed by one visualization is more readily perceived than the information in the other visualization.
3 Design Principles Translated Tell the truth and nothing but the truth (don t lie, and don t lie by omission) Use encodings that people decode better (where better = faster and/or more accurate)
4 Which best encodes quantities? Position Length Area Volume Value (Brightness) Color Hue Orientation (Angle) Shape
5 Effectiveness Rankings [Mackinlay 86] QUANTITATIVE ORDINAL NOMINAL Position Position Position Length Density (Value) Color Hue Angle Color Sat Texture Slope Color Hue Connection Area (Size) Texture Containment Volume Connection Density (Value) Density (Value) Containment Color Sat Color Sat Length Shape Color Hue Angle Length Texture Slope Angle Connection Area (Size) Slope Containment Volume Area Shape Shape Volume
6 Graphical Perception The ability of viewers to interpret visual (graphical) encodings of information and thereby decode information in graphs.
7 Topics Signal Detection Magnitude Estimation Pre-Attentive Processing Using Multiple Visual Encodings Gestalt Grouping Change Blindness
8 Detection
9 Detecting Brightness Which is brighter?

 Which")
10 Detecting Brightness (128, 128, 128) (144, 144, 144) Which is brighter?
11
12 Detecting Brightness Which is brighter?
13 Detecting Brightness (134, 134, 134) (128, 128, 128) Which is brighter?

14 Just Noticeable Difference (JND) JND (Weber s Law) Perceived Change Scale Factor (Empirically Determined) Ratios more important than magnitude Most continuous variation in stimuli are perceived in discrete steps Change of Intensity Physical Intensity
15 Encoding Data with Color Value is perceived as ordered Encode ordinal variables (O) Encode continuous variables (Q) [not as well] Hue is normally perceived as unordered Encode nominal variables (N) using color
16 Steps in Font Size Sizes standardized in 16 th century a a a a a a a a a a a a a a a a
17 Magnitude Estimation
18 A Quick Experiment
19 Compare area of circles
20 Compare length of bars
21 Compare area of circles
22 Compare length of bars
23 Steven s Power Law Exponent (Empirically Determined) Perceived Sensation Physical Intensity Predicts bias, not necessarily accuracy! [Graph from Wilkinson 99, based on Stevens 61]
24 Exponents of Power Law Sensation Exponent Loudness 0.6 Brightness 0.33 Smell 0.55 (Coffee) (Heptane) Taste 0.6 (Saccharine) -1.3 (Salt) Temperature 1.0 (Cold) 1.6 (Warm) Vibration 0.6 (250 Hz) 0.95 (60 Hz) Duration 1.1 Pressure 1.1 Heaviness 1.45 Electic Shock 3.5 [Psychophysics of Sensory Function, Stevens 61]

25 Apparent Magnitude Scaling [Cartography: Thematic Map Design, Figure 8.6, p. 170, Dent, 96] S = 0.98A 0.87 [from Flannery 71]
26 Graphical Perception [Cleveland & McGill 84]
27
28 Cleveland & McGill, 84
29 Position 1 Position 2 Position 3 Length 1 Length 2 Angle Area (Circular) Area (Rect 1) Area (Rect 2) Heer & Bostock 10 Log Absolute Estimation Error Graphical Perception Experiments Empirical estimates of encoding effectiveness
30 Relative Magnitude Comparison Most accurate Position (common) scale Position (non-aligned) scale Length Slope Angle Area Volume Least accurate Color hue-saturation-density
31 Effectiveness Rankings [Mackinlay 86] QUANTITATIVE ORDINAL NOMINAL Position Position Position Length Density (Value) Color Hue Angle Color Sat Texture Slope Color Hue Connection Area (Size) Texture Containment Volume Connection Density (Value) Density (Value) Containment Color Sat Color Sat Length Shape Color Hue Angle Length Texture Slope Angle Connection Area (Size) Slope Containment Volume Area Shape Shape Volume
32 Administrivia


33 A3: Interactive Prototype Create an interactive visualization. Choose a driving question for a dataset and develop an appropriate visualization + interaction techniques, then deploy your visualization on the web. Due by 11:59pm on Monday, April 30. Register your team by EOD, Friday, April 20!
34 D3.js Tutorial Date: Thursday, April 19 Time: 4:30pm to 6:30pm Location: Sieg 134 D3.js is a popular JavaScript visualization library, valuable for A3 and your Final Project
35 Pre-Attentive Processing
36 How Many 3 s? [based on a slide from J. Stasko]
37 How Many 3 s? [based on a slide from J. Stasko]

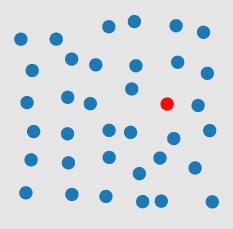
38 Visual Pop-Out: Color

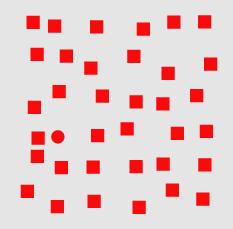
39 Visual Pop-Out: Shape

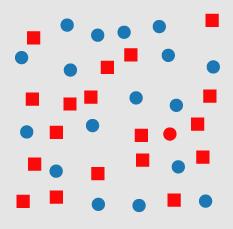
40 Feature Conjunctions
41 Pre-Attentive Features [Information Visualization. Figure 5. 5 Ware 04]
42 More Pre-Attentive Features Line (blob) orientation Julesz & Bergen [1983]; Wolfe et al. [1992] Length Triesman & Gormican [1988] Width Julesz [1985] Size Triesman & Gelade [1980] Curvature Triesman & Gormican [1988] Number Julesz [1985]; Trick & Pylyshyn [1994] Terminators Julesz & Bergen [1983] Intersection Julesz & Bergen [1983] Closure Enns [1986]; Triesman & Souther [1985] Colour (hue) Nagy & Sanchez [1990, 1992]; D'Zmura [1991]; Kawai et al. [1995]; Bauer et al. [1996] Intensity Beck et al. [1983]; Triesman & Gormican [1988] Flicker Julesz [1971] Direction of motion Nakayama & Silverman [1986]; Driver & McLeod [1992] Binocular lustre Wolfe & Franzel [1988] Stereoscopic depth Nakayama & Silverman [1986] 3-D depth cues Enns [1990] Lighting direction Enns [1990]
43 Pre-Attentive Conjunctions Spatial conjunctions are often pre-attentive Motion and 3D disparity Motion and color Motion and shape 3D disparity and color 3D disparity and shape But most conjunctions are NOT pre-attentive

44 Feature Integration Theory Feature maps for orientation & color [Green] Treisman s feature integration model [Healey 04]
45 Multiple Attributes


46 One-Dimensional: Lightness White White Black White Black White Black Black White White
47 One-Dimensional: Shape Square Circle Circle Square Circle Circle Circle Square Circle Circle

48 Redundant: Shape & Lightness Circle Square Square Circle Square Circle Square Square Square Circle


49 Orthogonal: Shape & Lightness Circle Square Square Circle Square
50 Speeded Classification Redundancy Gain Facilitation in reading one dimension when the other provides redundant information Filtering Interference Difficulty in ignoring one dimension while attending to the other


51 Speeded Classification Response Time Interference Gain R 1 O R 1 O Lightness Shape Dimension Classified
52 Types of Perceptual Dimensions Integral Filtering interference and redundancy gain Separable No interference or gain Asymmetric One dim separable from other, not vice versa Example: The Stroop effect color naming is influenced by word identity, but word naming is not influenced by color
53 Stroop Effect: What word? blue yellow red orange green purple
54 Stroop Effect: What color? blue yellow red orange green purple
55 Size and Value W. S. Dobson, Visual information processing and cartographic communication: The role of redundant stimulus dimensions, 1983 (reprinted in MacEachren, 1995)
56 Orientation & Size How well can you see temperature or precipitation? Is there a correlation between the two? [MacEachren 95]
57 Shape & Size Easier to see one shape across multiple sizes than one size of across multiple shapes? [MacEachren 95]

58 Length & Length [MacEachren 95]
59 Angle & Angle [MacEachren 95]
60 Summary of Integral & Separable Integral [Figure 5.25, Color Plate 10, Ware 2000] Separable

61 Set Each card has 4 features: Color Symbol Number Shading/Texture A set consists of 3 cards in which each feature is the SAME or DIFFERENT on each card.
62 Gestalt Grouping
63 Gestalt Principles Figure/Ground Proximity Similarity Symmetry Connectedness Continuity Closure Common Fate Transparency


64 Figure/Ground Principle of surroundedness Ambiguous Principle of relative size
 http://www.aber.ac.")
65 Figure/Ground Ambiguous Unambiguous (?)


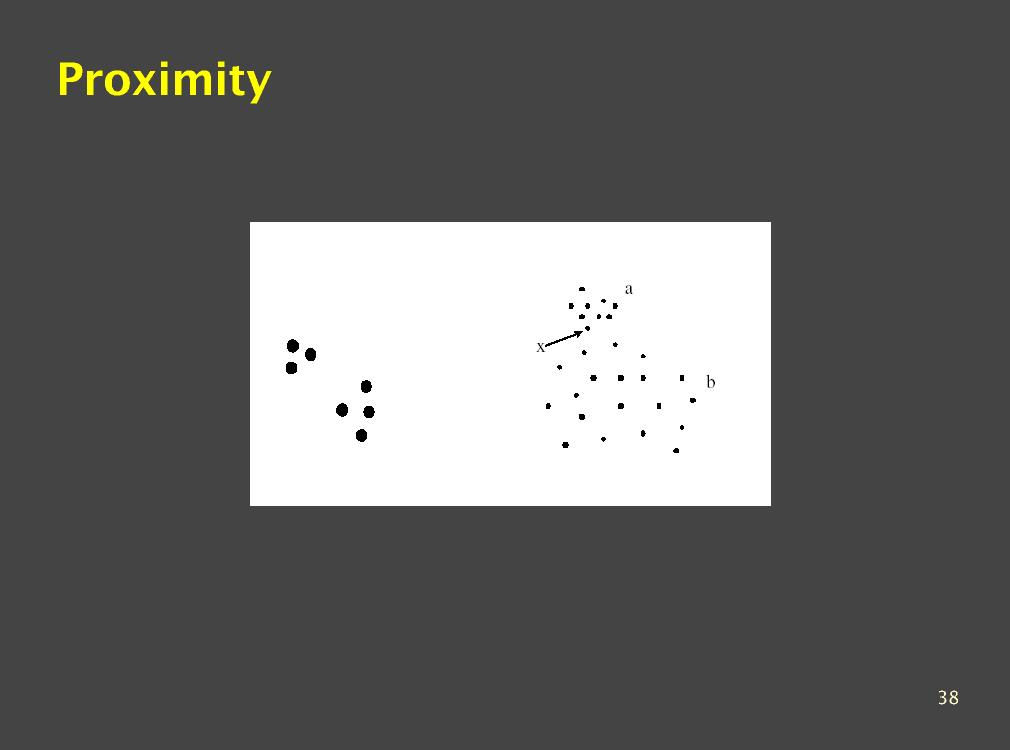
66 Proximity [Ware 00]

67 Similarity Rows dominate due to similarity [from Ware 04]
68 Symmetry Bilateral symmetry gives strong sense of figure [from Ware 04]

69 Connectedness Connectedness overrules proximity, size, color shape [from Ware 04]

70 Continuity We prefer smooth not abrupt changes [from Ware 04] Connections are clearer with smooth contours [from Ware 04]
71 Continuity: Vector Fields Prefer field that shows smooth continuous contours [from Ware 04]
72 Continuity: Vector Fields Prefer field that shows smooth continuous contours [from Ware 04]

![broken circle [from Ware 04]](/docs-images/89/100773745/images/73-1.jpg "Illusory contours [from")
73 Closure We see a circle behind a rectangle, not a broken circle [from Ware 04] Illusory contours [from Durand 02]
74 Common Fate Dots moving together are grouped

75 Transparency Requires continuity and proper color correspondence [from Ware 04]
76 Layering
77 Layering: Gridlines Electrocardiogram tracelines [from Tufte 90]
78 Layering: Gridlines Stravinsky score [from Tufte 90]
79 Setting Gridline Contrast How light can gridlines be and remain visible? How dark can gridlines be and not distract? Safe setting: 20% Alpha [Stone & Bartram 2009] [Heer & Bostock 2010]
80 Change Blindness
81 Change Blindness
82 Change Blindness

83 Change Blindness
84 Change Blindness
85 Change Blindness [Example from Palmer 99, originally due to Rock]
86 Demonstrations
87 Summary Choosing effective visual encodings requires knowledge of visual perception. Visual features/attributes Individual attributes often pre-attentive Multiple attributes may be separable or integral Gestalt principles provide high-level guidelines We don t always see everything that is there!
Graphical Perception. Graphical Perception. Graphical Perception. Which best encodes quantities? Jeffrey Heer Stanford University
 CS448B :: 7 Oct 2010 Graphical Perception Graphical Perception Jeffrey Heer Stanford University Graphical Perception The ability of viewers to interpret visual (graphical) encodings of information and
Graphical Perception. Graphical Perception. Which best encodes quantities?
 CS448B :: 11 Oct 2012 Graphical Perception Graphical Perception The ability of viewers to interpret visual (graphical) encodings of information and thereby decode information in graphs. Jeffrey Heer Stanford
Principles of Data Visualization. Jeffrey University of Washington
 Principles of Data Visualization Jeffrey Heer @jeffrey_heer University of Washington Data Analysis & Statistics, Tukey & Wilk 1966 Four major influences act on data analysis today: 1. The formal theories
Recap of Last (Last) Week
 Week") Recap of Last (Last) Week 1 The Beauty of Information Visualization Napoléon s Historical Retreat 2 Course Design Homepage: have you visited and registered? 3 The Value of Information Visualization Have
Recap of Last (Last) Week 1 The Beauty of Information Visualization Napoléon s Historical Retreat 2 Course Design Homepage: have you visited and registered? 3 The Value of Information Visualization Have
Data Visualization (CIS 468)
") Data Visualization (CIS 468) Marks & Channels Dr. David Koop Visual Encoding How should we visualize this data? Name Region Population Life Expectancy Income China East Asia & Pacific 1335029250 73.28
Data Visualization (CIS 468) Marks & Channels Dr. David Koop Visual Encoding How should we visualize this data? Name Region Population Life Expectancy Income China East Asia & Pacific 1335029250 73.28
Visual Encoding Design
 CSE 442 - Data Visualization Visual Encoding Design Jeffrey Heer University of Washington A Design Space of Visual Encodings Mapping Data to Visual Variables Assign data fields (e.g., with N, O, Q types)
CSE Data Visualization. Color. Jeffrey Heer University of Washington
 CSE 512 - Data Visualization Color Jeffrey Heer University of Washington Color in Visualization Identify, Group, Layer, Highlight Colin Ware Purpose of Color To label To measure To represent and imitate
Color in Information Visualization
 Color in Information Visualization James Bernhard April 2012 Color serves different purposes in art and in information visualization: In art, color is used for creative and expressive purposes In information
Music 175: Pitch II. Tamara Smyth, Department of Music, University of California, San Diego (UCSD) June 2, 2015
 June 2, 2015") Music 175: Pitch II Tamara Smyth, trsmyth@ucsd.edu Department of Music, University of California, San Diego (UCSD) June 2, 2015 1 Quantifying Pitch Logarithms We have seen several times so far that what
Music 175: Pitch II Tamara Smyth, trsmyth@ucsd.edu Department of Music, University of California, San Diego (UCSD) June 2, 2015 1 Quantifying Pitch Logarithms We have seen several times so far that what
The theory of data visualisation
 The theory of data visualisation V2017-10 Simon Andrews, Phil Ewels simon.andrews@babraham.ac.uk phil.ewels@scilifelab.se Data Visualisation A scientific discipline involving the creation and study of
S. S. Stevens papers,
 Overview of the Collection Creator Stevens, S. S. (Stanley Smith), 1906-1973 Title S. S. Stevens papers Dates 1934-1981 (inclusive) 1934 1981 Quantity 1.75 linear feet Collection Number Accn1888 Summary
Statistics for Engineers
 Statistics for Engineers ChE 4C3 and 6C3 Kevin Dunn, 2013 kevin.dunn@mcmaster.ca http://learnche.mcmaster.ca/4c3 Overall revision number: 19 (January 2013) 1 Copyright, sharing, and attribution notice
Minimizing the Perception of Chromatic Noise in Digital Images
 Minimizing the Perception of Chromatic Noise in Digital Images Xiaoyan Song, Garrett M. Johnson, Mark D. Fairchild Munsell Color Science Laboratory Rochester Institute of Technology, Rochester, N, USA
ARCH 121 INTRODUCTION TO ARCHITECTURE I WEEK
 ARCH 121 INTRODUCTION TO ARCHITECTURE I WEEK 3: Form: Perceptual Laws of Visual Organization (Gestalt Theory) and Compositional Principles (Part 1) From: Roth, L., Understanding Architecture: Its Elements,
Lecture 5: Clustering and Segmentation Part 1
 Lecture 5: Clustering and Segmentation Part 1 Professor Fei Fei Li Stanford Vision Lab 1 What we will learn today Segmentation and grouping Gestalt principles Segmentation as clustering K means Feature
Barbara Tversky. using space to represent space and meaning
 Barbara Tversky using space to represent space and meaning Prologue About public representations: About public representations: Maynard on public representations:... The example of sculpture might suggest
The Art and Science of Depiction. Color. Fredo Durand MIT- Lab for Computer Science
 The Art and Science of Depiction Color Fredo Durand MIT- Lab for Computer Science Color Color Vision 2 Talks Abstract Issues Color Vision 3 Plan Color blindness Color Opponents, Hue-Saturation Value Perceptual
Vannevar Bush: As We May Think
 Vannevar Bush: As We May Think 1. What is the context in which As We May Think was written? 2. What is the Memex? 3. In basic terms, how was the Memex intended to work? 4. In what ways does personal computing
Introduction to Psychology Prof. Braj Bhushan Department of Humanities and Social Sciences Indian Institute of Technology, Kanpur
 Introduction to Psychology Prof. Braj Bhushan Department of Humanities and Social Sciences Indian Institute of Technology, Kanpur Lecture 08 Perception Gestalt Principles Till now, we have talked about
1/29/2008. Announcements. Announcements. Announcements. Announcements. Announcements. Announcements. Project Turn-In Process. Quiz 2.
 Project Turn-In Process Put name, lab, UW NetID, student ID, and URL for project on a Word doc Upload to Catalyst Collect It Project 1A: Turn in before 11pm Wednesday Project 1B Turn in before 11pm a week
Announcements. Project Turn-In Process. Project 1A: Project 1B. and URL for project on a Word doc Upload to Catalyst Collect It
 Announcements Project Turn-In Process Put name, lab, UW NetID, student ID, and URL for project on a Word doc Upload to Catalyst Collect It Project 1A: Turn in before 11pm Wednesday Project 1B T i b f 11
BBM 413 Fundamentals of Image Processing Dec. 11, Erkut Erdem Dept. of Computer Engineering Hacettepe University. Segmentation Part 1
 BBM 413 Fundamentals of Image Processing Dec. 11, 2012 Erkut Erdem Dept. of Computer Engineering Hacettepe University Segmentation Part 1 Image segmentation Goal: identify groups of pixels that go together
AUD 6306 Speech Science
 AUD 3 Speech Science Dr. Peter Assmann Spring semester 2 Role of Pitch Information Pitch contour is the primary cue for tone recognition Tonal languages rely on pitch level and differences to convey lexical
Announcements. Project Turn-In Process. and URL for project on a Word doc Upload to Catalyst Collect It
 Announcements Project Turn-In Process Put name, lab, UW NetID, student ID, and URL for project on a Word doc Upload to Catalyst Collect It 1 Project 1A: Announcements Turn in the Word doc or.txt file before
Brain-Computer Interface (BCI)
") Brain-Computer Interface (BCI) Christoph Guger, Günter Edlinger, g.tec Guger Technologies OEG Herbersteinstr. 60, 8020 Graz, Austria, guger@gtec.at This tutorial shows HOW-TO find and extract proper signal
Brain-Computer Interface (BCI) Christoph Guger, Günter Edlinger, g.tec Guger Technologies OEG Herbersteinstr. 60, 8020 Graz, Austria, guger@gtec.at This tutorial shows HOW-TO find and extract proper signal
Visualizing Social Networks
 Visualizing Social Networks How to Create Meaningful and Compelling Network Drawings Jürgen Pfeffer jpfeffer@cs.cmu.edu @JurgenPfeffer Sunbelt 2014 St. Pete Beach, Florida Jürgen Pfeffer Assistant Research
1.4.5.A2 Formalism in dance, music, theatre, and visual art varies according to personal, cultural, and historical contexts.
 Unit Overview Content Area: Art Unit Title: Storytelling in art Grade Level: 4 Unit Summary: This unit is intended to be taught throughout the year as a unifying theme for the year s lessons. In fourth
2. MESSAGES OF THE ELEMENTS AND THEIR COMBINATION
 2. MESSAGES OF THE ELEMENTS AND THEIR COMBINATION Researchers have categorized visuality in a variety of ways. Annikki Arola-Anttila divides the visuality into dots that shape lines and forms, the dynamics
GCT535- Sound Technology for Multimedia Timbre Analysis. Graduate School of Culture Technology KAIST Juhan Nam
 GCT535- Sound Technology for Multimedia Timbre Analysis Graduate School of Culture Technology KAIST Juhan Nam 1 Outlines Timbre Analysis Definition of Timbre Timbre Features Zero-crossing rate Spectral
1. Use interesting materials and/or techniques. Title: Medium: Comments:
 ART CAN! Find pieces that match these aspects of Contemporary Art. 1. Use interesting materials and/or techniques. Title: Medium: Comments: 2. Express emotions without relying on recognizable images. Title:
Edge-Aware Color Appearance. Supplemental Material
 Edge-Aware Color Appearance Supplemental Material Min H. Kim 1,2 Tobias Ritschel 3,4 Jan Kautz 2 1 Yale University 2 University College London 3 Télécom ParisTech 4 MPI Informatik 1 Color Appearance Data
BitWise (V2.1 and later) includes features for determining AP240 settings and measuring the Single Ion Area.
 includes features for determining AP240 settings and measuring the Single Ion Area.") BitWise. Instructions for New Features in ToF-AMS DAQ V2.1 Prepared by Joel Kimmel University of Colorado at Boulder & Aerodyne Research Inc. Last Revised 15-Jun-07 BitWise (V2.1 and later) includes features
BitWise. Instructions for New Features in ToF-AMS DAQ V2.1 Prepared by Joel Kimmel University of Colorado at Boulder & Aerodyne Research Inc. Last Revised 15-Jun-07 BitWise (V2.1 and later) includes features
Permutations of the Octagon: An Aesthetic-Mathematical Dialectic
 Proceedings of Bridges 2015: Mathematics, Music, Art, Architecture, Culture Permutations of the Octagon: An Aesthetic-Mathematical Dialectic James Mai School of Art / Campus Box 5620 Illinois State University
DESIGN PRINCIPLES AND ELEMENTS. By Mark Gillan
 DESIGN PRINCIPLES AND ELEMENTS By Mark Gillan ELEMENTS OF DESIGN Components or part of which can be defined in any visual design or art work. The carry the work the structure PRINCIPLES OF DESIGN Concepts
Television History. Date / Place E. Nemer - 1
 Television History Television to see from a distance Earlier Selenium photosensitive cells were used for converting light from pictures into electrical signals Real breakthrough invention of CRT AT&T Bell
Murdoch redux. Colorimetry as Linear Algebra. Math of additive mixing. Approaching color mathematically. RGB colors add as vectors
 Murdoch redux Colorimetry as Linear Algebra CS 465 Lecture 23 RGB colors add as vectors so do primary spectra in additive display (CRT, LCD, etc.) Chromaticity: color ratios (r = R/(R+G+B), etc.) color
The Development of a Synthetic Colour Test Image for Subjective and Objective Quality Assessment of Digital Codecs
 2005 Asia-Pacific Conference on Communications, Perth, Western Australia, 3-5 October 2005. The Development of a Synthetic Colour Test Image for Subjective and Objective Quality Assessment of Digital Codecs
Technical Specifications
 1 Contents INTRODUCTION...3 ABOUT THIS LAB...3 IMPORTANCE OF THE MODULE...3 APPLYING IMAGE ENHANCEMENTS...4 Adjusting Toolbar Enhancement...4 EDITING A LOOKUP TABLE...5 Trace-editing the LUT...6 Comparing
On the relationship between the spatial channels for luminance and disparity processing
 Vision Research 39 (1999) 559 568 On the relationship between the spatial channels for luminance and disparity processing Robert F. Hess *, Frederick A.A. Kingdom, Lynn R. Ziegler Department of Ophthalmology,
UC San Diego UC San Diego Previously Published Works
 UC San Diego UC San Diego Previously Published Works Title Classification of MPEG-2 Transport Stream Packet Loss Visibility Permalink https://escholarship.org/uc/item/9wk791h Authors Shin, J Cosman, P
Musical Acoustics Lecture 15 Pitch & Frequency (Psycho-Acoustics)
") 1 Musical Acoustics Lecture 15 Pitch & Frequency (Psycho-Acoustics) Pitch Pitch is a subjective characteristic of sound Some listeners even assign pitch differently depending upon whether the sound was
1 Musical Acoustics Lecture 15 Pitch & Frequency (Psycho-Acoustics) Pitch Pitch is a subjective characteristic of sound Some listeners even assign pitch differently depending upon whether the sound was
Audiovisual Archiving Terminology
 Audiovisual Archiving Terminology A Amplitude The magnitude of the difference between a signal's extreme values. (See also Signal) Analog Representing information using a continuously variable quantity
The Lecture Contains: Frequency Response of the Human Visual System: Temporal Vision: Consequences of persistence of vision: Objectives_template
 The Lecture Contains: Frequency Response of the Human Visual System: Temporal Vision: Consequences of persistence of vision: file:///d /...se%20(ganesh%20rana)/my%20course_ganesh%20rana/prof.%20sumana%20gupta/final%20dvsp/lecture8/8_1.htm[12/31/2015
Pitch Perception. Roger Shepard
 Pitch Perception Roger Shepard Pitch Perception Ecological signals are complex not simple sine tones and not always periodic. Just noticeable difference (Fechner) JND, is the minimal physical change detectable
Colour Reproduction Performance of JPEG and JPEG2000 Codecs
 Colour Reproduction Performance of JPEG and JPEG000 Codecs A. Punchihewa, D. G. Bailey, and R. M. Hodgson Institute of Information Sciences & Technology, Massey University, Palmerston North, New Zealand
Understanding PQR, DMOS, and PSNR Measurements
 Understanding PQR, DMOS, and PSNR Measurements Introduction Compression systems and other video processing devices impact picture quality in various ways. Consumers quality expectations continue to rise
Urban Space and Architectural Scale - Two Examples of Empirical Research in Architectural Aesthetics
 Urban Space and Architectural Scale - Two Examples of Empirical Research in Architectural Aesthetics Weber, Ralf and Wolter, Birgit*; Jacobsen, Thomas*; Vosskoetter, Silke** * Collaborators in Project
2 2 Relay outputs. M DIN W72 H7mm. LE7 Weekly/Yearly timer
 LE7M-2 W72 H72mm, Weekly/Yearly Timer Features Easy to check and change the program setting Customizable weekly or yearly unit time setting and control by user Includes daylight saving time function Built-in
DATA VISUALIZATION BE A VISUAL NINJA APRIL 7, 2015
 DATA VISUALIZATION DATA VISUALIZATION BE A VISUAL NINJA APRIL 7, 2015 Hello there! What is graphical excellence? Hello there! how can I make my data visually Excellent? Hello there! let s talk What this
Speech Recognition and Signal Processing for Broadcast News Transcription
 2.2.1 Speech Recognition and Signal Processing for Broadcast News Transcription Continued research and development of a broadcast news speech transcription system has been promoted. Universities and researchers
Audio and Video II. Video signal +Color systems Motion estimation Video compression standards +H.261 +MPEG-1, MPEG-2, MPEG-4, MPEG- 7, and MPEG-21
 Audio and Video II Video signal +Color systems Motion estimation Video compression standards +H.261 +MPEG-1, MPEG-2, MPEG-4, MPEG- 7, and MPEG-21 1 Video signal Video camera scans the image by following
Common Spatial Patterns 2 class BCI V Copyright 2012 g.tec medical engineering GmbH
 g.tec medical engineering GmbH Sierningstrasse 14, A-4521 Schiedlberg Austria - Europe Tel.: (43)-7251-22240-0 Fax: (43)-7251-22240-39 office@gtec.at, http://www.gtec.at Common Spatial Patterns 2 class
ELEMENTS AND PRINCIPLES OF DESIGN
 ELEMENTS AND PRINCIPLES OF DESIGN The Elements of Design The Elements of Design (what we see): Line Shape & Form Colour Texture Space Proportion Line Lines have direction: A linear mark on a page vertical,
UNIVERSITY OF MASSACHUSETTS Department of Biostatistics and Epidemiology BioEpi 540W - Introduction to Biostatistics Fall 2002
 1 UNIVERSITY OF MASSACHUSETTS Department of Biostatistics and Epidemiology BioEpi 540W - Introduction to Biostatistics Fall 2002 Exercises Unit 2 Descriptive Statistics Tables and Graphs Due: Monday September
Quarterly Progress and Status Report. Violin timbre and the picket fence
 Dept. for Speech, Music and Hearing Quarterly Progress and Status Report Violin timbre and the picket fence Jansson, E. V. journal: STL-QPSR volume: 31 number: 2-3 year: 1990 pages: 089-095 http://www.speech.kth.se/qpsr
Chapt er 3 Data Representation
 Chapter 03 Data Representation Chapter Goals Distinguish between analog and digital information Explain data compression and calculate compression ratios Explain the binary formats for negative and floating-point
The Tone Height of Multiharmonic Sounds. Introduction
 Music-Perception Winter 1990, Vol. 8, No. 2, 203-214 I990 BY THE REGENTS OF THE UNIVERSITY OF CALIFORNIA The Tone Height of Multiharmonic Sounds ROY D. PATTERSON MRC Applied Psychology Unit, Cambridge,
Ch. 1: Audio/Image/Video Fundamentals Multimedia Systems. School of Electrical Engineering and Computer Science Oregon State University
 Ch. 1: Audio/Image/Video Fundamentals Multimedia Systems Prof. Ben Lee School of Electrical Engineering and Computer Science Oregon State University Outline Computer Representation of Audio Quantization
Math and Music: The Science of Sound
 Math and Music: The Science of Sound Gareth E. Roberts Department of Mathematics and Computer Science College of the Holy Cross Worcester, MA Topics in Mathematics: Math and Music MATH 110 Spring 2018
Base, Pulse, and Trace File Reference Guide
 Base, Pulse, and Trace File Reference Guide Introduction This document describes the contents of the three main files generated by the Pacific Biosciences primary analysis pipeline: bas.h5 (Base File,
Indexing local features. Wed March 30 Prof. Kristen Grauman UT-Austin
 Indexing local features Wed March 30 Prof. Kristen Grauman UT-Austin Matching local features Kristen Grauman Matching local features? Image 1 Image 2 To generate candidate matches, find patches that have
2.2. VIDEO DISPLAY DEVICES
 Introduction to Computer Graphics (CS602) Lecture 02 Graphics Systems 2.1. Introduction of Graphics Systems With the massive development in the field of computer graphics a broad range of graphics hardware
Visual and Aural: Visualization of Harmony in Music with Colour. Bojan Klemenc, Peter Ciuha, Lovro Šubelj and Marko Bajec
 Visual and Aural: Visualization of Harmony in Music with Colour Bojan Klemenc, Peter Ciuha, Lovro Šubelj and Marko Bajec Faculty of Computer and Information Science, University of Ljubljana ABSTRACT Music
VISUAL MILL LAB. SECTION 1: Complete the following tests and fill out the appropriate sections on your Visual Mill Color Deficit Worksheet.
 VISUAL MILL LAB Visual Mill is available on the two computers in the neuroscience lab (NEURO5 & NEURO6). Make sure that the monitor is set to normal color function part 2 will have you adjust the monitor
Rounding Considerations SDTV-HDTV YCbCr Transforms 4:4:4 to 4:2:2 YCbCr Conversion
 Digital it Video Processing 김태용 Contents Rounding Considerations SDTV-HDTV YCbCr Transforms 4:4:4 to 4:2:2 YCbCr Conversion Display Enhancement Video Mixing and Graphics Overlay Luma and Chroma Keying
Tech Paper. HMI Display Readability During Sinusoidal Vibration
 Tech Paper HMI Display Readability During Sinusoidal Vibration HMI Display Readability During Sinusoidal Vibration Abhilash Marthi Somashankar, Paul Weindorf Visteon Corporation, Michigan, USA James Krier,
Design Principles and Practices. Cassini Nazir, Clinical Assistant Professor Office hours Wednesdays, 3-5:30 p.m. in ATEC 1.
 ATEC 6332 Section 501 Mondays, 7-9:45 pm ATEC 1.606 Spring 2013 Design Principles and Practices Cassini Nazir, Clinical Assistant Professor cassini@utdallas.edu Office hours Wednesdays, 3-5:30 p.m. in
Spatial Forms Generated by Music The Case Study
 Spatial Forms Generated by Music The Case Study Mirjana Devetakovic Radojevic, M.Sc. Faculty of Architecture, University of Belgrade, Yugoslavia e-mail: eaoyu@ptt.yu Raewyn Turner Multi-senses Artist,
Design for Information
 Design for Information Civic Innoation Lab Feb 17, 2015 Matt Wizinsky Jon Chambers Information Aesthetics 2014 2015 Design for Information Isabel Meirelles Information Aesthetics Civic Innovation Lab 2014
Divider Motion heading graphics
 6.31 8.0 Divider Motion heading graphics INTRODUCTION 4.1 STUDYING AT MACQUARIE OVERVIEW Overview OF ELEMENTS 8.1 4.2 Undergraduate 4.3 INTRO SEQUENCES Course guide 8.2 ENDFRAME International SEQUENCES
Motion Video Compression
 7 Motion Video Compression 7.1 Motion video Motion video contains massive amounts of redundant information. This is because each image has redundant information and also because there are very few changes
[source unknown] Cornell CS465 Fall 2004 Lecture Steve Marschner 1
![[source unknown] Cornell CS465 Fall 2004 Lecture Steve Marschner 1](/thumbs/80/81460800.jpg "[source unknown] Cornell CS465 Fall 2004 Lecture Steve Marschner 1") [source unknown] 2004 Steve Marschner 1 What light is Light is electromagnetic radiation exists as oscillations of different frequency (or, wavelength) [Lawrence Berkeley Lab / MicroWorlds] 2004 Steve
[source unknown] 2004 Steve Marschner 1 What light is Light is electromagnetic radiation exists as oscillations of different frequency (or, wavelength) [Lawrence Berkeley Lab / MicroWorlds] 2004 Steve
STEPS. For Successful Content Design In Digital Signage Systems
 Volume 1 STEPS For Successful Content Design In Digital Signage Systems Table of Contents Introduction 3 Chapter 1 Color Theory For Content Design 4 Chapter 2 Font Considerations In Digital Signage 8 Chapter
DVG-5000 Motion Pattern Option
 AccuPel DVG-5000 Documentation Motion Pattern Option Manual DVG-5000 Motion Pattern Option Motion Pattern Option for the AccuPel DVG-5000 Digital Video Calibration Generator USER MANUAL Version 1.00 2
Escaping RGBland: Selecting Colors for Statistical Graphics
 Escaping RGBland: Selecting Colors for Statistical Graphics Achim Zeileis Kurt Hornik Paul Murrell http://statmath.wu-wien.ac.at/~zeileis/ Overview Motivation Statistical graphics and color Color vision
DAT335 Music Perception and Cognition Cogswell Polytechnical College Spring Week 6 Class Notes
 DAT335 Music Perception and Cognition Cogswell Polytechnical College Spring 2009 Week 6 Class Notes Pitch Perception Introduction Pitch may be described as that attribute of auditory sensation in terms
Audio Feature Extraction for Corpus Analysis
 Audio Feature Extraction for Corpus Analysis Anja Volk Sound and Music Technology 5 Dec 2017 1 Corpus analysis What is corpus analysis study a large corpus of music for gaining insights on general trends
25.3: Observations of Luminance, Contrast and Amplitude Resolution of Displays
 25.3: Observations of Luminance, Contrast and Amplitude Resolution of Displays Helge Seetzen 1, Hiroe Li, Linton Ye, Wolfgang Heidrich, Lorne Whitehead University of British Columbia, Vancouver, BC, Canada
Expressive performance in music: Mapping acoustic cues onto facial expressions
 International Symposium on Performance Science ISBN 978-94-90306-02-1 The Author 2011, Published by the AEC All rights reserved Expressive performance in music: Mapping acoustic cues onto facial expressions
MASTER'S THESIS. Listener Envelopment
 MASTER'S THESIS 2008:095 Listener Envelopment Effects of changing the sidewall material in a model of an existing concert hall Dan Nyberg Luleå University of Technology Master thesis Audio Technology Department
White Paper : Achieving synthetic slow-motion in UHDTV. InSync Technology Ltd, UK
 White Paper : Achieving synthetic slow-motion in UHDTV InSync Technology Ltd, UK ABSTRACT High speed cameras used for slow motion playback are ubiquitous in sports productions, but their high cost, and
NAPIER. University School of Engineering. Advanced Communication Systems Module: SE Television Broadcast Signal.
 NAPIER. University School of Engineering Television Broadcast Signal. luminance colour channel channel distance sound signal By Klaus Jørgensen Napier No. 04007824 Teacher Ian Mackenzie Abstract Klaus
Pitch. The perceptual correlate of frequency: the perceptual dimension along which sounds can be ordered from low to high.
 Pitch The perceptual correlate of frequency: the perceptual dimension along which sounds can be ordered from low to high. 1 The bottom line Pitch perception involves the integration of spectral (place)
AESTHETIC APPROACH on BRIDGE PIER DESIGN
 AESTHETIC APPROACH on BRIDGE PIER DESIGN Sie-young, Moon * * Seoul National University, Yooshin Engineering Corporation Seoul, South Korea, moonsiey@empal.com Abstract: Bridges are significant examples
Display Characterization by Eye: Contrast Ratio and Discrimination Throughout the Grayscale
 Display Characterization by Eye: Contrast Ratio and Discrimination Throughout the Grayscale Jennifer Gille 1, Larry Arend 2, James Larimer 2 1 Raytheon ITSS, 2 Human Factors Research & Technology Division,
Psychoacoustics. lecturer:
 Psychoacoustics lecturer: stephan.werner@tu-ilmenau.de Block Diagram of a Perceptual Audio Encoder loudness critical bands masking: frequency domain time domain binaural cues (overview) Source: Brandenburg,
Quantify. The Subjective. PQM: A New Quantitative Tool for Evaluating Display Design Options
 PQM: A New Quantitative Tool for Evaluating Display Design Options Software, Electronics, and Mechanical Systems Laboratory 3M Optical Systems Division Jennifer F. Schumacher, John Van Derlofske, Brian
Bus route and destination displays making it easier to read.
 Loughborough University Institutional Repository Bus route and destination displays making it easier to read. This item was submitted to Loughborough University's Institutional Repository by the/an author.
Code : is a set of practices familiar to users of the medium
 Lecture (05) CODES Code Code : is a set of practices familiar to users of the medium operating within a broad cultural framework. When studying cultural practices, semioticians treat as signs any objects
Elements of a Television System
 1 Elements of a Television System 1 Elements of a Television System The fundamental aim of a television system is to extend the sense of sight beyond its natural limits, along with the sound associated
Background Statement for SEMI Draft Document 4759A NEW STANDARD: TEST METHOD OF PERCEPTUAL ANGLE FOR OLED DISPLAYS
 Background Statement for SEMI Draft Document 4759A NEW STANDARD: TEST METOD OF PERCEPTUAL ANGLE FOR OLED DISPLAYS Note: This background statement is not part of the balloted item. It is provided solely
Advanced Computer Networks
 Advanced Computer Networks Video Basics Jianping Pan Spring 2017 3/10/17 csc466/579 1 Video is a sequence of images Recorded/displayed at a certain rate Types of video signals component video separate
Skip Length and Inter-Starvation Distance as a Combined Metric to Assess the Quality of Transmitted Video
 Skip Length and Inter-Starvation Distance as a Combined Metric to Assess the Quality of Transmitted Video Mohamed Hassan, Taha Landolsi, Husameldin Mukhtar, and Tamer Shanableh College of Engineering American
7thSense Design Delta Media Server
 7thSense Design Delta Media Server Channel Alignment Guide: Warping and Blending Original by Andy B Adapted by Helen W (November 2015) 1 Trademark Information Delta, Delta Media Server, Delta Nano, Delta
1 Your computer screen
 U.S.T.H.B / C.E.I.L Unit 7 Computer science L2 (S2) 1 Your computer screen Discuss the following questions. 1 What type of display do you have? 2 What size is the screen? 3 Can you watch TV on your PC
INTERNATIONAL TELECOMMUNICATION UNION. SERIES H: AUDIOVISUAL AND MULTIMEDIA SYSTEMS Coding of moving video
 INTERNATIONAL TELECOMMUNICATION UNION CCITT H.261 THE INTERNATIONAL TELEGRAPH AND TELEPHONE CONSULTATIVE COMMITTEE (11/1988) SERIES H: AUDIOVISUAL AND MULTIMEDIA SYSTEMS Coding of moving video CODEC FOR
Individual Test Item Specifications
 Individual Test Item Specifications 9005100 Digital Media Fundamentals 2015 The contents of this document were developed under a grant from the United States Department of Education. However, the content
A New Standardized Method for Objectively Measuring Video Quality
 1 A New Standardized Method for Objectively Measuring Video Quality Margaret H Pinson and Stephen Wolf Abstract The National Telecommunications and Information Administration (NTIA) General Model for estimating
White Paper. Uniform Luminance Technology. What s inside? What is non-uniformity and noise in LCDs? Why is it a problem? How is it solved?
 White Paper Uniform Luminance Technology What s inside? What is non-uniformity and noise in LCDs? Why is it a problem? How is it solved? Tom Kimpe Manager Technology & Innovation Group Barco Medical Imaging
CS229 Project Report Polyphonic Piano Transcription
 CS229 Project Report Polyphonic Piano Transcription Mohammad Sadegh Ebrahimi Stanford University Jean-Baptiste Boin Stanford University sadegh@stanford.edu jbboin@stanford.edu 1. Introduction In this project