Color in Information Visualization
|
|
|
- Virginia Higgins
- 5 years ago
- Views:
Transcription
1 Color in Information Visualization James Bernhard April 2012
2 Color serves different purposes in art and in information visualization: In art, color is used for creative and expressive purposes In information visualization, color is used to help the viewer perceive information as readily as possible
3 Extensive perceptual studies have been conducted to determine what kinds of patterns humans are best at distinguishing In brief, there are several popout channels: hue, value (lightness), size, elongation, orientation, motion, and spatial grouping Note that hue and value are popout channels, but saturation is not Click here for a fascinating website devoted to perception in visualization
4 How we see color
 have only two dimensions of color vision, but they don t respond to it readily; motion sensitivity is more critical for them Color very useful to fruit-eaters")
5 Humans have better color vision than most large animals Grass-eaters, such as cows and zebras, have only two dimensions of color vision Tigers (and more generally cats) have only two dimensions of color vision, but they don t respond to it readily; motion sensitivity is more critical for them Color very useful to fruit-eaters though!
6 There are two types of light receptors at the back of the retina: rods and cones Rods are: More numerous Specialized for very low light levels Not so useful for modern humans, who usually work in good light Cones are: The basis for normal daytime vision Divided into three subtypes: short-, middle-, and long-wavelength sensitive We ll refer to these by the colors they most closely correspond to: blue for short, green for middle, and red for long This gives us in essence a 3-dimensional system of vision (and is the reason that televisions and monitors have 3 different types of liquid crystal filters)
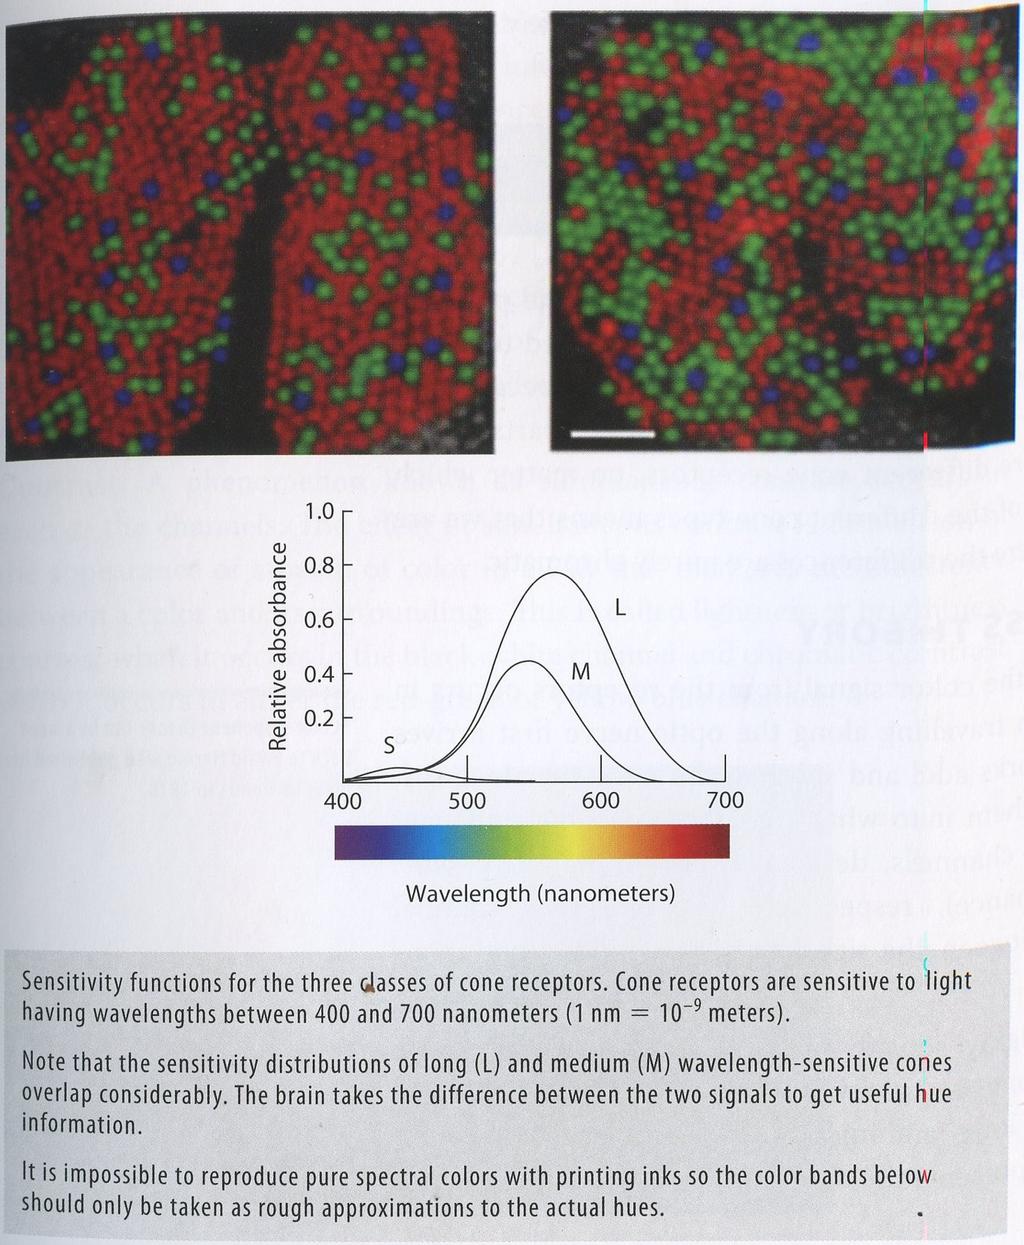
7
8 Note the clumpiness of red and green sensitive cones Black and white images need only be on two different cones (any two), so we can see detail well with black and white With purely chromatic differences, detail is harder because they need to fall on different types
9 One implication of having few and weak blue-sensitive cones: blue text on a black background doesn t work well Showing small blue text on a black background is a bad idea Showing small blue text on a black background is a bad idea Yellow, however, excites both green and red cones, so it works poorly on white and well on black Showing small yellow text on a white background is a bad idea Showing small yellow text on a white background is a bad idea
10 Opponent process theory was proposed by Ewald Hering in Vienna in 1878 The theory asserts that we have three color-opponent channels: red-green yellow-blue black-white (or luminance) Note how this implies that red, green, yellow, blue, black, and white are singled out (strong + or - signals in only one channel) This is in keeping with the 1969 Berlin-Kay study in which they found these color terms to be most commonly used in a large collection of languages We now have physiological verification of this theory Color signals from receptors are transformed early in the processing of visual information
11 The red-green channel represents the difference between the signals of the green and red cones The luminance channel sums the outputs of the green and red cones The yellow-blue channel represents the difference between the green and blue cones (which is also the difference between the luminance channel and the blue cones) For those who have had some linear algebra, this is a change of basis

12 These channels have important implications for information design, so we now look at some of their properties Contrast: we can detect differences within any individual channel quite well Here is an example within the black-white channel Click here for another black-white example

13 In the red-green and yellow-blue channels, the effects of contrasts are harder to predict

14 The luminance channel also carries a greater capacity to convey spatial detail than the other two channels It is also better for motion information, and it is the main channel for processing stereoscopic depth information

15 The luminance channel is what we use to understand the shape of 3-dimensional surfaces from shading as well
 Sharpening is the effect that with a light background, we are more sensitive to differernces near")
16 Saturation corresponds to a strong signal on one or both of the chromatic (red-green and yellow-blue) channels Maximum saturation varies with luminance Luminance is nonlinear: we are more sensitive to dark gray differences than to light differences (although this effect depends on the background) Sharpening is the effect that with a light background, we are more sensitive to differernces near white (and the opposite for a dark gray background)

17 Color segmentation is that property that we have a strong tendency to segment smoothly changing colors into regions consisting of unique hues

18 About 8% of males are color blind, meaning that they are missing the red-green channel
19 A word of caution: although color space is 3-dimensional, perceived color space is more complicated, as it depends heavily on things such as: Surrounding colors Orientation with respect to the light source Whether or not it appears to be in light or in shadow The texture of the surface on which it lies Click here for an interesting demonstration of this
20 Implications for information visualization
21 If you only take one piece of information home from this talk, it should be: To show detailed information, use luminance contrast. This holds especially for small text The International Standards Organization (ISO) recommends at least a 3:1 ratio between the luminance of the text and the luminance of the background This really means black (or very dark) text on white (or light pastel hues), or the reverse


22 This rule is less essential for larger text
23 To color-code information, consider: Visual distinctness Learnability To help with learnability, start with the standard hues (red, green, yellow, and blue) and then move to others with relatively consistent names (pink, brown, orange, grey, purple, etc.) People have studied exactly how many colors are readily learnable; answer seem to vary from about 6 to 12 One problem with more is that colors are perceived relative to background or nearby colors

24 Note that for visual searches, the colors of the background and other symbols are as important as the symbol being searched for

25 To contrast large and small areas, small areas should be strongly colored and have luminance contrast with larger background areas Large areas should have more subdued colors; they will contrast with other larger areas anyway
26 For emphasis and highlighting, a strong signal on any opponent channel will attract attention better than a weak signal Strength here is relative to the background An important PowerPoint lesson: do not highlight text with a color that reduces the luminance contrast

27 Instead of this: Use this:
28 In maps (of all types geographical, of the stock market, of temperatures, etc.), color can be used to: Help people perceive patterns in the data Allow people to read quantitative values from the map Luminance is a good channel to use for these Sometimes choosing a zero value can be important For this, try a neutral value on the red-green or yellow-blue channels and then increase saturation in either direction to show positives and negatives
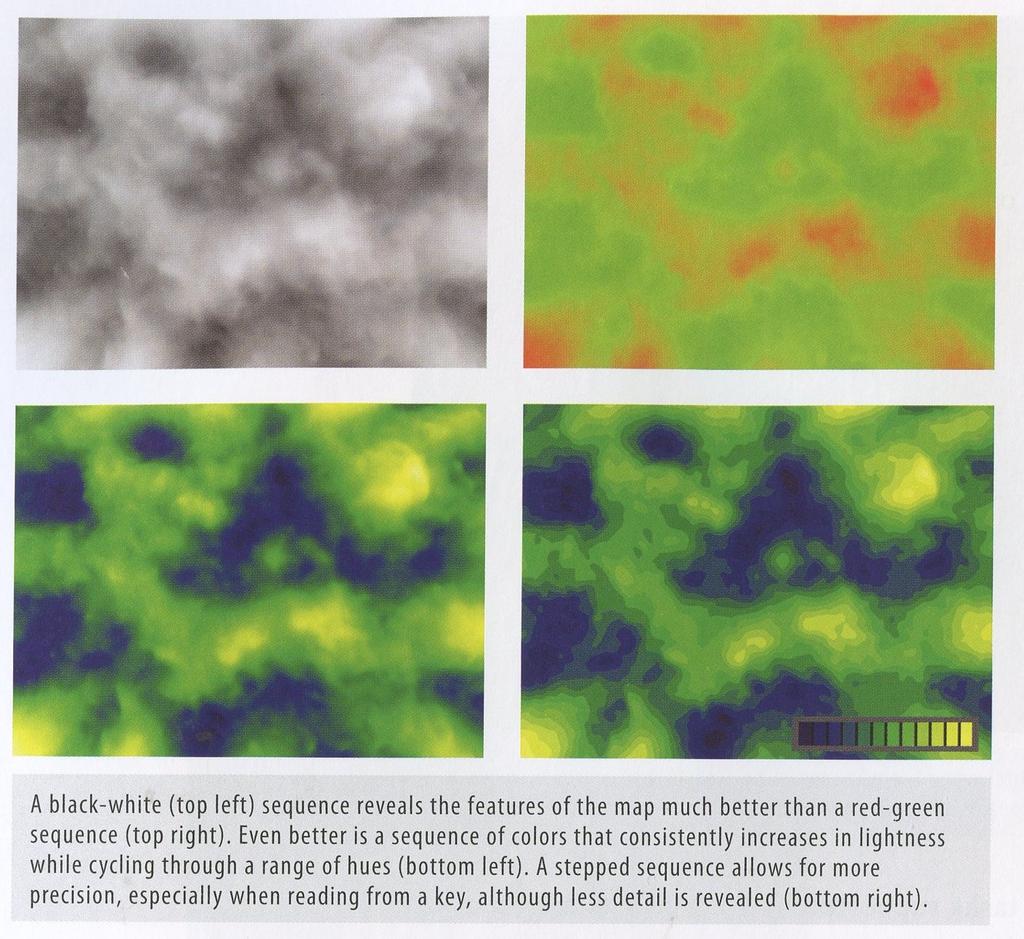
29

30 This kind of color sequence is preferable to stepping through the spectrum If you ask people to order purple, blue, cyan, green, yellow, red, you will get answers that are all over the board Increase the number of colors, and many people will arrive at a circular ordering similar to the spectrum because parts of the spectrum have a percetual ordering, although the whole spectrum does not If you ask people to order grays of various shades, you ll generally get either a black-white or a white-black ordering as an answer

31 For color on shaded surfaces, recall that shape from shading information comes from the luminance channel A colored pattern that interferes with luminance channel information prevents us from seeing the shape

32 The psychological and symbolic aspects of color should also be considered
33 All in all, choosing color for information visualization is a complex problem that involves trade-offs Every piece of information cannot be maximally distinct! Consideration of consistency of design may also need to be taken into account In general, think about what sort of visual queries your audience will be performing and give those priority
34 Almost all of the material in this talk came from the chapter on color in Colin Ware s book Visual Thinking for Design (2008) The websites used in this talk are: Perception in Visualization by Christopher Healey of NCSU. Illusions and Demos by Edward Adelson of MIT. Illusions of Light by Beau Lotto of Lottolab Studio. Two other websites of interest are: 88 Visual Phenomena & Optical Illusions by Michael Bach of the University of Freiburg. Illusions Gallery by David T. Landrigan of the University of Massachusetts Lowell.
[source unknown] Cornell CS465 Fall 2004 Lecture Steve Marschner 1
![[source unknown] Cornell CS465 Fall 2004 Lecture Steve Marschner 1](/thumbs/80/81460800.jpg "[source unknown] Cornell CS465 Fall 2004 Lecture Steve Marschner 1") [source unknown] 2004 Steve Marschner 1 What light is Light is electromagnetic radiation exists as oscillations of different frequency (or, wavelength) [Lawrence Berkeley Lab / MicroWorlds] 2004 Steve
[source unknown] 2004 Steve Marschner 1 What light is Light is electromagnetic radiation exists as oscillations of different frequency (or, wavelength) [Lawrence Berkeley Lab / MicroWorlds] 2004 Steve
The Art and Science of Depiction. Color. Fredo Durand MIT- Lab for Computer Science
 The Art and Science of Depiction Color Fredo Durand MIT- Lab for Computer Science Color Color Vision 2 Talks Abstract Issues Color Vision 3 Plan Color blindness Color Opponents, Hue-Saturation Value Perceptual
CSE Data Visualization. Color. Jeffrey Heer University of Washington
 CSE 512 - Data Visualization Color Jeffrey Heer University of Washington Color in Visualization Identify, Group, Layer, Highlight Colin Ware Purpose of Color To label To measure To represent and imitate
Murdoch redux. Colorimetry as Linear Algebra. Math of additive mixing. Approaching color mathematically. RGB colors add as vectors
 Murdoch redux Colorimetry as Linear Algebra CS 465 Lecture 23 RGB colors add as vectors so do primary spectra in additive display (CRT, LCD, etc.) Chromaticity: color ratios (r = R/(R+G+B), etc.) color
The theory of data visualisation
 The theory of data visualisation V2017-10 Simon Andrews, Phil Ewels simon.andrews@babraham.ac.uk phil.ewels@scilifelab.se Data Visualisation A scientific discipline involving the creation and study of
Recap of Last (Last) Week
 Week") Recap of Last (Last) Week 1 The Beauty of Information Visualization Napoléon s Historical Retreat 2 Course Design Homepage: have you visited and registered? 3 The Value of Information Visualization Have
Recap of Last (Last) Week 1 The Beauty of Information Visualization Napoléon s Historical Retreat 2 Course Design Homepage: have you visited and registered? 3 The Value of Information Visualization Have
Fundamentals of Multimedia. Lecture 3 Color in Image & Video
 Fundamentals of Multimedia Lecture 3 Color in Image & Video Mahmoud El-Gayyar elgayyar@ci.suez.edu.eg Mahmoud El-Gayyar / Fundamentals of Multimedia 1 Black & white imags Outcomes of Lecture 2 1 bit images,
Television History. Date / Place E. Nemer - 1
 Television History Television to see from a distance Earlier Selenium photosensitive cells were used for converting light from pictures into electrical signals Real breakthrough invention of CRT AT&T Bell
Processing. Electrical Engineering, Department. IIT Kanpur. NPTEL Online - IIT Kanpur
 NPTEL Online - IIT Kanpur Course Name Department Instructor : Digital Video Signal Processing Electrical Engineering, : IIT Kanpur : Prof. Sumana Gupta file:///d /...e%20(ganesh%20rana)/my%20course_ganesh%20rana/prof.%20sumana%20gupta/final%20dvsp/lecture1/main.htm[12/31/2015
Understanding Human Color Vision
 Understanding Human Color Vision CinemaSource, 18 Denbow Rd., Durham, NH 03824 cinemasource.com 800-483-9778 CinemaSource Technical Bulletins. Copyright 2002 by CinemaSource, Inc. All rights reserved.
From light to color: how design choices make the difference
 AUTHOR Koen Van Belle Product Manager Barco koen.vanbelle@barco.com From light to color: how design choices make the difference Why this white paper? Selecting the right high-brightness projector is becoming
Vannevar Bush: As We May Think
 Vannevar Bush: As We May Think 1. What is the context in which As We May Think was written? 2. What is the Memex? 3. In basic terms, how was the Memex intended to work? 4. In what ways does personal computing
CSE Data Visualization. Graphical Perception. Jeffrey Heer University of Washington
 CSE 512 - Data Visualization Graphical Perception Jeffrey Heer University of Washington Design Principles [Mackinlay 86] Expressiveness A set of facts is expressible in a visual language if the sentences
!"#"$%& Some slides taken shamelessly from Prof. Yao Wang s lecture slides
 http://ekclothing.com/blog/wp-content/uploads/2010/02/spring-colors.jpg Some slides taken shamelessly from Prof. Yao Wang s lecture slides $& Definition of An Image! Think an image as a function, f! f
Video Signals and Circuits Part 2
 Video Signals and Circuits Part 2 Bill Sheets K2MQJ Rudy Graf KA2CWL In the first part of this article the basic signal structure of a TV signal was discussed, and how a color video signal is structured.
To show the Video Scopes, click on the down arrow next to View located in the upper- right corner of your playback panel.
 1 FCPX: 3.3 COLOR CORRECTION Color Correcting and Color Grading are usually the last things you do before exporting your video. Color Correcting is the process of achieving the correct, natural color of
Graphics Devices and Visual Perception. Human Vision. What is visual perception? Anatomy of the Eye. Spatial Resolution (Rods) Human Field of View
 Human Field of View") Graphics Devices and Visual Perception Human Vision and Perception CRT Displays Liquid Crystal Displays Video Controllers Display Controllers Input Devices Human Vision Eye + Retinal Receptors in eye provide
Graphics Devices and Visual Perception Human Vision and Perception CRT Displays Liquid Crystal Displays Video Controllers Display Controllers Input Devices Human Vision Eye + Retinal Receptors in eye provide
Objectives. Explain perception Analyze color perception Analyze vision Relate perception with color models
 Color Perception Ayse Kalkan-Savoy NSF GK-12 Fellow Vibes and Waves in Action Center for Advanced Computation and Telecommunications University of Massachusetts Lowell Objectives Explain perception Analyze
What is the lowest contrast spatial frequency you can see? High. x x x x. Contrast Sensitivity. x x x. x x. Low. Spatial Frequency (c/deg)
") What is the lowest contrast spatial frequency you can see? High Contrast Sensitivity x x x x x x x x x x x x Low Low Spatial Frequency (c/deg) High What is the lowest contrast temporal frequency you can
What is the lowest contrast spatial frequency you can see? High Contrast Sensitivity x x x x x x x x x x x x Low Low Spatial Frequency (c/deg) High What is the lowest contrast temporal frequency you can
Introduction & Colour
 Introduction & Colour Eric C. McCreath School of Computer Science The Australian National University ACT 0200 Australia ericm@cs.anu.edu.au Overview Computer Graphics Uses Basic Hardware and Software Colour
Power saving in LCD panels
 Power saving in LCD panels How to save power while watching TV Hans van Mourik - Philips Consumer Lifestyle May I introduce myself Hans van Mourik Display Specialist Philips Consumer Lifestyle Advanced
Essence of Image and Video
 1 Essence of Image and Video Wei-Ta Chu 2009/9/24 Outline 2 Image Digital Image Fundamentals Representation of Images Video Representation of Videos 3 Essence of Image Wei-Ta Chu 2009/9/24 Chapters 2 and
Ch. 1: Audio/Image/Video Fundamentals Multimedia Systems. School of Electrical Engineering and Computer Science Oregon State University
 Ch. 1: Audio/Image/Video Fundamentals Multimedia Systems Prof. Ben Lee School of Electrical Engineering and Computer Science Oregon State University Outline Computer Representation of Audio Quantization
Automatic Testing of Color Blindness
 Automatic Testing of Color Blindness S. Dey 1, S. Roy 2 and K. Roy 3 1 Dept. of IT, Camellia Institute of Technology 2 Dept. of Biotech & Medical Engg., NIT Rourkella 3 Dept. of Comp. Sc., West Bengal
Measurement of Microdisplays at NPL
 Conference on Microdisplays Measurement of Microdisplays at NPL Christine Wall, Dr Julie Taylor, Colin Campbell 14 th Sept 2001 Overview Displays measurement at NPL Why measure microdisplays? Measurement
Using the NTSC color space to double the quantity of information in an image
 Stanford Exploration Project, Report 110, September 18, 2001, pages 1 181 Short Note Using the NTSC color space to double the quantity of information in an image Ioan Vlad 1 INTRODUCTION Geophysical images
Television and video engineering
 Television and video engineering Unit-4a Colour Television Chapter 1 Introduction to Colour TV We all know how pleasing it is to see a picture in natural colours or watch a colour film in comparison with
Slides on color vision for ee299 lecture. Prof. M. R. Gupta January 2008
 Slides on color vision for ee299 lecture Prof. M. R. Gupta January 2008 light source Color is an event??? human perceives color human cones respond: 1 w object has absorption spectra and reflectance spectra
A Study on the Psychology of Color Perception In Color Palettes & Color Pickers
 A Study on the Psychology of Color Perception In Color Palettes & Color Pickers S. M. Fazlul Hoque Department of Computer and Systems Sciences The Royal Institute of Technology (KTH) Stockholm, Sweden
Principles of Data Visualization. Jeffrey University of Washington
 Principles of Data Visualization Jeffrey Heer @jeffrey_heer University of Washington Data Analysis & Statistics, Tukey & Wilk 1966 Four major influences act on data analysis today: 1. The formal theories
GLOSSARY. 10. Chrominan ce -- Chroma ; the hue and saturation of an object as differentiated from the brightness value (luminance) of that object.
 of that object.") GLOSSARY 1. Back Porch -- That portion of the composite picture signal which lies between the trailing edge of the horizontal sync pulse and the trailing edge of the corresponding blanking pulse. 2. Black
GLOSSARY 1. Back Porch -- That portion of the composite picture signal which lies between the trailing edge of the horizontal sync pulse and the trailing edge of the corresponding blanking pulse. 2. Black
Computer and Machine Vision
 Computer and Machine Vision Introduction to Continuous Camera Capture, Sampling, Encoding, Decoding and Transport January 22, 2014 Sam Siewert Video Camera Fundamentals Overview Introduction to Codecs
Beyond the Resolution: How to Achieve 4K Standards
 Beyond the Resolution: How to Achieve 4K Standards The following article is inspired by the training delivered by Adriano D Alessio of the Lightware a leading manufacturer of DVI, HDMI, and DisplayPort
CHAPTER 3 COLOR TELEVISION SYSTEMS
 HAPTE 3 OLO TELEISION SSTEMS 3.1 Introduction 3.1.1 olor signals The color GB-T system has three primary colours : ed, whith wavelngth λ = 610nm, Green, wavelength λ G = 535nm, Blue, wavelength λ B = 470nm.
VISUAL MILL LAB. SECTION 1: Complete the following tests and fill out the appropriate sections on your Visual Mill Color Deficit Worksheet.
 VISUAL MILL LAB Visual Mill is available on the two computers in the neuroscience lab (NEURO5 & NEURO6). Make sure that the monitor is set to normal color function part 2 will have you adjust the monitor
1. Use interesting materials and/or techniques. Title: Medium: Comments:
 ART CAN! Find pieces that match these aspects of Contemporary Art. 1. Use interesting materials and/or techniques. Title: Medium: Comments: 2. Express emotions without relying on recognizable images. Title:
Planar LookThru OLED Transparent Display. Content Developer s Guide. 1 TOLED Content Developer s Guide A
 Planar LookThru OLED Transparent Display Content Developer s Guide 1 TOLED Content Developer s Guide 020-1316-00A Table of Contents How Transparent OLED Works... 3 History and Definitions... 3 Pixel Structure...
Improving Color Text Sharpness in Images with Reduced Chromatic Bandwidth
 Improving Color Text Sharpness in Images with Reduced Chromatic Bandwidth Scott Daly, Jack Van Oosterhout, and William Kress Digital Imaging Department, Digital Video Department Sharp aboratories of America
Superior Digital Video Images through Multi-Dimensional Color Tables
 Superior Digital Video Images through Multi-Dimensional Color Tables TruVue eecolor Technology White Paper Jim Sullivan CEO, Entertainment Experience, LLC About the Author Jim Sullivan joined Entertainment
LCD and Plasma display technologies are promising solutions for large-format
 Chapter 4 4. LCD and Plasma Display Characterization 4. Overview LCD and Plasma display technologies are promising solutions for large-format color displays. As these devices become more popular, display
Man-Machine-Interface (Video) Nataliya Nadtoka coach: Jens Bialkowski
 Nataliya Nadtoka coach: Jens Bialkowski") Seminar Digitale Signalverarbeitung in Multimedia-Geräten SS 2003 Man-Machine-Interface (Video) Computation Engineering Student Nataliya Nadtoka coach: Jens Bialkowski Outline 1. Processing Scheme 2. Human
Seminar Digitale Signalverarbeitung in Multimedia-Geräten SS 2003 Man-Machine-Interface (Video) Computation Engineering Student Nataliya Nadtoka coach: Jens Bialkowski Outline 1. Processing Scheme 2. Human
Chapter 4 Color in Image and Video. 4.1 Color Science 4.2 Color Models in Images 4.3 Color Models in Video
 Chapter 4 Color in Image and Video 4.1 Color Science 4.2 Color Models in Images 4.3 Color Models in Video Light and Spectra 4.1 Color Science Light is an electromagnetic wave. Its color is characterized
Visual Imaging and the Electronic Age Color Science
 Visual Imaging and the Electronic Age Color Science Color Gamuts & Color Spaces for User Interaction Lecture #7 September 15, 2015 Donald P. Greenberg Chromaticity Diagram The luminance or lightness axis,
May 2014 Phil on Twitter Monitor Calibration & Colour - Introduction
 May 2014 Phil Crawley @IsItBroke on Twitter Monitor Calibration & Colour - Introduction Nature of colour and light Colour systems Video, 601 & 709 colour space Studio cameras and legalisers Calibrating
Minimizing the Perception of Chromatic Noise in Digital Images
 Minimizing the Perception of Chromatic Noise in Digital Images Xiaoyan Song, Garrett M. Johnson, Mark D. Fairchild Munsell Color Science Laboratory Rochester Institute of Technology, Rochester, N, USA
Wide Color Gamut SET EXPO 2016
 Wide Color Gamut SET EXPO 2016 31 AUGUST 2016 Eliésio Silva Júnior Reseller Account Manager E/ esilvaj@tek.com T/ +55 11 3530-8940 M/ +55 21 9 7242-4211 tek.com Anatomy Human Vision CIE Chart Color Gamuts
Various Applications of Digital Signal Processing (DSP)
") Various Applications of Digital Signal Processing (DSP) Neha Kapoor, Yash Kumar, Mona Sharma Student,ECE,DCE,Gurgaon, India EMAIL: neha04263@gmail.com, yashguptaip@gmail.com, monasharma1194@gmail.com ABSTRACT:-
Various Applications of Digital Signal Processing (DSP) Neha Kapoor, Yash Kumar, Mona Sharma Student,ECE,DCE,Gurgaon, India EMAIL: neha04263@gmail.com, yashguptaip@gmail.com, monasharma1194@gmail.com ABSTRACT:-
WRITING PROMPTS AND ACTIVITIES FOR VISUAL ART ENGAGEMENT
 WRITING PROMPTS AND ACTIVITIES FOR VISUAL ART ENGAGEMENT To book a guided tour at the Halsey Institute: (843) 953-5957 HalseyTours@cofc.edu halsey.cofc.edu/learn DISCOVERING MEANING Using the questions
PROFESSION WITHOUT DISCIPLINE WOULD BE BLIND
 PROFESSION WITHOUT DISCIPLINE WOULD BE BLIND The thesis of this paper is that even though there is a clear and important interdependency between the profession and the discipline of architecture it is
Background Statement for SEMI Draft Document 4759A NEW STANDARD: TEST METHOD OF PERCEPTUAL ANGLE FOR OLED DISPLAYS
 Background Statement for SEMI Draft Document 4759A NEW STANDARD: TEST METOD OF PERCEPTUAL ANGLE FOR OLED DISPLAYS Note: This background statement is not part of the balloted item. It is provided solely
TOOLS FOR A BETTER VIEW
 ERIK WYSOCAN IN CONVERSATION WITH TAUBA AUERBACH METROPOLIS M MAGAZINE FEB / MAR 2013 TOOLS FOR A BETTER VIEW EW: Your recent show Tetrachomat in Bergen featured a large sequence of paintings from the
High-resolution screens have become a mainstay on modern smartphones. Initial. Displays 3.1 LCD
 3 Displays Figure 3.1. The University of Texas at Austin s Stallion Tiled Display, made up of 75 Dell 3007WPF LCDs with a total resolution of 307 megapixels (38400 8000 pixels) High-resolution screens
 1 of 8 8/19/2014 8:15 AM Units: Teacher: Barnett, Kimberly Course: VisArtDesignandProd Year: 2012-13 Elements of Art SubUnit 1: Color SubUnit 2: Form/Shape SubUnit 3: Line SubUnit 4: Space SubUnit 5: Texture
united.screens GmbH FUTURE DISPLAY TECHNOLOGY 2017 united.screens GmbH
 united.screens GmbH FUTURE DISPLAY TECHNOLOGY T-OLED CRYSTALSCREEN Content Developer s Guide Index How transparent OLEDs work 03 History of OLEDs 03 Pixelstructure 03 Content Development 04 Differences
8K Resolution: Making Hyperrealism a Reality
 8K Resolution: Making Hyperrealism a Reality Is 8K worth it? With the first 8K TV being released into consumer markets this year and the growth of 8K content creation and supporting technologies, it s
The Development of a Synthetic Colour Test Image for Subjective and Objective Quality Assessment of Digital Codecs
 2005 Asia-Pacific Conference on Communications, Perth, Western Australia, 3-5 October 2005. The Development of a Synthetic Colour Test Image for Subjective and Objective Quality Assessment of Digital Codecs
Quantify. The Subjective. PQM: A New Quantitative Tool for Evaluating Display Design Options
 PQM: A New Quantitative Tool for Evaluating Display Design Options Software, Electronics, and Mechanical Systems Laboratory 3M Optical Systems Division Jennifer F. Schumacher, John Van Derlofske, Brian
Somewhere over the Rainbow How to Make Effective Use of Colors in Statistical Graphics
 Somewhere over the Rainbow How to Make Effective Use of Colors in Statistical Graphics Achim Zeileis https://eeecon.uibk.ac.at/~zeileis/ Introduction Zeileis A, Hornik K, Murrell P (2009). Escaping RGBland:
Root6 Tech Breakfast July 2015 Phil Crawley
 Root6 Tech Breakfast July 2015 Phil Crawley Colourimetry, Calibration and Monitoring @IsItBroke on Twitter phil@root6.com Colour models of human vision How they translate to Film and TV How we calibrate
Escaping RGBland: Selecting Colors for Statistical Graphics
 Escaping RGBland: Selecting Colors for Statistical Graphics Achim Zeileis Kurt Hornik Paul Murrell http://statmath.wu-wien.ac.at/~zeileis/ Overview Motivation Statistical graphics and color Color vision
Prof. Greg Francis 1/3/19
 Visual dynamics PSY 200 Greg Francis Lecture 10 Flicker A flashing light looks constant if it is presented rapidly enough The frequency of flashing at which subjects do not detect flicker is called the
Achieve Accurate Critical Display Performance With Professional and Consumer Level Displays
 Achieve Accurate Critical Display Performance With Professional and Consumer Level Displays Display Accuracy to Industry Standards Reference quality monitors are able to very accurately reproduce video,
Deep Dive into Curved Displays
 Deep Dive into Curved Displays First introduced at CES 2013, curved displays were primarily used for TVs. Today s curved technology employs a range of backlighting technologies, comes in a variety of sizes,
Color Reproduction Complex
 Color Reproduction Complex 1 Introduction Transparency 1 Topics of the presentation - the basic terminology in colorimetry and color mixing - the potentials of an extended color space with a laser projector
Graphical Perception. Graphical Perception. Graphical Perception. Which best encodes quantities? Jeffrey Heer Stanford University
 CS448B :: 7 Oct 2010 Graphical Perception Graphical Perception Jeffrey Heer Stanford University Graphical Perception The ability of viewers to interpret visual (graphical) encodings of information and
Using Low-Cost Plasma Displays As Reference Monitors. Peter Putman, CTS, ISF President, ROAM Consulting LLC Editor/Publisher, HDTVexpert.
 Using Low-Cost Plasma Displays As Reference Monitors Peter Putman, CTS, ISF President, ROAM Consulting LLC Editor/Publisher, HDTVexpert.com Time to Toss The CRT Advantages: CRTs can scan multiple resolutions
ELEMENTS AND PRINCIPLES OF DESIGN
 ELEMENTS AND PRINCIPLES OF DESIGN The Elements of Design The Elements of Design (what we see): Line Shape & Form Colour Texture Space Proportion Line Lines have direction: A linear mark on a page vertical,
Graphical Perception. Graphical Perception. Which best encodes quantities?
 CS448B :: 11 Oct 2012 Graphical Perception Graphical Perception The ability of viewers to interpret visual (graphical) encodings of information and thereby decode information in graphs. Jeffrey Heer Stanford
APPLICATIONS OF DIGITAL IMAGE ENHANCEMENT TECHNIQUES FOR IMPROVED
 APPLICATIONS OF DIGITAL IMAGE ENHANCEMENT TECHNIQUES FOR IMPROVED ULTRASONIC IMAGING OF DEFECTS IN COMPOSITE MATERIALS Brian G. Frock and Richard W. Martin University of Dayton Research Institute Dayton,
Mapping: Methods & Tips
 61 Mapping: Methods & Tips Color Design for the Color Vision Impaired Bernhard Jenny Institute of Cartography ETH Zurich, Switzerland jenny@karto.baug.ethz.ch Nathaniel Vaughn Kelso The Washington Post
Visual Imaging and the Electronic Age Color Science
 Visual Imaging and the Electronic Age Color Science Color Gamuts & Color Spaces for User Interaction Lecture #7 September 13, 2016 Donald P. Greenberg Describing Color in XYZ Luminance Y Chromaticity x
Introduction. Part 1. Evaluating Color. Color Communication/Terms. Colorist Qualifications. Color Equipment/Instruments. Specifications/Settings
 Introduction Part 1. Evaluating Color Color Communication/Terms Colorist Qualifications Color Equipment/Instruments Specifications/Settings Light sources Tolerances Part 2. Lab Dip/Bulk Development Swatch
Color Reproduction Complex
 Color Reproduction Complex -1 - JENOPTIK LDT GmbH Andreas Deter Dr. Wolfram Biehlig IPS Valencia 2004 Expanded Color Space Basic terms in colorimetry and color mixing User benefit of laser projection with
Hue, Value and Intensity
 Art 148, Color theory Course Outline Spring 2015 Petrosky Wed. 01/21/15 Review syllabus, course outline and material requirements. Show Student project examples of color wheels. Bring all materials next
Calibration of Colour Analysers
 DK-Audio A/S PM5639 Technical notes Page 1 of 6 Calibration of Colour Analysers The use of monitors instead of standard light sources, the use of light from sources generating noncontinuous spectra) Standard
Luckylight. 10 Segment Light Bars Displays. Technical Data Sheet. Part No.: KWL-R1025WB-Y
 Segment Light Bars Displays Technical Data Sheet Part No.: KWL-R25WB-Y Spec No.: W25A Rev No.: V.2 Date:Dec/22/28 Page: 1 OF 6 Features: Industrial standard size. Low power consumption. Categorized for
J 0 rgen Weber The Judgement of the Eye
 J 0 rgen Weber The Judgement of the Eye Jiirgen Weber The J udgement of the Eye The Metamorphoses of Geometry - One of the Sources of Visual Perception and Consciousness (A Further Development of Gestalt
ROY G BIV COLOR VISION EXPLORED
 1/13/2017 ROY G BIV COLOR VISION EXPLORED * Learning Objectives: 1. State which three color sensitive receptors are present in the human eye 2. Explain the differences between congenital & acquired color
Research on Color Reproduction Characteristics of Mobile Terminals
 Applied Mechanics and Materials Submitted: 2014-09-14 ISSN: 1662-7482, Vol. 731, pp 80-86 Accepted: 2014-11-19 doi:10.4028/www.scientific.net/amm.731.80 Online: 2015-01-29 2015 Trans Tech Publications,
Photoshop assignment. What is a Picture? Discussion. Reading. Visions of Light. Visions of Light
 The Art and Science of Depiction What is a? Photoshop assignment Perspective Converging is OK in the 3D real world It is not in 2D Distracting elements Are usually not distracting in reality But are harder
Paper for Consideration by the Digital Information Portrayal Working Group (DIPWG) Comment about recommendation on S-52 Colour Calibration Procedure
 Comment about recommendation on S-52 Colour Calibration Procedure") TSMAD26/DIPWG5-09.4D Paper for Consideration by the Digital Information Portrayal Working Group (DIPWG) Comment about recommendation on S-52 Colour Calibration Procedure Submitted by: Furuno Finland Oy.
TSMAD26/DIPWG5-09.4D Paper for Consideration by the Digital Information Portrayal Working Group (DIPWG) Comment about recommendation on S-52 Colour Calibration Procedure Submitted by: Furuno Finland Oy.
CHEMISTRY SEMESTER ONE
 APPENDIX A USING THE SPECTROMETER FOR AN EMISSION SPECTROSCOPY NANSLO REMOTE WEB-BASED SCIENCE LAB ACTIVITY The following provides information how to use the spectrometer controls for the Emission Spectroscopy
The XYZ Colour Space. 26 January 2011 WHITE PAPER. IMAGE PROCESSING TECHNIQUES
 www.omnitek.tv IMAE POESSIN TEHNIQUES The olour Space The colour space has the unique property of being able to express every colour that the human eye can see which in turn means that it can express every
Colour Reproduction Performance of JPEG and JPEG2000 Codecs
 Colour Reproduction Performance of JPEG and JPEG000 Codecs A. Punchihewa, D. G. Bailey, and R. M. Hodgson Institute of Information Sciences & Technology, Massey University, Palmerston North, New Zealand
Organic Electronic Devices
 Organic Electronic Devices Week 5: Organic Light-Emitting Devices and Emerging Technologies Lecture 5.1: Introduction to Organic Light-Emitting Devices Bryan W. Boudouris Chemical Engineering Purdue University
mirasol Display Value Proposition White Paper
 VALUEPROPOSI TI ON mi r asoldi spl ays Whi t epaper I June2009 Table of Contents Introduction... 1 Operational Principles... 2 The Cellular Phone Energy Gap... 3 Energy Metrics... 4 Energy Based Advantages...
Supervision of Analogue Signal Paths in Legacy Media Migration Processes using Digital Signal Processing
 Welcome Supervision of Analogue Signal Paths in Legacy Media Migration Processes using Digital Signal Processing Jörg Houpert Cube-Tec International Oslo, Norway 4th May, 2010 Joint Technical Symposium
An Integrated Music Chromaticism Model
 An Integrated Music Chromaticism Model DIONYSIOS POLITIS and DIMITRIOS MARGOUNAKIS Dept. of Informatics, School of Sciences Aristotle University of Thessaloniki University Campus, Thessaloniki, GR-541
OPERATING GUIDE. M-Vision Cine 3D series. High Brightness Digital Video Projector 16:9 widescreen display. Rev A August A
 OPERATING GUIDE M-Vision Cine 3D series High Brightness Digital Video Projector 16:9 widescreen display 112-022A Digital Projection M-Vision Cine 3D series CONTENTS Operating Guide CONTENTS About this
Color measurement and calibration of professional display devices
 White Paper Color measurement and calibration of professional display devices Abstract: With the advance of display technologies using LED light sources, the problems of color consistency, accuracy and
Indexing local features. Wed March 30 Prof. Kristen Grauman UT-Austin
 Indexing local features Wed March 30 Prof. Kristen Grauman UT-Austin Matching local features Kristen Grauman Matching local features? Image 1 Image 2 To generate candidate matches, find patches that have
Multimedia Systems Video I (Basics of Analog and Digital Video) Mahdi Amiri April 2011 Sharif University of Technology
 Mahdi Amiri April 2011 Sharif University of Technology") Course Presentation Multimedia Systems Video I (Basics of Analog and Digital Video) Mahdi Amiri April 2011 Sharif University of Technology Video Visual Effect of Motion The visual effect of motion is due
Course Presentation Multimedia Systems Video I (Basics of Analog and Digital Video) Mahdi Amiri April 2011 Sharif University of Technology Video Visual Effect of Motion The visual effect of motion is due
Some comments on visual perception and the use of video playback in animal behavior studies
 acta ethol (2000) 3:15 27 Springer-Verlag and ISPA 2000 REVIEW L.J. Fleishman J.A. Endler Some comments on visual perception and the use of video playback in animal behavior studies Received: 10 November
Calibration Best Practices
 Calibration Best Practices for Manufacturers By Tom Schulte SpectraCal, Inc. 17544 Midvale Avenue N., Suite 100 Shoreline, WA 98133 (206) 420-7514 info@spectracal.com http://studio.spectracal.com Calibration
OPTIMAL TELEVISION SCANNING FORMAT FOR CRT-DISPLAYS
 OPTIMAL TELEVISION SCANNING FORMAT FOR CRT-DISPLAYS Erwin B. Bellers, Ingrid E.J. Heynderickxy, Gerard de Haany, and Inge de Weerdy Philips Research Laboratories, Briarcliff Manor, USA yphilips Research
The Lecture Contains: Frequency Response of the Human Visual System: Temporal Vision: Consequences of persistence of vision: Objectives_template
 The Lecture Contains: Frequency Response of the Human Visual System: Temporal Vision: Consequences of persistence of vision: file:///d /...se%20(ganesh%20rana)/my%20course_ganesh%20rana/prof.%20sumana%20gupta/final%20dvsp/lecture8/8_1.htm[12/31/2015
Reference. Color. Category. Light source. Gross luminous flux. Power. Power values of the system. Colour temperature. Colour Rendering Index
 ZEN TUBE Name Color ZEN TUBE LED 3 FLOOD 42º 3000K WT A2842331WT Textured white SPOTLIGHTS LIGHTING INFORMATION DIMENSIONS Light source Gross luminous flux Power Power values of the system Colour temperature
AESTHETIC APPROACH on BRIDGE PIER DESIGN
 AESTHETIC APPROACH on BRIDGE PIER DESIGN Sie-young, Moon * * Seoul National University, Yooshin Engineering Corporation Seoul, South Korea, moonsiey@empal.com Abstract: Bridges are significant examples
Selected Technical and Perceptual Aspects of Virtual Reality Displays
 Max Planck Institut für biologische Kybernetik Max Planck Institute for Biological Cybernetics Technical Report No. 154. Selected Technical and Perceptual Aspects of Virtual Reality Displays Bernhard E.
Statistics for Engineers
 Statistics for Engineers ChE 4C3 and 6C3 Kevin Dunn, 2013 kevin.dunn@mcmaster.ca http://learnche.mcmaster.ca/4c3 Overall revision number: 19 (January 2013) 1 Copyright, sharing, and attribution notice