BVS Indoor Forecaster Predictive RF In-Building Survey Analysis for CW Signals
|
|
|
- Ann Atkins
- 5 years ago
- Views:
Transcription

1 BVS Indoor Forecaster Predictive RF In-Building Survey Analysis for CW Signals User Manual Version 1.5 Version Copyright!2010, Berkeley Varitronics Systems, Inc. All Rights Reserved
2 Table of Contents INTRODUCTION TO INDOOR FORECASTER Q UICK START I NTRODUCTION I NSTALLATION Q UICK START C REATE A PROJECTION S ET THE DIMENSIONS FOR THE ASPECT RATIO A DJUST THE SIZE OF THE FLOOR PLAN A DD STATIC OBJECTS A DD CUSTOM IMAGES AS STATIC OBJECTS A DD WALLS, WINDOWS, AND DOORS S AVE THE PROJECTION M ENUS R ULERS Z OOM MODES Z oom In Z oom Out II. COYOTE COLLECTOR Introduction Description of the Toolbar Buttons Step-By-Step Procedure for Data Collection Establishing a connection between the PC and the Coyote Open the Projection File Important Notes about Projection Files Open the Collection Files Important Instructions to be followed before beginning Data Collection Important Principles to understand before Data Collection Data Collection steps...18 III. FORECASTER ANALYZER Table 3.1 Buttons In The Tool Bar Table 3.2 Buttons In Control Window For Clustering Points...25 Table 3.3 Buttons In View Options of Control Window Introduction Get Started With Forecaster Analyzer Creating New Projects Opening An Existing Project Saving An Project Survey Data Analysis... 24
3 3.1 Clustering Points Measurement Data Analysis Plot RSSI Along Survey Path Plot the Averaged RSSI Along Survey Path Plot the Number of Averaged Points along Survey Path Plot the Reliability of Averaged RSSI along Survey Path Plot the Variation of Averaged RSSI Along Survey Path Coverage Analysis and Prediction Plot Contours Draw Contours Reliability Analysis Some Functions In the Software Metric Selection Information Window Channel Selection Color Selection Range Control Resolution Control Measuring Distance Saving Coverage graph Change Base Station Icons Printing Table View Creating Reports HTML Report Appendix I. Indoor Site Survey Study 41 1
4 Introduction to Indoor Forecaster The Forecaster application suite is used to generate coverage analysis maps of survey areas. These survey areas will be located indoors or any other area where there is insufficient GPS coverage. Forecaster consists of three separate applications. Indoor Projector imports an image (BMP, JPEG) of the survey area and creates a linear projection onto this area. Forecaster Collector collects RF data within the survey area and correlates it to the projection file created with Projector. This data is collected with the BVS Coyote Receiver hardware. This data is then input into Forecaster Analyzer, where it is then analyzed and processed into various types of reports. These reports represent the RF coverage validation and prediction over the survey area. Quick Start You will need the following to get started with your survey. 1. An image file of the area to be surveyed. 2. Coyote hardware. 3. Technical information on transmitters in the survey area (if possible). You will perform the following steps in order to complete your survey. These steps are outlined in the sections below corresponding to the various applications. 1. Import your image file into Indoor Projector 2. Create a projection based on known distances in the survey area. 3. Save the newly created projection file. 4. Copy projection file on the device where the Forecaster Collector will be running. 5. Import the projection file into Forecaster Collector. 6. Collect data points over the survey area. 7. Save data file. 8. Copy data and projection file onto device where Forecaster Analyzer will be run. 9. Import data and projection file into Forecaster Analyzer. 10. Create reports on coverage. 11. Save and print out reports for presentation on the coverage analysis. 2
5 3

6 I. Indoor Projector Introduction The BVS Indoor Projector imports an image of an area to be surveyed and outputs a base file with information to project data onto to the image. Projector is a Windows application that can run on any PC or tablet with a minimum of Windows XP installed. The output file is used by a Collector program to collect and overlay RF data points onto the survey projection. The resulting combination of collected data and the projection is used in an Analysis program to show RF coverage information in the surveyed area. Figure 1 Indoor Projector Projector also allows you to add 2.4 and 5 GHz objects such as access points and interferers. Text can also be added to the floor plan. 4
7 INSTALLATION To install the application from a CD, place the CD in the drive. Choose the Indoor Projector button. Follow the installation instructions on the screen from this point. If you are installing from a Tablet, use the SD card provided with the USB Flash card driver. Insert the USB driver into a USB slot. The device will show up as new drive letter (i.e. D:). Run the setup or autorun program from the root of the drive. Then choose the Indoor Projector button and follow the installation instructions. QUICK START Creating a projection file that is ready for use with the Collector requires the following steps. See the sections below for individual explanations. Projector can import any of the following file formats: Monochrome BMP, 16-bit color BMP, 256 color BMP, 24-bit BMP, GIF, ICO, TIF, JPG and PNG. 1. CREATE A PROJECTION 2. SET THE DIMENSIONS FOR THE ASPECT RATIO 3. ADJUST SIZE OF FLOOR PLAN IF NECESSARY 4. ADD STATIC OBJECTS TO FLOOR PLAN IF NECESSARY 5. ADD CUSTOM IMAGES AS STATIC OBJECTS 6. ADD WALLS, WINDOWS, AND DOORS 7. SAVE FILE CREATE A PROJECTION Use FILE/NEW on the menu to create a new projection file. Choose a floor plan from the popup window to use as a base for your site. You may use a.bmp,.jpg,.gif etc. SET THE DIMENSIONS FOR THE ASPECT RATIO Click the ruler icon in the toolbox. Look for a location on the projection that you know the distance. Click on the first point of the measurement. A flag will mark the spot. Click on the second point of the measurement. Now enter the distance and units for the measurement. Repeat steps 2 thru 4 for a second measurement. Make sure that the second measurement is in a different orientation from the first point. Keep repeating until you receive a message saying that a valid projection exists. Points used for the projection may be deleted from the listbox on the left status bar. ADJUST THE SIZE OF THE FLOOR PLAN There are two types of image reduction available in Projector. There are multiple algorithms used to achieve the reduction. 5
8 Scaling Scaling the image reduces the size of the image while attempting to keep all of the features of the floor plan. In effect, the image is shrunk. Scaling the image can be done in different ways. Different interpolation modes for scaling the image are listed below. These modes use different techniques to determine how to reduce groups of pixels into one which is representative of the group. Interpolation Modes D is the destination image and S is the source image. Here are simple explanations of some of the interpolation modes. Trying all of the modes will give a better understanding of what changes the image will incur. Remember, the higher-quality reduction, the slower the process. The lower the quality, the faster the reduction. Bicubic - D takes on a color value from a source matrix (S) based on a polynomial function. Bilinear - D takes on an average of colors from the nearest region of S (for example, a 2x2 matrix) High Quality Bicubic - D takes on a color value from a source matrix (S) based on a polynomial function. Higher quality Bicubic (will run slower) High Quality Bilinear - D takes on an average of colors from the nearest region of S (higher quality than simple Bilinear) Nearest Neighbor - D simply takes on the color value of the nearest pixel in the source. Cropping Cropping the image will clip off the part of an image not specified in the new dimensions of the image. ADD STATIC OBJECTS A number of static objects can be permanently added to the site. Inserting each type of object is explained in the following passages. Add an Access Point Existing Access Points may be added to the floor plan to simply show their location. First, decide whether you want to represent an a, b, or g access point. Choose the icon from the toolbar with the correct letter on it (A,B,G). Now click on the part of the floor plan where you would like to represent the access point. Insert Text 1. Click on the text insertion button on the toolbox. 2. Click on the location where you wish to insert the text. 3. Enter the text. 4. Press OK. Microwave/Directional Antenna/2.4 GHz Phone/Compass 6
9 Any of these objects may be placed on the floor plan. Simply click on the desired object. Then click on the floor plan where you wish the object to be placed. ADD CUSTOM IMAGES AS STATIC OBJECTS Any custom bitmap may be added to the floor plan. Click on the IMG icon on the top toolbar. Then choose an image file. Then click on the floor plan where you would like the image. ADD WALLS, WINDOWS, AND DOORS Additional walls, doors, and windows can be added to the floor plan. Walls Click on the wall icon on the top toolbar. Then click where you would like the wall to begin. Then click on where you want the wall to end. A new wall has now been added to the floor plan. Doors Click on the door on the top toolbar. Choose a single or double door using the appropriate icon. Then click on where you would like the doorway to begin. Then click on the other side of the new doorway. NOTE: The doors will swing differently based on start and stop clicks. If the finishing click on the doorway had been the starting click, the door would then swing in the opposite direction. Windows Similar to the procedure for doors and walls, click on the window icon on the top toolbar. Then click where you would like the window to begin. Then click on where you want the window to end. A new window has now been added to the floor plan. SAVE THE PROJECTION 1. Choose FILE/SAVE from the menu. 2. Enter a name for your projection file. 3. You now have a projection file for use with the Collector. STATUS BAR (Left) On the left of the screen are different statistics. They are the pixels / foot (meter) ratio. You can also adjust whether or not the measurement units are in feet or meters. MENUS There are 5 submenus located in the main menu at the top of the screen. 7
10 The FILE submenu lets you open or save site files. NEW creates a new site file. OPEN opens an existing site file. SAVE saves a site file under the previously saved filename. SAVE AS saves a site file under a new filename. The EDIT submenu has editing options. UNDO lets you undo up to 3 previous edits to the site. The OPTIONS submenu contains system options. SHOW GRID overlays a grid of lines on top of the site. The SCALE submenu contains scaling options (see Adjust the size of the floor plan ) Bicubic Bilinear High High Quality Bicubic High Quality Bilinear Low Nearest Neighbor The HELP submenu contains help options. ABOUT pulls up the about box. RULERS The rulers along the vertical and horizontal planes of the projection represent a scale of the projection. These are set using the ruler toolbox option. ZOOM MODES There are four different modes for zooming in and out of the floor plan. Zoom In Click on the magnifying glass with the + sign. Then create a zoom rectangle by clicking-and holding on an area of the floor plan. Then drag the mouse (while holding down the mouse button) to the next point. A dashed rectangle will appear. When the zoom rectangle is the appropriate size, release the mouse button. The floor plan will now be zoomed into that rectangle. Zoom Out Clicking on the magnifying glass with the - sign will reduce the image resolution by a factor of 2, thereby making the image zoom out. 8
11 II. Coyote Collector 1. INTRODUCTION: The Coyote Collector is a part of the BVS Indoor Forecaster and is used to collect Radio Frequency (RF) Data obtained during walk-studies of an in-building environment. An image file linear coded using the BVS Projector is imported in the Coyote Collector and the data collected is correlated to physical co-ordinates on the projected file. Data collected in this way is then analyzed using the Analyzer. This part of the Indoor Forecaster can run on any PC which can be mobile along with the receiver for the purpose of point-to-point data collection in an in-building environment. 2. DESCRIPTION OF TOOLBAR BUTTONS: When this button is clicked, the user can load a projection file. IMPORTANT: It is important to load the BVS Projection (file with extension BPF) file created using the BVS Projector before opening a Coyote Collector File (File with extension CPF). Clicking this button lets the user either Create a new Coyote Collection File OR open a previously created Coyote Collection File (File with extension CPF). This file is imported in the Analyzer portion of the Indoor Forecaster for Coverage Analysis. The process of collecting data for Coverage analysis is explained in detail later. Click this button to zoom into the current view. Click this button to fit the entire bitmap represented in the BVS Projection File within the Client area of the view. Click this button to zoom out to view a larger area of the bitmap represented by the BVS Projection File. Click this button to take a snapshot of the Client area of the window and save it as a Bitmap (BMP) or a JPEG image file. Click this button to show the Segment Data Dialog which displays information of the current segment data being collected. 9

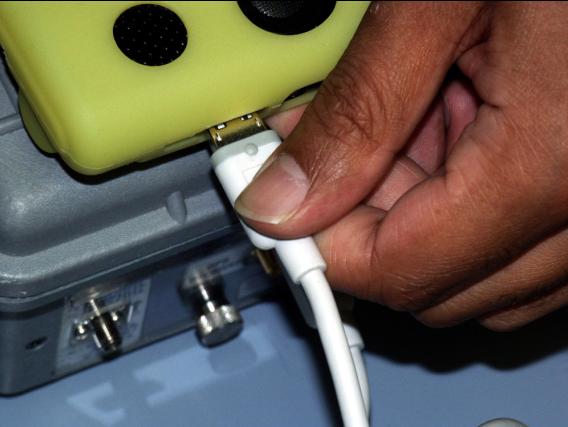
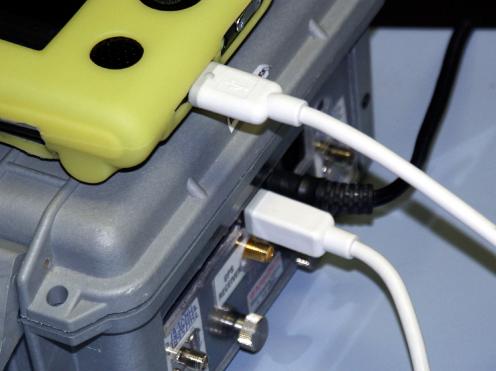
12 Click this button to display the Coyote Receiver information once connection has been established with the Coyote via the USB. Click this button to view, in pictorial format, the important instructions to be followed before and during data collection. 3. STEP-BY-STEP PROCEDURE FOR DATA COLLECTION: 3.1 Establishing a Connection with the receiver: Connect the appropriate connectors of the USB cable to the Samsung Q1 UMPC and the Coyote Receivers respectively as shown: 10
13 11


14 Before starting the software, verify that the USB cable is securely connected. Make sure that the battery of the Tablet PC and the Coyote Receiver is well charged. Turn on the Coyote Receiver by pressing the Power button on the front panel of the Receiver. Once all the connections seem ok, double click the Coyote Indoor Forecaster Collector Icon on the desktop. The following dialog will then pop up prompting a connection with the Coyote Receiver. Click Connect for the software to establish a connection with the receiver. Upon successful connection, the Coyote Receiver characteristics will be displayed as shown: 12
: 3.3 IMPORTANT NOTES ABOUT PROJECTION FILES: (1).")
15 3.2. Open the Coyote Projection File: Once the connection with the Coyote receiver has been established, the Coyote Projection and Collection Files would have to be loaded before the Data Collection can begin. Click to open the Coyote Projection File (Files with extension BPF): 3.3 IMPORTANT NOTES ABOUT PROJECTION FILES: (1). The Floor Plan in the Projection file MUST correspond to the area of Indoor Data Collection. (2). It is important that the Floor Plan reflect AS ACCURATELY AS POSSIBLE, the position of furniture, doors, windows, walls, machines, plants, pillars, stairs, curves and turns in structure. This will enable the user to accurately travel straight line distances and collect accurate data. 13

. This can be done by clicking on the main Toolbar.")
16 (3). It will be helpful to the user to study the Floor Plan and the actual area of walk study and Plan the Data Collection Path beforehand to avoid any mistakes during the actual process. 3.4 Opening the Collection Files: Once the Projection File has been loaded, the software prompts the user to open/save the Collection File (Files with extension CSD). This can be done by clicking on the main Toolbar. Previously collected Collection files can be opened as well as new ones can be created: 14

17 Once the collection and projection files have been loaded, dialog box containing VERY IMPORTANT INSTRUCTIONS to be followed before data collection will pop up: Please carefully read and understand these instructions before beginning any further data collection. 15
. Select the number of channels for which the walk study is to be performed.")
18 3.5 IMPORTANT INSTRUCTIONS TO BE FOLLOWED BEFORE BEGINNING THE DATA COLLECTION: Please follow these important steps otherwise the survey data will not be collected properly and the analyzer part of this software package will not be able to analyze the collected data: (1). Select the number of channels for which the walk study is to be performed. Only ONE receiver needs to be installed in the Coyote if only 1 channel is to be surveyed. BOTH the receivers need to be installed in the Coyote if TWO channels are to be surveyed. (2). This Survey can be performed for a MAXIMUM of two channels, ONE per receiver in the SINGLE CHANNEL MODE of the Coyote. (3). Using the keypad on the front panel of the Coyote, select the SINGLE CHANNEL MODE and then set the desired frequencies. (4). The FILTER RATE has to be set to 1/512 second and the SAMPLING RATE has to be set to a MINIMUM of 64 samples per second. Once the above instructions have been observed, select whether the walk study is intended for a single channel or for two channels and then click OK. Carefully open the lid on which the 16


19 Tablet PC is mounted and using the keys on the front panel of the Coyote receiver, begin Single Channel Measurement. 17
20 Close the lid once the measurements begin. The unit is now ready for indoor coverage prediction data collection. Close the Receiver Cover and put the locks in place so that the Lid does not accidentally open during the walk study. 3.6 IMPORTANT PRINCIPLES TO UNDERSTAND BEFORE BEGINNING THE DATA COLLECTION: (1). The software is designed to collect data segment-wise, meaning that the user has to walk in a straight line between two points to form a data segment. (2). On the floor plan loaded in the form of a linear coded projection file, the user selects the start point and the stop point of the segment he wishes to traverse. The Start and the stop points on the floor plan have to co-incide with the actual start and stop locations in the building. (3). Once the start and stop points have been set, the user has to walk from the START point to the STOP point in a STRAIGHT LINE and at CONSTANT SPEED. It is very important to strictly observe this point for greater accuracy of data analysis. 3.7 STEPS TO FOLLOW FOR USEFUL DATA COLLECTION: (1). Click New Segment button on the Segment Data Dialog, which pops up after you close the Pre-Data Collection Instructions Dialog. (2). Select Start Point on the Segment Data Dialog and tap the Start Point on the projection file, corresponding to the actual position of the user on the Projection File. (3). Select Stop Point on the Segment Data Dialog and do the same as 2. (4). Ensure that a straight line can be traversed between the Start and the Stop points selected before clicking the Start button. If it is not possible to traverse a straight line between the start and the stop points, change the stop point position on the projection to enable a straight line traversal. (5). Once it is ensured that a straight line between the Start and the Stop Point is traversable, click the BEGIN!!! button. Walk the distance between the START and the STOP Points in a STRAIGHT LINE and at a CONSTANT SPEED. 18

21 (6). Once the Stop Point is reached, click STOP. Data is no longer collected in the Collection file after this. Repeat Steps 1 to 6 for all other segments. Data collected in this way can be used in the Forecaster Analyzer for further analysis. 19
22 III. Forecaster Analyzer 1. INTRODUCTION Forecaster Analyzer is the analysis component of Forecaster software package for Coyote receivers. It provides analysis of coverage, reliability, channel reuse and more. 2. GETTING STARED WITH FORECASTER ANALYZER Table 1 gives the descriptions of the buttons in the Tool Bar to control the graph view. Table 3.1. Buttons In The Tool Bar Button Name Description Zoom In Tool After clicking this hot button, the cursor changes to a magnifying glass. Zoom Out Tool After clicking this hot button, the cursor changes to a zoom-out glass. Fit to Window Pressing this hot key fits the image to the current size of the graph window. Fit to Map Show the graph image with the whole map. Show Directions Show the GPS directions of the view. (Disabled for indoor survey study) Show Map Show/Hide the map Information Window Show information as mouse hovers Legend Window Show legend for the graph Move Base Station Move base stations on the map Ruler Measure distance KML report Create a KML report (GPS data only: Disabled for indoor survey study) HTML report Create a HTML report Forecaster Analyzer uses a linear projected map from the Projector and data files recorded with Coyote Collector. The Projector generates a Projection File (*bpf) that contains the map of the survey. The Coyote Collector produces a data file (*.csd) that contains the collected data. 2.1 Creating New Projects The Forecaster is project based. To begin using the Forecaster, a projection file is first generated (Please see the manual for the Projector). Click on the hotkey located in the toolbar near the top of the screen. The Projection File dialog box then appears. Open the projection file (map) you wish to use. 20


23 Then the data files must be loaded to create a project. The Forecaster Analyzer can process multiple data files. To create a new project, select New Project from the File menu or the Hotkey from the Toolbar. The data log file selection dialog then appears. In the data log file selection dialog press the Select button and browse for the *.csd files you wish to work with. More files can be selected by clicking on the Add button. If you wish to use two or more files that you have collected, the data in these files can be merged to process by checking the box before Merge Data. If a file is added in by mistake, check the box before the file and then press the Delete button. All selected files will be deleted. Click the OK button to load the data in the files. 21


24 Note that the Merge File" means merging the data in the files in the process. It does not mean that multiple files are merged into one file. 2.2 Saving A Forecaster Project At anytime after a project has been created it can be saved to a file. The current settings including state of controls and graph (map, bitmap and analysis) are saved in a project file and can be recalled later. To save a project select Save or Save as from the File menu or the hotkey from the Toolbar. If the project has previously been saved the Save option will overwrite the existing file while the Save as will allow a new file name to be selected. 22
.")
25 2.3 Opening An Existing Forecaster Project To open an existing Forecaster Project, select Open Existing Project from the File menu or the Hotkey from the Toolbar. A dialog box will appear to allow the selection of the project file (*.fws). The Forecaster Analyzer screen is displayed in two sections: The left pane of the display contains the Control Window used for Clustering Points, View Options, Channel Selection, and Reliability Analysis. The right pane contains the graph and the map from the Projector. 23
. The automatic clustering has been done when this interface is shown.")
26 3. Survey Data Analysis 3.1 Clustering Points After loading the data files, the interface for clustering points is shown. This is used to separate the data with same frequency, but they are received from different base stations (BS). The automatic clustering has been done when this interface is shown. To further separate the points manually, click the Hotkey, left click and hold on the graph to start the clustering. As the mouse is up, the points within the rectangular will be grouped. To merge two groups (channels) with the same frequency, check the boxes before them and then click Button. When a channel is selected (the box is checked), the parameters for the BS antenna are shown. Please type in the parameters if they are known. Press the information. button to input the After base station antenna's position is input, the BS marker will be shown on the graph. To move the BS marker, click, left click at the center of the BS icon, hold on the graph and move it to the correct location. Table 3.2 gives the descriptions of the buttons to cluster points. 24
27 Table 3.2. Buttons In Control Window For Clustering Points Button Name Description GPS Status Show GPS status by black circles. 3D fix: No black circles; 2D fix: small black circles; No fix: big black circles. (GPS only: disabled for indoor study) Show/Hide Show or Hide base stations on the map Base Stations Y/X or Lat/Lon Y/X: Use linear distance (feet or meter) in the axis Lat/Lon: Use Lat/Lon (decimal degree) in the axis (Only Y/X coordinates for indoor study) Vertical Grid Show vertical grid lines Lines Horizontal Show horizontal grid lines Grid Lines Input Input the parameters for base stations and antennas Parameters Merge Groups Merge multiple groups with the same frequency into one. Finish Clustering Process the data after clustering is done After the clustering is finished, click the processing. button to proceed to the next step of post 25
28 3.2 Measurement Data Analysis Table 3 shows the descriptions of the buttons used in the control window to analyze the data. Table 3.3. Button In View Options Of Control Window Buttons Name Description Walk/Drive Show/Hide Walk/Drive Path Path Path Width Change the Width of Walk/Drive Path GPS Status Show/Hide Base Stations Coordinates Selection Horizontal Grid Lines Vertical Grid Lines Number of Grid Lines Plot RSSI Along Path Plot Averaged RSSI Along Path Plot The Averaging Number Along Path Plot Reliability Along Path Plot Variation Along Path Show GPS status by black circles. 3D fix: No black circles; 2D fix: small black circles; No fix: big black circles. (GPS only: disabled for indoor study) Show/Hide Base Stations on the Map Y/X: Use the linear distance in the axis Lat/Lon: Use Lat/Lon (decimal degree) in the axis (Only Y/X coordinates for indoor study) Show/Hide grid lines in X direction Show/Hide grid lines in Y direction Change the number of lines in the grid Plot the measured RSSI along the survey path. Plot the averaged RSSI along the survey path. Plot the number of RSSI for 40-lambda averaging along the survey path. Plot the reliability of averaged RSSI along survey path Plot the Variation of Averaged RSSI Along Survey Path 26

29 3.2.1 Plot RSSI Along Survey Path To plot the raw RSSI along the survey path, click on the button and then select the channel. A colorful drive path is shown below. The range in the map is from -30 dbm to 120 dbm. To change the range of RSSI, please move the sliders above Plot the Averaged RSSI Along Survey Path To plot the averaged RSSI along the survey path, click on the button and then select the channel. A colorful drive path is shown. If none of the channels is selected, a dialog will pop up to ask for selecting channels. The range of RSSI can also be changed by moving the sliders above Plot the Number of Points For Averaging Along Survey Path The number of the points, which are used for averaging, can also be plotted along the walk/drive path. Click on the button under Channel Selection and Analysis. A dialog will be popped up to take the range for the numbers. 27

30 3.2.4 Plot the Reliability of Averaged RSSI Along Survey Path To plot the reliability of averaged RSSI along the walk/drive path, click on the button under "Channel Selection and Analysis". A dialog will be popped up to take the range for the reliability. The default value of RSSI variation to calculate the reliability is 1dB. For example, if the reliability is 90%, it means that the possibility that the averaged RSSI is within ± 1dB of the real mean value is 90%. The accuracy of the averaged RSSI to the real mean value increases with the reliability. Assuming the number of points is N, the reliability is p, the standard variation is!, the equation to calculate the reliability is 1 This figure showing the reliability of averaged data is show below. 1 Please refer to the book The Mobile Radio Propagation Channel, David Parsons, John Wiley & Sons, New York,

31 3.2.5 Plot the Variation of Averaged RSSI Along Survey Path To plot the averaged RSSI along the walk/drive path, click on the button under "Channel Selection and Analysis". A dialog will be popped up to take the range for the variation. The default value of the reliability to calculate the reliability is 90%. The accuracy of the averaged RSSI to the real one decreases with an increasing standard variation. Assuming the number of points is N, the reliability is p, the standard variation is!, the equation to calculate! is 5.57erf " ( p) = N 3.3 Coverage Analysis and Prediction Plot Contours The detailed coverage analysis and prediction with contours can be shown by pressing the button. A dialog will be shown to ask for the minimum and maximum values for contours.! 1 / 2 ( p) Either the signal strength or the number of channels (N) in the coverage area can be shown by clicking the (signal strength) or the (number of channels) button Draw Controls The range of the power (or number of channels) is shown in the following range control diagram. Move the sliders on the range control by clicking and holding the sliders to the desired value and the contours for the two values will be displayed in the graph window. 29
32 3.4 Reliability Analysis Reliability Analysis shows the radius, boundary reliability, cell reliability and power threshold of the channel(s). The user can input numbers via the keyboard and calculate the coverage reliability in the control panel. Channel(s) selected for Reliability Analysis is done with the channel selection list. After selecting the channel(s) use the buttons in the control pane to calculate reliability analysis. To do single channel analysis select "Single Analysis" and the last selected channel is analyzed. Click on the Reliability Analysis button and input Power Threshold and Radius. Click and the boundary reliability for this channel is shown under "Bn. Reliability" and the cell reliability is also calculated and shown. The coverage of the last selected channel with the radius is shown as a circle on the graph window. The reliability represents the probability that the received signal's strength is larger than the threshold value. The boundary reliability stands for the probability of the signal received at the boundary of the cell to be greater than the threshold, the cell reliability stands for the probability of the signal received within the cell to be greater than the threshold. On the other hand if power threshold and probability (boundary reliability) are known click and the radius and cell reliability will be shown. If "Group Analysis" is selected then all the selected channels will be analyzed with the same input data. An example is shown below where the transmission power is 1W and the antenna height is 2 meter. Note: If the Reliability Analysis is open then the software is set to this mode. To see the coverage of the selected channel(s) click the Reliability Analysis again to pull up the interface and close this mode. 30

33 Enter Power Threshold Enter one of the two variables Then click on one of these arrows to calculate Boundary Reliability 31


34 4. SOME FUCNTIONS IN THE ANALYZER 4.1 Metric Selection Measurement information can be displayed in feet or meter. The default setting is feet. To select the metric use the Hotkey located on the top toolbar. Left click on the hotkey and the metric selection dialog box appears. 4.2 Information Window The following figure shows the analysis of measurement data by using the information window. Click on the hotkey and then move the mouse to the point to be analyzed. Stay at the point for a second and the information window will be shown. The information window in this figure shows that the averaged value at this point is 80 db, which is averaged by 48 samples. The real mean value has 79% possibility within -80±1 db. 32
35 4.3 Channel Selection Select the channels or group of channels you wish to work with in the control window under Channel Selection. The Channel Selection tool contains a list of all channel(s) that are present in the log files. Checking the box next to the frequency includes the channel(s) in the analysis. As the channel is selected, its coverage graph will be shown in the graph window. 4.4 Color Selection The color indicator between the frequency and the check box has two functions: One is to select the color used to graph signal strength from that channel(s). To change the color for a selected channel(s) right click on the color indicator. A color selection dialog box will appear. The other is to select how channels are grouped for analysis. After checking the channel, the RF coverage of that channel will be shown if it is not in the Reliability Analysis mode. If it is in the Reliability mode the area with certain reliability is shown. Reliability Analysis is explained in the next section. There are two conditions the user can choose from as shown in the following table: Example Grouping Description Example Grouping Description Individual Each selected channel is graphed in its own color indicated by the color of the star. Group Selection The best coverage for all channels is shown using the group color. 4.5 Range Control This feature allows users to control how the signal strength is represented using a graph. The two sliders set the minimum and maximum values for the graphing range. Use these sliders to control minimum and maximum settings. 4.6 Resolution Control Resolution Control along X direction Resolution Control along Y direction Use the R button to set the default resolution Use these sliders to change the values 33


36 The resolution control shows the size of the points calculated. Setting the control for low resolution will reduce the calculation time and decrease the resolution. The button resets the control to a reasonable default setting. 4.7 Measuring Distances Distance measurements can be made on a graph by using the ruler tool. To measure distances use the hotkey. Left click and hold on the graph to start the measurement. By releasing the button the distance is displayed by a distance dialog box. 4.8 Saving Coverage Graph The current coverage graph can be saved as a bitmap. Select Save Graph Image... from the File menu. 4.9 Change Base Station Icons Right click on the base station, a dialog to select base station image is shown. Click on the desired image, press OK Button. 34


37 4.10 Printing The standard Windows printing selections Print, Print Preview and Print Setup are available from the File menu Table View To view the data point in tabular form select Table Window from the Window menu. An example of a table view follows on the next page. 35

38 where Freq: Frequency. X(ft): The coordinates of the point along X in the map in feet. Y(ft): The coordinates of the point along Y in the map in feet. Sr: First stage filtered data. Sa: 10 lambda averaged data. N: The number of points for 10-lambda averaging. Time: Record time. Date: Survey date. To save the table in a form that can be used by spreadsheet applications and other programs, select Save Table as from the File menu. The output is 40-lambda averaged data. Please check Appendix A for the data processing algorithms. 36


39 The save table options dialog then appears. The output is an ASCII file that can be customized for easier conversion to a specific program. 37

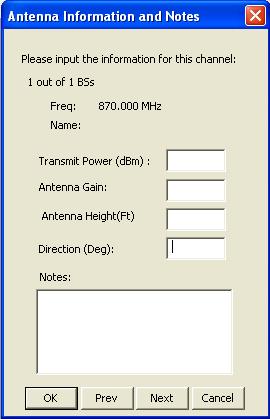
40 5. CREATING REPORTS 5.1 HTML Report HyperText Markup Language (HTML) files can be opened by Internet Explorer and can contain formatted text and graphics. Forecaster Analyzer can create a HTML report that has the information about the data survey files, the selected channels, the coverage of signal power and the number of channels per location. To use this feature select Hotkey. Select a file name to store the file when the dialog box appears. A dialog box for HTML report options will be shown. If no Plot Contour is implemented, the button Show Coverage and Show BS Overlap will be disabled. If Show Selected Files is checked a message box will appear asking if the selected files are to be displayed in the report. If No is clicked, all the files will be displayed in the report. Then a dialog appears to take the notes for the selected file. Enter the notes for the different files by clicking the Prev or Next buttons. After entering the notes for all the files then click OK. All notes will be stored and displayed in the report. 38


41 If Show BS s Information is checked in the dialog for HTML report options, a message box will appear asking if only selected base stations are shown in the report. If No is selected then all of the base stations will be displayed in the report. Then a dialog box appears to take the parameters and notes for the selected base stations or channels. The parameters input at the interface for clustering points are shown here. Modify the parameters and notes for individual BSs by clicking the Prev or Next buttons. After entering the notes for all BSs click OK. All notes will be stored and displayed in the report. 39
42 40
43 Appendix I: Indoor Site Survey Study I. Rayleigh Fading and Terrain Based Fading There are two types of fading that are relevant to performing coverage measurements, fast fading, also know as Rayleigh fading, and terrain based fading due to obstructions and propagation loss. The goal of coverage measurement is to measure the local signal strength in presence of terrain based fading. Rayleigh fading is due to close in reflections. It produces drops in signal strength that are only a fraction of a wavelength in size (often on the scale of inches). These fades always exist and are only of interest in the sense that coverage measurements must be made in a manner that rejects Rayleigh fading, so that accurate measurements of terrain-based fading can be made. II. Reject Rayleigh Fading It is important to realize that Rayleigh fading is a spatial phenomenon not a time one. The averaging is intended to be done over a certain distance, which can be optimal in rejecting Rayleigh fading and keeping terrain information. In an outdoor environment, the location information during a drive study can be achieved through GPS, which updates every second. Therefore, sufficient measurements can be collected quickly and easily for outdoor measurement. There is no positioning system for most indoor environments, such as hospital, shopping malls, office building, and so on. It increases the difficulty to collect sufficient data to reject the Rayleigh fading. There are three collection methods [1], 1) Manual collection. In this method, one measurement of the signal power with its location is recorded. However, the signal power can vary from a few db to 20 db in several inches due to Rayleigh fading. Therefore, this method provides the inaccurate measurement data since it cannot effectively reject Rayleigh fading. Furthermore, it needs a large amount of measurement not to distort terrain based fading. 2) Spinning antenna method. At a fixed measurement location, the antenna moves along a circle orbit and the collected data is averaged and saved. This method can remove the Rayleigh fading in the measurement. However, similar to the first method, it also needs a large amount of data to keep terrain based fading. Furthermore, the possibility of averaging correlated data reduces the accuracy of the measurement. 3) Linear averaging method. In this method a test engineer walks along a straight line and the measurement tool records the signal strength during the walk. In post processing, the software will select the independent points and then average them to get the local mean power. This is the most efficient method and it provides the most accurate measurement. For example, people can walk 100 feet in 1 minute. Assuming the carrier frequency is 2.5GHz. So the wavelength will be 0.4 feet. If the first or second method is used, the test engineer needs to measure 250 times for each wavelength or 25 times every 10 wavelength. It obviously takes much more time than the linear averaging method. 41
44 This linear averaging method is used in Indoor Forecaster software and the data is collected in this way, a. The test engineer taps the start point and end point on the map, b. The test engineer presses the button to start the measurement and then walk straight with a constant speed toward the end point, c. The test engineer presses the button to end the collection when he arrives at the end point. III. Data Processing Algorithms The position of each sample is interpolated from the start and stop point. This is done assuming a constant velocity during the walk. The interpolation equation is ( P! P ) i 1 0 P0, i = + P0, Where P 0 and P1 are the start and stop positions and N i = 0,1... N (1) There will be two stages in processing the data, which are shown in Figure A1. The first stage is to filter out the correlated/redundant data. To eliminate the bias in estimating the local mean power, the spatially independent data have to be used for averaging. The spacing used in the software is 0.38", which is the minimum independent distance for Rayleigh fading. The filtered data will be shown in the Forecaster Analyzer as the raw data. The second stage is to average the data. Due to the complexity of indoor environments, a window length 10" is used in averaging to remove Rayleigh fading and to keep terrain based fading. Therefore, there will be about 10"/0.38" = 26 independent samples for averaging. The averaging with 26 samples indicates that the measured local mean power has 90% possibility to be within ±1.8 db of the real value [2]. Table A1 shows the reliability of averaging 26 independent samples. Figure A2 shows the table report of the data, where N represents the number of samples used for averaging within 10 lambda. Collector Analyzer Raw Samples Independence filtering Filtered Samples 10" Averaging Averaged Samples = Averaged Data Stage #1 Stage #2 Figure A1: 10 Lambda averaging process Table A1. Measurement reliability with respect to the number of independent samples N Reliability (%) ±! db

45 Figure A3 demonstrates the first-stage filtering procedure. For 0.38" independent spacing, sample at P 0, 2 will be selected and the one at P 0, 1 will be deleted. The next selected one will be at P 0, 4. Thus there will be totally 26 samples selected for averaging (P 0, i, i =0, 2, 50) and 25 samples will be filtered out (P 0, i, i =1, 3, 49) in 10 Lambda from P 0 to P 1. However, if the spacing between each adjacent samples is 0.25", there will be totally 21 samples (P 0, i, i =0, 2, 40) selected for averaging. Figure A2. Table report of indoor site survey data. 0.38" x 0.20" s 1 s 2 P 0 P 0, 1 P 0, 2 P 1 Figure A3. First stage filtering demonstration. III. Indoor Forecaster Site Survey Software Indoor Forecaster software will provide the analysis for averaged data, coverage validation, prediction, and reliability. Indoor Forecaster software provides two stages of analysis. The first stage is the analysis of averaged data. The software will filter out the redundant data and average the samples using 10" window to keep the terrain based fading. The software can show the signal strength of independent data and averaged data on the map. The software can also shows the reliability analysis based on the number of independent samples for averaging. The reliability of the averaged data is related to the number of samples for averaging [2]. Secondly, the Forecaster software can provide the analysis for coverage validation, prediction, and reliability. Based on the measured signal strength and locations, the cell radius with a certain outage probability or the cell reliability with a certain radius can be estimated through a robust method [3]. Figure A4 shows the averaged signal strength along walk path. The place with yellow color has signal strength from 48 dbm to -39 dbm. It indicates that the high data rate can be achieved at this 43
![location. Fig. A5 shows the RF coverage for survey area, where the signal range is from 75 dbm to 30 dbm. References: [1]. R. A. Valenzuela, O. La](/docs-images/86/94618721/images/46-0.jpg "ndron, and D. L. Jacobs, Estimating Local Mean Signal Strength of Indoor Multipath Propagation, IEEE Trans. On Vehicular Technology, vol. 46, no. 1, Feb. 1997.")
46 location. Fig. A5 shows the RF coverage for survey area, where the signal range is from 75 dbm to 30 dbm. References: [1]. R. A. Valenzuela, O. Landron, and D. L. Jacobs, Estimating Local Mean Signal Strength of Indoor Multipath Propagation, IEEE Trans. On Vehicular Technology, vol. 46, no. 1, Feb [2] David Parsons, The Mobile Radio Propagation Channel, John Wiley &Sons, New York, [3] P. Bernardin and K. Manoj, The postprocessing resolution required for accurate RF coverage validation and prediction, IEEE Transactions on Vehicular Technology, vol. 49, no. 5, Sep. 2000, pp Figure A4. The averaged data along walk path. 44

47 Figure A5. RF coverage for an indoor floor plan. 45
KRAMER ELECTRONICS LTD. USER MANUAL
 KRAMER ELECTRONICS LTD. USER MANUAL MODEL: Projection Curved Screen Blend Guide How to blend projection images on a curved screen using the Warp Generator version K-1.4 Introduction The guide describes
7. Image transmission functions
 This unit comes with a function for transmitting still images from the host computer to the unit via LAN and a function for importing still images from the unit into the host computer. The image transmission
WiPry 5x User Manual. 2.4 & 5 GHz Wireless Troubleshooting Dual Band Spectrum Analyzer
 WiPry 5x User Manual 2.4 & 5 GHz Wireless Troubleshooting Dual Band Spectrum Analyzer 1 Table of Contents Section 1 Getting Started 1.10 Quickstart Guide 1.20 Compatibility Section 2 How WiPry Works 2.10
E X P E R I M E N T 1
 E X P E R I M E N T 1 Getting to Know Data Studio Produced by the Physics Staff at Collin College Copyright Collin College Physics Department. All Rights Reserved. University Physics, Exp 1: Getting to
Yellow Frog. Manual Version 1.1
 Yellow Frog Manual Version 1.1 1 YellowFrog Contents PC Requirements...... 2 YellowFrog Power Meter Measurement.... 3 YellowFrog PC Software..... 3 Main Screen....... 4 Input Overload....... 5 Battery
D-901 PC SOFTWARE Version 3
 INSTRUCTION MANUAL D-901 PC SOFTWARE Version 3 Please follow the instructions in this manual to obtain the optimum results from this unit. We also recommend that you keep this manual handy for future reference.
WiPry 5x User Manual. 2.4 & 5 GHz Wireless Troubleshooting Dual Band Spectrum Analyzer
 WiPry 5x User Manual 2.4 & 5 GHz Wireless Troubleshooting Dual Band Spectrum Analyzer 1 Table of Contents Section 1 Getting Started 1.10 Quickstart Guide 1.20 Compatibility 2.10 Basics 2.11 Screen Layout
TL-2900 AMMONIA & NITRATE ANALYZER DUAL CHANNEL
 TL-2900 AMMONIA & NITRATE ANALYZER DUAL CHANNEL DATA ACQUISITION SYSTEM V.15.4 INSTRUCTION MANUAL Timberline Instruments, LLC 1880 S. Flatiron Ct., Unit I Boulder, Colorado 80301 Ph: (303) 440-8779 Fx:
Linkage 3.6. User s Guide
 Linkage 3.6 User s Guide David Rector Friday, December 01, 2017 Table of Contents Table of Contents... 2 Release Notes (Recently New and Changed Stuff)... 3 Installation... 3 Running the Linkage Program...
R&S BCDRIVE R&S ETC-K930 Broadcast Drive Test Manual
 R&S BCDRIVE R&S ETC-K930 Broadcast Drive Test Manual 2115.1347.02 05 Broadcast and Media Manual The Manual describes the following R&S Broadcast Drive Test software. 2115.1360.02 2115.1360.03 2116.5146.02
Import and quantification of a micro titer plate image
 BioNumerics Tutorial: Import and quantification of a micro titer plate image 1 Aims BioNumerics can import character type data from TIFF images. This happens by quantification of the color intensity and/or
MultiSpec Tutorial: Visualizing Growing Degree Day (GDD) Images. In this tutorial, the MultiSpec image processing software will be used to:
 Images. In this tutorial, the MultiSpec image processing software will be used to:") MultiSpec Tutorial: Background: This tutorial illustrates how MultiSpec can me used for handling and analysis of general geospatial images. The image data used in this example is not multispectral data
MultiSpec Tutorial: Background: This tutorial illustrates how MultiSpec can me used for handling and analysis of general geospatial images. The image data used in this example is not multispectral data
Dragon. manual version 1.6
 Dragon manual version 1.6 Contents DRAGON TOP PANEL... 2 DRAGON STARTUP... 2 DRAGON STARTUP SCREEN... 2 DRAGON INFO SCREEN... 3 DRAGON MAIN SCREEN... 3 TURNING ON A TRANSMITTER... 4 CHANGING MAIN SCREEN
Pilot. Quick Start Guide
 Pilot Quick Start Guide For further assistance, please visit www.thehovercam.com/support to download the manual or email us at support@thehovercam.com. 1-------------HDMI 7-----------Lightning slot 2-------------21.5"
The BAT WAVE ANALYZER project
 The BAT WAVE ANALYZER project Conditions of Use The Bat Wave Analyzer program is free for personal use and can be redistributed provided it is not changed in any way, and no fee is requested. The Bat Wave
BumbleBee-TABLET. UMPC Spectrum Analyzer manual version 1.5
 BumbleBee-TABLET UMPC Spectrum Analyzer manual version 1.5 BumbleBee-TABLET Interface Hardware user s manual BumbleBee-TABLET/BumbleBee-TABLET Interface Hardware Unpacking Your BumbleBee-TABLET... 2 About
Background. About automation subtracks
 16 Background Cubase provides very comprehensive automation features. Virtually every mixer and effect parameter can be automated. There are two main methods you can use to automate parameter settings:
PYROPTIX TM IMAGE PROCESSING SOFTWARE
 Innovative Technologies for Maximum Efficiency PYROPTIX TM IMAGE PROCESSING SOFTWARE V1.0 SOFTWARE GUIDE 2017 Enertechnix Inc. PyrOptix Image Processing Software v1.0 Section Index 1. Software Overview...
USB Mini Spectrum Analyzer User s Guide TSA5G35
 USB Mini Spectrum Analyzer User s Guide TSA5G35 Triarchy Technologies, Corp. Page 1 of 21 USB Mini Spectrum Analyzer User s Guide Copyright Notice Copyright 2011 Triarchy Technologies, Corp. All rights
GS122-2L. About the speakers:
 Dan Leighton DL Consulting Andrea Bell GS122-2L A growing number of utilities are adapting Autodesk Utility Design (AUD) as their primary design tool for electrical utilities. You will learn the basics
WiPry User Manual. 2.4 GHz Wireless Troubleshooting
 WiPry User Manual 2.4 GHz Wireless Troubleshooting 1 Table of Contents Section 1 Getting Started 1.10 Quickstart Guide 1.20 Compatibility Section 2 How WiPry Works 2.10 Basics 2.11 Screen Layout 2.12 Color
Camtasia for Mac. Create Your First Video Guide. Release 1.1. February TechSmith Corporation. All rights reserved.
 Camtasia for Mac Create Your First Video Guide Release 1.1 February 2009 2009 TechSmith Corporation. All rights reserved. Contents Contents Planning your video... 1 Should I record my entire screen or
Audacity Tips and Tricks for Podcasters
 Audacity Tips and Tricks for Podcasters Common Challenges in Podcast Recording Pops and Clicks Sometimes audio recordings contain pops or clicks caused by a too hard p, t, or k sound, by just a little
System Requirements SA0314 Spectrum analyzer:
 System Requirements SA0314 Spectrum analyzer: System requirements Windows XP, 7, Vista or 8: 1 GHz or faster 32-bit or 64-bit processor 1 GB RAM 10 MB hard disk space \ 1. Getting Started Insert DVD into
SiS 2.0 User guide. Rev. 2.2
 SiS 2.0 User guide Rev. 2.2 COPYRIGHT INFORMATION The information in this user s guide and in the PC programme attached is subject to royalties, being these rights represented by FTE Maximal firm (hereafter
A few quick notes about the use of Spectran V2
 A few quick notes about the use of Spectran V2 The full fledged help file of Spectran is not ready yet, but many have asked for some sort of help. This document tries to explain in a quick-and-dirty way
Table of content. Table of content Introduction Concepts Hardware setup...4
 Table of content Table of content... 1 Introduction... 2 1. Concepts...3 2. Hardware setup...4 2.1. ArtNet, Nodes and Switches...4 2.2. e:cue butlers...5 2.3. Computer...5 3. Installation...6 4. LED Mapper
USB Mini Spectrum Analyzer User Manual PC program TSA For TSA5G35 TSA4G1 TSA6G1 TSA12G5
 USB Mini Spectrum Analyzer User Manual PC program TSA For TSA5G35 TSA4G1 TSA6G1 TSA12G5 Triarchy Technologies, Corp. Page 1 of 17 USB Mini Spectrum Analyzer User Manual Copyright Notice Copyright 2013
USB Mini Spectrum Analyzer User Manual TSA Program for PC TSA4G1 TSA6G1 TSA8G1
 USB Mini Spectrum Analyzer User Manual TSA Program for PC TSA4G1 TSA6G1 TSA8G1 Triarchy Technologies Corp. Page 1 of 17 USB Mini Spectrum Analyzer User Manual Copyright Notice Copyright 2013 Triarchy Technologies,
SpectraPlotterMap 12 User Guide
 SpectraPlotterMap 12 User Guide 108.01.1609.UG Sep 14, 2016 SpectraPlotterMap version 12, included in Radial Suite Release 8, displays two and three dimensional plots of power spectra generated by the
TF5 / TF3 / TF1 DIGITAL MIXING CONSOLE. TF StageMix User's Guide
 TF5 / TF3 / TF1 DIGITAL MIXING CONSOLE EN Note The software and this document are the exclusive copyrights of Yamaha Corporation. Copying or modifying the software or reproduction of this document, by
Effective Test Procedures for Installing and Maintaining RF Transmitter Sites
 Product: Hand Held Spectrum Analyzer R&S FSH3 Effective Test Procedures for Installing and Maintaining RF Transmitter Sites This application note describes an effective method for generating test setups,
Getting Started. Connect green audio output of SpikerBox/SpikerShield using green cable to your headphones input on iphone/ipad.
 Getting Started First thing you should do is to connect your iphone or ipad to SpikerBox with a green smartphone cable. Green cable comes with designators on each end of the cable ( Smartphone and SpikerBox
The only warranties for HP products and services are set forth in the express warranty statements accompanying such products and services.
 The only warranties for HP products and services are set forth in the express warranty statements accompanying such products and services. Nothing herein should be construed as constituting an additional
Multiband Noise Reduction Component for PurePath Studio Portable Audio Devices
 Multiband Noise Reduction Component for PurePath Studio Portable Audio Devices Audio Converters ABSTRACT This application note describes the features, operating procedures and control capabilities of a
Procedures to Characterize Maury s Automatic Tuner Using ATS Software Version 5.1 or above
 Procedures to Characterize Maury s Automatic Tuner Using ATS Software Version 5.1 or above Things to check before tuner characterization Make sure tuner is power up and USB cable is connected to the computer
PulseCounter Neutron & Gamma Spectrometry Software Manual
 PulseCounter Neutron & Gamma Spectrometry Software Manual MAXIMUS ENERGY CORPORATION Written by Dr. Max I. Fomitchev-Zamilov Web: maximus.energy TABLE OF CONTENTS 0. GENERAL INFORMATION 1. DEFAULT SCREEN
JD725A Cable and Antenna Analyzer - Dual Port
 COMMUNICATIONS TEST & MEASUREMENT SOLUTIONS JD725A Cable and Antenna Analyzer - Dual Port Key Features Portable and lightweight handheld instrument Built-in wireless frequency bands as well as the most
PicoScope 6 Training Manual
 PicoScope 6 Training Manual DO226 PicoScope 6 Training Manual r2.docx Copyright 2014 Pico Technology CONTENTS 1 Quick guide to PicoScope 6... 1 1.1 The PicoScope way... 1 1.2 Signal view... 2 1.3 Timebase...
Table of Contents. Chapter 1 Introduction System Requirements Chapter 2 Introducing the AVerTV Application... 3
 Table of Contents Chapter 1 Introduction... 1 System Requirements... 2 Chapter 2 Introducing the AVerTV Application... 3 Launching the AVerTV DVB-T USB2.0 Application... 3 Running AVerTV DVB-T USB2.0 application
Manual Version Ver 1.0
 The BG-3 & The BG-7 Multiple Test Pattern Generator with Field Programmable ID Option Manual Version Ver 1.0 BURST ELECTRONICS INC CORRALES, NM 87048 USA (505) 898-1455 VOICE (505) 890-8926 Tech Support
Quick Start manual for Nova
 Quick Start manual for Nova 1. Overview The Nova PlugIn for the Pyramix rendering interface allows easy modification of audio data in the frequency domain. These modifications include interpolation of
RF Explorer RackPRO. User Manual. Introduction. Greetings fellow traveler on the RF spectrum.
 RF Explorer RackPRO User Manual Introduction Greetings fellow traveler on the RF spectrum. The RF Explorer RackPRO (referred to in this document in shorthand as RackPRO ) has been designed to be intuitive
READ THIS FIRST. Morphologi G3. Quick Start Guide. MAN0412 Issue1.1
 READ THIS FIRST Morphologi G3 Quick Start Guide MAN0412 Issue1.1 Malvern Instruments Ltd. 2008 Malvern Instruments makes every effort to ensure that this document is correct. However, due to Malvern Instruments
Transmitter Interface Program
 Transmitter Interface Program Operational Manual Version 3.0.4 1 Overview The transmitter interface software allows you to adjust configuration settings of your Max solid state transmitters. The following
XDFilt 1r0 July 23, XDFilt 1r0. Instructions. Copyright 2007, Steven A. Harlow 1
 XDFilt 1r0 Instructions Copyright 2007, Steven A. Harlow 1 Table of Contents 1 INTRODUCTION...3 2 INSTALLATION...3 3 CUT TO THE DEMO...3 3.1 MAIN DEMO...3 3.2 GRAPHICAL FILTER DEMO...6 4 OPERATING CONTROLS
Tektronix RSA306 USB Spectrum Analyzer
 Tektronix RSA306 USB Spectrum Analyzer Simple Demos The Demo of the RSA306 is easy. Even you do not have signal generators, devices under test, or demo boards, using the whip antenna provided in box, you
Quick Guide Book of Sending and receiving card
 Quick Guide Book of Sending and receiving card ----take K10 card for example 1 Hardware connection diagram Here take one module (32x16 pixels), 1 piece of K10 card, HUB75 for example, please refer to the
PCIe: EYE DIAGRAM ANALYSIS IN HYPERLYNX
 PCIe: EYE DIAGRAM ANALYSIS IN HYPERLYNX w w w. m e n t o r. c o m PCIe: Eye Diagram Analysis in HyperLynx PCI Express Tutorial This PCI Express tutorial will walk you through time-domain eye diagram analysis
EDL8 Race Dash Manual Engine Management Systems
 Engine Management Systems EDL8 Race Dash Manual Engine Management Systems Page 1 EDL8 Race Dash Page 2 EMS Computers Pty Ltd Unit 9 / 171 Power St Glendenning NSW, 2761 Australia Phone.: +612 9675 1414
SEM- EDS Instruction Manual
 SEM- EDS Instruction Manual Double-click on the Spirit icon ( ) on the desktop to start the software program. I. X-ray Functions Access the basic X-ray acquisition, display and analysis functions through
Configuring the Stack ST8961 VS Module when used in conjunction with a Stack ST81xx series display.
 Configuring the Stack ST8961 VS Module when used in conjunction with a Stack ST81xx series display. Your Stack ST8961 VS module allows you to synchronize, overlay, and record data available on your Stack
Please feel free to download the Demo application software from analogarts.com to help you follow this seminar.
 Hello, welcome to Analog Arts spectrum analyzer tutorial. Please feel free to download the Demo application software from analogarts.com to help you follow this seminar. For this presentation, we use a
Table of Contents. 2 Select camera-lens configuration Select camera and lens type Listbox: Select source image... 8
 Table of Contents 1 Starting the program 3 1.1 Installation of the program.......................... 3 1.2 Starting the program.............................. 3 1.3 Control button: Load source image......................
Simple and highly effective technology to communicate your brand s distinctive character
 . . . Advantages 4 Simple and highly effective technology to communicate your brand s distinctive character COST EFFECTIVE No need to print graphics, you can change your message every day! No media player
USER S MANUAL REV 1.0 FORM# 7677
 DTU-236 RFProbe & RFXpert 8-VSB, QAM A/B/C, and NTSC Analysis and Monitoring Hardware / Software Package USER S MANUAL REV 1.0 FORM# 7677 Support and Service Information: For support and service information
Getting started with
 Getting started with Electricity consumption monitoring single phase for homes and some smaller light commercial premises OVERVIEW: The OWL Intuition-e electricity monitoring system comprises of three
QCTool. PetRos EiKon Incorporated
 2006 QCTool : Windows 98 Windows NT, Windows 2000 or Windows XP (Home or Professional) : Windows 95 (Terms)... 1 (Importing Data)... 2 (ASCII Columnar Format)... 2... 3... 3 XYZ (Binary XYZ Format)...
Version Users Manual
 Version 1.0.12 Users Manual Table of Contents Overview... 3 Installation... 3 Minimum Requirements... 3 Licensing the Software... 3 Demo Mode... 4 Software Reference... 4 Invisible Waves X Main Window...
PS User Guide Series Seismic-Data Display
 PS User Guide Series 2015 Seismic-Data Display Prepared By Choon B. Park, Ph.D. January 2015 Table of Contents Page 1. File 2 2. Data 2 2.1 Resample 3 3. Edit 4 3.1 Export Data 4 3.2 Cut/Append Records
Connection for filtered air
 BeamWatch Non-contact, Focus Spot Size and Position monitor for high power YAG, Diode and Fiber lasers Instantly measure focus spot size Dynamically measure focal plane location during start-up From 1kW
PicoScope 6 PC Oscilloscope Software
 PicoScope 6 PC Oscilloscope Software User's Guide -5 Table of Contents I Table of Contents 1 Welcome...1 2 Version 6.0...2 update 3 Introduction...3...4 1 Legal statement...5 2 Contact information...5
Experiment: Real Forces acting on a Falling Body
 Phy 201: Fundamentals of Physics I Lab 1 Experiment: Real Forces acting on a Falling Body Objectives: o Observe and record the motion of a falling body o Use video analysis to analyze the motion of a falling
Software manual. ChipScan-Scanner 3.0
 Software manual ChipScan-Scanner 3.0 Copyright c Langer EMV-Technik GmbH 2016 Version 1.10 Notice No part of this manual may be reproduced in any form or by any means (including electronic storage and
Source/Receiver (SR) Setup
 Setup") PS User Guide Series 2015 Source/Receiver (SR) Setup For 1-D and 2-D Vs Profiling Prepared By Choon B. Park, Ph.D. January 2015 Table of Contents Page 1. Overview 2 2. Source/Receiver (SR) Setup Main Menu
PS User Guide Series 2015 Source/Receiver (SR) Setup For 1-D and 2-D Vs Profiling Prepared By Choon B. Park, Ph.D. January 2015 Table of Contents Page 1. Overview 2 2. Source/Receiver (SR) Setup Main Menu
HD-SDI Express User Training. J.Egri 4/09 1
 HD-SDI Express User Training J.Egri 4/09 1 Features SDI interface Supports 720p, 1080i and 1080p formats. Supports SMPTE 292M serial interface operating at 1.485 Gbps. Supports SMPTE 274M and 296M framing.
How to Optimize Ad-Detective
 How to Optimize Ad-Detective Ad-Detective technology is based upon black level detection. There are several important criteria to consider: 1. Does the video have black frames to detect? Are there any
Getting started with Spike Recorder on PC/Mac/Linux
 Getting started with Spike Recorder on PC/Mac/Linux You can connect your SpikerBox to your computer using either the blue laptop cable, or the green smartphone cable. How do I connect SpikerBox to computer
Wireless Studio. User s Guide Version 5.1x Before using this software, please read this manual thoroughly and retain it for future reference.
 4-743-161-12 (1) Wireless Studio User s Guide Version 5.1x Before using this software, please read this manual thoroughly and retain it for future reference. DWR-R01D/R02D/R02DN/R03D 2018 Sony Corporation
Fluke 190-Series II Firmware Upgrade V11.44
 Fluke 190-Series II Firmware Upgrade V11.44 Requirements 1. Fluke 190- Series II ScopeMeter with firmware prior to V11.44 2. Supported models are: 190-102, 190-104, 190-062, 190-202, 190-204, 190-502,
Motion Amplification
 Motion Amplification User s Manual Version 2.0 Revised 06/9/2017 RDI Technologies 10325 Technology Dr Knoxville, TN 37932 www.rdi-technologies.com All Rights Reserved Contents 1 Using the camera... 4 1.1
Interface Practices Subcommittee SCTE STANDARD SCTE Measurement Procedure for Noise Power Ratio
 Interface Practices Subcommittee SCTE STANDARD SCTE 119 2018 Measurement Procedure for Noise Power Ratio NOTICE The Society of Cable Telecommunications Engineers (SCTE) / International Society of Broadband
Quick Reference Manual
 Quick Reference Manual V1.0 1 Contents 1.0 PRODUCT INTRODUCTION...3 2.0 SYSTEM REQUIREMENTS...5 3.0 INSTALLING PDF-D FLEXRAY PROTOCOL ANALYSIS SOFTWARE...5 4.0 CONNECTING TO AN OSCILLOSCOPE...6 5.0 CONFIGURE
WAVES H-EQ HYBRID EQUALIZER USER GUIDE
 WAVES H-EQ HYBRID EQUALIZER USER GUIDE TABLE OF CONTENTS CHAPTER 1 INTRODUCTION...3 1.1 WELCOME...3 1.2 PRODUCT OVERVIEW...3 1.3 CONCEPTS AND TERMINOLOGY...4 1.4 COMPONENTS...7 CHAPTER 2 QUICK START GUIDE...8
SR-D8-M, SR-D8-S. (Ver ) SOFTWARE INSTRUCTIONS
 SOFTWARE INSTRUCTIONS") SOFTWARE INSTRUCTIONS active l ine array speak er SYStems SR-D8-M, SR-D8-S (Ver. 1.1.1) Thank you for purchasing TOA's Active Line Array Speaker Systems. Please carefully follow the instructions in this
SOFTWARE INSTRUCTIONS active l ine array speak er SYStems SR-D8-M, SR-D8-S (Ver. 1.1.1) Thank you for purchasing TOA's Active Line Array Speaker Systems. Please carefully follow the instructions in this
SNR Playback Viewer SNR Version 1.9.7
 User Manual SNR Playback Viewer SNR Version 1.9.7 Modular Network Video Recorder Note: To ensure proper operation, please read this manual thoroughly before using the product and retain the information
Precautions and Disclaimers What You Can Do with Geometry Manager Pro Check Your Computer System requirements...
 Operating Instructions Geometric & Setup Management Software Windows Geometry Manager Pro Ver. 4.0 Thank you for purchasing this Panasonic product. Before using this software, please read the instructions
This application note is a simple step-by-step guide that introduces a practical method to perform reliable small cell planning.
 Application Note Samuel Tretter 1.2017 1MA297_0e Reliable small cell planning using LTE test transmitter Application Note Products: R&S SGT100A R&S TSME R&S ROMES4 Reliable small cell planning is essential
VideoMate U3 Digital Terrestrial USB 2.0 TV Box Start Up Guide
 VideoMate U3 Digital Terrestrial USB 2.0 TV Box Start Up Guide Compro Technology, Inc. www.comprousa.com Copyright 2001-2005. Compro Technology, Inc. No part of this document may be copied or reproduced
DVR-431 USB Wireless Receiver User Manual
 DVR-431 USB Wireless Receiver User Manual Thank you for using our wireless USB receiver, please read the following content carefully before using, it will help you make better use of this product. Introduction
Processing data with Mestrelab Mnova
 Processing data with Mestrelab Mnova This exercise has three parts: a 1D 1 H spectrum to baseline correct, integrate, peak-pick, and plot; a 2D spectrum to plot with a 1 H spectrum as a projection; and
Interactive Satellite Terminal Installation / Validation Manual
 Installation / Validation Manual Version October 5, 2016 Index INTERACTIVE SATELLITE TERMINAL 1. FCC COMPLIANCE... 3 2. TECHNICAL FEATURES...4 3. GENERAL DESCRIPTION...5 4. ELEMENTS CONTAINED IN THE TERMINAL...6
HyperMedia User Manual
 HyperMedia User Manual Contents V3.5 Chapter 1 : HyperMedia Software Functions... 3 1.1 HyperMedia Introduction... 3 1.2 Main Panel... 3 1.2.2 Information Window... 4 1.2.3 Keypad... 4 1.2.4 Channel Index...
Precision DeEsser Users Guide
 Precision DeEsser Users Guide Metric Halo $Revision: 1670 $ Publication date $Date: 2012-05-01 13:50:00-0400 (Tue, 01 May 2012) $ Copyright 2012 Metric Halo. MH Production Bundle, ChannelStrip 3, Character,
WAVES Cobalt Saphira. User Guide
 WAVES Cobalt Saphira TABLE OF CONTENTS Chapter 1 Introduction... 3 1.1 Welcome... 3 1.2 Product Overview... 3 1.3 Components... 5 Chapter 2 Quick Start Guide... 6 Chapter 3 Interface and Controls... 7
NOTICE: This document is for use only at UNSW. No copies can be made of this document without the permission of the authors.
 Brüel & Kjær Pulse Primer University of New South Wales School of Mechanical and Manufacturing Engineering September 2005 Prepared by Michael Skeen and Geoff Lucas NOTICE: This document is for use only
User s Guide W-E
 Presto! PVR ISDB User s Guide 518100-02-01-W-E-112307-02 Copyright 2007, NewSoft Technology Corp. All Rights Reserved. No portion of this document may be copied or reproduced in any manner without prior
Boonton 4540 Remote Operation Modes
 Application Note Boonton 4540 Remote Operation Modes Mazumder Alam Product Marketing Manager, Boonton Electronics Abstract Boonton 4540 series power meters are among the leading edge instruments for most
INSTALATION PROCEDURE
 INSTALLATION PROCEDURE Overview The most difficult part of an installation is in knowing where to start and the most important part is starting in the proper start. There are a few very important items
G406 application note for projector
 G406 application note for projector Do you have trouble in using projector internal warp and edge blending function? Inconvenient in multiple signal source connection System resolution is not enough after
1 Ver.mob Brief guide
 1 Ver.mob 14.02.2017 Brief guide 2 Contents Introduction... 3 Main features... 3 Hardware and software requirements... 3 The installation of the program... 3 Description of the main Windows of the program...
TVW750USBD ATSC Tuner Quick install manual
 Getting Started TVW750USBD ATSC Tuner Quick install manual The Diamond TVW750USBD ATSC Tuner is fully compatible for your Windows desktop PC or laptop. Important Notice: All channels are subject to coverage
Analyze Frequency Response (Bode Plots) with R&S Oscilloscopes Application Note
 with R&S Oscilloscopes Application Note") Analyze Frequency Response (Bode Plots) with R&S Oscilloscopes Application Note Products: R&S RTO2002 R&S RTO2004 R&S RTO2012 R&S RTO2014 R&S RTO2022 R&S RTO2024 R&S RTO2044 R&S RTO2064 This application
Analyze Frequency Response (Bode Plots) with R&S Oscilloscopes Application Note Products: R&S RTO2002 R&S RTO2004 R&S RTO2012 R&S RTO2014 R&S RTO2022 R&S RTO2024 R&S RTO2044 R&S RTO2064 This application
TV Character Generator
 TV Character Generator TV CHARACTER GENERATOR There are many ways to show the results of a microcontroller process in a visual manner, ranging from very simple and cheap, such as lighting an LED, to much
De-embedding Gigaprobes Using Time Domain Gating with the LeCroy SPARQ
 De-embedding Gigaprobes Using Time Domain Gating with the LeCroy SPARQ Dr. Alan Blankman, Product Manager Summary Differential S-parameters can be measured using the Gigaprobe DVT30-1mm differential TDR
Setting Up the Warp System File: Warp Theater Set-up.doc 25 MAY 04
 Setting Up the Warp System File: Warp Theater Set-up.doc 25 MAY 04 Initial Assumptions: Theater geometry has been calculated and the screens have been marked with fiducial points that represent the limits
TransitHound Cellphone Detector User Manual Version 1.3
 TransitHound Cellphone Detector User Manual Version 1.3 RF3 RF2 Table of Contents Introduction...3 PC Requirements...3 Unit Description...3 Electrical Interfaces...4 Interface Cable...5 USB to Serial Interface
CI-218 / CI-303 / CI430
 CI-218 / CI-303 / CI430 Network Camera User Manual English AREC Inc. All Rights Reserved 2017. l www.arec.com All information contained in this document is Proprietary Table of Contents 1. Overview 1.1
Manual of Operation for WaveNode Model WN-2m. Revision 1.0
 Manual of Operation for WaveNode Model WN-2m. Revision 1.0 TABLE OF CONTENTS 1. Description of Operation 2. Features 3. Installation and Checkout 4. Graphical Menus 5. Information for Software Expansion
Part 1: Introduction to Computer Graphics
 Part 1: Introduction to Computer Graphics 1. Define computer graphics? The branch of science and technology concerned with methods and techniques for converting data to or from visual presentation using